Embed Size (px)
Citation preview
Royal Norwegian Council___ _ K RS'A Rfor Scientific and Industrial Research(NTAD-A268 619
IA 1 Hi I 6I I H I iK I!9
NORSAR Scientific Report No. 1-92/93
Semiannual Technical Summary
1 April - 30 September 1992
Kjeller, November 1992 D T ICELECTE
AUG2•5 1993 J
4Original contains color"plates: All DTIC reproduCt'9ions will be In black and,,3,9874
APPROVED FOR PUBLIC RELEASE, DISTRIBUI IUN UNLIMITED
.2,
... ... .. .. 0...

jIju4~Ijl NOTICg
THIS DOCUMENT IS BEST
QUALITY AVAILABLE. THE COPY
FURNISHED TO DTIC CONTAINED
A SIGNIFICANT NUMBER OF
PAGES WHICH DO NOT
REPRODUCE LEGIBLY.

NORSAR Scientific Report No. 1-92/93
Semiannual Technical Summary
1 April - 30 September 1992
Kjeller, November 1992
Accezioa For
NTIS CRAbiDTIC, TABU annotunced [
JJstdiation ... ........... ..... .. . .
B y _....... ..... _............ . . .Di~t ibition I
Availability Codes
Avail and/orDist Special
-

UNCLASSIFIEDSECURITY CLASSIFICATION OF THIS PAGE
REPORT DOCUMENTATION PAGE
Ia. REPORT SECURITY CLASSIFICATION lb RESTRICTIVE MARKINGS
UNCLASSIFIED NOT APPLICABLE2a. SECURITY CLASSIFICATION AUTHORITY 3. DISTRIBUTION I AVAILABILITY OF REPORT
, NOT APPLICABLE APPROVED FOR PUBLIC RELEASE.2b. DECLASSIFICATION / DOWNGRADING SCHEDULE APPROVEDIOR UBLICIREL
DISTRIBUTION UNLIMITEDNOT APPLICABLE
4. PERFORMING ORGANIZATION REPORT NUMBER(S) 5. MONITORING ORGANIZATION REPORT NUMBER(S)
Scientific Report 1-92/93 Scientific Report 1-92/93
6a. NAME OF PERFORMING ORGANIZATION 6b. OFFICE SYMBOL 7a. NAME OF MONITORING ORGANIZATION
NTNF/NORSAR j (f appicable) HQ/AFTAC/TTS
6.. ADDRESS (City, State, and ZIP Code) 7b. ADDRESS (City, State, and ZIP Code)
Post Box 51 Patrick AFB, FL 32925-6001N-2007 Kjeller, Norway
8a. NAME OF FUNDING LPONSORIANdG 1 8b. OFFICE SYMBOL 9. PROCUREMENT INSTRUMENT IDENTIFICATION NUMBERORGANIZATION ueenseflvance (If applicable)
Research Projects Agency NMROSc. ADDRESS (City, State, and ZIP Code) 10. SOURCE OF FUNDING NUMBEPS
PROGRAM PROJECT I TASK WORK UNIT3701 N. Fairfax Dr. #717 ELEMENT NO NO NORSAR NO SOW IACCESSION NO
Arlington, VA 22203-1714 R&D Phase 3 Task 5.0 feq.no. 003A2
11. TITLE (Include Security Classification)
SEMIANNUAL TECHNICAL SUMMARY, 1 APRIL - 30 SEPTEMBER 1992 (UNCLASSIFIED)
12. PERSONAL AUTHOR(S)
* 13. TPE O R ORT13b. TIME JCOEj14 DATE OF RFjPPRT (Ya~Month, Day) S. fH NScientific Summary I FROM 1 AprTo 30 Sep
16. SUPPLEMENTARY NOTATION
NOT APPLICABLE
17. COSATI CODES f 18. SUBJECT TERMS (Continue on reverse if necessary and identify by block number)FIELD GROUP SUB-GROUP8 NORSAR, Norwegian Seismic Array
19. ABSTRACT (Continue on reverse if necessary and identify by block number)
This Semiannual Technical Summary describes the operation, maintenance and researchactivities at the Norwegian Seismic Array (NORSAR), the Norwegian Regional SeismicArray (NORESS) and the Arctic Regional Seismic Array (ARCESS) for the period1 April - 30 September 1992. Statistics are also presented for additional seismic stations,which through cooperative agreements with institutions in the host countries provide con-tinuous data to the NORSAR Data Processing Center (NPDC). These stations comprisethe Finnish Experimental Seismic Array (FINESA), the German Experimental SeismicArray (GERESS), and two 3-component stations in Poland: Ksiaz and Stary Folwark.
(cont.)
20. DISTRIBUTION IAVAILABILITY OF ABSTRACT 21. ABSTRACT SECURITY CLASSIFICATION[-3UNCLASSIFIED/UNIUMITED [I SAME AS RPT. O- DTIC USERSI (4 u•r/
22a. NAME OF RESPONSIBLE INDIVIDUAL 22b. TELEPHONEmLu A. ) 22c. OFFICE SYMBOLMr. Michael C. Baker (7)4 -b AFTAQTTS
DD FORM 1473. s4 MAR 83 APR edition may be used until exhausted. SECURITY CLASSIFICATION OF THIS PAGEAll other editions are obsolete. UNCLASSIFIED

NORSAR Sci. Rep. 1-92,93 November 1992
Abstract (cont.)
This Semiannual Report also presents statistics from operation of the Intelligent Monitor-ing System (IMS). The IMS has been operated in an experimental mode, and the perfor-mance has been very satisfactory. Since October 1991, a new version of the IMS thataccepts data from an arbitrary number of arrays and single 3-component stations has beenoperated.
The NORSAR Detection Processing system has been operated throughout the period withan average uptime of 96.7% as compared to 99.6% for the previous reporting period. Atotal of 2056 seismic events have been reported in the NORSAR monthly seismic bulletin.The performance of the continuous alarm system and the automatic bulletin transfer bytelex to AFTAC has been satisfactory. The system for direct retrieval of NORSAR wave-form data through an X.25 connection has been tested successfully for acquiring such databy AFTAC. Processing of requests for full NORSAR and regional array data on magnetictapcs has progressed according to establishea schedules. There have been no modifica-tions made to the NORSAR data acquisition system.
On-line detection processing and data recording at the NORSAR Data Processing Center(NDPC) of NORESS, ARCESS, FINESA and GERESS data have been conductedthroughout the period. Data from the two stations in Poland have been recorded and pro-cessed in an experimental mode. As of the end of the reporting period (30 Sep 1992) dataacquisition from these two stations was terminated, in accordance with the terms of thecontract. Monthly processing statistics for the arrays as well as results of the IMS analysisfor the reporting period are given.
Maintenance activities in the period comprise preventive/corrective maintenance in con-nection with all the NORSAR subarrays, NORESS and ARCESS. In addition, the mainte-nance center has been involved with occasional maintenance of equipment for FINESAand work in connection with the two stations in Poland. Other activities have involvedtesting of the NORSAR communications systems, and establishment of experimentalsmall-aperture arrays at sites in Spitsbergen and the Kola Peninsula (see Section 7.1).
Starting 1 October 1991, an effort has begun to carry out a complete technical refurbish-ment of the NORSAR array. This project is funded jointly by AFTAC, DARPA andNTNF. During the reporting period, efforts have focused upon evaluation and laboratorytesting of technical options for field instrumentation, in particular state-of-the-art A/Dconverters, data acquisition and synchronization devices. During the next few months, weplan to test several such systems under realistic operating conditions in the field. Initialtesting of some systems has already started. When these studies have been completed, arecommendation for a system to be installed will be presented to the funding agencies.
Summaries of seven scientific contributions are presented in Chapter 7 of this report.
Section 7.1 gives a technical description of the most recent extensions of the NorthernEurope Regional Array Network. Two new small-aperture arrays have been established;one near Apatity, Russia, and one on the Arctic island of Spitsbergen. The Apatity arraywas installed in September 1992 as part of an agreement on scientific cooperation between

NORSAR Sci. Rep. 1-92M3 November 1992
NORSAR and the Kola Science Centre of the Russian Academy of Sciences. This 9-ele-ment array comprises a center site and two concentric rings, and has an aperture ofapproximately 1 kmn. All sites are equipped with a short-period vertical seismometer oftype Geotech S-500, and the site at the center of the array has in addition two horizontalseismometers of the same type. Data are transmitted to Apatity by radio link. A dedicatedfull duplex 64 Kbps satellite link, based on Norwegian Telecom's NORSAT B system, hasbeen installed between NORSAR and the Kola Regional Seismology Centre in Apatity. Acomputer-to-computer Ethernet link connects the two data centers.
During late October/early November 1992 a small-aperture array very similar to the Apat-ity array was installed on the island of Spitsbergen, east of Longyearbyen. Data from thisarray are transmitted by radio and terrestrial link to Norwegian Telecom's satellite hub sta-tion at Isfjord Radio, from where a dedicated simplex 64 Kbps satellite link is used fortransmission of the continuous data to Norway. The Spitsbergen array deployment is sup-ported financially by Norwegian oil companies, and the integration of this array into theIMS (Intelligent Monitoring System) is sponsored by DARPA.
Section 7.2 presents initial processing results from the Apatity array. The noise level isfound to be similar to that of ARCESS at frequencies below 2 Hz, and slightly higher thanARCESS at higher frequencies. This is consistent with the expectations. Diurnal noisevariation at Apatity is similar to that seen at NORESS. The Apatity array appears to pro-vide excellent noise suppression (ýN_ or better) at frequencies above 2.5 Hz. Initial eventprocessing shows that frequency-wavenumber processing gives well-defined peaks in theF-K diagram both for P and S type phases. A particularly noteworthy feature is the excel-lent stability in azimuth determination of local events using the low-frequency Rg phases.It is emphasized that these results are preliminary and that more definite conclusions mustawait analysis of more extensive data sets.
Section 7.3 discusses the use of regionalized wave propagation characteristics in auto-matic global phase association. This is basically an attempt to establish a strategy forretrieving and organizing regionally dependent propagation parameters that are useful forgeneralized beamforming of global network data. Examples from the GSETI-2 data baseare used to illustrate features such as the dist-nce-dependent occurrence of seismic phases,the reliability of phase labels reported by NDCs and the accuracy of one-station eventlocations.
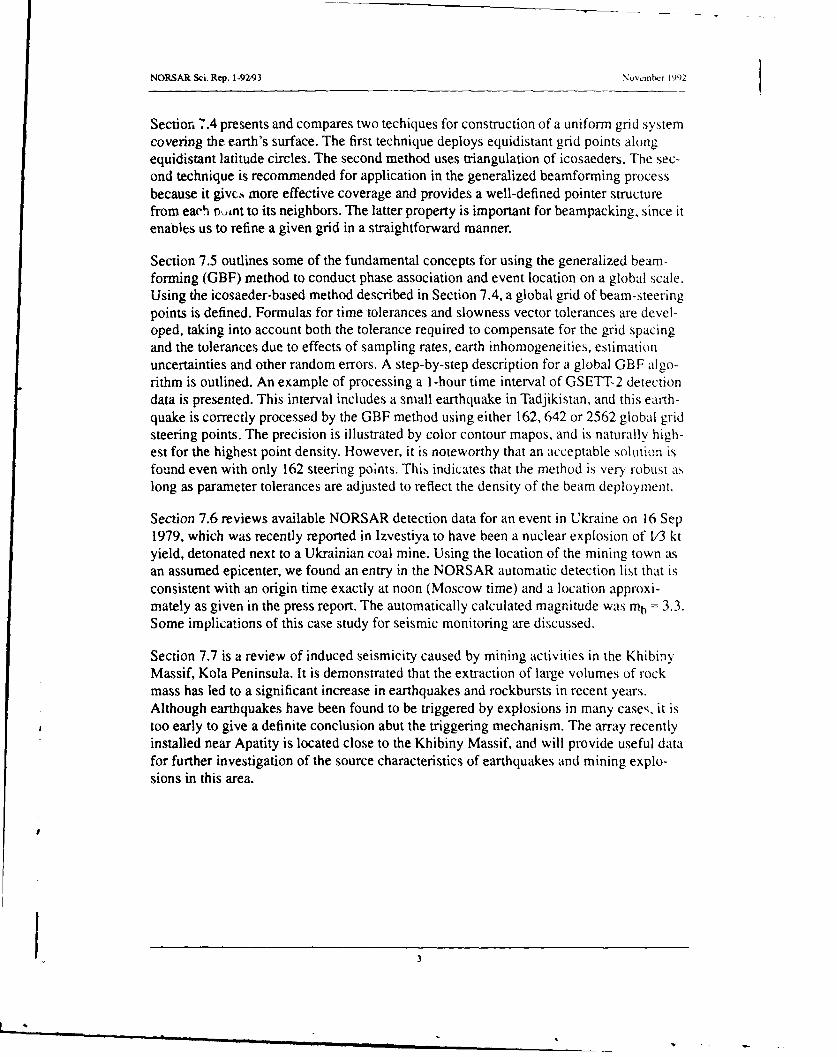
Section 7.4 presents and compares two techiques for construction of a uniform grid systemcovering the earth's surface. The first technique deploys equidistant grid points alongequidistant latitude circles. The second method uses triangulation of icosaeders. The sec-ond technique is recommended for application in the generalized beamforming processbecause it gives more effective coverage and provides a well-defined pointer structurefrom each point to its neighbors. The latter property is important for beampacking, since itenables us to refine a given grid in a straightforward manner.
Section 7.5 outlines some of the fundamental concepts for using the generalized beam-forming (GBF) method to conduct phase association and event location on a global scale.Using the icosaeder-based method described in Section 7.4, a global grid of beam-steering
S~iii

NORSAR Sci. Rep. 1-92,93 November 1992
points is defined. Formulas for time tolerances and slowness vector tolerances are devel-oped, taking into account both the tolerance required to compensate for the grid spacingand the tolerances due to effects of sampling rates, earth inhomogeneities, estimationuncertainties and other random errors. A step-by-step description for a global GBF algo-rithm is outlined. An example of processing a 1-hour time interval of GSETT-2 detectiondata is presented. This interval includes a small earthquake in Tadjikistan, and this earth-quake is correctly processed by the GBF method using either 162, 642 or 2562 global gridsteering points. 'fhe location precision is illustrated by color contour maps, and is natu-rally highest for the highest point density. However, it is noteworthy that an acceptablesolution is found even with only 162 steering points. This indicates that the method is veryrobust as long as parameter tolerances are adjusted to reflect the density of the beamdeployment.
Section 7.6 reviews available NORSAR detection data for an event in Ukraine on 16 Sep1979, which was recently reported in Izvestiya to have been a nuclear explosion of 1/3 ktyield, detonated next to a Ukrainian coal mine. Using the location of the mining town asan assumed epicenter, we found an entry in the NORSAR automatic detection list that isconsistent with an origin time exactly at noon (Moscow time) and a location approxi-mately as given in the press report. The automatically calculated magnitude was mb = 3.3.Some implications of this case study for seismic monitoring are discussed.
Section 7.7 is a review of induced seismicity caused by mining activities in the KhibinyMassif, Kola Peninsula. It is demonstrated that the extraction of large volumes of rockmass has led to a significant increase in earthquakes and rockbursts in recent years.Although earthquakes have been found to be triggered by explosions in many cases, it istoo early to give a definite conclusion abut the triggering mechanism. The array recentlyinstalled near Apatity is located close to the Khibiny Massif, and will provide useful datafor further investigation of the source characteristics of earthquakes and mining explo-sions in this area.
iv
I . --..---.----

NORSAR Sci. Rep. 1-92/93 November 1992
AFTAC Project Authorization T/9141/B/PKP
ARPA Order No. : 4138 AMD # 16
Program Code No. . OFIO
Name of Contractor . Royal Norwegian Council for Scientific andIndustrial Research (NTNF)
Effective Date of Contract 1 Oct 1988
Contract Expiration Date 30 Sep 1993
Project Manager : Frode Ringdal (06) 81 71 21
Title of Work ' The Norwegian Seismic Array(NORSAR) Phase 3
Amount of Contract . $ 9,954,194
Contract Period Covered by Report 1 April - 30 September 1992
The views and conclusions contained in this document are those of the authors and shouldnot be interpreted as necessarily representing the official policies, either expressed orimplied, of the Defense Advanced Research Projects Agency, the Air Force TechnicalApplications Center or the U.S. Government.
This research was supported by the Advanced Research Projects Agency of the Depart-ment of Defense and was monitored by AFTAC, Patrick AFB, FL32925, under contractno. F08606-89-C-0005.
NORSAR Contribution No. 478
IV

NORSAR Sci. Rep. 1-92/93 November 1992
Table of Contents
1. Summary 1
2. NORSAR Operation 4
2.1 Detection processor (DP) operation 4
2.2 Array communications 9
2.3 NORSAR event detection operation 14
3. Operation of Regional Arrays 19
3.1 Recording of NORESS data at NDPC, Kjeller 19
3.2 Recording of ARCESS data at NDPC, Kjeller 23
3.3 Recording of FINESA data at NDPC, Kjeller 26
3.4 Event detection operation 30
3.5 IMS operation 48
3.6 GBF operation 49
4. Improvements and Modifications 50
4.1 NORSAR 50
4.2 Regional Arrays 51
5. Maintenance Activities 52
5.1 Activities in the field and at the Maintenance Center 52
5.2 Array status 56
6. Documentation Developed 57
7. Summmary of Technical Reports / Papers Published 58
7.1 Extensions of the Northern Europe Regional Array Network -- 58
New small-aperture arrays at Apatity, Russia, and on the Arctic
island of Spitsbergen7.2 Initial processing results from the Apatity small-aperture array 72
7.3 On the use of regionalized wave propagation characteristics in 86
automatic global phase association
7.4 Two techniques for constructing a uniform grid system covering 97
the earth's surface7.5 Initial results from global Generalized Beamforming 103
7.6 The Ukrainian event of 16 September 1979 120
7.7 Induced seismicity in the Khibiny Massif (Kola Peninsula) 125
Vi

NORSAR Sci. Rep. 1-9293 ýovember 1992
1 Summary
This Semiannual Technical Summary describes the operation, maintenance and researchactivities at the Norwegian Seismic Array (NORSAR), the Norwegian Regional SeismicArray (NORESS) and the Arctic Regional Seismic Array (ARCESS) for the period1 April - 30 September 1992. Statistics are also presented for additional seismic stations,which through cooperative agreements with institutions in the host countries provide con-tinuous data to the NORSAR Data Processing Center (NPDC). These stations comprisethe Finnish Experimental Seismic Array (FINESA), the German Experimental SeismicArray (GERESS), and two 3-component stations in Poland: Ksiaz and Stary Folwark.
This Semiannual Report also presents statistics from operation of the Intelligent Monitor-ing System (IMS). The IMS has been operated in an experimental mode, and the perfor-mance has been very satisfactory. Since October 1991, a new version of the IMS thataccepts data from an arbitrary number of arrays and single 3-component stations has beenoperated.
The NORSAR Detection Processing system has been operated throughout the period withan average uptime of 96.7% as compared to 99.6% for the previous reporting period. Atotal of 2056 seismic events have been reported in the NORSAR monthly seismic bulletin.The performance of the continuous alarm system and the automatic bulletin transfer bytelex to AFTAC has been satisfactory. The system for direct retrieval of NORSAR wave-form data through an X.25 connection has been tested successfully for acquiring such databy AFTAC. Processing of requests for full NORSAR and regional array data on magnetictapes has piogressed according to established schedules. There have been no modifica-tions made to the NORSAR data acquisition system.
On-line detection processing and data recording at the NORSAR Data Processing Center(NDPC) of NORESS, ARCESS, FINESA and GERESS data have been-conductedthroughout the period. Data from the two stations in Poland have been recorded and pro-cessed in an experimental mode. As of the end of the reporting period (30 Sep 1992) dataacouisition from these two stations was terminated, in accordance with the terms of thecontract. Monthly processing statistics for the arrays as well as results of the IMS analysisfor the reporting period are given.
Maintenance activities in the period comprise preventive/corrective maintenance in con-nection with all the NORSAR subarrays, NORESS and ARCESS. In addition, the mainte-nance center has been involved with occasional maintenance of equipiilent for FINESAand work in connection with the two stations in Poland. Other activities have involvedtesting of the NORSAR communications systems, and establishment of experimentalsmall-aperture arrays at sites in Spitsbergen and the Kola Peninsula (see Section 7.1).
Starting 1 October 1991, an effort has begun to carry out a complete technical refurbish-ment of the NORSAR array. This project is funded jointly by AFTAC, DARPA andNTNF. During the reporting period, efforts have focused upon evaluation and laboratorytesting of technical options for field instrumentation, in particular state-of-the-art A/Dconverters, data acquisition and synchronization devices. During the next few months, we

NORSAR Sci. Rep. 1-9293 Novewib-r 1992
plan to test several such systems under realistic operating conditions in the field. Initialtesting of some systems has already started. When these studies have been completed, arecommendation for a system to be installed will be presented to the funding agencies.
Summaries of seven scientific contributions are presented in Chapter 7 of this report.
Section 7.1 gives a technical description of the most recent extensions of the NorthernEurope Regional Array Network. Two new small-aperture arrays have been established;one near Apatity, Russia, and one on the Arctic island of Spitsbergen. The Apatity arraywas installed in September 1992 as part of an agreement on scientific cooperation betweenNORSAR and the Kola Science Centre of the Russian Academy of Sciences. This 9-ele-ment array comprises a center site and two concentric rings, and has an aperture ofapproximately 1 km. All sites are equipped with a short-period vertical seismornmeter oftype Geotech S-500, and the site at the center of the array has in addition two horizontalscismometers of the same type. Data are transmitted to Apatity by radio link. A dedicatedfull duplex 64 Kbps satellite link, based on Norwegian Telecom's NORSAT B system, hasbeen installed between NORSAR and the Kola Regional Seismology Centre in Apatity. Acomputer-to-computer Ethernet link connects the two data centers.
During late October/early November 1992 a small-aperture array very similar to the Apat-ity array was installed on the island of Spitsbergen, east of Longyearbyen. Data from thisarray are transmitted by radio and terrestrial link to Norwegian Telecom's satellite hub sta-tion at Isfjord Radio, from where a dedicated simplex 64 Kbps satellite link is used fortransmission of the continuous data to Norway. The Spitsbergen array deployment is sup-ported financially by Norwegian oil companies, and the integration of this array into theIMS (Intelligent Monitoring System) is sponsored by DARPA.
Section 7.2 presents initial processing results from the Apatity array. The noise level isfound to be similar to that of ARCESS at frequencies below 2 Hz, and slightly higher thanARCESS at higher frequencies. This is consistent with the expectations. Diurnal noisevariation at Apatity is similar to that seen at NORESS. The Apatity m.ay appears to pro-vide excellent noise suppression (JN_ or better) at frequencies above 2.5 Hz. Initial eventprocessing shows that frequency-wavenumber processing gives well-defined peaks in theF-K diagram both for P and S type phases. A particularly noteworthy feature is the excel-lent stability in azimuth determination of local events using the low-frequency Rg phases.It is emphasized that these results are preliminary and that more definite conclusions mustawait analysis of more extensive data sets.
Section 7.3 discusses the use of regionalized wave propagation characteristics in auto-matic global phase association. This is basically an attempt to establish a strategy forretrieving and organizing regionally dependent propagation parameters that are useful forgeneralized beamforming of global network data. Examples from the GSETT-2 data baseare used to illustrate features such as the distance-dependent occurrence of seismic phases,the reliability of phase labels reported by NDCs and the accuracy of one-station eventlocations.
2
NORSAR Sci. Rep. 1-9293 Nuvrntvr 1992
Section 7.4 presents and compares two techiques for construction of a uniform grid systemcovering the earth's surface. The first technique deploys equidistant grid points alongequidistant latitude circles. The second method uses triangulation of icosaeders. The sec-ond technique is recommended for application in the generalized beamforming processbecause it givcs more effective coverage and provides a well-defined pointer structurefrom each P.,int to its neighbors. The latter property is important for beampacking, since itenables us to refine a given grid in a straightforward manner.
Section 7.5 outlines some of the fundamental concepts for using the generalized beam-forming (GBF) method to conduct phase association and event location on a global scale.Using the icosaeder-based method described in Section 7.4, a global grid of beam-steeringpoints is defined. Formulas for time 'tolerances and slowness vector tolerances are devel-oped, taking into account both the tolerance required to compensate for the grid spacingand the tolerances due to effects of sampling rates, earth inhomogeneities, estimationuncertainties and other random errors. A step-by-step description for a global GBF algo-rithm is outlined. An example of processing a 1-hour time interval of GSETT-2 detectiondata is presented. This interval includes a small earthquake in Tadjikistan, and this earth-quake is correctly processed by the GBF method using either 162, 642 or 2562 global gridsteering points. The precision is illustrated by color contour mapos, and is naturally high-est for the highest point density. However, it is noteworthy that an acceptable solution isfound even with only 162 steering points. Thih indicates that the method is very robust aslong as parameter tolerances are adjusted to reflect the density of the beam deployment.
Section 7.6 reviews available NORSAR detection data for an event in Ukraine on 16 Sep1979, which was recently reported in Izvestiya to have been a nuclear explosion of 1/1 ktyield, detonated next to a Ukrainian coal mine. Using the location of the mining town asan assumed epicenter, we found an entry in the NORSAR automatic detection list that isconsistent with an origin time exactly at noon (Moscow time) and a location approxi-mately as given in the press report. The automatically calculated magnitude was mb = 3.3.Some implications of this case study for seismic monitoring are discussed.
Section 7.7 is a review of induced seismicity caused by mining activities in the KhibinyMassif, Kola Peninsula. It is demonstrated that the extraction of large volumes of rockmass has led to a significant increase in earthquakes and rockbursts in recent years.Although earthquakes have been found to be triggered by explosions in many cases,. it istoo early to give a definite conclusion abut the triggering mechanism. The array recentlyinstalled near Apatity is located close to the Khibiny Massif, and will provide useful datafor further investigation of the source characteristics of earthquakes and mining explo-sions in this area.
I
3

NORSAR Sci. Rep. 1-92/93 November 1992
2 NORSAR Operation
2.1 Detection Processor (DP) operation
There have been 88 breaks in the otherwise continuous operation of the NORSAR onlinesystem within the 6-month reporting interval. The uptime percentage for the period is96.7% as compared to 99.6% for the previous period.
Fig. 2.1.1 and the accompanying Table 2.1.1 both show the daily DP downtime for thedays between 1 April and 30 September 1992. The monthly recording times and percent-ages are given in Table 2.1.2.
The breaks can be grouped as follows:
a) Hardware failure 43b) Stops related to program work or error 0c) Hardware maintenance stops 8d) Power jumps and breaks 3e) TOD error correction 0f) Communication lines 34
The total downtime for the period was 142 hours and 14 minutes. The mean-time-between-failures (MTBF) was 2.0 days, as compared to 4.6 for the previous period.
J. Torstveit
4

NORSAR Sci. Rep. 1-92/93 November 1992
2 3 4 5 5 1 9 10 1' 12 13 . a5 q~ n0 20 2' 22324 25 26 2' 28 Z9 30
2 34 5676389'0 *',2'3 45 169 20 212223 2- 25 26 27 25 MM31
Fig. 2.1.1. Detection Processor uptime for April (top), May (middle) and June (bottom)1992.
COPY AVAIL.AtLb~ W DTIC DOES NUT k'E1RMI FULU(LEGibLF MREPODUC18IOSS

NORSAR Sci. Rep. 1-92/93 November 1992
2 3 4 5 5 7 S 1S10 111 31 5I 7I 92 2 22 42 62 8 W3
st-
Fig. 11.1. Detection Processor uptime for July (top), August (middle) and September(bottom) 1992.
6

NORSAR Sci. Rep. 1-92M93 November 1992
Date Time Cause
04 Apr 0057 - 1512 Hardware failure06 Apr 0930 - 0956 Hardware maintenance13 Apr 2333 - Hardware failure14 Apr - 1511 Hardware failure21 Apr 2052 - 2140 Hardware failure23 Apr 0653 - 0841 Hardware maintenance27 Apr 0540 - 0648 Line failure28 Apr 1826 - 1907 Hardware failure14 May 0905 - 1034 Line failure24 May 1125 - 1358 Aircondition failure01 Jun 2200 - Hardware failure after power break02 Jun - 1352 Hardware failure after power break05 Jun 0223 - 0854 Hardware failure07 Jun 0003 -1319 Power break08 Jun 1153 - 1445 Hardware failure due to thunderstorm10 Jun 2059 - 2158 Hardware failure22 Jun 0712 - 0810 Hardware maintenance23 Jun 0200 - 0311 Hardware failure27 Jun 0636 - 0711 Hardware maintenance14Jul 1123 - 1158 Hardware failure18 Jul 1800 - Hardware failure19 Jul - 1128 Hardware failure29 Jul 1423 - 1514 Hardware failure01 Aug 0120 - 0200 Hardware failure07 Aug 1914 -2000 Hardware failure17 Aug 1602 - 1741 Hardware failure28 Aug 2352 - Aircondition failure29 Aug - 0816 Aircondition failure29 Aug 2024 -2107 Hardware failure30 Aug 1643 - 1728 Hardware failure31 Aug 0257- 0341 Hardware failure31 Aug 1434 - 1738 Hardware failure31 Aug 2212 - 2332 Hardware failure01 Sep 0005 - 0440 Hardware failure01 Sep 0715 - 0755 Hardware maintenance01 Sep 1136 - 1240 Hardware maintenance02 Sep 0233 - 1215 Hardware failure19 Sep 0119 -0203 Hardware failure22 Sep 0359 - 0451 Hardware failure30 Sep 1747 - 1841 Hardware failure
Table 2.1.1. The major downtimes in the period I April - 30 September 1992.
7

NORSAR Sci,. Rep. 1-92/93 November 1992
Month DP Uptime DP Uptime No. of No. of Days DP MTBF*Hours % DP Breaks with Breaks (days)
Apr 92 684.38 95.09 16 11 1.7May 92 739.33 99.40 6 6 4.4Jun 92 676.02 93.89 22 16 1.2Jul 92 723.57 97.31 13 10 2.2Aug 92 724.51 97.31 20 13 1.4Sep 92 700.45 97.34 11 7 2.4
96.74 88 63 2.0
*Mean-timie-between-failures = total uptime/no, of up intervals.
Table 2.1.2. Online system performance, 1 April - 30 September 1992.
IS
NORSAR Sci. Rep. 1-92193 November 1992
2.2 Array communications
General
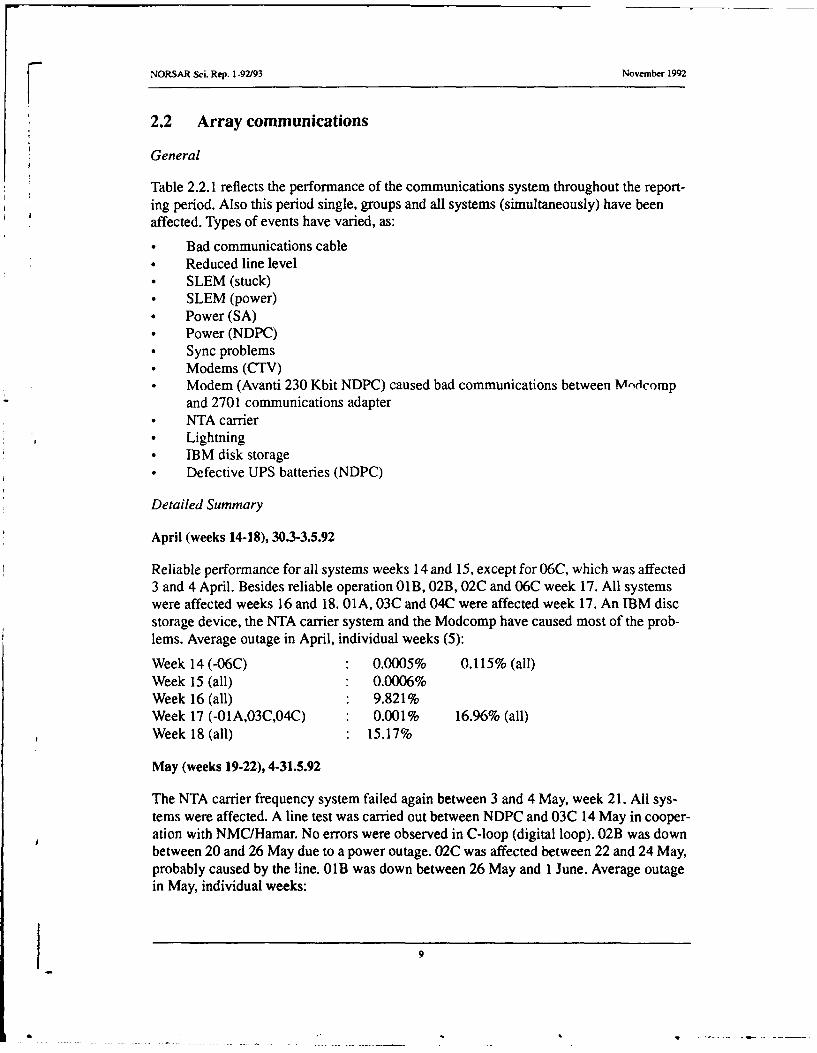
Table 2.2.1 reflects the performance of the communications system throughout the report-ing period. Also this period single, groups and all systems (simultaneously) have beenaffected. Types of events have varied, as:
• Bad communications cable* Reduced line level• SLEM (stuck)* SLEM (power)• Power (SA)* Power (NDPC)* Sync problems* Modems (CTV)* Modem (Avanti 230 Kbit NDPC) caused bad communications between MWdcomp
and 2701 communications adapter• NTA carrier9 Lightning• IBM disk storage• Defective UPS batteries (NDPC)
Detailed Summary
April (weeks 14-18), 30.3-3.5.92
Reliable performance for all systems weeks 14 and 15, except for 06C, which was affected3 and 4 April. Besides reliable operation 01B, 02B, 02C and 06C week 17. All systemswere affected weeks 16 and 18. 01A, 03C and 04C were affected week 17. An IBM discstorage device, the NTA carrier system and the Modcomp have caused most of the prob-lems. Average outage in April, individual weeks (5):
Week 14 (-06C) • 0.0005% 0.115% (all)Week 15 (all) • 0.0006%Week 16 (all) • 9.821%Week 17 (-O0A,03C,04C) • 0.001% 16.96% (all)Week 18 (all) • 15.17%
May (weeks 19-22), 4-31.5.92
The NTA carrier frequency system failed again between 3 and 4 May, week 21. All sys-tems were affected. A line test was carried out between NDPC and 03C 14 May in cooper-ation with NMC/Hamar. No errors were observed in C-loop (digital loop). 02B was downbetween 20 and 26 May due to a power outage. 02C was affected between 22 and 24 May,probably caused by the line. O1B was down between 26 May and 1 June. Average outagein May, individual weeks:
9

NORSAR Sci. Rep. 1-92/93 November 1992
Week 19 (all) . 4.169%Week 20 (all) . 0.0008%Week 21 (-02C) 0.002%Week 22 (-01B,02B) : 0.0005%
June (weeks 23-26), 1-28.6.92
Without warning the local power company disconnected the power 1 June at 2200 hrs.The UPS (Uninterrupted Power Supply) failed and therefore all systems lost power imme-diately. The alarm system did not warn the person on duty, and as a result of this the sys-tems were not restarted until the next day at 1355 hrs.
01 B went down 4 June due to a faulty SLEM power unit (which also supplies the modem),caused excessive amounts of communications errors. 12 June the power unit was replaced.
5 June NORSAR was down approximately 6 hrs 30 min in connection with replacing apower supply in a disc controller.
7 June a short power outage caused vital equipment, such as the 2701 adapter and a disccontroller to drop power. In this connection the communications systems was down forabout 13 hrs.
9 June 02C went down 20.38 hrs. A Modcomp restart the next day restored the subarrayoperation.
11 June a 01B communications test revealed bad C-loop (digital loop). 12 June 01BSLEM power unit was replaced and normal operation was restored.
16 June A comtest on the 01A B/C-loop revealed a bad communications cable. NTA/Hamar tried to improve the conditions by using two other pairs in the cable but withoutsuccess. A new communications test 22 June only confirmed the degraded quality.According to NTA/Hamar the cable repair had to be postponed because the damage waslocated to that part of the cable crossing a corn field.
24 June at 2226 hrs spikes and "time mismatch" was observed on the NORSAR system.25 June the Modcomp was restarted and normal operation restored.
Average outage in June, individual weeks:
Week 23 (-0 1B) : 0.003%Week 24 (-O1B,02C) : 0.021%Week 25 (all) : 0.035%Week 26 (-01 A) : 0.004%
July (weeks 27-31), 29.6-2.8.92
Also in July the NORSAR communications systems were affected either individually orall simultaneously. The individually affected systems were caused by bad communicationscables, short outages, lightning in the subarray area, sync problems, etc. Simultaneously
f i10

V NORSAR Sci. Rep. 1-92Z93 November 1992
affected systems were probably caused by short interruptions in the NTA group transmis-sion equipment. Also the NDPC communications-related equipment has been consideredas a possible source.
01A was inoperative also throughout July. 02C and 04C were down between 1 and 2 July.02C was affected again 6 and 7 July. All systems were affected between 18 and 19 July.The Modcomp was restarted and the systems resumed operation (-01A,O1B,02B). 04Cand 06C were affected 14 July. 19 July 02C, 03C, 04C and 06C were affected for approxi-mately 1 hour. 20 July 01B resumed operation; 02B on 21 July (both had been down since19 July). 02B was affected again 27-28 July caused by lightning. 02C indicated sync prob-lems 29 July between 0000 and 0300 hrs.In the period the Modcomp was restarted 16 times in order to restore the operation of one
or several subarrays, but also in order to align TOD band NORSAR data.
Average outages in July, individual weeks:
Week 27 (-O0A) 0.007%Week 28 (-01A,02C) : 0.009%Week 29 (N/A) --
Week 30 (-01A,01B,02B) : 0.009%Week 31 (-01A) : 0.043%
August (weeks 32-35), 3-30.8.92
O1A was also out of operation also in August. 01B, 02B, 04C and 06C have been affectedthis period.
O0B performance was reduced 9-10 August, but the SLEM unit was replaced and opera-tion established again 20 August.
02B was affected 5-7 and 11-13 August in connection with lightning in the 02B area. 04Cwas affected by a thunderstorm 12-13 August, and 06C was down between 10 and 11August, probably due to short line outages.
All system (-02C) dropped out 10 August between 20 and 23 hrs. After a Modcomp restart0453 hrs 11 August the systems resumed operation.
Average outages in August, individual weeks (4):
Week 32 (-O0A,02B) : 0.016%Week 33 (N/A) --
Week 34 (-OIA,OIB) : 0.002%Week 35 (-O0A) : 0.009%

V NORSAR Sci. Rep. 1-92/93 November 1992
September (weeks 36-39), 31.8-27.9.92
1 September between 1136 and 1240 hrs the communication between the IBM 2701 andthe Modcomp was broken, caused by a faulty Avanti 230 Kbit modem. After repair, thedata exchange started again.
2 September a disc failed which again caused loss of NORSAR data from 0233 hrs untilthe disc was replaced 1215 hrs.
06C was affected 2 September between 10 and 13 hrs. A Modcomp restart reinitiated thesystem. 01B was affected 22-23 September caused by a broken communications cablebetween Kjeller and Lillestrom. Power at 02B was broken a few hours 23 September, butdid not affect the subarray operation due to satisfactory operation of the backup batteries.
Average outages in September, individual weeks (4):
Week 36 (-OlA) : 0.028%Week 37 (-O0A) : 0.0008%Week 38 (-01A) : 0.012%Week 39 (-01A) 0.298%(-01A, 01B) 0.0007%
O.A. Hansen
12
S.. . ---l-, - -.-..n m u nnn m ~ Ut tlm um i

NORSAR Sci. Rep. 1-92/93Noebr19
C4 en
ocD C,,
cen
ON -t
o~ e4 ~ rC4'
to
-C5O 5J 0 00
134

NORSAR Sci. Rep. 1-92/93 November 1992
2.3 NORSAR Event Detection operation
In Table 2.3.1 some monthly statistics of the Detection and Event Processor operation aregiven. The table lists the total number of detections (DPX) triggered by the on-line detec-tor, the total ,iumber of detections processed by the automatic event processor (EPX) andthe total number of events accepted after analyst review (teleseismic phases, core phasesand total).
Total Total Accepted PhasesDPX EPX P-phases Core Phases Sum Daily
Apr 92 10400 1308 245 64 309 10.3May 92 6100 1301 384 104 488 15.7Jun 92 7600 1301 296 87 383 12.8Jul92 9825 1505 359 69 428 13.8Aug 92 9225 1402 383 62 445 14.4Sep 92 9000 1188 269 53 322 10.7
1936 439 2375 13.0
Table 2.3.1. Detection and Event Processor statistics, 1 April - 30 September 1992.
NORSAR Detections
The number of detections (phases) reported by the NORSAR detector during day 092,through day 274, 1992, was 52,129, giving an average of 285 detections per processed day(183 days processed). Table 2.3.2 shows daily and hourly distribution of detections forNORSAR.
B. Paulsen GammelbyT. Schoyen
14

NORSAR Sci. Rep. 1-92/93 November 1992
444. 41 4)~ )4
c44 U). c 4
to ~~~ ~ > >1> o,> 1 1 0t:,>
O4 4 >. ,a) fu foO4 >14) >.9 4) a IVV4 N) > V4 a) goV4 fa M. >1to M>I > > a0 > > > 0 0 9 11 4a >E 1 "fd» -W VE 0 >10 >1 >1 fu Pa -. 10 >. >1 M
W- W Vn WO 4) (A 10 $0 4 0, 00 -0 4.0 N4) 00- M W enO 4, 4 40,WO 4)040 -4 M en4U 40 M 000 .-M NU n M. M, W0 M 4000 '0) Mn $4.U 40
.4 $4 f 310 4 ZE-r.w : E~~. . r. t to . 3: u to to 2 3: E r. W E. r, (n A E- E- rW En 6, M . EMto E
w in1 -wc,0-NM L -wM0ýMM r 0 MVU -wc,0-MM L 0ýwO n1ý46 &,0 U,~ 404kNW 0 W.U,4eM 4.W.W.4 M1 WWW 4 t 1 4 > 0N> 4 >N 4 0b- . 0 N 40 0 N04
Ic 4 <- C - c - C4<- c4I x z x z
(42 r ýO C4. 4 0U0-W-I, -- Nn W e nN LA4..-W % 00coM % 0t---W W %0M n 4.M N M N a% 0 4 a%.-
MeMn 4. 0 - N0V4.n r 0 -- 4.VNO M 40 in04.M0 M 40-0w0w 4.0 4 wN V tn M M w0 M0 N0
MN q -.44 .4-4 - N.. .- 4 N.1 -. 4-4- -- Nn - .44
InV- 0 nM 0w'0ýMk ON, N , -4 U O n NO404 w 0040en w 0 0w 0 N 0.-wN0 w w M 0 4. 4CD.MoeN
04 N- C C004. 4n N""084 44-4 NU,40 04 04enN-n44.ne O43 .. NN
0 -0 C.4 .-..- N-4. 4 C4 C.-.4 M. C4.I N 4 N 4 C-4.4.
-4 .4 - -. - - ----- 4-- 4 NN - 444 --- - - C
0- MNN4 .- 4N NNCi - N .- 4N.-N.-M C-4 4.N C14 C4 -- .-.- -- N .-.
0) - NN-4 .-4-I .- 4N .-M N-4m-N.-4f ,-4.-4N 4-4 - -4.-4 - .- -- N.4 - -
o - 4N.n4,.04U00400.0444-40-04440n4M0004U4UM44UeO4
-- - - - - - - - -- - - - - - - - -
O 0 040 040.4.44.N.04040n4..4-4n-4404U40U04440N 4040000,4.4en4) . .-.- 4 N.-..-I-..4 en NNN-4.4.-4-4 -444.- .-4-4 N.4 .- ,-4-.- .- 4.-4-4 .-
4.1i

NORSAR Sci. Rep. 1-92/93 November 1992
4) c
w >11 M- 4 >1- 4 >M00:-1 - 0 1 w >110 1 01> 'a >0. >4 U,4 .'a >"O >, >, M4M>' 0>.O> ,,4)u o$110 >V0M 4M 10 >O4) 0 10 $4 .V 4 T5 1>0 V10 -5 >40 M 0 Mo 4VWM 40 010w w0 $4 Col
C: § 'aV 9341 aV kla 2.>.M 10 VWV ' >.40 C 4V 'EV 0448 C -0 ,T W-0 >'S >. .4 WVO O>4V Q5 C4 WO >.V0' CO10W455.445 V0W1 z -41 4), 0 41 : 41 V 455. 45 UV C 5 411 4 10 8545 451 010 : -4j C 0 'a3 -4j c a
Ný 0 0 0- .4 ('C4 M V Ln %0 r, co 001 ('4 M V n (0 ý ca 0% 0 C4 (n 4-W in %0 r- co40- at I40 r- (00w ('4n4 I M% oMC n k r Go (04 a-M Nl CIA 44 00 00 0 M~ M- 0. -44.. 0- .4 C> N ('4 N (' M M N (' ('4 00 00 0000-f -4 .- - - -. 4-. -4 ('-
10
C C C C C 0
Pi 40N4 0In 113 1-3 403.I3005N.3In(0024034.3.0 3 4 3 44U-4404'4
ev 4 044040. NON N 4 NN . c4440.4
Nq -l ---- - -44- -N N -4.44-N- N4 N-4.- - -
N ~ ~ ~ ~ ~ _ e( -4 (' 4. - - NN.f.(- - - ~ ~~ 4 - - .- - -4 - _C
N - 4 . NN4a.1.-!NN-4,-.4 .- (-4N'4 -I.4 C4 N .4 -
0ýMwVna 1 ,0 1 0 0 N 0C>0I n 0In 0 ww ww 0C> w w100- ( 4
N ~ ~ ~ ~ ~ ~ e - (4 C4 --.I -f-N44- -('.I .4-4.- - -.4 MC .- 4fl- v('4
.4 '- - - - -14 'MN .4' a - 4 - - 4 - 4 a 4 ( e- C4.- C4I -- 04M
(0mo N 0N0I n 04MMo4 n -4ll C4 M'M4 m44-- w4.4,-.4- '-N.n r-,4-- %o I m Ln N . -4 w -%
rq- --- -- MN- .4N.-I. C*. a C4 4 NM . Nm mt4N 4N m
C ~ ~ ~ ~ ~ ~ N Nnf0 N 0 -I 0 N 4 . 4 . 4 0N N aaN-N 44nn 44
.4 4.1 .4 ,4 4 . a .4 4-4-4Na.- -N--N4. a- M4- ----- .4N 4
In~~C N( I N ( N 0 4 N 0 . .N C4 C.4"_ C4
L4 .4 N In � N. .N N C4.4- -4a- -f .- - -N M
- "N_4 -I .4-- -4444 -- C-44 -4 N -.4 a -4.4... a N-aNN .4 .
441
0 ~- -- - - - ----------a.4. . .- ------ NN---- -f ------- MW4N
NORSAR Sci. Rep. 1-92/93 November 1992
a4 >4 >, M >1 >
a > . .4 M , >4" a >, >4. a. a . u > . a > 4 a > . ,a n> ,E
0 c4 i~ a = 1 "Z'sV w g wo' :,vv V? c $4V '0r W C 3 LOU :J'a 1 0 C 14V -0 v 3 -0 14V -0 V 3' a C I-I V VV0.4a CJ 3 -41 0) a :3 ~-.0 C c a : c-. ) 10 :3 .-. 4o c 0V ý - 43 c VC CV .4j c c wo :-a o c 0
041400 4)X14 M , '4a O i :1 4aC k.C14a1 Vtn 3: ~Er.. th P LW n ME P rk.Cf W O ggW Pr2cn W CW. weWR Z M -CEQ..ic A E.I4E otn 4 %o or- w dh 0 -~-Nm 4tn w0 m o 0 N o4 m( c0e m04 m4 V) lo 4. w4 m0 o040 m- m in %o I 0 a, o m
E 0% 1 % N N' N f N M M M 00 00 00 M- M4 -4 W- M4 04 10 M N 0 M N ' W W N N0 N 4 M 000 0 0 0 I .-4 O-
N ~ m .4 -4 N --- - - .4 4 N -4- - - - -N N - N N 4mN.N-
N -.. N-.-m 4 .. 4.44M .4N- -- - -c -44. --.. NN- -4 .- 4
N~~~~~~~~ .- 4 --. -- --- N -4... - NNNN-
- --- 4 - ------ --- N - -- - -- - - - -- -.4. - -- ---- - c
- - - N -- - -- - .- 4 -- -4-4-N--N - N ----- - --
o n !M a. NO (4 .MMMW M M 0-MMY NID 0' 0 %fWO 0NNOM -1 0 ON a% Iv -q -c4 N..c4..- - -- -- -- - -- -- .- N - N- NNM.4.
V l M lo.4N. lo.4N- -o o l )w ý ý or N o-N-.-4- I4n... . N
S( M0N ~ 0 0 0 N 0 A N N 0 ' 0 4 ' 4
0 -- .4.4. 4-4 N4-
11Q o -24mzg w- wý2 N .-4N %o .4-4NN ND w- Ln-4- 4NN-. m- N4 o4 w-.4. -D-I cCM
- -N- .. 4INN.-4N N.44.- en4 N- " 0.-.4-4- 4 - -4-Nm IN,.N.N-44
- - - -- -( -4 --. 1 -- rq - -- 4-4-4---.-4 M-4 .- - t.-
0.o 0 c v-hýa !owmw mo o4 - w - t N 0..4 o.ma - -o .-N.-. a, 4.m I )
000000- M N- -.. -- -4 -4 - -M4 C4. N4 N .- 4NMMMMM W VW - ýnV.0qCNCe
IA M N 0 0 M O 0 0 4 . 4 ~ N 0 0 'M17

NORSAR Sci. Rep. 1-92/93 November 1992
wa ~ ~ ~ ~ ~ ~ .>10> 1a 4V 0 o
3c - . t-4 0>) E- X5 E. 'aE n 3t :U) 'a 0 - 0
00 OD 0Y C> -4mcL 0ý o0 lN ~ ~ ~ ~ ~ ~ ~ 4 04 C4C qNNC - C
a~ m4 0 4
CL 0. I 0 L4 440'4
CA rA o u w U) OwWU) )Wt E- E- <~ <
m ( C (N (N N N N " - ( N '4=(N
"4 y N a'0-w 0 a,~' ('4 m ' m4 m~(
(4 - - - -4- ( - - c - - -~
-4 ~>-
oý nN ~ ~ U4 ' 0 104 v' w" IDwM0we qi
(N C4~:' j
u) - - -- - - Inc4 -
00
m - -- - 4o40%-m4'o o -4 (A 4 ma N
.4 (- - '- m4444N( .4- 0 m -
cy4 m- a,- m4 C4 m -'4-"(( -4 45' m'w4 M 0 (40 C, N
0 0m0U 0 -4 a'-'~ O 'a q0 (N (N -W (N C4 0
C Co 0 .4 -4 0 (
o -m.' -4 m 0 ('
S0 a4' a 4 .4 -0 w4 00 a -0 10 a -f- <z 0 e w4
'4 U4 O'"4~440(f1~C*~IA ("4 ' ~ '4 40 >

NORSAR Sci. Rep. 1-92/93 November 1992
3 Operation of regional arrays
3.1 Recording of NORESS data at NDPC, Kjeller
Table 3.1.1 lists the main outage times and reasons.
The average recording time was 98.55% as compared to 99.78% during the previousreporting period.
Date Time Cause
09 Apr 0127 - 0225 Transmission line failure09 Apr 1007 - 1426 Transmission line failure05 May 2342 - Transmission line failure06 May - 0008 Transmission line failure01 Jun 2200 - Power break at NDPC02 Jun - 0454 Power break at NDPC02 Jun 0454 - Reduced data quality (HUB problems)03 Jun - 0130 Reduced data quality (HUB problems)03 Jun 1207 - Reduced data quality (HUB problems)04 Jun - 0100 Reduced data quality (HUB problems)04 Jun 1130 - 2200 Reduced data quality (HUB problems)11 Aug 1607 - 1723 Transmission line maintenance11 Aug 1731 - 1923 Transmission line maintenance11 Aug 1927 - 2323 Transmission line maintenance11 Aug 2329 - Transmission line maintenance12 Aug - 0123 Transmission line maintenance12 Aug 0145 - 0324 Transmission line maintenance12 Aug 1108 - 1124 Transmission line maintenance12 Aug 1151 - 1324 Transmission line maintenance27 Sep 0059 - 0200 Transmission line failure
Table 3.1.1. Interruptions in recording of NORESS data at NDPC, 1 April - 30 September1992.
Monthly uptimes for the NORESS on-line data recording task, taking into account all fac-tors (field installations, transmissions line, data center operation) affecting this task wereas follows:
19

NORSAR Sci. Rep. 1-92/93 November 1992
April 99.20May : 99.88June 96.23July 99.95August 96.17September: 99.86
Fig. 3.1.1 shows the uptime for the data recording task, or equivalently, the availability ofNORESS data in our tape archive, on a day-by-day basis, for the reporting period.
J. Torstveit
20

NORSAR Sci. Rep. 1-92/93 November 1992
52 1~ 5 3 910 t2 1351-15 163'7,8 "220 21122 213 2142152 13a62gw
2345 6'661'01 '21[3!- 5'6 1111111316.92 2.fl1Z2522'625311
2 3 5 4 8 3 9' h'23 ýS. . g 4 ; 21223223 24 152087'7 3
Fig. 3.1.1. NORESS data recording uptime for April (top), May (middle) and June (bot-tom) 1992.
21
MYf AVAILALE TO m'ic DOW NOT PER=W F=LL LEGIBLE REPRDUCTION

NORSAR Sci. Rep. 1-92/93 November 1992
2 5 6 1 B go 10 112 13 1- 15 161 0 It 20 21~ 2.223 Z 524 25242? flO
2345 0 6 9' 1.l!2 345I )S10 2 2223242524272S"303,
4 Fig. 3.1.1. (con:.) NORESS data recording uptime for July (top), August (middle) andSeptember (bottom) 1992.
My! AVAXLAELN M O NTPQTY Y WZRMU
aIIIIIIIIIIItllll
NORSAR Sci. Rep. 1-92/93 November 1992
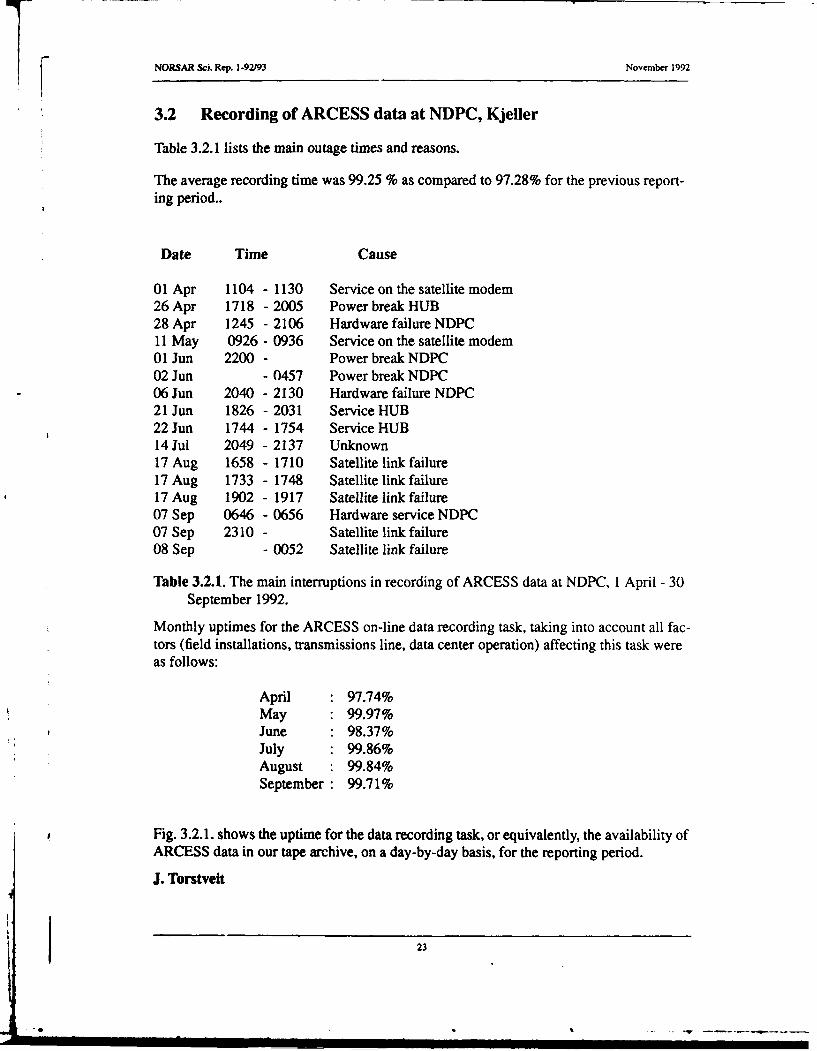
3.2 Recording of ARCESS data at NDPC, Kjeller
Table 3.2.1 lists the main outage times and reasons.
The average recording time was 99.25 % as compared to 97.28% for the previous report-ing period..
Date Time Cause
01 Apr 1104 - 1130 Service on the satellite modem26 Apr 1718 - 2005 Power break HUB28 Apr 1245 - 2106 Hardware failure NDPC11 May 0926 - 0936 Service on the satellite modem01 Jun 2200 - Power break NDPC02 Jun - 0457 Power break NDPC06 Jun 2040 - 2130 Hardware failure NDPC21 Jun 1826 -2031 Service HUB22 Jun 1744 - 1754 Service HUB14 Jul 2049 -2137 Unknown17 Aug 1658 - 1710 Satellite link failure17 Aug 1733 - 1748 Satellite link failure17 Aug 1902 - 1917 Satellite link failure07 Sep 0646 - 0656 Hardware service NDPC07 Sep 2310 - Satellite link failure08 Sep - 0052 Satellite link failure
Table 3.2.1. The main interruptions in recording of ARCESS data at NDPC, I April - 30September 1992.
Monthly uptimes for the ARCESS on-line data recording task, taking into account all fac-tors (field installations, transmissions line, data center operation) affecting this task wereas follows:
April • 97.74%May :99.97%June • 98.37%July • 99.86%August • 99.84%September 99.71%
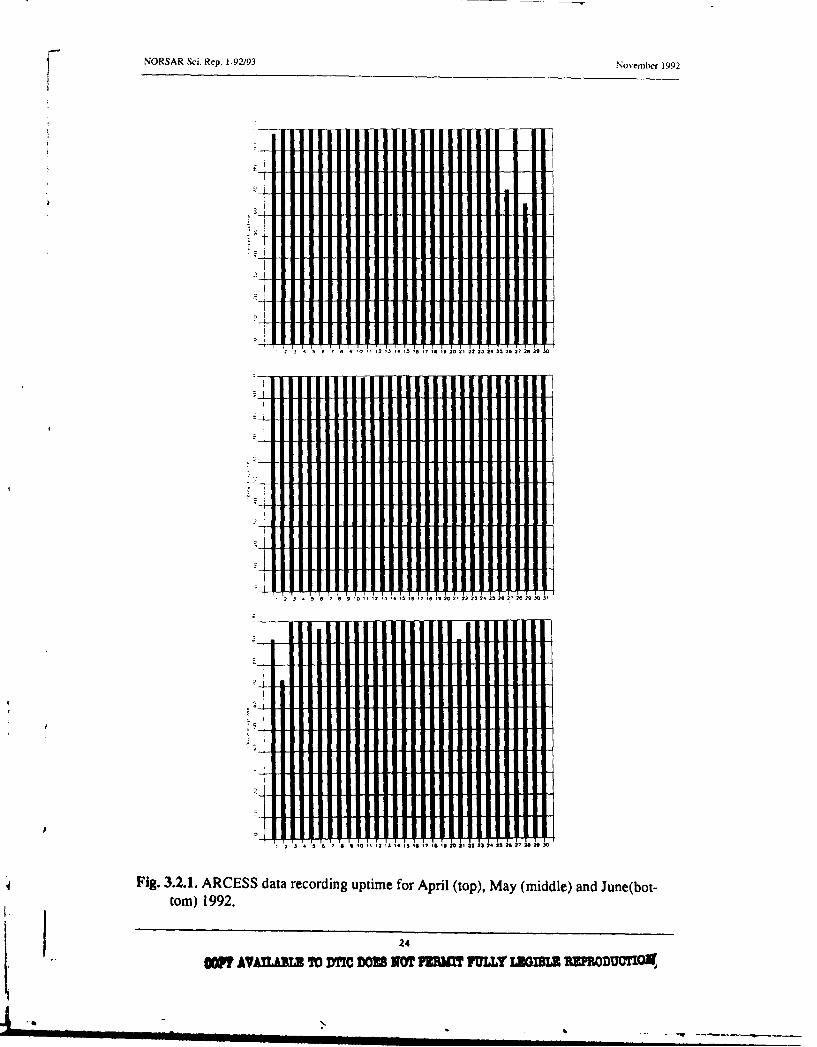
Fig. 3.2.1. shows the uptime for the data recording task, or equivalently, the availability ofARCESS data in our tape archive, on a day-by-day basis, for the reporting period.
J. Torstvelt
23
NORSAR Sci. Rep. 1.92193 Novemb[r 1992
a 7 a 90 1 12 13 1' 11 IS 18 19 20 21 22 2321 25 2C 2 2a 2-
'2 3 0 10 1 11 1' 95 ~' I S 8 7!a 9 2102 212 73 21125 2- 1202 29 M 3'
Fig. 3.2.1. ARCESS data recording uptime for April (top), May (middle) and June(bot..
torn) 1 992. 2
O?, IIII Ill l l DC W NOlT F ULLllll RII1ODUCT
•i II I III II II III II I I.

V NORSAR Sci. Rep. 1-92/93 November 1992
22
M2 ,3 4 7 8 00 DO NO3 T 14 k 17 18 20 22 23 24a5227 282
4 ig 32.. RCSSdTarcdigutmfrJuy(o)AuutmdleanSpebr
(bttm)192
cop " -ixziopn ost'- ULYLGBL EROUT

NORSAR Sci. Rep. 1-92/93 November 1992
3.3 Recording of FINESA data at NDPC, Kjeller
The average recording time was 93.75% as compared to 95.5% for the previous period. Ascan be seen from Table 3.3.1 below, the main reason for the downtime is transmission linefailure and Hub failure.
Date Time Cause
23 Apr 2328- Transmission line failure24 Apr - 0518 Transmission line failure09 May 1042 - Transmission line failure11 May - 0917 Transmission line failure22 May 1000 - 1021 Transmission line failure01 Jun 2200 - Power failure NDPC02 Jun - 0458 Power failure NDPC18 Jun 1833 - 2140 Transmission line failure20 Jun 0853 - Transmission line failure22 Jun - 1310 Transmission line failure05 Jul 0309 - Transmission line failure06 Jul - 0727 Transmission line failure13 Jul 1359 - Transmission line failure14 Jul - 0815 Transmission line failure27 Jul 1116 - 1143 Transmission line failure31 Jul 1240 - Hardware failure HUB03 Aug - 1218 Hardware failure HUB06 Aug 1137 - 1149 Transmission line failure10 Aug 2038 - 2109 Transmission line failure10 Aug 2119 - Transmission line failure11 Aug - 0808 Transmission line failure17 Aug 1229 - 1327 Transmission line failure01 Sep 0335 - Transmission line failure02 Sep - 0638 Transmission line failure
Table 3.3.1. The main interruptions in recording of FINESA data at NDPC, 1 April - 30September 1992.
Monthly uptimes for the FINESA on-line data recording task, taking into account all fac-tors (field installations, transmission lines, data center operation) affecting this task wereas follows:
26

NORSAR Sci. Rep. 1-92/93 November 1992
April 99.13%May 93.65%June 91.25%July 92.09%August 90.17%September 96.22%
Fig. 3.3.1 shows the uptime for the data recording task, or equivalently, the availability of
FINESA data in our tape archive, on a day-by-day basis, for the reporting period.
J. Torstveit
I

NORSAR Sci. Rep. 1-92/93 November 1992
2 1 1 S '2 3 "1 '5 16 'a 1 20 a' 22 2 24 25 206 27 at 2 30
2 3 t 5 6 8 9 0 c 2 13 15 16 1t 7 !8 9 20 21 22 23 2- Z' . 21 a Z 29O
2 3 5 1 9 10 1O I' 12 13 15 16 13 ;2 212 L ;4215 h "210 .1 W
Fig. 3.3.1. FINESA data recording uptime for April (top), May (middle) and June (bot-;4 tom) 1992.
Off? AVAMhAMI TO DTIC DOES NOT PEFm'! FULY LEGIBLE RLEPRODUCnTo~j
2.iiii I111111111

I NORSAR Sci. Rep. 1-92/93 November 1992
2 3 4 5 6 7 8 4lol 12 1 .3415I16173 S 201 22232425222725f M 3,
23'5 78 3880 11 2.3,15S3'1461 1 920 2122 2324425 26 272829 313
Fig. 3.3.1. FINESA data recording uptime for July (top), August (middle) and September
22
(bottom) 1992D. 2
-- 4-
NORSAR Sci. Rep. 1-92/93 November 1992
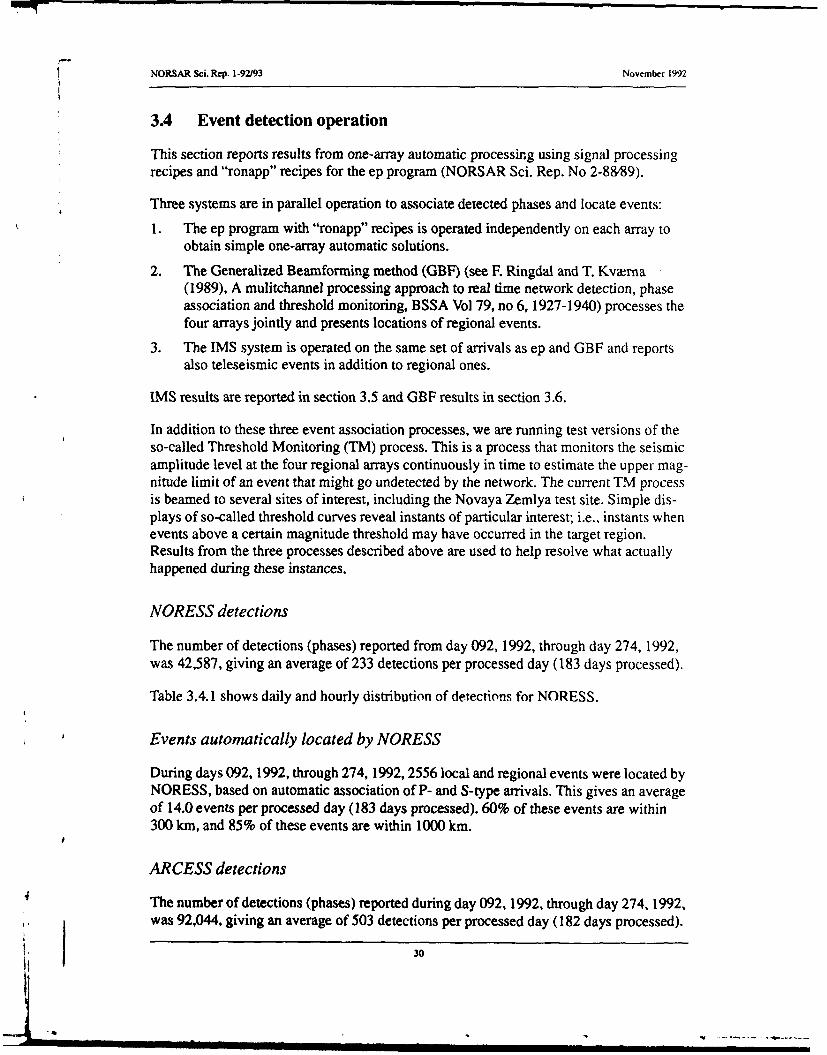
3.4 Event detection operation
This section reports results from one-array automatic processing using signal processingrecipes and "ronapp" recipes for the ep program (NORSAR Sci. Rep. No 2-8&89).
Three systems are in parallel operation to associate detected phases and locate events:1. The ep program with "ronapp" recipes is operated independently on each array to
obtain simple one-array automatic solutions.
2. The Generalized Beamforming method (GBF) (see F. Ringdal and T. Kv~erna(1989), A mulitchannel processing approach to real time network detection, phaseassociation and threshold monitoring, BSSA Vol 79, no 6, 1927-1940) processes thefour arrays jointly and presents locations of regional events.
3. The IMS system is operated on the same set of arrivals as ep and GBF and reportsalso teleseismic events in addition to regional ones.
IMS results are reported in section 3.5 and GBF results in section 3.6.
In addition to these three event association processes, we are running test versions of theso-called Threshold Monitoring (TM) process. This is a process that monitors the seismicamplitude level at the four regional arrays continuously in time to estimate the upper mag-nitude limit of an event that might go undetected by the network. The current TM processis beamed to several sites of interest, including the Novaya Zemlya test site. Simple dis-plays of so-called threshold curves reveal instants of particular interest; i.e., instants whenevents above a certain magnitude threshold may have occurred in the target region.Results from the three processes described above are used to help resolve what actuallyhappened during these instances.
NORESS detections
The number of detections (phases) reported from day 092, 1992, through day 274, 1992,was 42,587, giving an average of 233 detections per processed day (183 days processed).
Table 3.4.1 shows daily and hourly distribution of detections for NORESS.
Events automatically located by NORESS
During days 092, 1992, through 274, 1992, 2556 local and regional events were located byNORESS, based on automatic association of P- and S-type arrivals. This gives an averageof 14.0 events per processed day (183 days processed). 60% of these events are within300 km, and 85% of these events are within 1000 kmn.
ARCESS detections
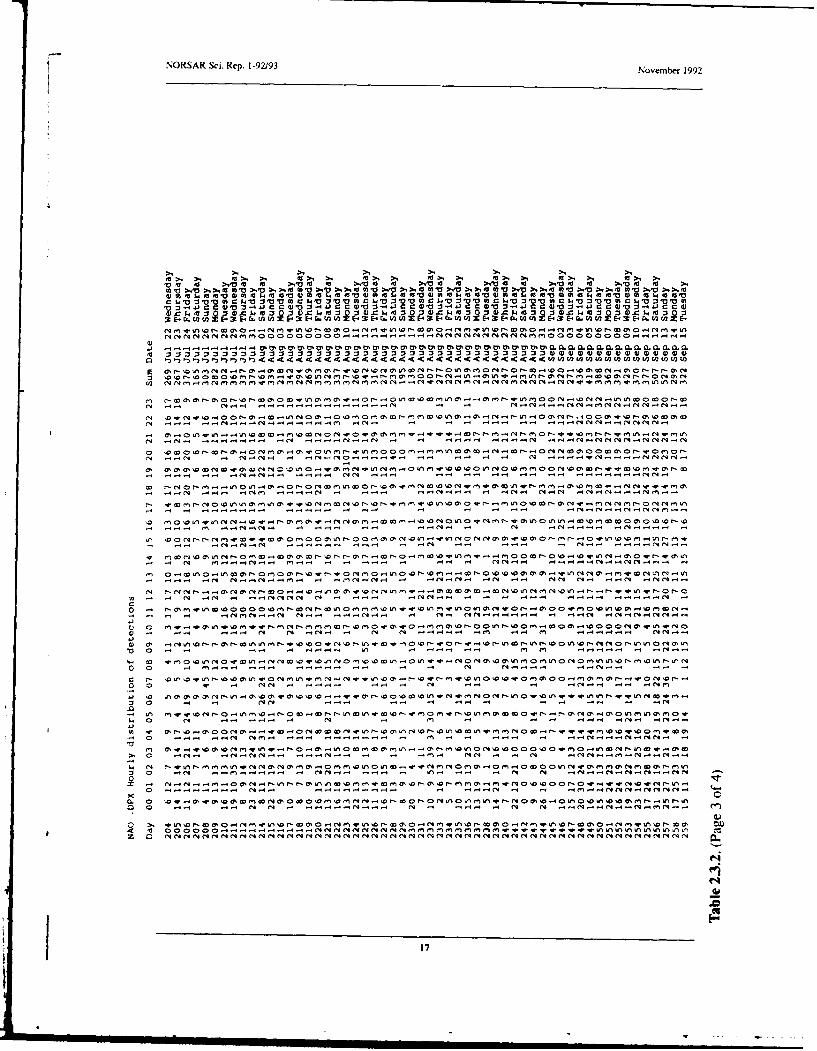
The number of detections (phases) reported during day 092, 1992, through day 274, 1992,was 92,044, giving an average of 503 detections per processed day (182 days processed).
30

NORSAR Sci. Rep. 1-92t93 November 1992
ARCESS detections
The number of detections (phases) reported during day 092, 1992, through day 274, 1992,was 92,044, giving an average of 503 detections per processed day (182 days processed).
Table 3.4.2 shows daily and hourly distribution of detections for ARCESS.
Events automatically located by ARCESS
During days 092, 1992, through 274, 1992, 3875 local and regional events were located byARCESS, based on automatic association of P- and S-type arrivals. This gives an average21.3 events per processed day (182 days processed). 47% of these events are within300 km, and 86% of these events are within 1000 km.
FINESA detections
The number of detections (phases) reported during day 092, 1992, through day 274, 1992,was 43,036, giving an average of 240 detections per processed day (179 days processed).
Table 3.4.3 shows daily and hourly distribution of detections for FINESA.
Events automatically located by FINESA
During days 092, 1992, through 274, 1992, 2973 local and regional events were located byFINESA, based on automatic association of P- and S-type arrivals. This gives an averageof 16.6 events per processed day (179 days processed). 71% of these events are within300 km, and 88% of these events are within 1000 km.
GERESS detections
The number of detections (phases) reported from day 092, 1992, through day 274, 1992,was 43,293, giving an average of 242 detections per processed day (178 days processed).
Table 3.4.4 shows daily and hourly distribution of detections for GERESS.
Events automatically located by GERESS
During days 092, 1992, through 274,1992, 3966 local and regional events were located byGERESS, based on automatic association of P- and S-type arrivals. This gives an averageof 22.3 events per processed day (178 days processed). 66% of these events are within300 km, and 85% of these events are within 1000 km.
J. Fyen
31

NORSAR Sci. Rep. 1 -92/93 Nov einler 1992
La. ýj C C.. Ln
>Io m) V.4 4)1 'm4) >"a :.V4 4) m.4 w) >.04 >"4) >'aw >.V) 4 >.-a ) V 4)e >.4m 4) w) 0. M) m) 4 a 4) 4) oo m -a. m) v) w) m)4 0. w) a) 4)a 4)4 . 4) m .0 4 '0 )V 4) 4) m) 4.. M M'0 4) M) 'a $.4) 0 ) M-0 4)4 % . 4) M M
c w1a. : V v) c w. 10 VV 1 4)) C 1.. ZV 4) 0 C $.. '0 "0V M) C W. n V 4)00 C WD4 3'0' M) C L.V '0 V 4)' - C $4 V VV 40 )
V ')4. C ' C 3 WV ~4 C C 'D '-). C r 0'0 Z ý C C o)VO n ' C C 4)'aV ~- .4 C C WV' : ~- C C 4),a n-. CC
3 -. 0 0 W E 0-0 M4 E a 04 h en t 2E '00-D004 E.404 Wt EntU 0 -004 -4 enA t 0-0 44e L 0-0 -0 n t) 1: E000000000I ýw , --..-.4-L Dýcoa .4-.4-04 04M0n4w0mIQ c 4ao N0m0w0 o00 w00 lo.-. .-.- w-e4a, 404o
o) O .O.Ma )4)4)4)4)4)4)4 M4)4)4)4 coo o)c) mmm o m omfumm mm m ommv<4 4 < C- C<- C4- C<4 <<- C- CX :X :X :X :xxzxxxxX :x1 :2
04 M k o o o o a o ý m aw o mc - - - - -4 -4e-..-
(Nm~ ----I 40
04 4 Q - - - -. -~ -N- - m
- 4 m N~4 -q N 4 4- - - - -4
N -40f N- .4-.i- -444 - .0 . 'f- -mm
m c4 0qtN ev04 -Nt4 (
W - .- N4 A44. .-4 m4- - -4-0 -- -4...- -4. -4nl~ -0-04
-1 en N440 .44. - .- 4. -
0oq -N O e 0 4 4 0 0 4 ~ 0 0 o 0 -- 0 04L4 N- Q0VV 11 MMNM ý D InI 04 W4 04 W0 - -- r'4. .4n0 0 04 M- .-0.4 C4.- n M M -. 0 W 0404
=) 404 Wtn W 4 ý .V M C 4 M4- 0. .. 4. .)ý n04 en In ..D .%04-- 0444--e 04 0 V oWoý A a
eq (
V 0 4 - -e --4 - ---- - --4 -------------
'.4 (C C tte ae 4400 oeeeoflneovtir00 t- O0400 tf.-.-t~l 4-C een-ee.043244

NORSAR Sci. Rep. 1 -92J93 November 1992
J4)C
14 411 14U V1'1444
41.0 . - N N n O 0% 0- c - 0 n7 0 V 10 : 0 -4j :0 0 4j c0 4) V% 0. c c 0 NC0% 041N 14 4. 0 Ai c a% 04
to Ch 0 M N 0000n000ý00 0% 4..44 ,- M -M ,n -00 0 N N M M W %N N0 f, N 0 000000 0 ý M~ M VI - w. r-4 w4 M4 0 NVM
cU c
N o %0 N. -4 .4 w4 w4 -4 -n M-4nMMý nC VýwMýV wýý% wM0MC
N . - - . --. -c4 CIO - -4? -4 4
-~~~~~ ~~ ~o M- .4 .N.4 - .4W 4- NI.
M - - - - 4 - .M".4 n 4 C-.4 4 N -wm 4N .4.4v) .4 C13 MN C% .10 .ý N-c
.- 4 4 -44 N * .-.- 4 N .44 - -4.44- M O MN- NN.4. C14 NM I-4 .. 4-.
VI~~~~f N N N0 00mtNCncVI 0 % N -4 N0MCI0 O. C- ~ ~ ~ ~ ~ ~ ~ ~ ~ ~ ~ ~ ~ ~ ~ ~ 0 ( N N 4 . 4 . -4- -. 4 N- -4 --- 44 NC 4 C04 M .4 - N
-4 .- * N).-. .4 . .4 4 NN-4. C4( -44. - 4 ~ t -VN -c-44 -4 -
-N NN.4 -W4. r.44 .N - CIN ~ * qN-4 N-
4.r4
z .- 4 -- -- -- -----N.~44 -- -4.-4 ---- 4.- ---- ----NN V N-4 M
4.3 -4

fNORSAR Sci. Rep. 1-92193 November 1992
41V t 1010 a aa tGEamo4>* 0 100 > > 400 " ).'O 01 ).' 0 >1V 0>10 ).V 0` %T V 0 )
NMAfk 10f40 (42 WR 0.S'4 9 NtM100 2? E4 r.' 404 400 Q .4 WM W to' E01 r.00- to to xf4 E. 4 4 to 4, NO M E. S r. W 04- NM 2 E.. 4t
N~ N V N r CD N , N N 4 N c M vt %t 000 0 00 . '.4 a 4 "1.4 m .'. W 4 in 4 %o, DCh 4 M N n N D N - Go N N1 N M v "S 0000000 0 .- '., '-44
to 1 V3ý2z32: 1ý: 33Vý: 1233ý3z 3ýV3zVz: 134 )4 )4 )4 )4 )4 )4 )0 2 1 3Il 7", 5 1- C c44- 444 C c44I - C- - C444c440 4- 4 W nWW 0 t )E o)t nWt
a Mt 00ý4 wnL or ný- - - OC40C ' oODf C4ývL - '. -m00Mn 00a,*r 04 C40v4 0
10 C4 I4MNN"'4 " M .
fq ,. 40 Nlq NN.4.'44 M -4 4ý '-4
0 r- 40Mwf4M 044' N04Novo 44W t 0 040cq WM f'4'M ý ft f44'om -0000 vwmo a VOMM. 0
'.C4 '. . N0.'4 (n C-4-4.'- N NC4'4.4 '1-'
w w. r-mawor - t.'. - '.4 o. NUn4N. n mw 4 v4-N m '. Ln4.. m o ,c mmmvvwt -owwýor n o wNo, " -
- N'4 ý ''4 4 '.4'.4 " 4' '4 ' " NN4.- -O '. . .'4.4
M4 C-4 M. 4 '. M '. M. MN-N.4.4 '.4 CIS r4f-"'.4.4 M '.
inv ' o r-4 4 0- m wm v - mm 00 ýtn6 n o cw wm w % wm i wmr- o % w . n4oa m0 v U,0c4c0vcN'."4I-M "M '. .'4 44.N - . N-.44'4 ' '4 N . -. 4-N '4-
M 00 N 40 M U O 0 N.0044f M-40 4 N 0 '4-4 M N 4'4fS4 4
0 00 0. .- . 4 Lq-N. . . . 44 N''4 .4.'4 .4. . -'4 .N-'4.4I44.
W) N. %.D. 0- "' 0.'. In ". M ýý0Mvr I lNý00 h M %a v 4N N .4 vS.. v'- a '-4(Mm4,-MI "U v w 01MC4V
M mm u %* 01vp o lr o" m m c0- M"O IM t" "vM 0144 ~ ~ ~ ~ ~ ~ m " M 04 0 4 N eM 4 M N 0 M4.4 US 00 0 0.4M NM "' 4 4 ''4.0 4 4
* 0 ~ 44..4..4.4'4 N M'. '4'.4 4 '4 '44.4-I 4'0
N m- M0 0 N 0 ft n vN04n r-w vvým NmOOv o m moN !m " w inm .4m4m.v4cMwN o% r )c Nwo~~~v N v 0 M. '4 fn"M S -(M 4'4 e 4 .4 N. .
w n0wýc v- f4'w m 47. v o v m m ýo m 'o0m 4 m4m m v mmM0%04'ft-4-4MM40 a.'. in'-tm v-
a LN 0 M ' 6N .a.4 t 44 'r. NO 4 r - "Va ,r M '.4v N m4 M. r4 v'. m
434

NORSAR Sci. Rep. 1-92/93 November 1992
S0.
tU 00
>1. 1. U..~s 0fe 1 0.. #'00 >. 0.' 01 C
me 00 aloM n >1 ,>10 w 4WV) 010 01 4
~.Fa01 fl %4 01 Z3 000.
00%~~0r-00%0 0101 0 4 S
01~r 01 114)~I M 4) 4J01 0 u
C4 00 00t'00 C.)U2 NN ~ -4.. ,- .-.- 4. 4 tn N
N 0'~II.4.-NU N .4 0 A %O
00
nN 0 Q M. N4 r 40 >Ln IM &
-4 CF -4 - --.COCA
I* 14 - 4 -4 N 0 ..
""M ft -4 o-4 -4 ..0w -w - w- cO4 i r-4 p 0
ýq ~ C1 .4 4.4 .4 0 -4 -4m owr - n 4 a# o 0
0 0 4N IAI4.A a0AAN ' N p. A
41 101-O
)0 in
M0- .4 .4 .4 4D 4r .4 N 4 Mr 4 fn .4 . 40
01 qO OoNO4.N.r~-I 0% ON N " .0 4A 0 C .4 M4 M41 0 M .4 r4 eq "M "MV
9. 0 ONO4IA.40'OOAMIIA0 0 N .4 05

VNORSAR Sci. Rep. 1-9V/93 November 1992
.- w 54 41 4)0" 4 )41 ..3
1Ai
'04 4N 1 lo04 >1>'4 1 >'4 1 a,04 go>,'4 41 >01 41 ,01 ,
to v >10 >1>.#a 0)v >.'E >1 >,to0 410 >1' >1 >,to 91 -9 >1 b0 >led4 00V >.-a >1>,t 41 Is >.V >1 >1,100 'U >1' > >,1 m 1'm >1,' >1 >,145145.4410411144110GW 16 4 1'o 0 '0.441444 S~1 1'015a1 4 41V44144V4'4 1
'a 'E w 415 to 'o -144
-: NM -0 :5 le to 0% 0 a Nm C: §n a 0 c~ 5jv '05=00 yc 40 a .. NM 41 c~ 0 NO 01 0) C~ LVO Sn 05 1 Cn n4 -0 :FSn M
00 00 00 0 00 a aaa 4 a 4 aC4 N N4 C4 C4 C4 N4 NCN N M 00 00 00 0 00 a .NN N N4 N " N
41 L4t . 1 1 L 41
N %w0w00 Q 0ý0 0r- WC mN wn a 4 a-wwN -(4 a C>N~ an a w wa rý M 1 rNo wfad 0M0ýw1 a-
a Sa a,% a Cav-W- 0 a- n -W 0 MfaM 0N 0 t Or- - v v0 N N 0 0 00 0 -w Nn~a
N% N
N Mm- - - N
tna N -n(a a a nV aa a M a a N a aa w a a
q. C r * *c Snna -5a~~~ 0a ý~rM~a0 m a005=00M 005 U N~ N ( M0%a0q -
a *M N N a a n N a a NNN aqn aaaa. NNN
M
- a M nN NN aaNaNN ýNNNCNN a. aV - anancna a~ n a n~ nN"
"mm 5m
4e4* @% =N0% ~ nNN~oano %nnn 0N~nN NN ~ ....a ....... 05
V ~ ~ ~ ~ ~ ~ - - - -0- -- --N-----a-a--~aN4M N n N Nn a~ n a N a N
0 n~aM O0 M0% aa w~rO~MM000O0NOO O~0NO 5=0Ma0aMONa &
O 0 ~aa N a a a NN~N nn NaN.4NN NaN aN~ a~MN ana36

V .NORS R Sci. Rep. 1 -92/93 November 1992
U) 43 4$4 $4
00 0 00 04 >'.u0 0 >M to 4 0 :." C0 go >Mf :40 is do 0 0e a a >.
V -4. ~0 1441 0 " 41 0. o 00 :1-4 01 -4 c 'a _40 0 40 ~0,0 ).VC1U0v VjgJ- 00041010, 000g 14, 00 3 006 U040 "1~ 31 014 c04 =.14 r.) 4
.~~~ ~ ~~~ ~~~ -4 -4400 0 l430 1 -v4J0 -IMMN4041 00 5 44 0
N00 0 M- V4 Nl In .I 0 MV n 00 M--0. V MA do V$ OD M0Ma 0- M I& 4. aS Mw Nr 00 0.4 N- co 4. MA 01 -tmW 00 0- - IA -. -A - - - 0. -N1 W M IAI 0 0 0 0 -4 -4- M4 W4 .-4 N4~ -W W4 M N0 N- Nn N0 N 10 oi c N N a N WNn- MA 000000000N N-4 .4 kn-4.. M 4 NV %0 InM-W
r-W 0 0 0- 0 V M 0- 0ý N0- i 0ý 4VWI lN0r 0 0 -, 0 0l 4 M W M W = -00 M 0 r- 0 W 01 M.4 - - .- . 4
4100 4 -4. SI A0N411%I -440 M 0 -4 IA -A 4. -A4.0 0 -4 N -N4N N-4 M-' A0N %0 .40N N I 03% IAý 0% -N
-4 WA N0 4. 1- N 00 M ý4 IA N N IA N - 00 N' MA IA N4 4* IA M. I- Ný r inM. 01 UV N %04 w UM V . IA MA 0 in 00%P -4 u u0 NA q rp CV iA M4 N 00M
C4I .N0%0NN40 NNNNI 4 MA .4444 M N .4-,-f Iv00N, N 4 N t 0%"M 0 A0 0 4 N.4N0IA0 O 0%
N4 N 4 -v- 4 CIA -4 -1 ,4-4 `4 N C.4. -4N 4 M -4..4.4 NA.-4.SN M -4N .44-4M -# -4N
-4 .-4N N- .4 N .4 NA I.-4 -f N.-4.-IN-f -f NN.4-6 . 4 .- 4M -4N-4.N M N-V .- IN.-4IAI
N-4IA . . -4 N4-wN4-4-.4 I N4.-4 --4-4 qNN.-4NN -4. 4ý 4-4 -44N N M M-4 .- 4 CO-4. M-C4 -N4. CIO V-4
00.40 0 IA -VMAý 4. 4N M N IA W00 -4-4.ý %n %0 r-l -4 4.% 0 N D-% 00 40 -V %n In % 40% N - 00 o ON No m w % q Nc vi -r 00 N- N r cin oN .4-4 ..-4 -414- 4 ý4- MN-4 "-4 N-1. .4 .4.-4 N. -4 NN C.4 (4- N-4NNC0 4- 4 N4.-4N ..4-MnN
-4-4N-4 - -4-4-M .4ý .4M IOM ~-4-1 C,-41N 4 -. 4 NM.4 N-.4 ~ A4A .4 4A .4 N
0n N 0 MN O A A4.0%- 0 0 N 00 -4Inn MvCO l 00WN 0 A4.NI 400%0-4 4.P NV . 04.4 NO0WA 00 0I4 IAOVO M 00 WOO 04 Wvl A 0
..4-4- . 4 ... 4. A- 4 N4 .4.-4.-4-4IA mm.v-4 . -4-.N N.-4n44.I -4..4MMM.
0 .0 N NO MAI N. N0 4 A.N0 0 4NNI .0 %N40I O NI N0 A N0I AN.
o-4*.-4 mar,-4 N Lm -IA o 4 cc a oa m o an wN .-4in..4.4mIwAw4v.v4 va.n m tnN wr-mm w 0r-r MN N4NAA.NINA.4 0 0 0M M M
IAN-0 N4.0 I4. ON O4,N OrN M 0000 N M% N-I NON N N 0 N N% 0000 0ViPI IAI IA 000.4 In 10 Onr 4N VA4 V IAN w In N In N N 0
0
0 4 - vf`4 M,-4 -1 NNA .4I.4IA-4 C41 M"MMNIAN NNIAAN4W0%I4.IA..4 vIAINIA0IAIA OIAIAIA IA4.4.I
'40 wN. M re-I N.4 f -4NNNNIANOC-4N -IIAON.-l.4 NI4I4IIINII4OAI.44444I4II4
o ON.r- N.f-4 r r -0 O tr NIAI.4-I . COM t4 om wu IAN.-.-4-IIA4.0.44.IIA Noo0IA4-wiAn NI400 .WIANV-ON4.IA0 NO 4.NN -40I 0%MI4..IIA IA N 4 4.0% f0004-00N-.4c41 M"--I0% 00.-IA %0.0NI 0% 0. 4NOIAOOcqvf4O
o 0 -N-4-A4.44 '4.-4. NN " .4-fNm 4 NNAI NO.I4.USN- 4.A 4 NN - -4A.
.00m-.4 -o 00 MONAINA4.4ON A0%00-4N40 fNIA4.4.00IAN.-qIAO..4ONwA0%N4NO4 . W I0 .- IO4.0 -NOIAVn0%IqO-40,4IN -I.N .4-f.04 4.N4 -4N-4 -N4-w-.4 -4NI A4--4.-4NA 4NN .NN .- -I NA
437

NORSAR Sci. Rep. 1-92193 November 1992
'U~~~~~> >.1 a a >.10U >1 >.1' 'U m.U' VU %T~' 'U >.' 'U >.)' u
054 M 64 0 J-14 (
-r 1 0 .n- 0% m -9 m w eq m 4. U'0 w -V0%r 0ý .9 e a w. m go 00% 0n to eq m C.- 9 a0 Nl Go% -W 9 - W M 4. n e C Nr 0%n 0 to eq MQ m .m , '0 N-
0 -N 14. 0 N N 40 n 10N N O' -0e M r-W 0 M 0% N '0U 0% 0 01 .- WMN 0m r- 14.4 ", m 0 r 0 eq .- W % m00 w. N '00 N 00 M 0v .%C m 0 n C4MM'99 0,UNN9 ,e M0 0 .e % 0N04 9 OýM4.MN 0U,0. *' U,4ý ( N-4 U,ýC 9.,"M eqMý "4. c( elMfU 0~ ~ NN
ý-JM ýMýýý -W --- ý -fcm- ý r -9 q4 ý -ý ~ l can *ýn c~a
M ~ ~ ~ ~ ~ ~ ~ ~ ~ ~ ~ ~ M -U," ,eOU'0U .- .eq'0 qe MN0' cM9~ qU - 4e q40 , ,U 4 0, . - q-.-4 ,44U
eq -99 9e e-9 -99- 9 9e~99--9 eq -99-W"9 L-9- 99 e qe " .MN-9e
eqe O O40 M44 q 0'0 '0099.4.9e N9 q0 OM q .e M0 0U 0 O4 U ,U .04 -0%- .U
eqeq-9 .qeq~eqeeq e~eq.eq.9-9q.-9-9eq-9 qeqe eqeq eq- 4.4.q4. q.-9eq.- M-
v94 -U, v 4.NU rwM0U %nm eq n 0%'0inr v eqmý -4. mmU 0e .0 ,00 0~ q.4 ,.'0.40e .M9. .4e 4 9,e ~e0q-.9 .4.4~v leq-9 P o~4-9eqeq m m~ v-.- mM-9 .- W4 .-g m m me.~.~ M in w-4 i mm mA m9 . Neq-.re * .- Ae".w m e
04 - .0ivmm ,' emm % 4N4 ' q'00U ,M %.9 00 . .ie 0N4094.9Mm0 0%. ,4 ' %0 ,e
Np m U, Ns eq 0-9 '0 C4N ON Na N 0-t, Mco '00 r0M No m ,4. w co in o O '00w0 Ný U, eq MN m .00 -9 '0 '00 Uwýv , Mn0 -4.lqq-.q e e q 4.NM-9eq-9 U,-W M e~nMeqq-9.49-.4 M eq9.qq9, .- q.jq.q- .e qq-MeqM.-9
0-9MM.4 eqqqee 4.%%. (neeq~4 "-.Ieeqqq- -9. e449e ~ q Mq -e(eeM M4.m
mU, vM - - in '04 N n U, 00 MD 90 NO N 0 W NO U, U,o r- in MO '04 N 0%0r N l 0% ' 0 -0 eq MO- M &A eq %a eq U, '0 U, eq w 0U, w0 eq 04
MM MUn M 0-900 00 '0 eq 0% U, e rko omoq -9 eq&% a ýa , qr -9 ior cc4MM~q0.- 00% 00M 00M m% U, v00 00000 00 eq m0 4c nvr ow
eqUMMC4 4M C* eq 4M l l % eq cl eq m q0MUUCMC4ctMeqM'04 C4 M4eq C4 cl(4eq evM M MM4eUeq.eeq04 C- - 4C 4C qC 4 eq MM-f9C C
-39

'VNORSAR Sci. Rep. 1-92/93 November 1992
4)4 E!v
114) "HO I OM 0 l 40) VC 4)
aw ~ a 14. a. C. .
in ) WW rU)f r4 04 coa cow ,s %
4.n 4.004.00%.co 6 0, ".. 6 ,. 0
M 0%MWN r k.4.1 %nn~% "I eqýq N to.4 .
Mq~.e~qeee., .eq M eq nq .'o
4 M -.44.4 '5 eqq. C - .4ý eq r 0 .44 .4W M - M 0 VOt V InCr- 1 MM ý M - Cn 0 r
inq.~..e ýp m4 4. m. w- a rýwwý %m nm m i
.4q4M e.e .4erm q .4.e .- r 4 V- M4 eq -4
M0% r , W
M M eq4 IA % Go .4(4en Mer- -4I WN M% eq M tu
M00%q0%..0e'00rM M fn w 0 ". 00
V 4.O ivm- %v mr .44.40r'S0.'0 4,4 " 4 m W a eq in r-
V) V4In4
4) eqa lk %%r''0 0 i nIn a 00V4Chr- 0% %40 0 V. eq cc
%o toW 0 0 In 400% 0 Ve 0h 0 r'W doS .4c w w a 00 N cq'0 -'a eq0, %I'mSfn 0%0 e %A '0 I' C.I M f
q 0'0 .4e4IIU q in 'Sr'S'S A .4 eq eq 64 0m.0 00
.41 I M1'SW ý N-f" V 1a,0M0N M A 10% -Wr . 0% M'0 1 req4 4 MOLAI ,A CN4 MMM4e 0 eq 4 eq M .
V) CF.M5 M.A .104I'S%.0 W1 W$e M. M M 0 M M
'U ID
~~.r 0 C,~. ' 0 A . 4 .
t4 go
0 ~ ~ ~ . 0A. eq C4 (4 M 4MMM VC 0
0.4. .4..4 .. 4 0 I'S 439

NORSAR Sci. Rep. 1-92/93 November 1992
C: toc 4
WIC 3 1.v a (Aa c §-Ua aS to a Ju 3 1 W'~ c: 14v Va 0t
c.ka :1 14 00 -1 j :1 §g k V I3c -- 0 : u) W Vjl3 f4Eýr..U)CV E-43X4r.. WU)a ru O t. f U2 EZý0 E-f b. A - 9 ig0.3 E -b124 1C. th
C4. m V, ) 10 r- cc0% 0 C4 (n W,4 IA 4010cc0a 0.-4 C ,444 m ar-. w0o% 0o. N 4v m A -w '0% r- w a% o. m m, -r Lnocr- w a% 0o *4,4 m n ' t %000000000-4.4-4-4M C4 M~ M- M-.- M- 04 M M m 0 N o 0 N N0 00 0 00a00 14 9 4-l .49 4 M N N N N
W 4t % l& 4LI) ft kt 5 44Wk$4>
N M
a ML 44 0 0 V ko m V0 -00 0 0 n 0% r- 0.4W.N0-%a 44,N0 -4..-W 4Arm0 - % .4n0M -ý'0N M(4440, N.-4r44-'0A00.1lA0,9.-r r0 4444 N 40 4
-W mow -m mmvr m Nm -r0%r-0tq%Neo r- 0mowwwr-0v0o4,On '0'00%4,4,r-w .404.mwo, NopN . .4 .. I.I.4 4.19.4 .l4 C 4 . 4I4C14,94 - .. I-
0 (7 4 0 0 -0 t o,0 0%~nW % r- t0 o "M'0 N000kn~-O- IC A.)C W4
-4 N4 M -4 In4-49- C-3 m4. m9 m .4 C4 M- M4- -4,, n m-4
0 r4 0 0 .- 90 441r O O OO N . % .. '
47 Wr V 0 h% 0 0% OM 4.04Mw ,0m% r- 04,nV 0 M -44l4 r 0lkn 0mCh%D r-V ,0 %-0 M m M04 U0N"aM -0- VA
-j %o v 9 .99.. oN. .9 .9.9 w9.. .1nr 4-r .1. Nm .9.9irt~r c t N ,- w wwi
:3 o ,04 4N 4N % % 44 0 0 0 0 .0 , % , % .4 0 0 % ''.9 0I -a 0 V- r 1a% N0% en. 10..9. t-.4 M.. m499.. "9-.. ( aaN- V. MVN . W r- C .-V *( 4 r N -~4. -r C .-4-.-4
W , 0 4 0 . % 0 4 0 I 0 % -0 0 4 N 0 . % A I 4
m -% mwwN-o n- m99. w..4.. w9. .. , -.. r-N4- i om..4 waa m4 qp4 v9 -4; m v w-& a, 4. o9 .o9- o .9co i
N.0" 400r-N00N40%4,%WN0A4%4000440r-4.O00%0N0
440

FNORSAR Sci. Rep. 1-92/93 November 1992
4.44
05-0toc140110z - w0w
'a VV, wo Z-0-0
E. E- W t n C-& .4w
ILI4 0 -~~ V C 5 ~ 40 0 .4~~IV ~ V -4J~
04 m
m in m v ,Liwmr nmm m nt ow- n(, o-4r - %a n owor nomoa nooa
10 o00t Y 00QV 1 -6 7)ok 0-I N I NA O 40 N M I~I40 M M00 r- VO M n 0 -W N.D4MM r WOn0 ONNMIA mDo1~~e 01NM04M4I4Iý1I0~M I~ m-OI N4 .014 N4-.4DN1-N qDin .N N CN4.IN N-4N N M. 4-N .N4 N .4 4-N N N-M CM-N
N N4. m .4 .44--.4 M 4 m 4 -M N.4.- .44 N 4-I -
N . .1 4 .4 m -4 ID .4.4 .v 4 -4 -4 4 4 m 4 4- .
N -4 .4- . . N -f N .- 4 .4cq m- " -4- 4 -4m---
4.4 ~ ~~~ .4a -I, "m 4 .M 4 . 4 -44 4 -
ID~~~~ ~ ~ MNAD4 NA N4M 04 W 0400D0 M4 *00MN 4I N 0 N NA .
.4 .44. 44.N -4 .4 .N. 4 .. 4 .44 . .-
Nj o NA 4II M I M I NDDAD O I0I.N1 II O OII O UO O1f0O O
L4 . 4. 4 4- 4 . 4 .. -ID$4OA1D104I0IIAI0 IO O44 .IOD IIDOD M IIOOD NA .I0
04M -- 4N . 4 N. I . 4 . 4 M.
m (I NN OIn wm 0r- - wW w0 V v0 M -. o 0n Wo oID I00ND444100Nin noo m- MoMa n m o mmam rNUIa n w a,o4-. 4 4 . 4. 4 N- -N .
4q o vamNw ooooim o cyNI mcD. a DN4I a01004m mDIoIoNN.4IA0101D o mint-oMw V wAoIDDoaIDNIDNoo
o4 ". Ný- -4 C144N4 -N .N .4. 4
M o MN M 06m NNIwvora, o mSID0In m .4000 to "- o ID-Wwtn-4MIDIAo m o wooDAN0 nMNNMIDU'Ia4.-I)A
4.41

VNORSAR Sci. Rep. 1-92193 November 1992
00 00 -0 00'0'0~00
00 0' WO0 V00'00W 1 10 :1 4 0~ V z~0' '00 c0V U IC ~ . OC 2V~ 0 14V VW IOM ~
N4 tC-4. Mn NO 1.a M C4 04 M 4 fn ,4InC 0 0 % 0 .4 N C' 0 f I0 0 0 .4 4 c C4 C4 C4 4(4 0 C4 0 . -N MC M (nC Onr 0 0 % 0 .-> 0 " 0 441 N N4 N N4 N4 N4 Nq N- ý4 tit 0000000 .04t t.4. .4 .- -. N N N Np N Np N N N 0 , CM . 000000000.M4MM.M.M.4M M4
eq "N.4NCC,,4 NNN NC NN N 4N NW . N. N --44N- WIN NC, 4
V .4M .4.4 w 4 In4. .4 .4,... .Wr -0 A0NN 4 N 4 V4 w-- M 0 r- '4...4M..4 N
N .4 .444 . .. 4. 4 -4fl4.4r C4 .. 4-.4 .4
0-% 3 0 O 0 % 0 . O % - In N O 0 - C 0 ~ N C . q
N ..- .4-N .4 r4 -4 . In N N.44. M44 <4 .. C4.N
.4. 4 . . C N 4 .4.40 N .M4 .4 -4-44.
.4 ~ ~ ~ ~ ~ ~ ~ ~ ý .4. %n,. 4 C N 4 . 4C N C4.. 4 M 4 .
In V04 4N( n 0%. '0In000 . 0 0 4 . e nO ( ! - I 0 Nn0 WM0Wt04,Dýwmmw amrcýac,% n nrofo "00%0 4.m -n mwvmm N o -w Ln.4 .. . N4M .4 .4 N -4 4. 4 C414-4 e 4 M.44( t 44. .4 M4 - .4-Cc vý
m4 w4. in . N- .o4. v4 mcmooomwwy)w- 4 c .w 4 t-4 i r(4 W 4.n4.4 n ý- ON -44 V.4 r 4 M4. 0 .404ý -0%M%0Mr-
.4cq f M~4l M44C. .4ý N44 . 4 MN 44.44CA 4.cqwl .4 M C4 . 4 .4 C4 ,-MN
C4-wwvvmo o wOC3C0 44I0%0C n0m0pa'v0( ow vmNmN0 m w rNv in n mO4 i n c o 0C, nN a m mo %a n0v us
41
'f4-04 N ýmc ,om t- o% (0 0C0 NM 00 ,Ir-0oCvCwNv-0o o vr--w%a '-4o.In'v0N onr- n.- q0- %n *.voc4oinw-ma r.-q
0C, 0
%P
'0 ~ ~ ý 0 444. 4 N a N . 4 . 4. N N 04 .4 . Na N .4.. " 4 M 4 " N ... 4 .4la -
.4 ~ ~ ~ ~ ~ ~ ~ C -4 C4 N (4 . 4 ~4- 4- 4 ... 4 -4 C
442

VNORSAR Sci. Rep. 1-92/93 November 1992
o *ý0.
U4)
0 cd
O"C'..i 34 0 u -
1404cf . v 0 0 0 JD
0NN NN ' M. 1. E;l
w ) r i niiifffiiiifffiii 0 0 M ,0I 1 0 0
C4
10 M..lN O I0 Q 10 0T: ''0'0NO' NO%.-410.-4 4 a, i. f
Ch r % ,a n( NN'0 *0 w in %0 r- Ch r M0 0 Ql G
N0 C h0r - 0- --- a -InMVC 4- a, 0%, a, 04
N M 0 0 W - r O N I 0% -V 0% Nr .-4.m 0 10 a, '04.N 4 4 CIO-4. 4 4 N .4 .4 0.
-4 -40 if ' .1 4~0 0 0
en N o * .4
N 1
V 4 Nf .4 -4 0
In M1 OD4 -4 M N M o1 D4 0 4 M 0
-4 -4 -4" -4 4 M 4 -4 fn0
%N %N NIIýN 4 V N.4 V0 V0 a, Ch ND LI
v4 -44 -4 o -h 0
14 0 0%-L- ~L4 ~~ ~' ..0 MC 0Mr -0C hý
NýM .4 .4 "41 .4 ' -4 1
.4 ~ ~ " .41 .44 t'. -4N "4'
z 1 a M nV% .4 1..4. 0'4 qhl 0 .4.~ -4 M0 V4
.4 Q4 .- 4% .M IN M 4Mc4 (4 C4 0. 11 NA
43 N 43

VNORSAR Sci. Rep. 1 -92J93 Noveinber 1992
04 94
.t V. 02 c1 4).
>4 >4 >1 >4 >. >414>
V 0 u'o> >.a~ wa 000 >%so4 m4 a40 >"a a,0 al 'a$4 'o . o404 0v odw t >>04 0 to w' >404 0 4.0 >40 >4>4 w o UdV to >>04 01 M 54 M M->04) '"a >410 'am40 04 k' 04140
Aj 0 - 4 c 0-0 c 04~ 4 0 3 1O c4k- N f: j Z4 N0 &. 040-4 V g 4A W0r 00 .M j404 $4 100 r :lie VA $4,d N 1 M 6 VA r$ 400 j :- Nt C 4 InU 40 !- 404 .4) N M 22 A
000000000M %0 -4- c44- at0.Nf 4wLD ýw0 4(w n% -c F .4 t44 Nn Nr Nn No N, No N N N M 00 0 00 4 .- e. .4.. r.- co c- N N N n NW LN N
$4$ 4$ 4$ 11 LW$4t1 4W> 40 d> 1 1> .> .>:,1 ,- > 1> 1> 1 1> ,,>0.0. 0.0.0.0.0. 0. 0.0. 0.a, 0..04
<4 Q~ 4 4 4 0404-C-C C C C C <-C U4-C-C C c C C - 4o 4z xX 2x Z MZ XZ ZM XX X XZ
O% C
r- co40 0 0% 4 0440,0 M 0,0 40MN44W 0 MM40 r40N4I4040MI "ANC, U40,MM
N . - ..4- -4
N M .4 .4 W4 kn %D w -0M i -Ni qf 4 - l nt 0 -00 n r n0 ,NC4 r-Mý(
In .4 C4 v Mr N .4 f- ID.
M-4 nww01 -M0r , 0M0M , Mý Pr ýwc -4 -4 - M-4n- -4
0 0 M44000M( nM' -fm w l 0 * o - wv- winn IA04 N4MN 0w40 %0% %n ra wv0 Wrr.OA 4M4N 0 r. MCIO M -44 - -4-4 M4-4 N -4 -4 -4M 14 MM -4 C -4 ýq 4.M , -4
.4 .4 .4 tn00 4w -4 r- in0% 4 N 4,-M4M 4 M ýr *t 4 00vW 000r a MC4 '-rw C *44* %M 'r 4'
M ~ - CN (%% 04 M 04 4 440 MN %M 04 M 0M- M00-40%M 404404V"4400400%
.1 ~ ~ C fn4. C4. M4 4-44 M. N N N N4.-.- - - (44.,-. -- N.4 M
*1*
.11
4) o% 400M0% M0 0 00 4 0 0 N44M N0 N040A 0 444M0~0A0
'0~~~ ~~~~ ~~~~~~~~~ 0w W.0 V4. w. M-. M- .M N44 N M4 -M N-.4-.4 N 4 Min. -0 -0A0 - -NM00404--40-444N-AM4-00 -4M44-
o 0 N .4 4... 4-4-4 .-4 .- .- NN .4.44 . N-4.4 4 N4.4 44.

NORSAR &ci. Rep. 1 -92/93 November 1992
.4 Q24 0 l s00w
00 Ol >"O fe fa on
'04 4 -140 4 A 4V4 m0 >44 zO -. 4 . V0 >' 40 41 44 400 4E- 40 r 3s a as = '
M4 v44 0- w4' r-waa0>4MV nar-wm0 >4M>4q'0 100 f- g 0, c V >4>m 4 io w m0 oE4>' WV m mv n10 wm
:1 10 e D c 04.4 ('4 M~ co Wi n0-0 . 11 ni -V w4 co 400 0.4 Nri C 4440 M N0 0400 M40.(' rý4 n in '0 as Go0040inco.4 ý ('4 m~ m m(4 C>04La N 4j Cq C 00 0 0 0.-........ - C, UN M M NM ('4 N ('4 N4-'4C 4ýý" ý40000000004.q4.,4.4.,4.4.4.4.4. c4
C40
C4 -4
co 0N044iN0.4404N44N4~4NN0i4004440'0444000.440
owcoc m4 ".w ac v4 c r. o4 -a ).4 4o c4r % -m owm - n m4 c -. 4- n nr w w<
N 4 .4 .44 - -4 M 1 ýV ý 4 -4
4 -4 .4 C 40 4ý C 14 C3caMýC4ca1 C.4. .4 n.4 .4.4ýýn .4m~ r .4 --
V 4 0 4 M N C4C - M41N .4cý4.4 .- 4.4.4 N4 C4 4.4 M4 44m mm M
0.4.4 -C4" .4 ,-4 4 c
'0 C4
V 4 . 4 4, . .4. C4. .4 4 .. 44
M V ovvsmm mw*q 0'44.000 0N4ý0N4- i440n mýi4440440nc4-040440wm-N iN40N4004444in
M. .o -wi .4 m4IN w4. v .4o r- orav n %on.44.44 mm4 o .4.4. m". o .40ýýnw- o womm n m
44 ~ C --444W00N4 44N0040eN0N44'440 'N0'Ui N0W0N0 i44N i(M.m4 n .4 o. .4nr-'0 .4 m 4N o .4~m~ M-4-4-4 0 -em ~ v44. oc% .4wcf .4.o4.4.4 -w.4
.45

NORSAR Sci. Rep. 1-92/93 November 1992
>44
A o ~>Mt a. >45>.to . 0>.>. 4 t 5>10 44 >.Io 4 a to >"a 4 '5>.am>.tot 00 >.,0 :), No~I 45 45 >,:".g 010 o >4'45 . >4V. >5 >4~. >
MI to~' 3 z x 14 V :1' ~ 5 g 0 0 2 : 14 a . 44 :
e4 em Q M C40 re co tvM e 0 '. 0 C , 0 LA C>0 r 0'0 C> -4 M, 4444 I'C00 4 M C4, (4 C404 (- 004 .-4 M M , IS 4 0 0 4000 .- - --
45 C
C4 c
C4 C I
45 r04,4 00w 00 044'44 0 N000 44,0A 40A0-4.-LC4 M
N 4 '.4ý -ý M 4 w0- N4 N "M M N-44 1
-N 0 ý4- r, i nr , r oi o0vm4w-ov n0 '.- ..n4t wwwmo ý, no
.4 - 4 '4, '4.4 .4 '4 - - c-
4 4 0 ~ 0 0 - N 0 L e , - , A , 0 N 0 N A 5'.4 '. 4 C4- 1 . 4 .-
-4 -4 M4 --- - - - - 4
M n- - N. O .1 -o. -4 M -Mv r 4 a, - -4 0 10NM o v
LA NLAO*05040OqNN404000 4 0 , 0 50 4 .-
MMMM" '4 . 1'4 . .'4 N . 44 . ..
* L A 0 000 N 0 N N - *4,4 ~ 04 A 0 N N 0
'.4 1.-44 ,--4.-.4-4 '.4 .4N.4 ~ '4-4. 46 N N - 4.4 4 '. '4 . .N-

NORSAR Sci. Rep. 1-92J93 November 1992
M'a~ T, 'a #af - 4
a s40 u .10 9) c N0 5210-0 45 w? 30: =E- rL.V 00 E2V A&' 14On2 E2 00 V 0
*O N M UU)'0 4 04 0 0
C4 NM (n -4 M 0 0
0 40 >. I
~ ~fC2C22UUU2O E4 E-. -CL
a, ~ o e M0ýMwa0MUl ,a0 0 f N 0ý 0
w %'oo m U.: 'o o o m in ' N o'wa 0
o n 0 , 1 0 *14 4 .
-4 "~-N N 64 4 0 O -4 r, Lm '0 0,
Nm -In-4-4 4 N N
C-44
Go 10 w r- Mn64U,6MONM O OM 0 N '0 '0 0 U,
-0 NN -4 co
-4 ~ C eq -V4 @4
-~~ ~ NN4N ~ -
.4.44 %n -c n4 '
-4 "4 NNýN n4 *
.4 N -4 M~NUM.-4 00 M 4 -4 N
" v ~'0',0) O4 0 NM aP. 0004WN"0000 cyS M 04M a,
V 0 MMenM.-4N , wVO -4'0 0 '0 .
.c .
'0 64..4'0nt VVVIM.-OI 00000 %0 MU, N 4.o 10 44-4 M .- 0 '0I -
o *,4.4. cN* 0n 0 *-W
N0 NN .(71 c
U, 0 14N0M'0 M w M00000 U 04M 0 * 04 0
1. 0 4 V - - 0N M 0 M. -0000 M 40
-~~~y 0"4U.44 4 -0
V 10 '0w 1 1 000 0w LM)- MU6''0-6N 4N'M O M 10.- .
M. 0 - .4N- C4M0 M C4 CA (4 0 L
47

NORSAR Sci. Rep. 1-92/93 November 1992
3.5 IMS operation
The Intelligent Monitoring System (IMS) was installed at NORSAR in December 1989and was operated at NORSAR from 1 January 1990 for automatic processing of data fromARCESS and NORESS. A new version of IMS that accepts data from an arbitrary numberof arrays and single 3-component stations was installed at NORSAR in October 1991, andregular operation of the system comprising analysis of data from the 4 arrays ARCESS,NORESS, FINESA and GERESS started on 15 October 1991. As opposed to the first ver-sion of IMS, the one in current operation also locates events at teleseismic distance.
The operational stability of IMS has been very good during the reporting period. In factthe IMS event processor (pipeline) has had no downtime of its own; i.e., all data availableto IMS have been processed by IMS.
Events automatically located by IMS
During days 092, 1992, through 274, 1992, 15,158 events (local, regional, teleseismic)were automatically located by IMS. This gives an average of 82.8 events per processedday (183 days processed). 56% of these events are within 300 km of nearest station, and
69% of these events are within 1000 km of nearest station.
45.8% of these events were defined by 2 regional phases and 8.9% were defined by 2 tele-seismic phases. 84.8% of all events had 3 defining phases or less. 18.4% of the availabledetections (phases) were automatically associated to events.
Events located by analyst review of IMS results
During days 092, 1992, through 274, 1992, 11,770 events (local, regional and teleseismic)were defined following analyst review of IMS results. This gives an average of 64 eventsper processed day (184 days processed). 67% of these events are within 300 km of neareststation, and 77% of these events are within 1000 km of nearest station.
47.2% of these events were defined by 2 regional phases and 4.6% were defined by 2 tele-seismic phases. 77.7% of all events had 3 defining phases or less.
81.4% of the events had regional phases only. 15.9% of the events had teleseismic phases
only.
Phase and event statistics
Table 3.5.1 gives a sumary of phase detections and events declared by IMS. From top tobottom the table gives the total number of detections by the IMS, the number of detectionsthat are associated with events automatically declared by the IMS, the number of detec-tions that are not associated with any events, the number of events automatically declaredby the IMS, the total number of events defined by the analyst, and finally the number of
48

NORSAR Sci. Rep. 1-92193 November 1992
events accepted by the analyst without any changes (i.e., from the set of events automati-cally declared by the IMS).
Apr 92 May 92 Jun 92 Jul92 Aug 92 Sep92 Total
Phase detections 27729 31278 34017 43251 43331 37724 217330- Associated phases 8324 8225 7702 8603 7543 8673 49070-Unassociated phases 19405 23053 26315 34648 35788 29051 168260
Events automatically declared by IMS 2530 2493 2344 2600 2346 2665 14978
No. of events defined by the analyst 2078 2032 1802 2040 1856 1854 11662
No. of events accepted without 1463 1717 1580 1841 1532 1503 9636modifications
Table 3.5.1. IMS phase detections and event summary.
U. BaadshaugB. FerstadB. Paulsen GammelbyB.Kr. HoklandL.B. Loughran
3.6 GBF operation
Events automatically located by GBF
During days 092, 1992, through 274, 1992, 11,354 local and regional events were locatedby GBF. This gives an average of 62.0 events per processed day (183 days processed).68% of these events are within 300 km of nearest station, and 89% of these events arewithin 1000 km of the nearest station.
75.9% of these events were defined by 2 regional phases. Teleseismic phases are currentlynot used by GBF. 91.1% of all events had 3 defining phases or less.
16.4% of the available detections (phases, including teleseismic) were associated toregional events.
T. Kvserna
ii . 49

NORSAR Sci. RPp. 1-92/93 November 1992
4 Improvements and Modifications
4.1 NORSAR
NORSAR data acquisition
No modification has been made to the NORSAR data acquisition system.
The data are recorded on a 30-hour circular disk buffer on the IBM system, and archivedonto 1/2 inch magnetic tapes. In addition to this, the data are now regularly transmitted toa SUN system for recording on a 48-hour circular disk buffer.
NORSAR detection processing
The NORSAR detection processor has been running satisfactorily on the IBM 4381 com-puter during this reporting period.
Detection statistics are given in section 2. In addition to the detection processing done onIBM, the dp program is doing regular detection processing on a SUN system, using theunix-based circular disk buffer (see below). A detection SNR threshold of 20.0 triggersautomatic saving of waveforms into CSS 3.0 data files.
NORSAR event processing
There have been no changes in the routine processing of NORSAR events, using the IBMsystem.
Routine event processing is done on a SUN computer using the "old" IBM time delay cor-rection data base that has been converted to SUN/UNIX. The automatic solutions pro-duced are equal to or "better" than the old system with a lower false alarm rate. Alertmessages are sent USGS for events above magnitude 5.5.
NORSAR refurbishment
As reported earlier, the main problem in this refurbishment is to find 24-bit A/D convert-ers with small power consumption. Manufacturers have so far not been able to presentproduction units for evaluation. One exception has been Refraction Technology, which hasallowed us to evaluate two prototype units. Testing is still going on, but the units do seemto perform within specifications. By the writing of this report, a new digitizer from Tele-dyne Geotech and one from Science Horizons have been received for evaluation. All threeunits will now be put out in the field for power evaluation and comparison with the NOR-ESS system.
K. so

VNORSAR Sci. Rep. 1-92/93 November 1992
4.2 Regional Arrays
Detection processing
The routine detection processing of the arrays is running satisfactorily on each of thearray's SUN-3/280 acquisition systems. The same program is used for NORSAR, NOR-ESS, ARCESS, FINESA, GERESS, but with different "recipes". The beam table forNORESS and ARCESS is found in NORSAR Sci. Rep. No. 1-89/90. The beam table forFINESA and GERESS is found in NORSAR Sci. Rep. No. 1-90/91.
Detection statistics are given in section 3.
Signal processing. Phase estimation
This process performs f-k and polarization analysis for each detection to determine phasevelocity, azimuth and type of phase, and the results are put into the ORACLE detectiondata base for use by the IMS.
Event Processing. Plot and epicenter determination
A description of single-array event processing is found in NORSAR Sci. Rep. No. 2-88/89, and NORSAR Sci. Rep. No. 2-89/90.
New processes
The data from the Apatity array are acquired on a SUN-IPC system. Detection and signaland event processing are all performed on the same computer. The new array requiressome tuning of the recipes before data will be routinely put into IMS.
J. Fyen
!:51

NORSAR Sci. Rep. 1-92V93 Novembe 1992
5 Maintenance Activities
5.1 Activities in the field and at the Maintenance Center
This section summarizes the activities at the Maintenance Center (NMC) Hamar, and0 NDPC activities related to monitoring and control of NORSAR, including monitoring of
NORESS, ARCESS, FINESA, GERESS and Poland (KSP) partly.
Activities involve preventive and corrective maintenance, modification of equipment,installation planning (Apatity, Spitsbergen), and finally installation (Apatity).
NORSAR
• Visit to subarray in connection with power outage* Locating cables* Replacement of SLEM power supply* Communication check in connection with a bad communications cable* Cable repair/splicing• Replacement of SLEM• Replacement of modem
NMC
0 Preparing the Apatity and Spitsbergen installations0 NORSAR upgrading activities• Other tasks related to repair of equipment
NORESS
• Cable location in connection with road work* Replacement of Hub card
ARCESS
* Replacement of clock, antenna and amplifier* Replacement of fiber optics* Replacement of preamplifier A2 outdoors and D2 indoors* Fiber optic adjustment
Apatity
0 Representatives from NTI (Norwegian Telecom International) and NORSARinstalled NORSAT B earth station and SUN workstation (May)
& Representatives from NTI and NORSAR installed array equipment in the field andon the premises of the Kola Science Centre in Apatity (Sept)
52

NORSAR Sci. Rep. 1-92/93 November 1992
Subarray/ Task DateArea
NORSAR No visits to the subarrays April
NMC NORSAR upgrading and preparatory work related Aprilto Apatity and Spitsbergen installations
ARCESS UPS restart April
NDPC Daily check of all arrays has been done, i.e., NORSAR AprilNORESS, ARCESS, FINESA, GERESS and Poland(KSP,SFP).SP/LP instruments have been calibrated. FP and MPwere measured and adjusted (when feasible from NDPC)when outside specifications.
NORSAR
03C Cable pointed out for the landowner. Loop test in Mayconnection with verification of the communicationperformance.
02B Visit in connection with a power outage 25 May03C Adjustment of V, NS LP-seismometer 1 May06C Adjustment of channel gain SP 1,2,3 and 5 18 May
Replacement of LTA card ch 1,2
Apatity Representatives from NORSAR and NTA installed MayNORSAT B earth station and a SUN workstation
NMC NORSAR upgrading MayPreparing the Apatity and Spitsbergen installations
NDPC Daily check of all arrays, i.e., NORSAR, NORESS, MayARCESS, FINESA, GERESS and Poland (KSP).NORSAR SP/LP instruments calibrated every week.Free Period (FP) and Mass Position (MP) have beenmeasured and adjusted when outside tolerances (whenfeasible from NDPC)
Table 5.1. Activities in the field and the NORSAR Maintenance Center, including NDPCactivities related to the NORSAR, NORESS, ARCESS, FINESA and GERESS arrays andthe two 3-component stations in Poland (KSP, SFP), 1 April - 30 September 1992.
53
'•-•l Em Imm I [] m m m m un mln ..... m . . ,

NORSAR Sci. Rep. 1-9203 November 1992
Subarrayl Tisk Date
Area
NORSAR01B Replaced SLEM power supply 10,11 June
Adjusted SP channel (gain) 2,3,602B Replaced FP motor 15 June
Adjusted channel gain SP ch 5,6
01A Communication check in connection with a bad cable 16 June01B Cable SP04 damaged and temporarily repaired 16 June02B Adjustment of MP/FP V, NS, EW LP seismometer 19 June
Also observed that "TEST ON" indicator went onin connection with supposed spurious commandsin the ICW flow from NDPC, cauing misadjustmentof the 6 FP/MP motors
ARCESS Replaced clock, antenna and amplifier. Also replaced 17,18 Junefiber optics B4 A2 outdoors and D2 indoors. ReplacedDHL70 preamp. D6 outdoors. Adjusted transmit fiberoptics Hub.
NMC Preparatory work in connection with the Apatity and JuneSpitsbergen installations
NDPC Daily check of all arrays, i.e., NORSAR, NORESS, JuneARCESS, FINESA, GERESS and Poland (KSPSFP whenwhen running).SP/LP instruments calibrated. FP and MP weremeasured and adjusted, and those outside specificationswere adjusted (when feasible from NDPC).
NORSAR
02B Adjustment of channel gain SP 1,2,3,4,5,6 13 JulyAdjustment of channel gain LP V, NS, EWAdjustment of MP/FP V, NS, EW seismometers
04C Adjustment of channel gain SP 1,2,3,4,5,6 14 JulyAdjustment of channel gain LP V, NS, EWAdjustment of MP/FP V, NS, EW seismometers
02B Adjustment of channel gain SP 1,2,3,4,6 17 JulyAdjustment of channel gain LP V, NS, EWAdjustment of MP/FP V, NS, EW seismometers
Table 5.1 (cont.)
34

F NORSAR Sci. Rep. 1-92V93 November 1992
Subarray/ Task Date
Area
02C Adjustment of channel gain SP 1,2,3,4,6 20 JulyAdjustment of channel gain LP V, NS, EWAdjustment of MP/FP V, NS, EW seismometers
02B Visits in connection with power outage after lightning 21,28 July
03C Adjustment of channel gain SP1,2,3,4,5,6 21 JulyAdjustment of channel gain LP V, NS, EWAdjustment of MP/FP V, NS, EW z,eismometers
NORESS Pointed out cables for the landowner in connection 7,8,9,10with road work July
NMC Preparatory work in connection with the Apatity and JulySpitsbergen installations
NDPC Daily check of all arrays, i.e., NORSAR, NORESS, JulyARCESS, FINESA, GERESS and Poland (KSP).Weeks 27, 28 and 29 SP/LP instruments havebeen calibrated. Free Period (FP) and Mass Position(MP) were measured and adjusted when outside tolerances(when possible from NORSAR, Kjeller).
NORSAR
02B Adjustment of MP/FP V, NS, EW seismometers 13 Aug
O1B Replaced SLEM and modem 20 Aug
NORESS Replaced Hub interface card 12 Aug
NMC Continued installation planning in connection with AugApatity and Spitsbergen installations
NDPC Daily check of all arrays has been carried out, i.e., AugNORSAR, NORESS, ARCESS, FINESA, GERESSand Poland (KSP) and Apatity (partly).NORSAR SP/LP instruments calibrated weeks 27, 28and 29. Free Period (FP) and Mass Position (MP)have been measured and adjusted when outside tolerances(when possible from NORSAR, Kjeller).
Table 5.1 (cont.)
55

VF NORSAR Sci. Rep. 1-92/93 November 1992
Subarray/ Task DateArea
NORSAR No visits to the subarrays Sept
NMC Preparations for the installations in Apatity and part ofSpitsbergen continued Sept
Apatity Representatives from NORSAR and NTA satellite Septoffice arrived in Apatity 22 September, and startedthe installation the following day. The work continuedthrough 30 September
NDPC Daily check of all arrays has been carried out, i.e.,NORSAR, NORESS,ARCESS, FINESA, GERESS andApatity. NORSAR SP/LP instruments calibratedevery week. Free Period (FP) and Mass Position (MP)have been measured and adjusted when outside tolerances
(when possible from NORSAR, Kjeller).
Table 5.1 (cont.)
5.2 Array status
As of 30 September 1992 the following NORSAR channels deviated from tolerances:
01A 01 8 Hz filter02 8 Hz filter04 30 dB attenuation
02B 0903C 0406C04
O.A. Hansen
* I 56

NORSAR Sci. Rep. 1-92/93 November IM
6 Documentation Developed
Fyen, J. (1992): Processing techniques for regional array data, in: Proceedings of theGERESS-Symposium, Waldkirchen, Germany, June 22-24, 1992.
Kvwma, T., S. Mykkeltveit, F. Ringdal and J. Fyen (1992): Concepts for processing ofdata from a network of regional arrays, in: Papers presented at 14th Annual Pt]DARPA Seismic Research Symposium, September 16-18, 1992, Phillips Laboratory,Hanscom AFB, MA, and Defense Advanced Research Projects Agency, Arlington,VA.
Ringdal, F. and T. Kvrma (1992): Continuous seismic threshold monitoring, Geophys. J.Int., 111, 505-514.
Ringdal, F. and T. Kvrma (1992): Processing of regional seismic array data using the con-tinuous threshold monitoring technique, in: Proceedings of the GERESS-Sympo-sium, Waldkirchen, Germany, June 22-24, 1992.
Ringdal, F., PD. Marshall and R.W. Alewine (1992): Seismic yield determination ofSoviet underground nuclear explosions at the Shagan River test site, Geophys. J. Int.,109, 65-77.
Ruud, B.O., E.S. Husebye and S.O. Hestholm (1993): Rg observations from four conti-nents: inverse and forward modelling experiments, Geophys. J. Int., in press.
Semiannual Tech. Summary, 1 Oct 91 - 31 Mar 92, NORSAR Sci. Rep. 2-91/92, NOR-SAR, Kjeller, Norway
Tsvang, S.L., V.I. Pinsky and E.S. Husebye (1993): Enhanced seismic source discrimina-tion using NORESS recordings from Eurasian events, Geophys. J. Int., 112, 1-14.
57
. _ _... . . . ... .. ... _.. .. . . . .. . .... ... . . ... .

NORSAR Sci. Rep. 1-92N93 November 1992
7 Summary of Technical Reports / Papers Published
7.1 Extensions of the Northern Europe Regional Array Network --New small-aperture arrays at Apatity, Russia, and on the Arcticisland of Spitsbergen
As of the summer of 1992, the Northern Europe Regional Array Network contributingreal-time data to the NORSAR Data Processing Center comprised the high-frequencyarrays NORESS and ARCESS in Norway, FINESA in Finland and GERESS in Germany,as well as the two three-component stations KSP and SFP in Poland. In addition, datawere available in an off-line mode from a three-component station installed in Apatity onthe Kola Peninsula of Russia in June 1991 (see Mykkeltveit et al, 1991). The transmissionof continuous data to NORSAR via satellite from the two stations in Poland was discon-tinued on September 30, 1992.
In September and October 1992, two new small-aperture arrays were added to the net-work. These are located near Apatity, Russia, and on the Arctic island of Spitsbergen. Thiscontribution offers technical descriptions of these two new arrays and their integration intothe network. Fig. 7.1.1 shows the network as of 1 November 1992. From approximately 1January 1993, all data from the six arrays of this network will be processed jointly in theIntelligent Monitoring System (IMS).
A new small-aperture array near Apatity, Russia
As described in Mykkeltveit et al. (1991), a digital, high-quality three-component stationwas installed in Apatity on the Kola Peninsula of Russia in June 1991, as part of an agree-ment of scientific cooperation between NORSAR and the Kola Science Centre of the Rus-sian Academy of Sciences. During June 1991 - June 1992 data from this station wererecorded locally in Apatity and copied to cartridge tapes that were sent to NORSAR.
During the summer and autumn of 1992, several significant extensions and changes weremade to the installations in Apatity. In June, a dedicated satellite link, based on NorwegianTelecom's NORSAT B system, was installed between NORSAR and the Kola RegionalSeismological Centre (KRSC) in Apatity. A computer-to-computer Ethernet connectionwas established over this link. This enables NORSAR to retrieve continuous data from thesystem in Apatity. At the same time, several SUN workstations for data analysis wereinstalled, and a NORAC array controller (Paulsen, 1992) replaced the PC system installedin June 1991 with respect to the data acquisition function. The configuration of the three-component station was otherwise unchanged. From June 1992, continuous data from theApatity three-component station are thus stored on Exabyte cassettes at NORSAR.
In late September, a small-aperture array was installed approximately 17 km to the west ofKRSC in Apatity, at the location indicated in Fig. 7.1.2. The geometry of the array isshown in Fig. 7.1.3. The instruments are placed on two concentric rings plus one in thecenter, and the aperture is approximately 1 km. All sites are equipped by a short period
SB
a S --III l I I

NORSAR Sci. Rep. 1-92V93 November 1992
vertical seismometer of type Geotech S-500, and the site at the center of the array has inaddition two horizontal seismometers of the same type.
The field work in preparation for the array installation work was organized and conductedby the KRSC and sponsored by the Kola Nuclear Power Plant (Kola NPP). The Kola NPPis located approximately 30 km southwest of the array (see Fig. 7.1.2). An assessment ofthe local seismicity is a topic of interest to the Kola NPP.
At each of the seismometer sites on the A- and B-rings, the soil overburden was removed,and an iron tube with a bottom plate was placed in wet concrete on top of competent rock.Iron rods attached to the underside of the bottom plate ensure the coupling of the tube tothe concrete and underlying bedrock. The vertical seismometers were then placed insidethe tube, resting on the bottom iron plate. Power (commercial power is available at thecentral housing of the array) is provided to the seismometers via trenched cables, and thesame cables are used to transmit analog signals from each seismometer to a centrallylocated housing in the array. The three-component station at the central site AO is placed ina shallow vault.
Fig. 7.1.4 shows in detail how the data from the new array are acquired at the seismometersites, digitized at the central array site and then transmitted via three radio channels toApatity where the NORAC array controller collects and timetags the data. The digitizersused are of types Nanometrics three-channel RD-3 and six-channel RD-6, which are both16-bit converters with gain ranging. Short-period data from the nine vertical sensors of thearray are sampled at 40 Hz. The amplitude (displacement) response function of the short-period.channels is given in Fig. 7.1.5. Data from the three seismometers at site AO aresampled at 9O Hz, thus providing a high-frequency three-component station integratedwith the array. The seismic data from the vertical sensor at site AO are thus sampled bothat 40 Hz (and used in the processing together with the vertical sensors of the A- and B-rings) and at 80 Hz (and used as part of the high-frequency three-component station). Asshown in Fig. 7.1.4, there is a certain redundancy in the data acquisition, with data fromsensors B2 and B3 being represented twice in the data stream. This ensures that data froma useful array geometry are received even in case of failure of one of the digitizers or oneof the radio channels. Also note that timing signals in the form of second marks arerecorded as a separate time series, using one of the available channels. Fig. 7.1.4 alsoshows the three-component broad-band seismometer installed on the pier of the basementof the building of the KRSC in Apatity. The seismometer is of type Guralp CMG-3T, andthe data are digitized using a Nanometrics RD-3 digitizer. Timing is provided throughoutthe system on the basis of reception of GPS signals, as shown in the figure.
Fig. 7.1.6 shows the current configuration of the data acquisition and analysis system atthe KRSC. The figure shows the local Ethernet established, the NORAC array controllerthat receives data from the four digitizers, three SUN Sparcstations (kan, imandra andumb) and a SUN X-terminal, and the Cisco router that provides the gateway connection toNORSAR via the dedicated satellite link. Also shown schematically is the multiplexingequipment used for a phone/fax connection via the same satellite channel. IDU is the satel-lite indoor unit containing the modem and other communications equipment. The systemdescribed in Fig. 7.1.6 allows the staff at the KRSC to perform on-line processing as well
59
-0

NORSAR Sci. Rep. 1-92/93 November 1992
as interactive analysis of the data recorded at Apatity. Using the satellite link, all datarecorded at NORSAR from the other arrays of the network can also be retrieved by theKRSC personnel.
The overall picture related to the Apatity developments is given in Fig. 7.1.7. It shows thatthe data acquired in Apatity and retrieved via the NORSAT B satellite link are made avail-able to the IMS at NORSAR.
A new small-aperture array on the Arctic island of Spitsbergen
A small-aperture array very similar to the Apatity array described above was installed onthe island of Spitsbergen (see Fig. 7.1.1) during late October/early November 1992. Theimplementation of this array was supported financially by Qljeindustriens Landsforening(OLF), which is an association of oil companies taking part in oil exploration and produc-tion on the Norwegian Continental Shelf. The establishment and operation of the commu-nications channels needed in order to integrate the Spitsbergen array data into IMS isbeing supported by DARPA in the follow-on contract to the one reported on here.
A suitable location for the Spitsbergen array was found during a site-selection survey inAugust 1991. The site is located on Janssonhaugen in Adventdalen approximately 15 kmeast-southeast of Longyearbyen (see Fig. 7.1.8), which is the largest Norwegian settlementand also administrative center on the island. Longyearbyen has direct airline connectionsto mainland Norway. Janssonhaugen is a hill in the middle of a valley (Adventdalen), andthe array is deployed on the plateau of this hill. The rocks at the site are of Cretaceous age,covered by thin moraine of variable depth. The sensor- are placed at the bottom of 6 mdeep cased boreholes. The bottom of the boreholes are either in Cretaceous rock or inmoraine material in stable permafrost conditions (temperature approximately -5'C all yearround at a depth of 6 m), such that there is no melting/freezing taking place at this depth.
Fig. 7.1.9 shows the geometry of the Spitsbergen array. All nine seismometer sites areequipped with short-period vertical seismometers of type Geotech S-500. Cables on theground connect each of the sites with a housing located approximately 40 m south of siteB4. The entire system with seismometers, digitizers, radio links and array controller isshown schematically in Fig. 7.1.10. The system design is very similar to that of the Apat-ity array described above. Power at the Spitsbergen array site is provided through the useof a windmill which delivers 12V DC through a battery bank. Data from the two Nano-metrics RD-6 digitizers located at the housing close to site B4 are transmitted over tworadio links to Longyearbyen, where the data are entered into a NORAC array controllerlocated at a Norwegian Telecom facility. As can be seen from the figure, there is a certaindata redundancy, as data from channels B2 and B3 are transmitted on both radio links. Asof November 1992, the seismometers at sites A 1, A2 and B3 are not yet connected. Theywill be connected in the spring of 1993, as soon as permitted by the prevailing Arctic con-ditions.
From Longyearbyen, the Spitsbergen array data are transmitted via a terrestrial link toNorwegian Telecom's satellite hub station at Isfjord Radio, from where a simplex 64kbits/s satellite link (Norwegian Telecom's NORSAT B system) is used for transmission
60

NORSAR Sdi. Rep. 1-92/93 November 1992
of the continuous data to Norway. The NORAC array controller in Loagyearbyen is alsoconnected to NORSAR via a dial-up line, thus providing a back-link for control and com-mand purposes.
The data f.'om the new Spitsbergen array provides another data source for the IMS. As thisarray is located in an area of much younger geology than the other five arrays, its integra-tion into IMS is expected to present interesting seismological challenges.
S. Mykkeltveit A. Dahle J. Fyen T. Kvaerna
P.W. Larsen F. Paulsen F. Ringdal
I. Kuzmin, Kola Science Centre
References
Kremenetskaya, E.O. (1991): Contemporary seismicity of the NW part of the USSR,Semiann. Tech. Summ. 1 April - 30 September 1991, NORSAR Sci. Rep. No. 1-91/92, Kjeller, Norway
Mykkeltveit, S., A. Dahle, J. Fyen, T. Kvxema, P.W. Larsen, R. Paulsen, F. Ringdal andE.O. Kremenetskaya (1991): Extensions of the Northern Europe Regional ArrayNetwork -- a new three-componet;t station at Apatity, USSR, and a planned array atSpitsbergen, Semiann. Tech. Summ. 1 April - 30 September 1991, NORSAR Sci.Rep. No. 1-91/92, Kjeller, Norway
Paulsen, R. (1992): NORAC: A new array controller, Semiann. Tech. Summ. 1 October1991 - 31 March 1992, NORSAR Sci. Rep. No. 2-91/92, Kjeller, Norway
61
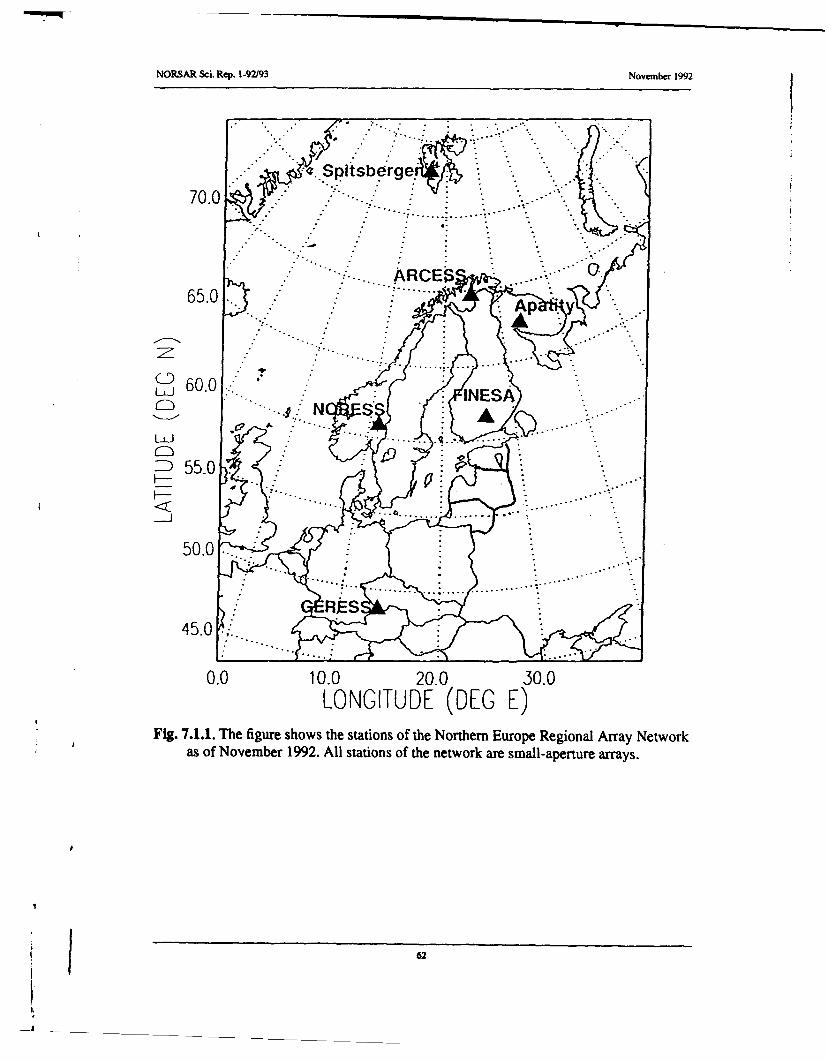
NORSAR Sci. Rep. 1-92193 November 1992
..Splntshorge '
70.0
65.0
zA
...c.. ..... ...
LLJ INES
450.
0.0 10.0 20.0 30.0LONGITUDE (DEC E)
Fig. 7.1.1. The figure shows the stations of the Northern Europe Regional Array Networkas of November 1992. All stations of the network are small-aperture arrays.
it 62

V NOISAR Sci. Rep. 1-92/93 November 1992
92O VKohlaeRegiona
o6 Seismology Centre
I •
10 Ikm
Fig. 7.1.2. Map of the Apatity region on the Kola Peninsula of Russia, showing the loca-tion of the Kola Regional Seismology Centre and the location of the new small-aper-tur array (not drawn to scale; the array aperture is 1 1cm). Also shown are the miningareas in Monchegorsk and Olenegorsk to the north of the array. The seismicity in thearea, and in particular the seismicity associated with the mining activity in the Khib-
i iny Mountain area to the northeast of Apatity, is described in Kremenetskaya (1991).
63

VNORSAR Sci. Rep. 1-9W93 November 1992
B1
A0
B32
-500 -250 0 250 500 ts
Fig. 7.1.3. Configuration of the new Apatity small-aperture array.
64

NORSAR Sci. Rep. 1-92t93 November 1992
040
a. .20
F- C
JOP8OOd o
THf 01
(0
LeuueIue!6eA 0) Q.
05
6uilqwB=sn onutluopflu1 0096
< CU~UU9W ! 6 >
04
c~l
jezi~ji ZH0L-cIzHoi.9a
2H Of?9-ou ZH -cjRj" a. - (o 0
JOIPSIOJd u l:6U!L441 U)0
1 0
Cmo
a.W1I m <. &
jolpidwyOJd C
0C.?
65

NORSAR Sci. Rep. 1-92/93 November 1992
... 1.OE+04..... , I . . .. -.
E* c
0
C.. ...-- -- - -- -- -
u) 1.0E+02_ ------0
O)C)
1 1.E-02
.1 10
Frequency Hz
Fig. 7.1.5. Amplitude (displacement) response function for the nine short-period channelsof the small-aperture array installed in Apatity in September 1992.
66

November 1992
NORSAR Sci. Rep. 1-92/93
CC
N -
GoNu
.00
o.Z
o Eo
0 (D0
!I ".
-m n
0 t
E~ 0i
0 4D0
0 0
0@
-. ~ U 4) ----

VNORSAR Sci. Rep. 1-92/93 November 1992
L U
E E
Cl) cz
U,
0 ZM-
00 CL -
4- 4. )
W~ Z,
IL 00
0 -.
z
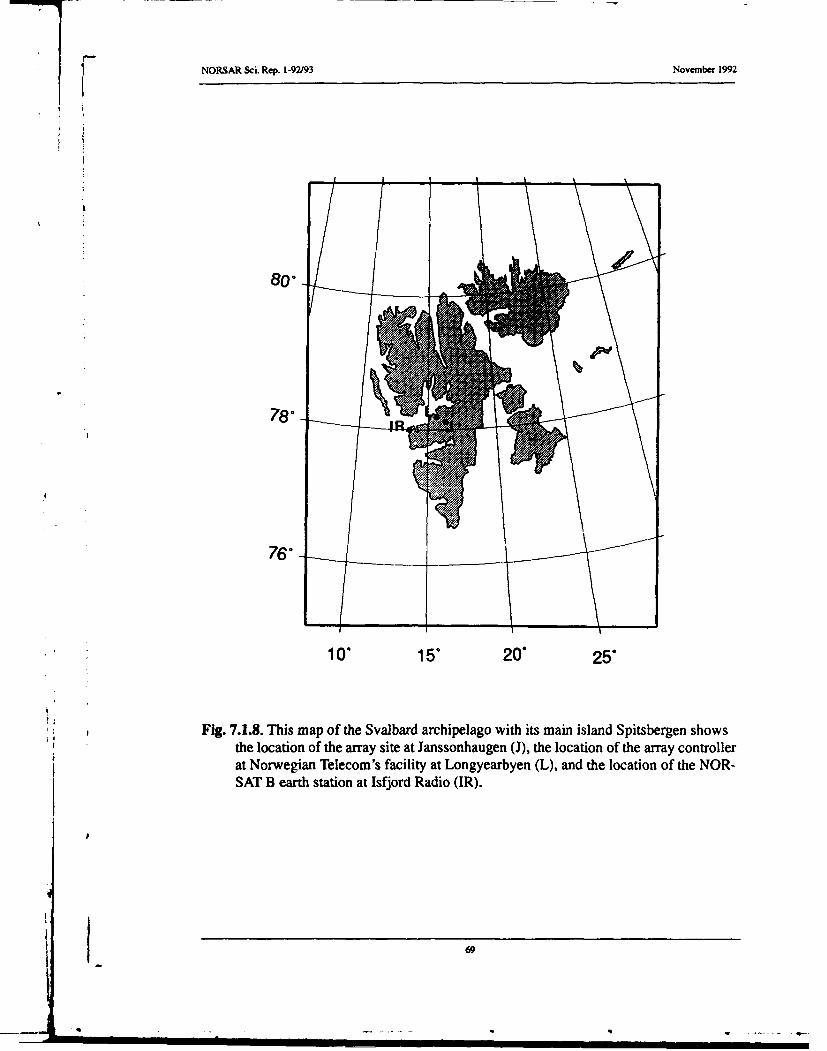
NORSAR Sci. Rep. 1-92/93 November 1992
78*
76*
10" 15" 20" 25"
Fig. 7.1.8. This map of the Svalbard archipelago with its main island Spitsbergen showsthe location of the array site at Janssonhaugen (J), the location of the array controllerat Norwegian Telecom's facility at Longyearbyen (L), and the location of the NOR-SAT B earth station at Isfjord Radio (IR).
69
=== ; ' .- - - -...

NORSAR Sci. Rep. 1-92/93 November 1992
5
I B4
A3
)A
B2
B32
-500 -250 0 250 S00 moeters
Fig. 7.1.9. Configuration of the new Spitsbergen small-aperture array.
S[7
* 70II ..... . - '-ii i m m i m l b m n l l

V F NORSAR Sci. Rep. 1-92t93 November 1992
00 C
C-4
0
cJz
>C
JOA!eOBGj
0Bui qwei~jos
pneq 0096 4
euueiuB !8eA
C-
JGPOO4J R
-ez CLU
PBa Z V -W I ZH Ot, 9-C1H a. cC
JOpeoIDB o
a..
0)
Jejeotus 0 0C, 00C091#9 91WOU 0 e
<. <
a.1a

V NORSAR Sci. Rep. 1-92/93 November 1992
7.2 Initial processing results from the Apatity small-aperture array
During the fall of 1992, a new regional array was installed near the town of Apatity on theKola Peninsula (see Section 7.1). Figs. 7.1.1 and 7.1.2 show the location of this array andFig. 7.1.3 shows the array geometry.
In the following we report on some initial results from analyzing data from the new array.It is emphasized that these results are preliminary, since the available data cover only afew weeks. Thus a more comprehensive assessment must await the collection of data overa longer time span.
Noise spectra
Fig. 7.2.1a shows an example of corrected noise spectra for the 9 vertical elements of theApatity array, taken at 00.00 hours (GMT) on day 345, 1992. For comparison, theARCESS spectra for the same number of channels and taken at the same time are shownin Fig. 7.2.1b. From these figures, it is seen that the Apatity array has a higher noise levelthan ARCESS at frequencies above 2 Hz, whereas the noise levels are similar at lower fre-quencies.
The higher noise level at Apatity above 2 Hz is not unexpected, taking into account thehigher level of industrial activity in this region. On the other hand, the noise level at theApatity array site is considerably lower than that of the APA station situated in the town ofApatity (see NORSAR Sci. Rep. 1-91/92).
Fig. 7.2.2a shows 24 uncorrected noise spectra, taken hourly between 00.00 GMT and23.00 GMT on day 344 for the Apatity array (instrument AOZ). For comparison, a similarset of NORESS spectra is shown in Fig. 7.2.2b. The range of variability is similar for thetwo sites, with the highest noise levels corresponding to local daytime.
Noise suppression
Previous studies have shown that regional arrays are veiy effective in suppressing seismicnoise, thus providing gains that are often of the order of JN, or sometimes even in excessof this value (N being the number of sensors). Such better than JN suppression occurswhen particular subgeometries are chosen, enhancing the suppression of noise at certainfrequencies. As a first check on the capabilities of the Apatity array in this regard, we havecomputed noise suppression curves and compared with corresponding results from NOR-ESS.
We calculate an uncorrected power density spectrum first by prewhitening 60 seconds ofdata. Then we estimate the autocorrelation for 6 partially overlapping windows (windowlength 12 seconds), and compute power density spectra from the average autocorrelation,with compensation for the prewhitening filter.
An average spectrum is obtained by averaging the 9 individual channel spectra for thearray. The averaging is done after a logarithmic transform of the spectra, and the standard
72

NORSAR Sci. Rep. 1-92/93 November 1992
deviation for each frequency point is calculated. Each spectrum is pointwise compared tothe average spectrum. If a value is outside 1.5 standard deviation from the mean value, thepoint is considered an outlier. If a single channel spectrum has more than 60% outliers, thespectrum is excluded and a new average spectrum is estimated. A beam is calculated usingonly those channels for which the spectrum was accepted. The suppression is then thebeam spectrum divided by the average spectrum.
It should be noted that calculating suppression using a beam with all 9 elements comparedto using only "accepted" channels makes little difference in practice. When calculatingnoise suppression the most stable results are obtained by dividing the beam spectrum withthe average spectrum.
Fig. 7.2.3a shows noise suppression in the frequency range 0-20 Hz for an infinite-velocitybeam (no time delays) for the Apatity array. There are 24 samples, taken hourly on day344, 1992. For comparison, a corresponding plot for the 9-element NORESS B-ring array(AOZ, A1-3, B1-5) is shown in Fig. 7.2.3b. The JR level is about -9.5 dB, and the generalimpression is that the Apatity array is at least as efficient in suppressing noise as the corre-sponding NORESS subgeometry. Between 1 and 5 Hz, the Apatity array has higher noisesuppression than the NORESS B-ring geometry, and we attribute this to the slightly largerApatity array aperture. Above 5 Hz, the two configurations are similar. At a frequencynear 4 Hz, there is significantly better than jN_ noise suppression for the Apatity array. Insummary, it appears that the spatial noise characteristics at Apatity are similar to thosefound in other areas of Fennoscandia and the Baltic Shield.
Detection processing
Since the array was installed, the Apatity data have been subjected to continuous on-linedetection processing (DP) at NORSAR using the detection algorithm described byMykkeltveit and Bungum (1984). The initial beam deployment is shown in Table 7.2.1. Atan early stage, the Apatity detection lists were incorporated into the Generalized Beam-forming (GBF) process (Ringdal and Kverna, 1989), which has been in automatic opera-tion at NORSAR for nearly 3 years. It is noteworthy that both the DP and GBF could beimplemented for the new array with success even without any special tailoring of parame-ter values and algorithms.
As an example of a regional seismic event recorded and processed using Apatity data, we
show here results for a presumed mining explosion in the Kola Peninsula west of the array.This event is from an area different than the Khibiny Massif where most such explosionstake place.
Fig. 7.2.4 shows B-ring seismograms for this event. Note the very clear Rg phase, whichindicates a shallow source. The detector output, and the solution provided by the GBFalgorithm, are shown in Table 7.2.2. A total of 10 phases from the four regional arrays inFennoscandia have been associated with this event. The estimated magnitude (MN) is2.53.
73
NORSAR Sci. Rep. 1-92/93 November 1992
Frequency-wavenumber analysis
Frequency-wavenumber solutions for the three phases Pg, Lg and Rg are shown in Fig.7.2.5a-c. In spite of the small aperture of the array, the peaks in the F-K diagram are well-defined: typically the highest side lobe is at least 6 dB below the main peak in the F-Kplot. Analysis of many events has shown that in particular the array gives a very stabledetermination of slowness and azimuth for the Rg phase in spite of the broad peak in theF-K diagram. It is remarkable how well an array of only 1 km diameter can resolve theselow-frequency dispersive waves.
From Fig. 7.2.5 we note that the phase velocities of each of the three phases are consistentwith the phase type; the Rg phase having the slowest velocity. The estimated azimuths arealso consistent, with a few degrees' difference only.
Teleseismic events
An example of a small teleseismic recording is shown in Fig. 7.2.6. There is clearly a sig-nificant SNR gain on the array beam, and this supports the previous statements on noisesuppression. Naturally, the gain at teleseismic signal frequencies for the Apatity array willbe lower than for the full-scale NORESS, ARCESS and GERESS regional arrays. Never-theless, for areas of favorable signal focusing effects, the small Apatity array may stillshow excellent teleseismic detection, and many examples of this have been observed.
In conclusion, our preliminary analysis indicates that the Apatity array will be an impor-tant supplement to the seismic array network in Northern Europe, both for regional andteleseismic event analysis. Its inclusion into the Intelligent Monitoring System (IMS) willin particular serve to improve the location precision and source characterization of thelarge number of seismic events in the Kola Peninsula and adjacent areas.
F. RingdalJ. Fyen
References
Mykkeltveit, S. and H. Bungum (1984): Processing of regional events using data fromsmall-aperture arrays, Bull. Seism. Soc. Am., 74, 2313-2333.
Ringdal, F. and T. Kvmrna (1989): A multi-channel processing approach to real-time net-work detection, phase association and threshold monitoring, Bull. Seism. Soc. Am.,79, 1927-1940.
-74
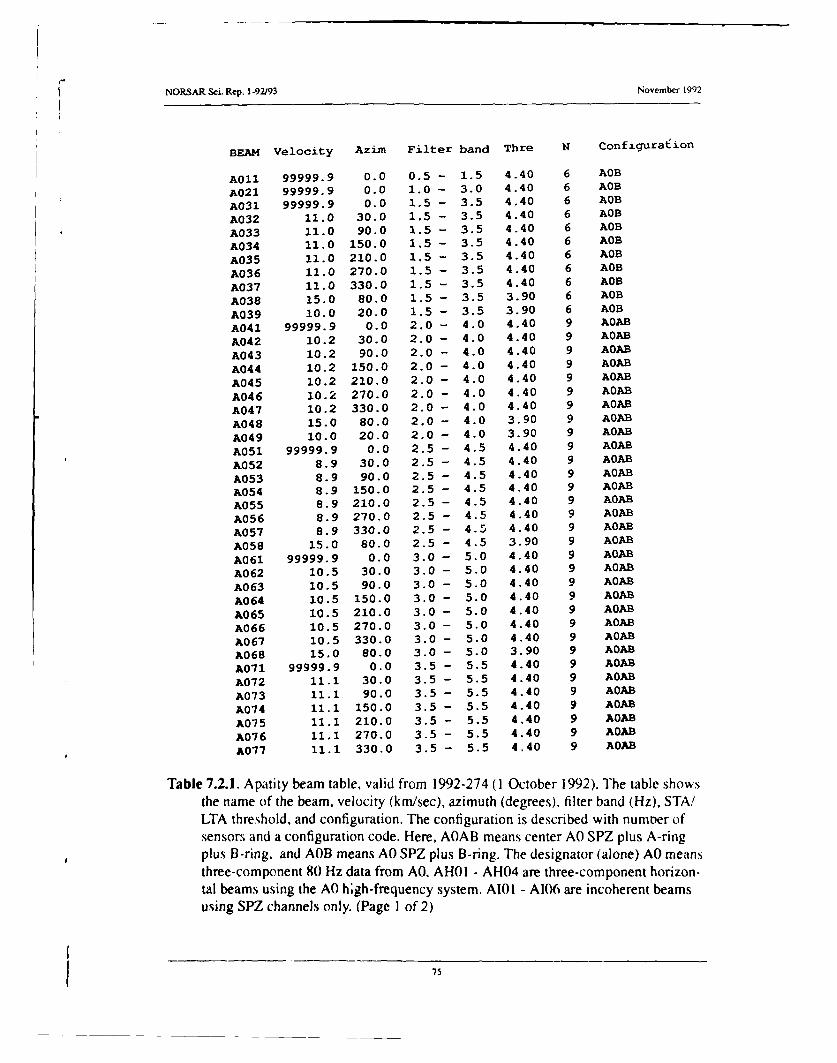
NORSAR Sci. Rep. 1-92/93 November 1992
BEAM Velocity Azim Filter band Thre N Configuration
A011 99999.9 0.0 0.5 - 1.5 4.40 6 AOB
A021 99999.9 0.0 1.0 - 3.0 4.40 6 AOB
A031 99999.9 0.0 1.5 - 3.5 4.40 6 AOB
A032 11.0 30.0 1.5 - 3.5 4.40 6 A0B
A033 11.0 90.0 1.5 - 3.5 4.40 6 A0B
A034 11.0 150.0 1.5 - 3.5 4.40 6 AOB
A035 11.0 210.0 1.5 - 3.5 4.40 6 AOB
A036 11.0 270.0 1.5 - 3.5 4.40 6 AOB
A037 11.0 330.0 1.5 - 3.5 4.40 6 AOB
A038 15.0 80.0 1.5 - 3.5 3.90 6 AOB
A039 10.0 20.0 1.5 - 3.5 3.90 6 AOB
A041 99999.9 0.0 2.0 - 4.0 4.40 9 AOAB
A042 10.2 30.0 2.0 - 4.0 4.40 9 AOAB
A043 10.2 90.0 2.0 - 4.0 4.40 9 AOAB
A044 10.2 150.0 2.0 - 4.0 4.40 9 AOAB
A045 10.2 210.0 2.0 - 4.0 4.40 9 AOAB
A046 10.2 270.0 2.0 - 4.0 4.40 9 AOAB
A047 10.2 330.0 2.0 - 4.0 4.40 9 AOAB
A048 15.0 80.0 2.0 - 4.0 3.90 9 AOAB
A049 10.0 20.0 2.0 - 4.0 3.90 9 AOAB
A051 99999.9 0.0 2.5 - 4.5 4.40 9 AOAB
A052 8.9 30.0 2.5 - 4.5 4.40 9 AOAB
A053 8.9 90.0 2.5 - 4.5 4.40 9 AOAB
A054 8.9 150.0 2.5 - 4.5 4.40 9 AOAB
A055 8.9 210.0 2.5 - 4.5 4.40 9 AOABA056 8.9 270.0 2.5 - 4.5 4.40 9 AOABA057 8.9 330.0 2.5 - 4.5 4.40 9 AOABA058 15.0 80.0 2.5 - 4.5 3.90 9 AOABA061 99999.9 0.0 3.0 - 5.0 4.40 9 AOABA062 10.5 30.0 3.0 - 5.0 4.40 9 AOABA063 10.5 90.0 3.0 - 5.0 4.40 9 AOAB
A064 10.5 150.0 3.0 - 5.0 4.40 9 AOABA065 10.5 210.0 3.0 - 5.0 4.40 9 AOAB
A066 10.5 270.0 3.0 - 5.0 4.40 9 AOAB
A067 10.5 330.0 3.0 - 5.0 4.40 9 AOAB
A068 15.0 80.0 3.0 - 5.0 3.90 9 AOAB
A071 99999.9 0.0 3.5 - 5.5 4.40 9 AOAB
A072 11.1 30.0 3.5 - 5.5 4.40 9 AOAB
A073 11.1 90.0 3.5 - 5.5 4.40 9 AOAB
A074 11.1 150.0 3.5 - 5.5 4.40 9 AOAB
A075 11.1 210.0 3.5 - 5.5 4.40 9 AOAB
A076 11.1 270.0 3.5 - 5.5 4.40 9 AOAB
A077 11.1 330.0 3.5 - 5.5 4.40 9 AOAB
Table 7.2.1. Apatity beam table, valid from 1992-274 (1 October 1992). The table shows
the name of the beam, velocity (km/sec), azimuth (degrees), filter band (Hz), STA/
LTA threshold, and configuration. The configuration is described with numner of
sensors and a configuration code. Here, AOAB means center AO SPZ plus A-ring
plus B-ring, and AOB means AO SPZ plus B-ring. The designator (alone) AO means
three-component 80 Hz data from AO. AHOI - AH04 are three-component horizon-
tal beams using the AO high-frequency system. AI01 - A106 are incoherent beams
using SPZ channels only. (Page 1 of 2)
i75

NORSAR Sci. Rep. 1-92/93 November 1992
BEAM Velocity Azim Filter band Thre N Configuration
A081 99999.9 0.0 4.0 - 8.0 4.40 9 AOABA082 9.5 30.0 4.0 - 8.0 4.40 9 AOABA083 9.5 90.0 4.0 - 8.0 4.40 9 AOABA084 9.5 150.0 4.0 - 8.0 4.40 9 AOABA085 9.5 210.0 4.0 - 8.0 4.40 9 AOABA086 9.5 270.0 4.0 - 8.0 4.40 9 AOABA087 9.5 330.0 4.0 - 8.0 4.40 9 AOA13A091 99999.9 0.0 5.0 - 10.0 4.90 9 AOABA092 10.5 30.0 5.0 - 10.0 4.90 9 AOABA093 10.5 90.0 5.0 - 10.0 4.90 9 AOABA094 10.5 150.0 5.0 - 10.0 4.90 9 AOABA095 10.5 210.0 5.0 - 10.0 4.90 9 AOABA096 10.5 270.0 5.0 - 10.0 4.90 9 AOABA097 10.5 330.0 5.0 - 10.0 4,9n 9 AOABA101 99999.9 0.0 8.0 - 16.0 4.90 9 AOABA102 9.9 30.0 8.0 - 16.0 4.90 9 AOA0A103 9.9 90.0 8.C - "'-.0 4.90 9 AOABK104 9.9 150.0 8.1 - 1'7 4.90 9 AOABA105 9.9 210.0 8.0 • ' 0 4.90 9 AOABX106 9.9 270.0 8.0 - 16.0 4.90 9 AOABK107 9.9 330.0 8.0 - 16.0 4.90 9 AOABA201 99999.9 0.0 1.0 - 3.0 4.00 6 AOBA207 99999.9 0.0 8.0 - 16.0 4.50 6 AOB1%254 99999.9 0.0 2.0 - 4.0 4.00 6 A0BA282 99999.9 0.0 4.0 - 8.0 4.00 6 A0BAJI0 99999.9 0.0 1.0 - 2.0 2.50 6 AOBA312 99999.9 0.0 2.0 - 4.0 2.40 6 AOBAHO1 99999.9 0.0 2.0 - 4.0 2.80 3 A0AH02 99999.9 0.0 3.5 - 5.5 2.80 3 A0AH03 99999.9 0.0 5.0 - 10.0 2.80 3 A0AH04 99999.9 0.0 8.0 - 16.0 2.80 3 A0A101 99999.9 0.0 0.5 - 1.5 2.90 6 AOBA102 99999.9 0.0 1.0 - 2.0 2.90 6 AOBA103 99999.9 0.0 1.5 - 2.5 2.90 6 AOBA104 99999.9 0.0 2.0 - 4.0 2.50 6 A03A105 99999.9 0.0 3.5 - 5.5 2.50 6 A03A106 99999.9 0.0 5.0 - 10.0 2.70 6 Ao0
Table 7.2.1 (cont.) (Page 2 of 2)
.76

2 7NORSAR Sci. Rep. 1-92/93 November 1992
U) r.r~ O)0 01,
=00
of-4. wo 0 N M4. N .f4a.2'
w i i I IninIn InInni In In n I
.)~N 44N .4NN 4.4 4.4 OL >
0 fI 4 M 0 l 1 N A. li>
t'Nr L)Sf- 4 @1 r
e N .. . . . . .
ý 0! 9 !0!0 C) C4 .
IL).Ii~~e V Z.0o)~ p eS I
ON 1 r. 5 40 ', 01 CO M I q r ,N ~ , S10NW1W- 0 r- <NUS(
0. Q.V
,~ 04
4 04 , Mc n1 ~ S 0 ýhC'. M0 .4a 40 V 14 4 1 c
1.4 rl A r I I I1. .4
E1 15
w4 .4.............................................
~Q
HW a4 na a o 0 A4 no 0 cnC4 6ý V;.. r
140 0 a'I A- f4 a4 M 44
141 H If I; rI 14 14
.ý r; -ý C ýC
co A * W. 4S r .4.~l V
14r!....44444444.....NN
H i 1 .4 .4.4.4 4I- . .4.44I-. .4.44I-..V.4 4..1
V~r .444444......44444o.....Ah N ,Ok4*0 , n *oc
.4 Ec~eww eeU flr w 14N HA'.4~~~M H-W W @ ~ E S
.4.. *1--1--1--p.~eS SSS flpflfN77

NORSAR Sci. Rep. 1-92/93 November 1992
APA Single channel corrected spectra.60 sec stat 1992-344 23.59.0).625 Wednesday 09 Decenber
, 1.0E+04.. I _________ __________
z APA6~pd6
c.i I.OE+04 -PAILL*
APA2.sz.ds
>1.0E-02.APr Lsy.pds
1.0E- 04 -------------. -----------. ---.---------....................!.~0E-06
APB ..szpds
1.OL-02
0.1 1 0 100Frequency Hz
Fig. 7.2.1a. Noise spectra corrected for system response for the Apatity array for 9 verticalchannels at A0, the A-ring and the B-ring. The spectra are based on one minute of data at00.00 hours GMT on day 345, 1992. The power density is in nm 2/Hz.
ARC Single channel corrected spectra.60 sec ste 1992-345 00 0116.556 Thursd•y 0 OIe0nber,
>)O0E+06
- --1.0E-04 . -........................ ............... O _•
O-.- OE+02 .. ..- ARKszpds
----- -- ...... ~d
POE-04W8 jo.AM.-;10[10Ei 0[-041-06L I0 I---" Y.............. I I"I I : Iz~• .zl I'll s~l
0.1 10 100Frequency Hz
Fig. 7.2.lb. Same as Fig. 7.2.1 a, but for ARCESS data (AO, A-ring, B-ring) taken at 00.00hours GMT on day 345, 1992.
S78
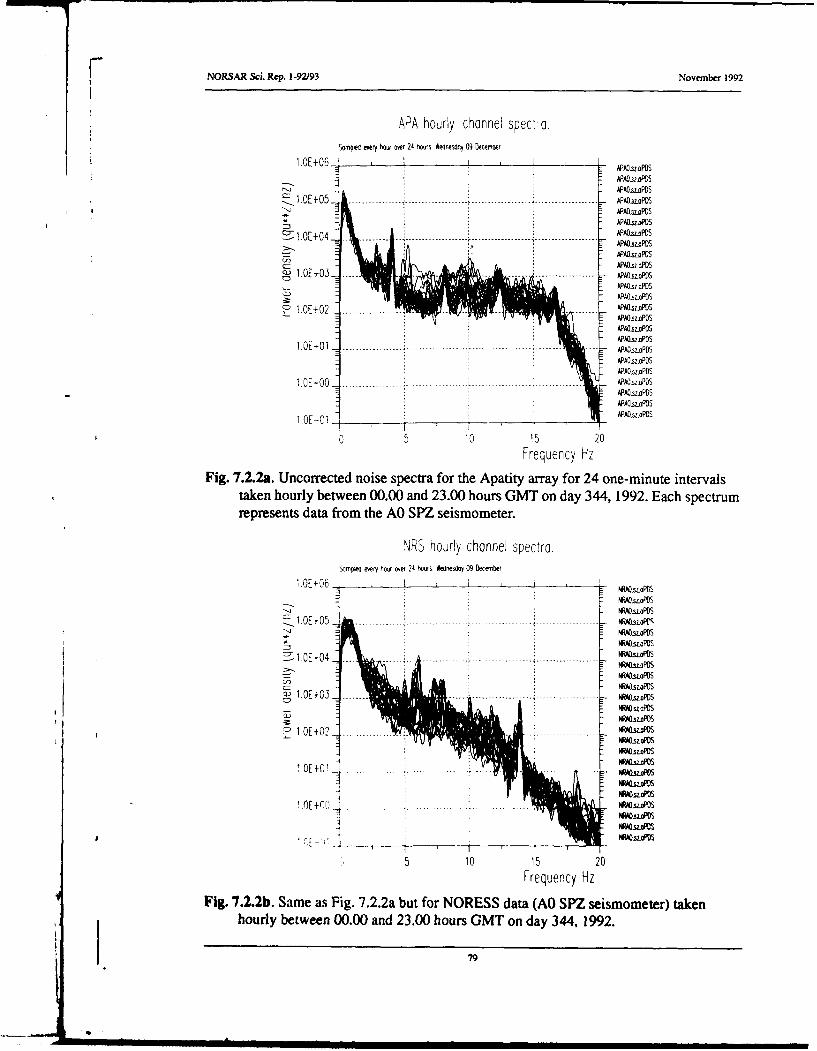
NORSAR Sci. Rep. 1-92J93 Novembff 1992
APA hourly channel spectl-.Sampled every hwj over 24 hours Wednesday 09 D~eember
1.OE tO 4 . I______-MAOseDAPA2sz-aP0
APA0szAoP0
APA
APA~szoPDS
APAOxLoPDS
a) APA~s~aPDS
* APAOSLoPOS
~APAsz~aPDS8 .0E+03 ------------------------------------ ACP05i-P
* APA~OsaPS
1.OE-0 _____ ______ ______ ______ _____
I E 02 - 10-----_-- 15 20 PD
Frequency liz
1.0E+00 ....__ I P8~szoPOS
APA~szaPDS
1 OE-O I Wisz~oPDS
_TS~PO0 5 10 15 20
Frequency Hz
"ýASLODS
NMzsPDS1.DE+04 .. ..............- -- .. -- WMOD----- -- .... -- - " 3LaD S
5 10 15 20Frequency H
Fig.+0 ------. Same------- asFgN722 utfrNOESdta(OSP s oMetr ehoury beween00.0 and23.0 hors G T onday 44, 992
79~aD

VNORSAR Sci. Rep. 1-92/93 November 1992
APA hourly noise suppression spectra.Sampled every hour over 24 hours. Wednesday 09 December
~APSO.SisO
APAOszosup
APAC-sz~sup
WAPAszsoop
APAO.oS~zp
MreflszsupAPAQszLsuprPOsed u
10 - ----- Frequency Hzu
.rFN supressio for 9 ensors
C) P~AOsozoupAPAOzz-sup
APAO.oi-SUPEAPAOszsup
~APAsz-suo-0-)o
0 1 i 2
FrqenyH
Fi.7..a.Aait rrynis uprsso y emfrig o tegemtycoprsn
ýN_~~~Feqec supeso or9snosFig.~ ~ ~ ~~R ho.b am sFg.72 url forite 9-ppelement subgemrcotNRrScosit
".sm

NORSAR Sci. Rep. 1-92/93 November 1992
54929
APAO
sz
45385
APB 1
Sz
47001
APB2 110 _.M.. 10- I
Sz
44001
ARB3
sz
49921
APB4
sz
44041
sz I
18.20.000 18.40.000 19.00.000
1 992--298:11.1 8.1 2.225 Apotity
DEC/ 2/92 13:32:38 NORSAR
Fig. 7.2.4. Plot of individual APA SPZ channels for the presumed mining explosion dis-cussed in the text (see Table 7.2.2). Note the very prominent Rg phase, indicating ashallow origin.
!tI

'V NORSAR Sci. Rep. 1-92/93 November 1992
1992-298:11.18.29.000 + 1.00 SECWIDE-BAND SLOWNESS ANALYSIS a)CONTOURS IN DB BELOW MAXIMUM PEAK
0.4 "VELOCITY CIRCLES (KM/SEC) AT8.00 6.00 3.00
CHANNELS:APA_A0_SZ APA_A1 _SZ
, 0.2. APAA2_SZ APA_A3_SZU APAB_.1SZ APAB2_SZW __ýAPA_B3_SZ APAB4_SZ
0 APA_B5_SZ0.0
z0
V) -0.2-
-0.4- I _ _I
-0.4 -0.2 0.0 0.2 0.4E_ -A< SLOWNESS (SEC/KM)
BAND 3.8 - 7.5 HZ REL.POWER 0.88V,A 6.78 KM/S, 269.64 DEG 60.04 DB
NORSAR02/12/92 13:27:24
Fig. 7.2.5. Broadband F-K analysis results for the P, Lg and Rg phases of the event shownin Fig. 7.2.4. The figure shows a) the Pg phase, b) the Lg phase and c) the Rg phase.The three velocity circles correspond to 8, 6 and 3 km/s. (Page 1 of 3).
I -2

NORSAR Sci. Rep. 1-92/93 November 1992
1992-298:11.18.41.000 + 1.50 SECWIDE-BAND SLOWNESS ANALYSIS b)CONTOURS IN DB BELOW MAXIMUM PEAK
0.4 -
VELOCITY CIRCLES (KM/SEC) AT8.00 6.00 3.00
CHANNELS:APA_A0_SZ APA_A1_SZ
0.2- APAA2_SZ APAA3_SZAPA-B1-SZ APAB2-SZAPA_B3_SZ APAB4_SZAPA_B5_SZ
V)-10,20-
z0
-0.4-
-0.4 -0.2 0.0 0.2 0.4E SLOWNESS (SEC/KM)
BAND Eý - 5.0 HZ REL.POWER 0.86V,A 3.82 KM/S, 273.68 DEG 65.64 DB
NORSAR02/12/9)1 i3:iB:52
Fig. 7.2.5. (Page 2 of 3)
93

NORSAR Sci. Rep. 1-92/93 November 1992
1992-298:11.18.49.000 + 3.00 SECWIDE-BAND SLOWNESS ANALYSIS C)CONTOURS IN DB BELOW MAXIMUM PEAK
7 VELOCITY CIRCLES (KM/SEC) AT8.00 6.00 3.00
CHANNELS:APAAO_SZ APA_A 1 _SZ
, 0.3- APAA2_SZ APAA3_SZAPA-B1-SZ APA_B2_SZ
w APA_B3_SZ APA_B4_SZV7 APA_B5_SZ
LiJ
V)1 -0.3-
z
-- 0.7- i
- 0. " -0.3 0.'0 0'"3 0.7
E W SLOWNESS (SEC/KM)BAND 0.6 - 1.6 HZ REL.POWER 0.99V,A 3.33 KM/S, 281.81 DEG 84.04 DB
NORSAR02/12/92 09:42:32
Fig 7.2.5. (Page 3 of 3)
'4

NORSAR Sci. Rep. 1-92/93 November 1992
FKX 2733 beam A038 At 1992-280:14.23.44.925 snr 7.60Phase P vel .J50 azI 93.6.0 r w 0.360 1 a 2.40 f 1.82 fbond 1.50 3,50,APAO-sz 520APB2-SZ
AP83.sz 573
APB3-sz
AP84.sz
A038. 439.68
A038- 1323.9
1992-280:14.23.14.925 - 06/10192 15:29 41 IWSA1
Fig. 7.2.6. Example of teleseismic event processing for the Apatity array. The top sixtraces are individual seismometer recordings, filtered in the band 1.5-3.5 Hz. Thetwo bottom traces are array beams, filtered and unfiltered. Note the significant SNRimprovement for the filtered array beam.
95

NORSAR Sci. Rep. i-92J93 November 1992
7.3 On the use of regionalized wave propagation characteristics inautomatic global phase association
The Generalized BeamForming (GBF) method for automatic phase association and eventlocation (Ringdal and Kvarna, 1989), uses the philosophy of matching the predictedphase arrivals from hypothetical events at a predefined set of target locations to the actualdetections at each observing station. This approach gives us the opportunity of organizingand using knowledge on regionalized wave propagation characteristics in a simple andwell-arranged way.
Examples of relevant questions are:
"• Which seismic phases are observable/detectable at the different stations from anevent at a given target location.
"• What are the expected travel-times, slownesses, and azimuths of these phases, andthe corresponding variability.
"* What are the amplitude versus magnitude relations for the different phases, and thecorresponding variability.
The quality of the GBF results as well as the false alarm rate are dependent on how wellour predictions match the actual observations. As illustrated in Fig. 7.3.1, the detectableseismic phases may vary strongly from one region to another, as do the correspondingtravel-times. The obvious way to obtain good predictions at a given station is to collectand analyze events from a wide range of epicentral regions. For these calibration events,independent bulletin information on hypocenter location, origin time and magnitudeshould be available.
Detailed mapping of the wave propagation characteristics attributed to a given station do,however, require significant amount of data and a substantial amount of work (Kvxmrnaand Mykkeltveit, 1985; Mykkeltveit et al., 1990; Gestermann, 1992; Sereno et al., 1992).The Intelligent Monitoring System (IMS) (Bache et al., 1990), currently operating a net-work of arrays in northern Europe, has a design that facilitates retrieval of this kind ofknowledge, using a database management system (DBMS). During its 2-3 years of opera-tion it has contributed significantly to improve the quality of the automatic processingresults from this region of the world (Bratt et al., 1990).
The GSETT-2 database
Another interesting database is the waveforms and processing results from the GSETT-2experiment conducted in 1991. During a period of six weeks (April 22 to June 2), 60 glo-bally distributed stations (including single-component stations, three-component stationsand arrays) reported phase readings and waveforms to a common database, see Fig. 7.3.2.At four different data centers, automatic analysis as well as analyst review were conductedto obtain precise event locations and magnitude estimates.
In the instructions for the conduct of the GSETT-2 experiment (GSE/CRP/Rev. 4, 1991),there are detailed instructions on which parameters to use for the preparation of the event
Jt 96
S..-----.~.---~.. m m Smmmmmmm m m mmm
VNORSAR Sci. Rep. 1-92/93 November 1992
bulletin. This includes the use of travel-times and slownesses derived from the Jeffreys-Bullen travel-time tables. There are also detailed instructions on which phases to consider,as well as their residual requirements on travel-time and slowness vector residuals for thedifferent types of seismic stations.
A stepwise approach towards regionalization
When initiating phase association and event location with the GBF method on data from anew network like GSETT-2, the natural starting point is to use theoretically derived or glo-bally averaged processing parameters like those described in the GSETr-2 instructions.
The GSETT-2 stations (see Fig. 7.3.2) are situated in very different geological provinces,and may experience systematic deviations from the globally averaged travel-times, slow-ness and azimuth estimates, especially for events within regional distances.
A first step towards regionalization would be to investigate if stations within the samegeological province observe similar systematic anomalies with regard to, e.g., phaseoccurrence, travel-time, slowness or azimuth, and then accordingly introduce correctionsto the parameters derived from the globally symmetric model.
Next, this can be refined by analyzing each station separately, and also, if possible, makingcorrections for source regions where the events exhibit anomalous behavior. For example,for seismic phases recorded at the GERESS array in Germany, both Gestermann (1992)and Sereno et al. (1992) have analyzed the characteristics of regional phases along differ-ent propagation paths.
Finally, for small areas with recurring events, such as mines, nuclear test sites and seismi-cally very active regions, we can use the recorded events for calibration and obtain site-station specific processing parameters for use by the GBF method.
In the following, we will present samples from results we have obtained by searching theGSETT-2 database that are of relevance for improving the processing parameters for theGBF method. In this contribution we have used the event bulletin from the WashingtonExperimental International Data Center (EIDC) as the reference bulletin, also calledWASCEL (WAShington Current Event List). This bulletin may not contain totally inde-pendent information because the phases we are to analyze have been used to produce thebulletin. However, for events with a sufficiently high number of associated phases, thebias due to this effect is considered negligible.
Phase occurrence
The optimum information on the occurrence of seismic phases at a given station would beto have a geographical map with indications on which phases may be observed fromevents in the different geographical areas. However, the derivation of such informationrequires a large number of recorded events, which can only be obtained for stations thathave been operational over a long time period.
87

NORSAR Sci. Rep. 1-92J93 November 1992
If we assume that the geology of the region surrounding a given station is rather uniform,the recording of seismic phases would primarily be distance- and magnitude- dependent(the effect of different source functions is ignored at this stage). The assumption of azi-muthal symmetry will initially be made for the derivation of wave propagation character-istics from the GSETT-2 database. We will in the following use phase labels reported bythe WASCEL as the reference.
As a first example we show a histogram of the occurrence of regional phases observed atthe ARCESS array in Norway (ARAO) as reported in the WASCEL (Fig. 7.3.3.a). It isseen that certain distance ranges have more reported phases than others, corresponding toregions of high mining activity, like the Kola peninsula (3-4 degrees), the St. Petersburgregion (8-9 degrees), and the Estonian region (10-11 degrees).
This data set indicates that beyond the critical distances, Pn and Sn can be expected to beseen for all regional distances, whereas Pg is not observed beyond 9 degrees. Lg is onlyobserved within 12 degrees, and Rg only within 4 degrees.
It should be emphasized that this data set is sampled through a time period of only sixweeks, and consequently only samples the lower part of the event magnitude distribution.It is therefore likely that phases from stronger events will be observable at larger di stancesthan those found in this data. Such considerations have to be made when constraining theexpected occurrence of seismic phases at a given station.
Fig. 7.3.4.a shows a histogram of the occurrence of teleseismic phases observed atARCESS. The P and PKP phases generally follow the expected pattern of the global traveltime curves. Some PcP phases are observed, probably corresponding to events in regionswith favorable propagation paths and/or strong events.
In a similar way, such investigations can be conducted for each of the other GSETT-2 sta-tions, but it should be noted that the GSETT-2 database probably contains too little datafor a rigorous mapping of the occurrence of seismic phases.
Reported phase labels
Another interesting parameter that possibly can be utilized by the GBF algorithm is thephase labels given by the reporting stations. For direct comparison with the regional phasedistribution of Fig. 7.3.3.a, we show in Fig. 7.3.3.b the same type of histogram, but basedon phase labelling by the Norwegian National Data Center (NDC). From these figures itlooks like there is good agreement with the final phase labels given in the WASCEL. Onthe other hand, from the histogram of NDC reported teleseismic phases of Fig. 7.3.4.b, wefind that with very few exceptions, all phases were reported as P.
For the most frequently observed phases, the relation between the NDC reported phaselabels and those reported in the WASCEL has been studied in more detail. The rows ofTable 7.3.1 represent the ARCESS phase labels reported by the Norwegian NDC, and thecolumns represent the phase labels of the WASCEL. This matrix table thus gives an over-view of the reliability of the NDC reported phase labels.
88
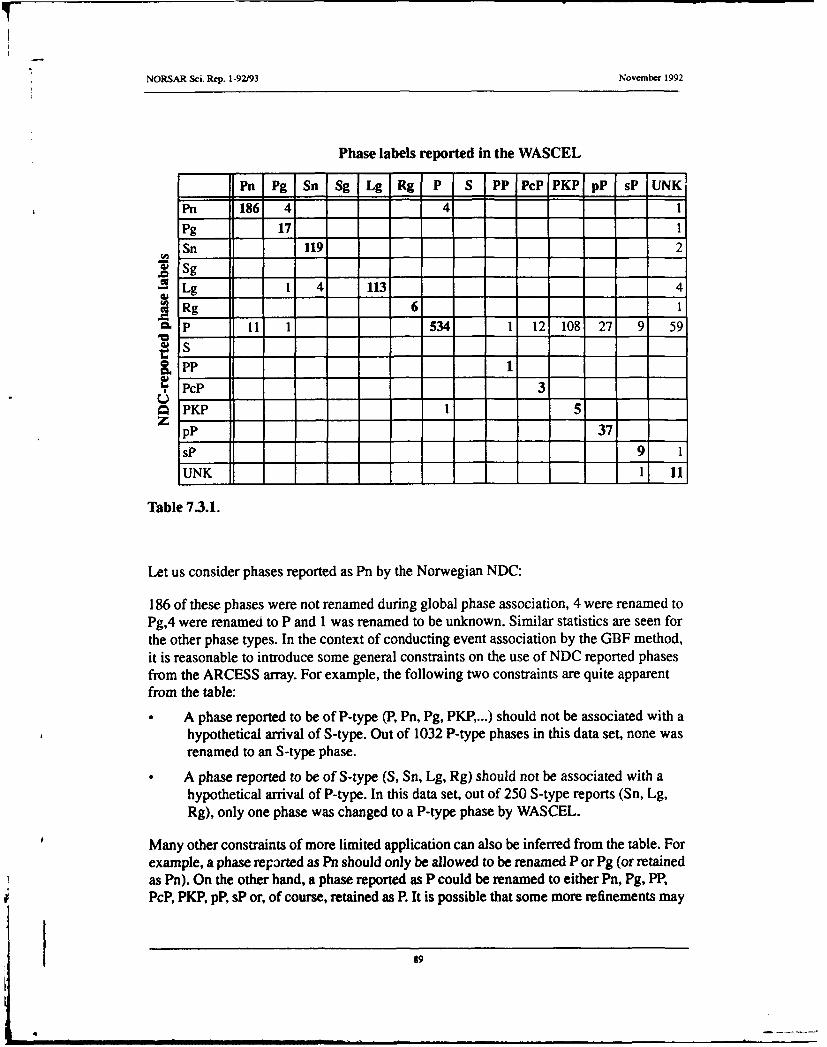
NORSAR Sci. Rep. 1-92/93 November 1992
Phase labels reported in the WASCEL
Pn Pg Sn Sg Lg Rg P S PP PeP PKP pP sP UNK
Pn 186 4 4 1Pg 17 1Sn 119 2
SSg-Lg 11 4 1131 4
, Rg 6 1P 11 1 534 1 12 108 27 9 59
& PP 1
', PeP 3
0 PKP 1 5
pP 37
sP 9 1UNK 1 l
Table 73.1.
Let us consider phases reported as Pn by the Norwegian NDC:
186 of these phases were not renamed during global phase association, 4 were renamed toPg,4 were renamed to P and 1 was renamed to be unknown. Similar statistics are seen forthe other phase types. In the context of conducting event association by the GBF method,it is reasonable to introduce some general constraints on the use of NDC reported phasesfrom the ARCESS array. For example, the following two constraints are quite apparentfrom the table:
"* A phase reported to be of P-type (P, Pn, Pg, PKP,...) should not be associated with ahypothetical arrival of S-type. Out of 1032 P-type phases in this data set, none wasrenamed to an S-type phase.
"* A phase reported to be of S-type (S, Sn, Lg, Rg) should not be associated with ahypothetical arrival of P-type. In this data set, out of 250 S-type reports (Sn, Lg,Rg), only one phase was changed to a P-type phase by WASCEL.
Many other constraints of more limited application can also be inferred from the table. Forexample, a phase rep3rted as Pn should only be allowed to be renamed P or Pg (or retainedas Pn). On the other hand, a phase reported as P could be renamed to either Pn, Pg, PPRPcP, PKP, pP, sP or, of course, retained as P. It is possible that some more refinements may
S9

NORSAR Sci. Rep. 1-92/93 November 1992
be made by taking into consideration the aifference in the slowness estimates betweencore phases and P-phases, but this will be the topic of a separate investigation.
Without going into detail, it is clear that a database of the GSETT-2 type can provide anumber of useful rules to constrain the reinterpretation of phases reported by an NDC.This in turn will reduce the probability of false associations in the global event definitionprocess.
Reported event locations
During the GSETT-2 experiment, the National Data Centers (NDCs) were encouraged toprovide information on location parameters of events detected at their participating sta-tions.
These location parameters provide useful information to the automatic phase associationprocedure. Depending on the expected accuracy of the reported NDC location, a phaseassociated to an event by an NDC, can during the global phase association process berestricted to stem from events in target regions close to the NDC reported event location.
One-station event locations are usually found by associating a P- and an S-phase to a com-mon event, getting a distance estimate from the S-P travel-time difference and sourcedirection from the azimuth estimates of the phases. One-station event locations are therebymost commonly obtained for regional events, where clear P- and S-phases are frequentlyobserved. Reliable azimuth estimates of both P- and S-phases are obtained by arrays,whereas three-component stations have the ability to estimate the azimuth of P-phases.
To investigate the reliability of the NDC locations provided by the regional arrays,ARCESS, FINESA, NORESS and GERESS, we have in Fig. 7.3.5 plotted the station-to-event distances of the NDC locations against the station-to-event distances of the corre-sponding locations of the WASCEL. As seen from the plots, there are, with few excep-tions, good correspondence between these distance estimates.
A few phases associated to local or regional events by the NDC have, however, been asso-ciated to teleseismic events in the WASCEL. Incidentally, this is a violation of the rulesoutlined in GSE/CRP/Rev. 4 (1991) (Appendix B.3.2 (ii): "Observations of phasesreported as originating from local or regional distances may be used only within localand/or regional distances").
Conclusions
We have in this paper outlined a strategy for retrieving and organizing information onregionalized wave propagation characteristics for use by the GBF method algorithm. Dif-ferent types of relevant information derived from the GSETT-2 database have been shownin several examples. These examples illustrated features like the distance dependentoccurrence of seismic phases, the reliability of reported phase labels and the accuracy ofone-station event locations. In future work we plan to examine the GSETT-2 as well as
*9 -

NORSAR Sci. Rep. 1-92/93 November 1992
other data bases in more detail, in order to develop an optimum framework for applicationof the GBF method to a global network.
T. KvsernaU. Baadshaug
References
Bache, T.C., S.R. Bratt, J. Wang, R.M. Fung, C. Kobryn and J.W. Given (1990), The Intel-ligent Monitoring System, Bull. Seism. Soc. Am., 80, Part B, 1833-1851.
Bratt, S.R., HJ. Swanger, R.J. Stead, F. Ryall and T.C. Bache (1990), Initial results fromthe Intelligent Monitoring System, Bull. Seism. Soc. Am., 80, Part B, 1852-1873.
Gestermann, N. (1992), Interpretation of regional phases recorded at GERESS, in Pro-ceedings from the GERESS symposium, June 22-24, 1992, Waldkirchen, Bavaria,Germany.
GSE/CRP190/Rev. 4 (1991), Instructions for the conduct of Phase 3 of GSETT-2, Groupof Scientific Experts, U.N. Conference of Disarmament, Geneva, Switzerland.
Kvwma, T. and S. Mykkeltveit (1985), Propagation characteristics of regional phasesrecorded at NORSAR, Semiann. Tech. Summary, 1 April-30 September 1985, NOR-SAR Sci. Rep. No. 1-85/86, Kjeller, Norway.
Kvwma, T. (1990), Generalized beamforming using a network of four regional arrays,Semiann. Tech. Summary, 1 April-30 September 1990, NORSAR Sci. Rep. No. 1-90/91, Kjeller, Norway.
Mykkeltveit, S., F. Ringdal, T. Kvwrma and R.W. Alewine (1990), Bull. Seism. Soc. Am.,80, Part B, 1777-1800.
Ringdal, F. and T. Kverna (1989): A multi-channel processing approach to real-time net-work detection, phase association and threshold monitoring, Bull. Seism. Soc. Am.,79, 1927-1940.
Sereno, TV., H.J. Swanger, R.D. Jenkins, W.C Nagy and D. Wahl (1992), Attenuation andtravel-time characteristics of regional phases recorded at GERESS, in Proceedingsfrom the GERESS symposium, June 22-24, 1992, Waldkirchen, Bavaria, Germany.
91

NORSAR Sci. Rep. 1-92/93 November 1992
8.0km/s 4.5km/4 3.5km/s450 ,
t I I
1 l! I
I i
50 2• "I I 3& .~
""I I
I-- I Ii0j) I
o 570 1
-d 8.0km/s 4.Skm/s 3.Skm/s<: 1200cc 4 ~ •I-- 04 h 4
I I!
II I
W
130o- 6
1350 j I
0 50 100 1SO 200 250
REDUCED TRAVEL TIME (s)
Fig. 7.3.1. Illustration of variation of relative importance of the phases Sn and Lg for sixevents with locations as indicated in the map. The standard group velocities of 4.5and 3.5 km/sec, commonly assigned to Sn and Lg, respectively, are marked bydashed lines. The upper three traces cover the distance interval from 480 to 550 kin,while the lower three traces correspond to epicentral distances in the range from1,225 to i ,320 km. The location of the NORSAR array is denoted by a ring on themap, and the traces are from NORSAR seismometer 02B01. The data are bandpass-filtered I to 5 Hz. The reduction velocity is 8.0 km/sec. From Mykkeltvelý et al(1990).
92

NORSAR Sci. Rep. 1-92J93 November 1992
GSETT-2 stations
* ArraysA Three componento Single stations
Fig. 7.3.2. Map showing the location of the stations participating in the GSETT-2 experi-ment.
I9

NORSAR Sci. Rep. 1-92/93 November 1992
ARAO regional phase distribution4 or more defining phases
Phase ids from WASGEL
a)
Ez a
Distance in degrees
NDC reported phase ids
E
Distance in degrees
Fig. 7.3.3.
a) Histogram showing the distance dependent occurrence of regional phases observedat the ARCESS array in Norway (ARAO). Event to station distances and phaselabels are both taken from the WAShington Current Event List (WASCEL).
b) Histogram showing the ARCESS regional phase labels reported by the NorwegianNational Data Center (NDC). Event to station distances are taken from the WASh-ington Current Event List (WASCEL).
94
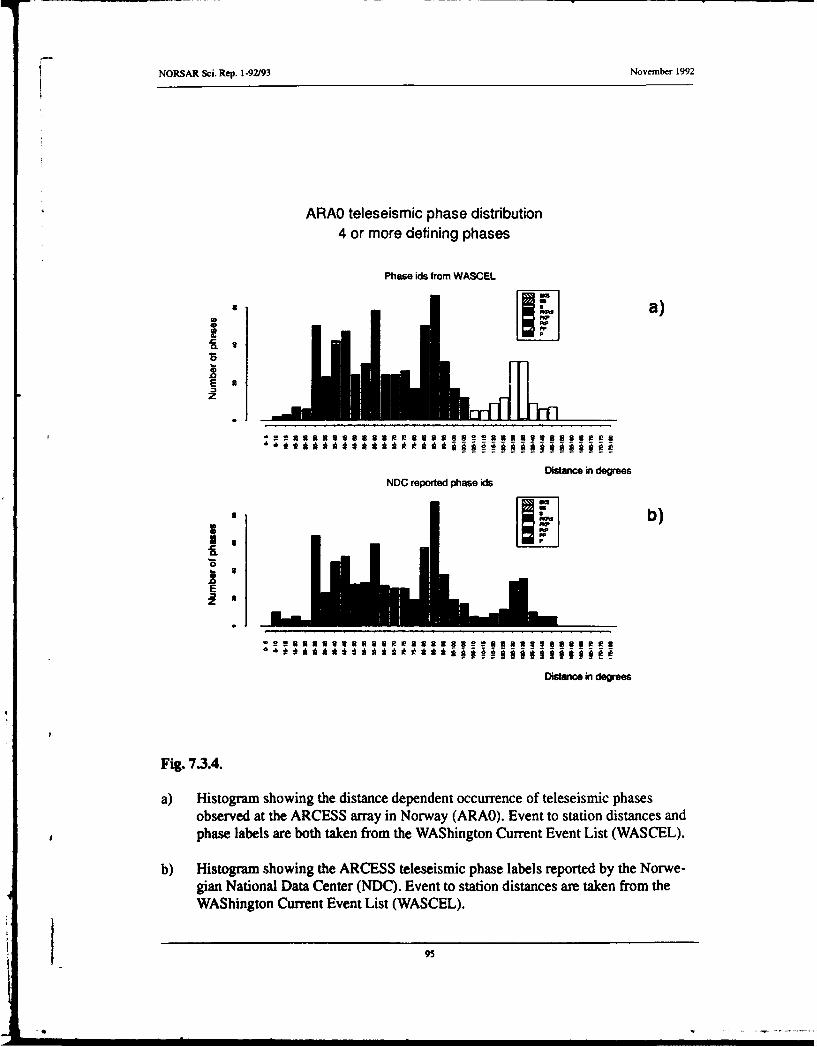
NORSAR Sci. Rep. 1-92/93 November 1992
ARAO teleseismic phase distribution4 or more defining phases
Phase ids from WASCEL
* ~ a)
E a
z
Distance in degreesNDC reported phase ids* 1 b)us
E
Distarmce in degees
Fig. 7.3.4.
a) Histogram showing the distance dependent occurrence of teleseismic phasesobserved at the ARCESS array in Norway (ARAO). Event to station distances andphase labels are both taken from the WAShington Current Event List (WASCEL).
b) Histogram showing the ARCESS teleseismic phase labels reported by the Norwe-gian National Data Center (NDC). Event to station distances are taken from theWAShington Current Event List (WASCEL).
95

NORSAR Sci. Rep. 1-92/93 November 1992
ARCESS FINESA
8
w 0000
0 5 10 15 20 25 0 5 10 15 20 25
NDC Distance (degrees) NDC Distance (degrees)
NORESS GERESS
0 o8-8(aD
0 5 10 15 20 25 0 5 10 15 20 25
NDC Distance (degrees) NDC Distance (degrees)
Fig. 7.3.5. Plots showing the relation between NDC reported event locations and thosegiven in the WASCEL, obtained after global phase association, for the regionalarrays ARCESS, FINESA, NORESS and GERESS. Two lines with deviations of +3degrees, respectively, are shown on each plot.
4
96 2

rF-
NORSAR Sci. Rep. 1-92/93 November 1992
7.4 Two techniques for constructing a uniform grid system coveringthe Earth's surface
In many geophysical studies there is a need to divide the entire earth's surface into areas ofequal size and shape. An example, discussed in subsection 7.5 is the application of theGeneralized BeamForming technique for global seismic monitoring. According to Rott-man (1960), there are only five polyeders that can be used for a such division, and amongthese, the icosaeder has the largest number of subareas (20 equilateral triangles). For fur-ther refinement, approximations have to be made.
We have investigated the characteristics of two different techniques for quasi-uniformgridding of the surface of the globe. The first method uses a reference meridian and a ref-erence latitude as a starting point, and deploys equidistant grid points along equidistantlatitude circles, see Fig. 7.4.1. To obtain complete and non-overlapping coverage, specialcare has to be taken in the polar regions and near the longitude opposite to the referencemeridian,
The other method is adopted from seismic prospecting (Vinje et al., 1992), where triangu-lation of the icosaeder has been used to construct regularly sampled wavefronts, see Fig.7.4.2. Unlike the first method, complete and non-overlapping coverage are directlyobtained.
Properties of the gridding techniques
To visually compare the two methods, we have in Fig. 7.4.1 plotted a complete global gridsystem produced by the first technique, hereafter called the rectangular method. In Fig.7.4.2 we have plotted a similar grid produced by triangulation of the icosaeder, hereaftercalled the triangular method. The number of points in these plots are nearly identical, i.e.,645 versus 642. We see that for the rectangular method the shape of the area spanned byeach grid point and its eight neigbours becomes heavily distorted in certain regions. Thisis especially the case in the polar regions and for longitudes far away from the referencemeridian. For the triangular method, the shape of the area spanned by each grid point andits six neighbours remains much more uniform. It should, however, be noticed that the 12points constituting the original icosaeder only have five neighbors.
To obtain complete coverage of the earth, we define a circular region around each gridpoint. For the triangular grid, we have found that circles with radii as shown in Fig. 7.4.4completely cover the earth surface. We could as well have chosen types of geometriesdifferent from the circle, like the pentagon or the hexagon where the degree of overlap issmaller, but for use in our subsequent analysis, the simplicity of the circle is preferable.For the rectangular grid, we have in Fig. 7.4.3 plotted circles with the same radii as in Fig.7.4.4, and we find that there are certain areas that have not been spanned by any of the cir-cular regions, and hence, circles with larger radii are required. The triangular methodtherefore gives more effective coverage.
497

NORSAR Sci. Rep. 1-92/93 November 1992
Another appealing property of the triangular technique is that each grid point has a well-defined pointer structure to its neighbours. For a given sub-region, this enables us to con-struct a refined grid system in a straightforward manner.
In contrast to the rectangular method, wh.re an arbitrary number of grid points can bespecified, the number of grid points obtained by the triangular method can only take oncertain discrete values. These values are given in Table 7.4.1, together with the radii of thecorresponding circular regions.
Number of divisions Number of points Circle radius (degrees)of the icosaeder
0 12 43.81 42 21.92 162 11.03 642 5.54 2562 2.75 10242 1.46 40962 0.7
Table 7.4.1.
In conclusion, there are strong arguments for preferring the triangular method to the rect-angular method. The only argument in favour of the rectangular method is the possibilityof constructing a grid of arbitrary density.
T. Kvierna
References
Rottman, K.: Mathematische Formelsammlung (1960): Bibliographisches Institut Man-nheim/Wien/Zurich
Vinje, V., E. Iversen, H. Gjoystdal and K. Astebol (1992): Tiaveltime and amplitude esti-mation using wavefront construction. Abstract of papers presented at the 54th Meet-ing and Technical Exhibition of the European Association of ExplorationGeophysicists, Paris, France, 1-5 June 1992.
9'
i

NORSAR Sci. Rep. 1-92t93 November 1992
645 grid points, rectangular
Fig. 7.4.1. Global grid constructed by the rectangular method. The latitude and longitudesteps were chosen to be 7.95 deg. The connection lines between a grid point and itseight neighbours are also shown.

NORSAR Sci. Rep. 1-92/93 November 1992
642 grid points, triangular
Fig. 7.4.2. Global grid constructed by the triangular m:xI'od. The 642 points wereobtained by a tree-fold triangulation of the original icosaeder. The conncction linesbetween a grid point and its six neighbours are also shown.
too

NORSAR Sci. Rep. 1-92/93 November 1992
645 grid points, rectangular
Ii
Fig. 7.43. Circular regions of radius 5.5 deg. encompassing each grid point constructedby the rectangular method. Note that for certain areas the coverage is not complete,e.g., around 70N, 60E (marked by an arrow).
101

NORSAR Sci. Rep. 1-92t93 November 1992
642 grid points, triangular
Fig. 7.4.4. Circular regions of radius 5.5 deg. encompassing each grid point constructedby the triangular method. Note that the coverage is complete.
102

M1
NORSAR Sci. Rep. 1-92/93 November 1992
7.5 Initial results from global Generalized Beamforming
We will in this paper outline some of the fundamental concepts for using the GeneralizedBeamForming method (GBF) to conduct phase association and event location on a globalscale. Towards the end of the paper we will also present initial results from GBF process-ing of detection data from the GSET'7-2 database. The GSETT-2 network consisted ofabout 60 globally distributed stations (including single-component, three-component andarrays), see Fig. 7.3.2., which reported phase readings and waveforms to a common data-base during a period of six weeks. Detailed instructions for the conduct of the GSETT-2experiment are given in GSE/CRP190/Rev.4 (1991).
The Generalized Beamforming method for phase association and event location (Ringdaland Kvwmna, 1989), has been proven to work well on a regional scale (distances withinapproximately 2000 km) using continuous detection data from the four regional arraysARCESS, FINESA, GERESS and NORESS (Kvrma, 1990; Kvwma, 1992). Taylor andLeonard (1992) are currently conducting research on applying this method to teleseismicdata from a 17 station global network. Their results indicate that the GBF method can beeffectively used as a means of conducting automatic global teleseismic phase association.
In order to extend the GBF method to work on both regional and teleseismic data from alarge global network we have found it necessary to develop a framework that facilitatestesting of the method with different parameter settings. We will in the following give adetailed description of this framework.
Division of the earth into regular target regions
The basic idea behind the GBF method is to match the predicted phase arrivals from hypo-thetical events in a predefined set of target regions to the actual detections at each observ-ing station. We have chosen to define these target regions by their center coordinates and acircular area of a given radius. Initially we will deploy the center of the target regions at acommon depth and ensure that the circular areas cover the entire surface of the earth. Inpractice, the target region will constitute a volume around the center grid point, and willthus also accommodate hypothetical events within a given depth range.
In section 7.4, we have described two techniques for constructing a uniform grid systemcovering the earth's surface. Results from this study indicate that the method based on tri-angulation of the icosaeder (the triangular method) is preferable. The density of the gridsystem is given by a single variable determining how many times the original icosaeder isdivided by triangulation. Figs. 7.5.1 - 7.5.3 show global grid systems obtained by two-,three- and four-fold triangulation of the icosaeder. The number of global grid points inthese figures are respectively 162, 642 and 2562, and the respective radii of the corre-sponding circular areas encompassing each grid point are 11.0, 5.5 and 2.7 degrees.
103

NORSAR Sci. Rep. 1-92/93 November 1992
Parameter tolorances due to the areal extent of the target region
Time tolerance
On the global map of Fig. 7.5.4 we have plotted a 162-point global grid system with targetregions of 11 degrees radii. Let us consider a P-phase at the NORESS array from a hypo-thetical event in the highlighted target region. As shown on Fig. 7.5.5, the P-phase travel-times from events within this target region can differ by almost 200 seconds. This has tobe taken into account in the process of matching predicted and observed phase arrivals,and in practice, the following procedure is used:
Assume that we have a phase detection at the NORESS array with arrival time Tar. Theminimum and maximum predicted travel-times of P-phases from the highlighted targetregion are given by TTmin and TTmax. If the observed arrival at NORESS is to be a P-phase from an event in the target region, the origin time of the event would theoreticallybe bounded by OTmin and OTmax given by
OTmin = Tarr- TTm.x (1)
oTm. = T rr, -TTmi. 2)
Slowness vector tolerances
If the observing station is providing azimuth and/or slowness estimates of the detectedphases, these estimates can constrain the use of the detections in the phase association pro-cess, and thus prevent false associations. Let us again consider a P-phase at the NORESSarray from a hypothetical event in the highlighted target region shown on Fig. 7.5.4. Tocover the entire target region, the P-phases will theoretically span an azimuth and slow-ness range falling within the solid curve of Fig. 7.5.6. In practice, we make an approxima-tion to the area within the solid curve by specifying four parameters, i.e., the minimumand maximum values of slowness and azimuth. As seen on Fig. 7.5.6, this will constitutean area only marginally larger than the original. So in order to match the observed arrivalat NORESS to a P-phase from a hypothetical event in the target region, the estimated azi-muth and slowness would theoretically have to fall within these bounds.
Parameter tolerances due to deviations from the theoretical model
Time tolerances
In addition to the parameter tolerances compensating for the areal extent of the sourceregion, we also have to take into account the effects of sampling rate, errors in the estima-tion of arrival-time and slowness vector, propagation path, source type and other types ofrandom errors.
Let AT be the sampling rate in time of the generalized beam for the highlighted targetregion of Fig. 7.5.4, and let TdV - (early arrival) and TdE, + (late arrival) be the maxi-mum allowable deviations from the predicted P travel-time, taking into account path
104

NORSAR Sci. Rep. 1-92/93 November 1992
effects, onset time estimation errors, source effects and other types of random errors. If weagain consider the situation with a phase detection at the NORESS array with arrival timeTar, hypothesized to be a P-phase from an event in the highlighted target region, we findthat the origin time of the event has to be within the following bounds:
ATOTIow = Tarr- TTmax - -Td, (3)
ATOThigh = Tarr - TTmin+. + Tdev+ (4)
These are the bounds actually used in the GBF matching procedure. Initial residualrequirements (TdeV- and Tdev + ) for P-phases in the GSETr-2 experiment were 1.5 sec-onds, whereas for S-phases they were set to 7.5 seconds.
Slowness vector tolerances
One way of including the effects of random errors when matching the estimated and pre-dicted slowness vectors, is to require the absolute value of the slowness vector residual tobe less than a predefined value. In the GSETT-2 experiment different requirements wereused for three-component stations, high-frequency arrays and short-period arrays, reflect-ing their different abilities to correctly estimate the slowness vector.
The procedure of comparing a slowness vector observation with the predicted slownessand azimuth range of a target region, including the residual requirement, can be describedby the following example:
Let us again consider the situation of a P-phase at the NORESS array from a hypotheticalevent in the highlighted target region of Fig. 7.5.4. A phase detection at NORESS has aslowness and azimuth estimate given by the asterisk on Fig. 7.5.7, and according to theGSETT-2 instructions, the corresponding residual requirement is 3.0 sec/deg, indicated bythe circular area encompassing the estimated slowness vector. If there is an overlapbetween this circular area and the sector segment corresponding to the expected range ofslowness vectors from the target region (also see Fig. 7.5.6), the phase detection is said tomatch the P-phase of a hypothetical event in the actual target region. On the other hand, ifthere is no overlap, the observation is not matching this hypothesis.
Additional constraints on the use of a phase detection
When initiating the GBF procedure with a predefined set of target regions, we computeand store the minimum and maximum azimuths and distances to every station in the net-work. The availability of these parameters enables us to constrain the use of a phase detec-tion in a simple and well-organized way.
As an example, assume that we have a phase detection with peak frequency well above10 Hz, and that we are trying to match this detection to an Lg phase from a hypotheticalevent in a target region located 15-20 degrees away from the recording station. Accumu-lated statistics has shown that at this station, Lg with peak frequencies above 10 Hz are
105

NORSAR Sci. Rep. 1-92/93 November 1992
never observed from events at distances greater than 5 degrees. As such information iseasily included in the data structure of the GBF procedure, we can compare this informa-tion to the actual distance to the target region, and consequently find that this phase detec-tion cannot be an Lg phase originating in this target region.
Another example: A P and an S-phase recorded at an array station have been associatedand an initial event location has been provided. Accumulated event statistics at this stationhas given us an estimate of the uncertainty of such one-array event locations. If a targetregion is located too far away from the one-array event location, these two phases can beexcluded as originating from an event in this target region.
A third example: Several successive phase detections at a given station have been associ-ated with the same event, either by automatic processing or by an analyst. If we are match-ing these detections to an event in a target region from where Pn is expected to be the first-arriving phase, only the first of the consecutive detections can possibly be the Pn-phase(we ignore multiple events at this stage). Such context-dependent information is straight-forward to include in the GBF algorithm.
These three examples constitute samples from three different classes of constraints thatcan be imposed on the use of a phase detection.
"* Constraints inferred from measurements on a single phase, e.g., slowness vector,dominant frequency, frequency spectrum, polarization attributes, signal-to-noiseratios, etc.
"• Constraints inferred from a reported event location at a given station.
"* Constraints inferred from the pattern of detections at a given station. The last twotypes of constraints are based on so-called context-dependent information.
Step-by-step description of the GBF method
Having defined some of the key elements of the GBF method for phase association andevent location, we will continue with a step-by-step description of the algorithm.
Definition of the station network: Determine which stations to process for phaseassociation and event location.
0 Definition of initial phase type candidates: Decide the phase types that may beconsidered in the phase matching process, e.g. P, PKP, Pn, Pg, S, Sn, Lg, Rg, etc.
0 Constraining the use of the phase detections: From phase measurements (domi-nant frequency, slowness, azimuth, etc.), single station location reports and othersingle-station context information, we do, for every phase detection at every station,impose constraints on their use. For each initial phase type candidate, every detec-tion is assigned a row in a database table. This row may contain information on theallowable distance range, depth range, and azimuth range of a hypothetical eventcreating this hypothetical phase type. If no constraints are imposed, the distancerange is set to 0-180 degrees, the depth range to 0-1000 km and the azimuth range to
I06
f NORSAR Sci. Rep. 1-92J93 November 1992
± 180 degrees. If it is determined that a detection does -not correspond to one of theinitial phase-type candidates, e.g. Rg, the distance range of the Rg-row is set to anegative value.
Construct a grid of target regions: By using the triangular method, a global gridsystem of a predefined density is constructed, see section 7.4.
0 Determine which of the initial phase type candidates to consider: For every sta-tion-target region combination, we decide which of the initial phase type candidatesto consider for phase matching. E.g., if a target region is located 60-70 degrees awayfrom a station, it makes no sense to use regional phases like Pn, Pg. Sn, Lg or Rg.On the other hand, if a target region is located at regional distances from a station,teleseismic phases for that station can be ignored. Along with the list of phases toconsider from each target region, we store the expected travel-times, slownesses andazimuths, as well as the respective tolerance limits. The decision of which phases toconsider and their corresponding travel-times and slowness vectors can be inferredfrom general travel-time tables and great-circle azimuths, or, if available, fromregional knowledge on the wave propagation characteristics at a given station, seesection 7.3.
0 Compute generalized beams for each target region: For each target region, at reg-ular origin time intervals, we match the observed phase detections in the network tothe predicted phase arrivals from a hypothetical event in the region. The value of thegeneralized beam at a given origin time is the actual number of matching phasedetections. To avoid a list of phase associations that may look unreasonable from aseismological point of view, we have imposed three constraints in the phase match-ing process. These are:
i) A phase detection can be associated with only one hypothetical phase arrival.
ii) A hypothetical phase arrival can be associated with only one phase detection,preferably the one with the smallest time residual.
iii) The chronological order of the associated phase detections have to match thechronological order of the predicted phase arrivals. This is to avoid inconsis-tencies like an S-phase associated to arrive before a P.
Along with the identifications of the matching detections (arids), we also store thetime residuals relative to the center location of the target region. For stations provid-ing azimuth and slowness estimates, the corresponding residuals are also stored.
0 Finding the event location from the best generalized beam: If our predictions ofphase arrivals are reasonable, an event should be reflected by a peak in the general-ized beam representing the event target region. However, like in conventional beam-forming, we encounter the problem of sidelobes, and will therefore have to selectone generalized beam peak as representing the origin time and location of the event.Initially, we will use the procedure of considering the peaks at all generalized beamswithin a predefined time interval and select the one with the highest number ofmatching phases, and if equality, select the one with the smallest absolute time resid-ual.
107

NORSAR Sci. Rep. 1-92/93 November 1992
Remove associated phases and look for next event: Once an event is located andthe associated phases identified, these phases have to be removed from further con-sideration. This is done by recreating the generalized beams without using thephases associated to the located event, and then look for new peaks and new events.
GBF processing on a global scale with a large number of target regions is a computerintensive task. One way of reducing the computational load is to start out with a coarsegrid, and then reprocess a denser grid surrounding the initial event location for a timeinterval around the event origin time. In the next sub-section the effect of the grid densitywill be illustrated with examples from GBF processing of GSE1FT-2 data.
The influence of grid density; an example with an earthquake in Tadjikistan
As a first test of global Generalized BeamForming, we have processed a 1 hour time inter-val of GSETI-2 data that included an earthquake in Tadjikistan. The event location pro-vided by the Washington Experimental International Data Center was:
Date Origin time Latitude Longitude Depth mb MS
91/05/14 00:28:45.4 37.63N 72.30E 7 km 4.3 4.2
The GSETr-2 database consisted of detections from 60 stations, and as initial phase typecandidates we used the teleseismic phases P, S and PKP, and the regional phases Pn, Pg,Sn, Lg and Rg. This is in accordance with the GSETT-2 instructions on the procedures forpreparing an initial event list. Jeffereys-Bullen travel-time tables were used to predict thetravel-times and slownesses, and directions along the great-circles were used to predictazimuths. Regional phases were only considered for distances within 20 degrees, and Rgonly within 4 degrees. The other instructions relevant to the GBF algorithm, like time andslowness vector residual requirements and restrictions on the use of reported phases werealso followed in the processing.
To investigate the influence of grid spacing on the resolution and performance of the GBFmethod, we first deployed a 162-point grid system covering the earth's surface. The corre-sponding circular areas encompassing each grid point had a radius of 11.0 degrees. For thegeneralized beams representing each target region, we searched for the maxima in a timeinterval ± 20 minutes around the origin time of the event. These maxima were then inter-polated and contoured onto the global map of Fig. 7.5.8, where the color scale representsthe number of associated phases at the maxima of the generalized beams. A clear peak isfound at target regions near the event location, and the overall maximum was 13 associ-ated phases.
Fig. 7.5.9 and 7.5.10 represent the same type of data, but computed with denser grid spac-ing. It is clearly seen that the resolution is improved and the sidelobe effect is reduced withdenser grid spacing. The overall maxima in these figures were only 12 associated phases,
109
NORSAR Sci. Rep. 1-92/93 November 1992
indicating that with a coarse grid spacing, phases with large time and/or slowness vectorresiduals can be associated as defining phases. However, by looking at the results fromprocessing the coarse 162 point grid system (Fig. 7.5.8), we find that it provides a goodinitial location of the event. This location can subsequently be improved by constructingand processing a denser grid around the initial location.
We have in this study outlined some of the fundamentals for global Generalized Beam-Forming. The procedures for processing target regions of different areal extent has beendescribed, and a step-by-step description of the procedure has been given. To obtain auto-matic event locations from processing GSETI-2 detection data, more program coding isneeded. However, we have developed the framework for GBF processing on a global scalethat facilitate research and testing of the method. This will become very useful in thedevelopment of the complete system.
T. Kvgerna
References
GSE/CRP/190/Rev.4 (1991): Instructions for the conduct of Phase 3 of GSETT-2, Groupof Scientific Experts, UN Conference of Disarmament, Geneva, Switzerland.
Kvwmrna, T. (1990): Generalized beamnforming using a network of four regional arrays,Semiann. Tech. Summary, 1 April - 30 September 1990, NORSAR Sci. Rep. No. 1-90/91, Kjeller, Norway.
Kvxrna, T. (1992): Automatic phase association and event location using data from a net-work of seismic microarrays, Semiann. Tech. Summary, 1 October 1991-31 March1992, NORSAR Sci. Rep. No. 2-91/92, Kjeller, Norway.
Ringdal, F. and T. Kvwerna (1989): A multi-channel processing approach to real time net-work detection, phase association, and threshold monitoring, Bull. Seism. Soc. Am.,79, 1927-1940.
Taylor, D.W. A. and S.K. Leonard (1992): General beamforming for automatic associa-tion, in Papers presented at the 14th Annual PL/DARPA Seismic Research Sympo-sium, 16-18 September 1992, Loews Ventana Canyon Resort, Tucson, AZ, USA.
109

1 NORSAR Sci. Rep. 1-92/43 November 1992
162 grid points
Fig. 7.5.1. A 162-point global grid system projected onto an azimutal orthographic projec-tion of the earth. This grid system was obtained by a two-fold triangulation of theicosaeder, and each grid point represents a target region of 11 degrees radius.
110

NORSAR Sc. Rep. 1-92/93 November 1992
642 grid points
Fig. 7.5.2. A 642-point global grid system projected onto an azimutal orthographic projec-tion of the earth. This grid system was obtained by a three-fold triangulation of theicosaeder, and each grid point represents a target region of 5.5 degrees radius.
I !11
=• S• . . . . . . . . . . . . . . . . . . . . . . . . . . . . . . . . . . . . . . . . . . . . . . . . . --.i
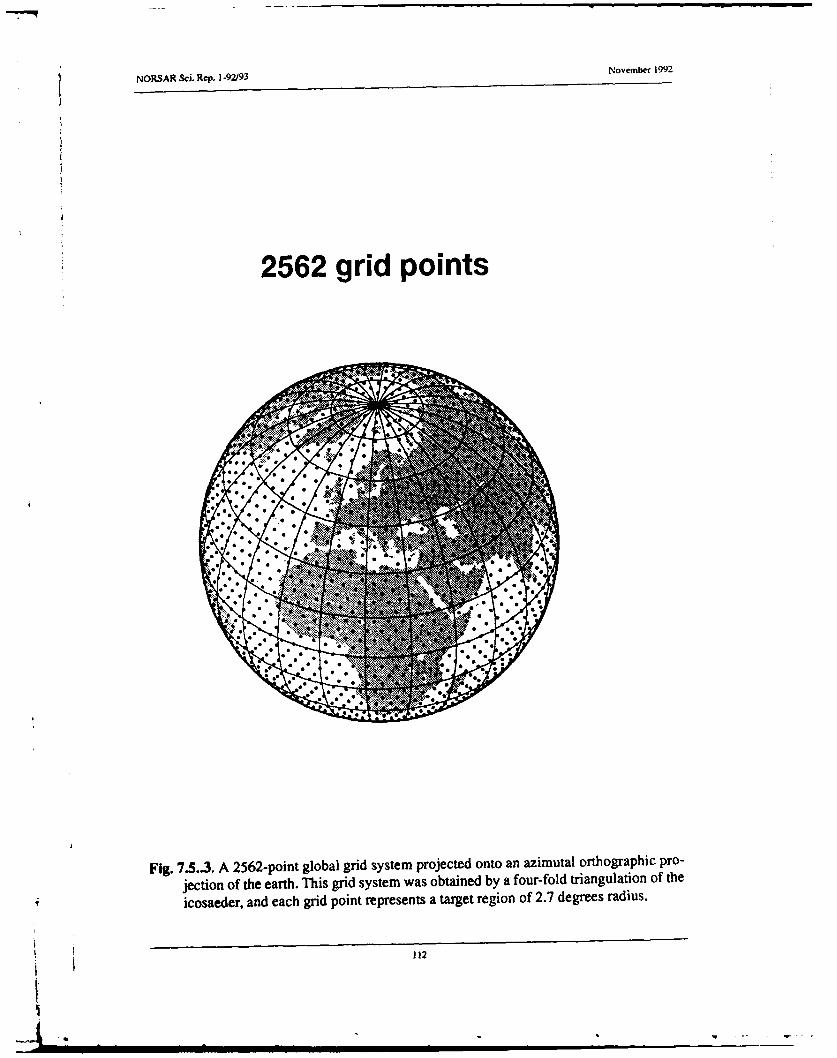
NORSAR Sci. Rep. 1-92/93 November 1992
2562 grid points
Fig. 7.5.3. A 2562-point global grid system projected onto an azimutal orthographic pro-
jection of the earth. This grid system was obtained by a four-fold triangulation of the
icosaeder, and each grid point represents a target region of 2.7 degrees radius.
112

NORSAR Sci. Rep. 1-92/93 November 1992
Distance 37.5 deg Radius 11 deg
Fig. 7.5.4. A 162-point global grid system projected onto an azimutal orthographic projec-tion of the earth. The circular target regions are shown by dashed circles, and the thehighlighted target region is given special attention in this study. Its center point islocated 37.5 degrees from the NORESS array. Minimum and maximum azimuthallines from NORESS to the target region are also shown.
1 113

NORSAR Sci. Rep. 1-92/93 November 1992
P-phase from 37.5 deg.
Region radius: 11 deg.
"-'min "center TTr.,ax
300 350 400 450 500 550
Travel time (sec.)
Fig. 7.5.5. Figure showing the range of predicted P-wave travel times from the highlightedtarget region of Fig. 7.5.4 to the NORESS array.
114

NORSAR Sci. Rep. 1-92/93 November 1992
P-phase from 37.5 deg.
Region radius: 11 deg.
_0
V0a O
U)C:
.0
0 6 8 10
E-W slowness (sec/deg)
Fig. 7.5.6. Figure showing the range of predicted P-wave slowness vectors at NORESSfor events in the highlighted target region of Fig. 7.5.4. The slowness vectors of thecircular boundary of the target region are projeted onto the solid line of this figure.An approximation to the area inside this solid line is given by the dotted sector seg-ment defined by the minimum and maximum azimuths and the minimum and maxi-mum slownesses.
f 1

NORSAR Sci. Rep. 1-92i93 November '992
Matching slowness observationResidual requirement: 3.0 sec/deg.
0
0•)
C/.-CD
0 2 4 6 8 10
E-W slowness (sec/deg)
Fig.7.5.7. Figure illustrating the procedure used when matching observed and predictedslowness vectors. As explained in Fig. 7.5.6, the dotted sector segment approximatethe expected range of P-wave slowness vectors for events in the target region. Theslowness vector estimate of a detected phase is given by the asterisk, and the maxi-mum allowable slowness vector residual (determined A priori) determines the sur-rounding circle. As seen on the figure, there is an overlap between this circular areaand the sector segment corresponding to the expected range of slowness vectors forP-waves from the target region. Thereby, the phase detection is considered to matchthe slowness vector of the P-phase of a hypothetical event in the actual target region.
116
C')...

NORSAR Sci. Rep. 1-92/93 November 1992
162 grid points
iI
-1 4 5 6 7 8,9 10 11 12 13
Tadjikistan
Fig. 7.5.8. Contoured maxima of generalized beams for a 162-point grid system. The max-ima of each generalized beam were found by searching a time interval of + 20 min-utes around the origin time of an event in Tadjikistan. The colour scale represent thenumber of associated phases.
j 117
W &VAM L TO D DOES NOT PEFMT FLLY LEGIBLE REPRODUCTIOWj

NORSAR Sci. Rep. 1-92/93 November 1992
642 grid points
-1 4 5 6 7 8 9 10 11 12
Tadjikistan
Fig. 7.5.9. Same as Fig. 7.5.8, but with a 642-point grid system.
COPY AVAILAE TO DTIC DOES NOT PERIUT FULLY LEGIBLE REPRODUCTIOII,
f 118

NORSAR Sci. Rep. 1-92/93 November 1992
2562 grid points
-1 4 5 6 7 8 9 10 11 12
TadjikistanFig. 7.5.10.. Same as Fig. 7.5.8, but with a 2562-point grid system.
119

NORSAR Sci. Rep. 1-92193 November 1992
7.6 The Ukrainian event of 16 September 1979
On 28 June 1992, an article appeared in the New York Times of considerable interest to sci-entists working in the field of seismic monitoring:
Excerpt from the New York Times, 28 June 1992
"(headline) Izvestiya Reports '79 A-Test at Ukraine Mine
MOSCOW, June 27 (AP) -- Soviet scientists set off a nuclear blast in 1979next to a Ukrainian coal mine, then sent thousands of miners back to theshaft a day later without telling them, the newspaper Izvestiya reported.
The article, published on Friday, may shed some light on long-standingassertions by miners that a nuclear blast caused unusually high levels ofradiation around a town it identified as Yunokommunarsk.
Izvestiya said officials have previously attributed the level of radiation inthe area, which has registered three or four times normal, to industrialwaste and to the 1986 nuclear disaster at Chernobyl, 625 miles to the north-west.
Izvestiya did not report higher incidences of death, cancer or other diseasesin the area near the mine, and officials could not be reached for commenttoday.
The report said the bomb had been detonated to see if the explosion wouldclear the mine of dangerous methane gas. It added that officials had dis-guised the incident by staging a civil defense drill and evacuating thetown's 8,000 residents, most of whom were miners."
It turned out that the original release from AP had more information than used by the NewYork 7TImes. Thus AP stated that the detonation occurred at noon Sept 16, 1979 and that theyield was 1/3 kt. The location of the town, Yunokommunarsk, is approximately 48.22°N,38.30°E.
Based on this information, we examined available seismic event lists in detail to see if thisevent could be confirmed. We searched for an event with origin time near 09.00.00 GMT,which corresponds to noon Moscow time. However, the event was not reported, neither byagencies using global network data (ISC, NEIC) nor by other available sources.
The Ukrainian event was not reported in the NORSAR monthly bulletin. However, theNORSAR automatic detector operates at a very low threshold, and many small events,especially at regional distances, are detected but not included in the monthly bulletins.
For this reason, we decided to check the original automatic detection lists in the NORSARarchive. It turned out that the automatic (unedited) NORSAR bulletin for 16 Sep 79 con-tains an event with the following parameters:
I
NORSAR Sci. Rep. 1-92/93 November 1992
Origin time (GMT): 08.59.53Location: 45N, 34E, Crimea regionMagnitude (mb): 3.3
The automatic plot for this event has been saved (Fig. 7.6.1), and shows a high frequencysignal, visible on at least 4 subarrays, but with poor signal coherency across the full NOR-SAR array. The analyst did not consider the event solution to be of high enough quality toinclude it in the final NORSAR bulletin, although there is no question that the event is real(and not a noise detection).
Unfortunately, at the time when this event occurred NORSAR could save only selecteddata intervals on tape. At the time, there seemed to be no reason to save this event, so thedigital data is no longer available. Only the event plots and the detector listings have beenretained.
The automatic location estimate (45N 34E) is somewhat different from the location ofYunokommunarsk, but well within the uncertainty for an event with such low signalcoherency. The estimated origin time is 7 seconds before the hour. As is well known, thetraditional Soviet PNE practice has been to detonate such explosions exactly on the hour.
Next, we tried to constrain the origin time of the event, under the assumption that its loca-tion was near Yunokommunarsk (see Fig. 7.6.2). Under the assumption that the event inquestion had an epicenter 48.220 N, 38.300E, its origin time is estimated to be as follows:
08.59.59.6 (using the IASPEI 1991 travel-time tables)08.59.56.7 (using the Jeffreys-Bullen tables).
In both cases, zero depth has been assumed. The signal arrival time was re-read visuallyfrom the plot (the correction was minor relative to the automatic arrival time estimate).
As is well known, the Jeffreys-Bullen tables tend to give 2-3 seconds too early origin timeestimates for Eurasian explosions, so the data are consistent with an origin time exactly onthe hour and a location approximately as given in the press report.
In terms of nuclear monitoring research, there are some important lessons to be learnedfrom this case study. Most importantly, automatic detector information is valuable. Itshould not be discarded, even when the analyst determines that the signal is of poor qual-ity, or the signal parameters are poorly defined. This is consistent with the conclusionsreached by the Geneva Group of Scientific Experts, which has repeatedly stressed that alldetected seismic signals should be reported by the participating stations in a future globalseismic network.
This case study also highlights an important consideration for CTB verification: seismicmethods will be only one of several monitoring tools. If an indication is obtained fromsome other source that a clandestine explosion might have taken place, it is important tobe able to confirm it through seismic recordings. This requires that at least one station in aglobal network is sensitive enough to provide such confirmation.
121

NORSAR Sci. Rep. 1-92/93 November 1992
Finally, it should be noted that at the time this event occurred there was no advancedregional array network in northern Europe. Today, the network of high-quality regionalseismic arrays NORESS, ARCESS, FINESA, GERESS, as well as other contributingarrays, are in continuous operation. Their recordings are regularly analyzed using theadvanced Intelligent Monitoring System (IMS). Had such an event occurred today, itwould with high probability have been detected, accurately located and reported. How-ever, an event this small would probably still be unidentified if the only data availablewere recorded at teleseismic distances. Even with regional data available, it can often bedifficult to identify such low-magnitude events reliably using current methods. Eventidentification at low magnitudes remains one of the most important research topics in thefield of seismic monitoring.
F. Ringdal, NORSARP.G. Richards, Columbia University
122
.= -*- -

NORSAR sci. Rep. 1-92/93 November 1992
NORSRR BULLE71N 16 SEP 1979 CODY' 259) EPX B4030 BP8 1.6-3.6 H22 8 59 5s: LI.ON 34.OE 33C 0 3.3 3M1 CRIPIER REGION3 9 4 32.8 NB2 P 1,3 0.8 10.0 20.9 125.3
RBN to
AB 18 V
F P1 2
.NI. 3 W + W
NOD 6
*2 E)B WfV*WA
NC2 93 -f ý
NC3 a
HCýi 12
NOS a "Sý jlýIijj11'1 I
95 t18 w wk$ w
9 .4 .15.
Fig. 7.6.1. NORSAR automatic event processing result for the event described in the text.The upper three traces are array beams, and the next 7 traces are subarray beams, fil-tered in the band 1.6-3.6 Hz. The vertical line marks the estimated arrival time. Thethree lines of text at the top summarize the automatically determined event parame-ters.
123
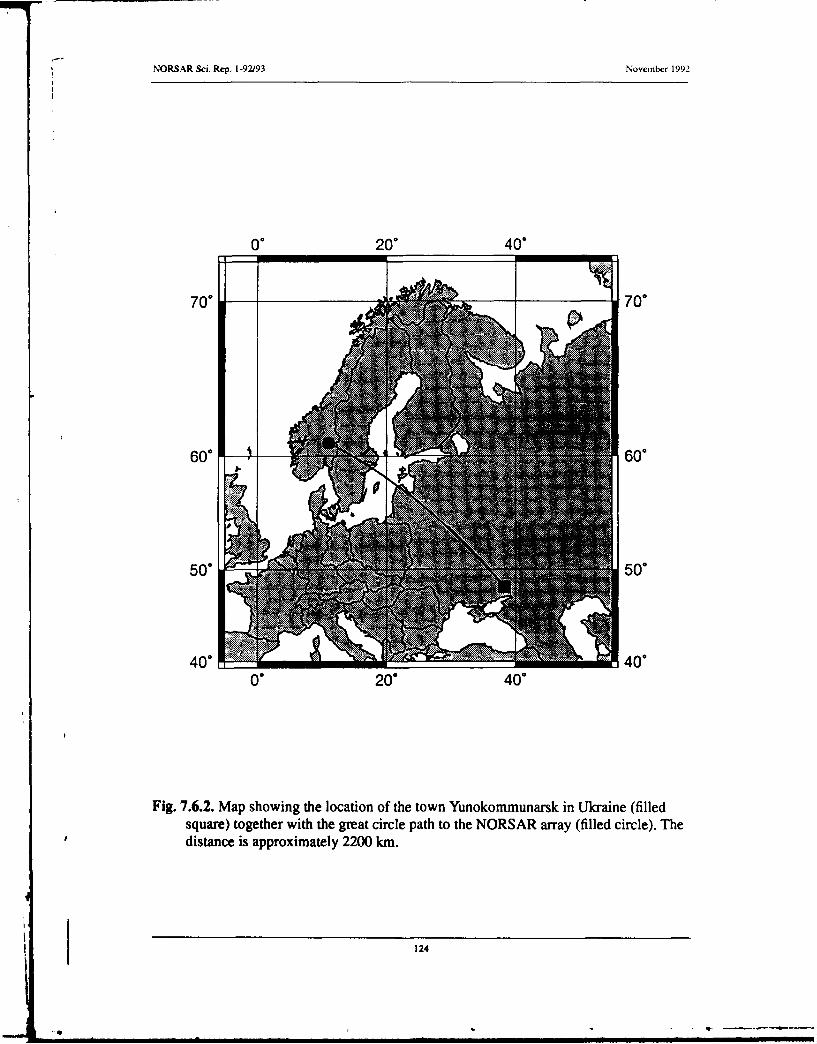
NORSAR Sci. Rep. 1-92/93 November 1992
00 200 40"
70" 700
60°11 60"
50° 50°
40* . ... 40"
0" 20" 400
Fig. 7.6.2. Map showing the location of the town Yunokommunarsk in Ukraine (filledsquare) together with the great circle path to the NORSAR array (filled circle). Thedistance is approximately 2200 km.
124

NORSAR Sci. Rep. 1-92/93 November 1992
7.7 Induced seismicity in the Khibiny Massif (Kola Peninsula)
The topic of this paper is to review recent processes of increasing seismic activity in theKhibiny Massif in the Kola Peninsula. It is a typical example of induced seismicity causedby rock deformation due to the extraction of more than 2. 1- IU- tons of rock mass since themid-I 960s. The dependence of seismic activity on the amount of extracted ore is demon-strated. Some, but not all, of the induced earthquakes coincide with large mining explo-sions, thus indicating a trigger mechanism. The largest earthquake, which occurred on 16April 1989 (ML = 4.1) could be traced along the surface for 1200 m and observed to adepth of at least 220 m. The maximum measured displacement was 20 cm.
Introduction
The Khibiny alkaline Massif (see Fig. 7.7.1) situated in the middle of the Kola Peninsulais tectonically unstable. Its seismic activity has been characterized by groups of a fewearthquakes with typically 8-10 years between groups (Panasenko, 1969). The Massifconsists of different blocks separated from each other by faults. The recent crustal move-ments are in the range from 2 to 4 mmlyear (Yakovlev, 1982).
The exploitation of the Khibiny apatite ores started in 1929 and since then about 2.5 • 109tons of rock have been mined from an area of about 10 km2 . This corresponds to adecrease of the gravitational component by typically 2.5-3.0 MPa, and for some parts ofthe Massif by as much as 9-12 MPa.
At the present time more than 108 tons of ore are extracted annually from three under-ground and three open-pit mines. The velocity of the uplift of the near-surface parts is ofthe order of 70 mm/year for some tunnels (Panasenko and Yakovlev, 1983).
Seismic activity of the Khibiny Massif
The extensive mining has disrupted the natural geodynamic process in the area, causing aredistribution of crustal stress, which in turn has led to increased seismic activity. Fig.7.7.2 shows in this respect the cumulative seismic energy release and the amount ofextracted ore for the mines in the Khibiny Massif. The seismic energy (E) released hasbeen calculated from the formula (Meyer and Ahjos, 1985):
logE = 12.30+ 1.2 7 ML (1)
where E is expressed in ergs. The similarity of the two curves strongly indicates a causalconnection. It should be noted here that the earthquake catalogue is considered homoge-neous back to 1978.
The dependence of seismic activity on the extracted deposit volume has long been knownfrom observations (Glowacka and Kijko, 1989). In the Khibiny Massif a more intensiveexcavation began in the mid-1960s, while the first significant tremors occurred in 1981.During that year four felt earthquakes (intensity I = 3-4 on the MSK scale) occurred in thevicinity of the mines. Some of these earthquakes were accompanied by sonic effects.
125
I-a - . --.------l--

NORSAR Sci. Rep. 1-92J93 November 1992
Around the same time, many rockbursts occurred near mines I and II (see Fig. 7. 1.1), eachof them displacing tons of rocks (1-10 m3). In fact, during five hours on 17 May 1981more than 20 rockbursts occurred. And for the first time the occurrence of an earthquake atthe time of an explosion was observed. Now this situation is typical for events in the Khib-iny Massif.
The largest earthquakes
An earthquake with intensity more than 5 in the nearby town of Kirovsk occurred on 29August 1982 immediately after an explosion of 106 tons in mine II and at the time of asmaller quarry explosion (4.6 tons) between mines I and II.
The next significant earthquake, felt with intensity I = 5 at Kirovsk, was on 19 June 1984.Less than one second before this earthquake there was a small explosion (40 kg, mine II).A large block of rock (65x70x70 m3) was broken and one part of it was displaced relativeto another by about 5 cm. After this earthquake there were so many rockbursts that it wasimpossible to carry out work in this mine for two weeks.
The strongest such earthquake (ML = 4.1), on 16 April 1989, occurred almost simulta-neously with a large explosion (240 tons) in mine I. This earthquake was felt with I = 8 inthe upper levels of the mine and I = 5-6 at Kirovsk. The maximum measured displacementwas 20 cm, and it occurred along a fault striking at 125-1350 and dipping at 30-35' NE.The displacement was traced along the surface for 1200 m and observed to a depth of atleast 220 m. This event was recorded by all seismic stations within a distance of 1000 kmn.Fig. 7.7.3 shows ARCESS recordings of this earthquake (distance 420 kin).
The earthquake was accompanied by a great number of aftershocks attaining several hun-dred for the two subsequent months. On 24 July 1989 another earthquake occurred here.Its size was much less (see Table 7.7.1); however, remarkable destruction again took placein this mine.
Conclusions
This paper has discussed to principal topics: a) the question of induced seismicity causedby rock excavation and b) the question of mining explosions as a trigger for earthquakesand rockbursts.
At present it is too early to make a definite conclusion about the triggering mechanismbetween explosions and earthquakes. In some cases pairs of such events are separated bysome milliseconds (for example, 16 April 1989, Fig. 7.7.3); in other cases they are sepa-rated by some seconds or more, sometimes they are not connected in time (for example, 2June 1992, Fig. 7.7.4).
126

NORSAR Sci. Rep. 1-92193 November 1992
However, the increase of seismic activity in the Khibiny Massif caused by the rock defor-mation due to the extraction of large volumes of rock mass is clearly demonstrated.
E.O. Kremenetskaya and V.M. TrjapitsinKola Regional Seismological Centre, Apatity, Russia
References
Glowacka, E. and Kijko, A. (1989). Continuous evaluation of seismic hazard induced bythe deposit extraction in selected mines in Poland. ESC Proceedings, 21 st Gen. Ass.Sofia, Bulgaria, 23-27 August 1988, 444-451.
Meyer, K. and Ahjos, T. (1985). Temporal variations of energy release by earthquakes inthe Baltic Shield. Geophysica, Vol. 21, 1, 51-64.
Panasenko, G.D. (19%9). Seismic features of the northeast Baltic Shield. Leningrad:Nauka, 184 pp (in Russian).
Panasenko, G.D. and Yakovlev, V.M. (1983). About the nature of anomalous deformationof a transport tunnel in the mountain Yukspor. In: Geophysical Investigations in theEur'r- in North of the USSR, KB AS USSR, Apatity, 38-44 (in Russian).
Yakovlev, V.M. (1982). Recent crustal movement in the zone of the southern contact of theKhibiny Massif from data geometric levelling. In: Geophysic and geodynamicinvestigations of the North-East of the Baltic Shield, KB AS USSR, Apatity, 85-88(in Russian).
j 127
"-M I,

NOFSAR Sci. Rep. 1-92/93 November 1992
No. Date Origin Distance Coordinates ML Seismictime (kin) energy (ergs)
1 1948 09230000 17.0 67.10 N 33.60 E 3.1 1.58E162 1955 0808 172059 17.0 67.70 N 33.60E 3.2 2.24E163 1955 08312115 17.0 67.70N 33.60E 2.5 2.80E154 1960 0209210731 10.0 67.60 N 33.60 E 2.0 7.08E145 1974 0930091142 17.0 67.70 N 33.70 E 3.5 6.31E166 19i9 1212 113452 13.0 2.1 9.27EI47 1981 0416205634 20.0 2.1 9.27E148 1981 )517075528 17.0 2.3 1.30E159 1981 -8 000747 19.2 2.5 2.98E15
10 1982 0422 110258 22.5 2.1 9.27E1411 1982 0829053335 17.0 67.70 N 33 70 E 3.3 3.10E1612 1984 0619054731 17.0 67.33 N 33.70E 5.9 1.79E1713 1984 1030105158 35.0 2.2 1.24E1514 1984 1030142148 17.5 67.68 N 33.72 E 2.3 1.66E1515 1987 0725 161339 22.5 67.(6 N 33.90 E 2.9 9.60E1516 1988 0113025153 25.0 67.73 N 33.83 E 2.6 4.00E1517 1988 0118020948 24.0 67 65 N 33.96 E 2.6 4.00E1518 1988 0120121510 6.0 67.60N 33.51,E 2.6 4.00E1519 1988 0211 124113 27.0 2.2 1.20E1520 1988 0304231701 18.0 67.70 N 33.70 E 2.1 9.30E1421 1988 0416 1157-5 18.0 67.66 N 33.75E 2.1 9.30E1422 1988 0622013408 10.5 67.65 N 33.47 E 2.4 2.20E1523 1988 1006094741 32.0 67.61 N 34.19 F 3.3 3.10E1624 1988 1123211108 23.0 67.60 N 33.80 E 2.5 3.00El 525 1989 0203 102741 33.7 67.80 N 33.90 E 2.2 1.20E1526 1989 0416063442 18.0 67.61 N 33.81 E 4.1 3.20E1727 1989 0707 114924 26.5 67.71 N 33.93 E 3.4 4.10E1628 1989 0724223234 15.0 67.60N 33.78 E 2.5 3.00E1529 1989 0804012618 21.0 67.60 N 33.90E 2.1 9.30E1430 1990 0210163907 37.1 67.89 N 33.48 E 2.2 1.20E1531 1990 0403075417 26.5 67.60 N 33.90 E 2.1 9.30Et432 1990 0612 113532 36.7 67.63 N 34.29 E 2.1 9.30E1433 1990 0621 130954 20.5 67.67 N 33.83 E 2.3 1.70E1534 1990 0621231904 15.5 67.67 N 33.66 E 2.2 1.20E1535 1990 0622015115 16.5 67.61 N 33.81 E 2.4 2.20E1536 1990 0624065848 19.4 67.61 N 33.88 E 2.4 2.20E1537 1990 0625062215 16.2 67.56 N 33.82 E 2.3 1.70E1538 1990 0625 113116 16.1 67.61 N 33.80E 2.2 1.20E1539 1990 0625215128 15.3 67.67 N 33.66 E 2.3 1.70E1540 1990 0626052403 19.1 67.72 N 33.30 E 2.4 2.20E1541 1990 0627004129 24.4 67.77 N 33.,9 E 2.3 1.70E1542 1990 0627025428 19.6 67.67 N 33.79 E 2.2 1.20El543 1990 0627051520 23.6 67.59 N 33.99 E 2.4 2.20E1544 1990 0627064141 29.0 67.66 N 34.07 E 2.8 7.20E1545 1990 0628015919 22.8 67.74 N 33.22 E 2.6 4.0OE1546 1990 0629041211 19.4 67.69 N 33.75 E 2.8 7.20E1547 1990 0630045139 20.4 67.62 N 33.90 E 2.4 2.20E1548 1990 0630064224 28.0 67.64 N 34.10 E 2.6 4.00E1549 1991 0305000836 23.7 67.55 N 34.00 E 2.1 9.30E1450 1991 0505054802 28.5 67.65 N 34.07 E 2.1 9.30E1451 1991 0815083545 24.1 67.63 N 33.98 E 2.1 9.30E1452 1991 1229 151425 27.0 67.70N 33.96E 2.1 9.30E1453 1991 1229 152044 25.0 67.57 N 34.03 E 2.1 9.30EI4
Table 7.7.1. Known earthquakes (ML> 2 .0) in the Khibiry Massif 1948-1991. The dis-tance to the APA station in Apatity is indicated.
128

NORSAR Sci Rep. 1-92/93 November 1992
33.00 33.25 33.50 33.75 34.00 34.25 34.50
Legend
*3<M,1-U 4<M,<5
E_ _ __ _ 1_ _ __ 67.75033.00 33.25 33~~~.50 3.5 3.0 42 45
Fi.771 h oiino ins(-I nteKiiyMssftgte ihfutsrcturs ad erthuaks. ine III nd ll re ndegrond.wheeasIV.V ad V ar
J 32J
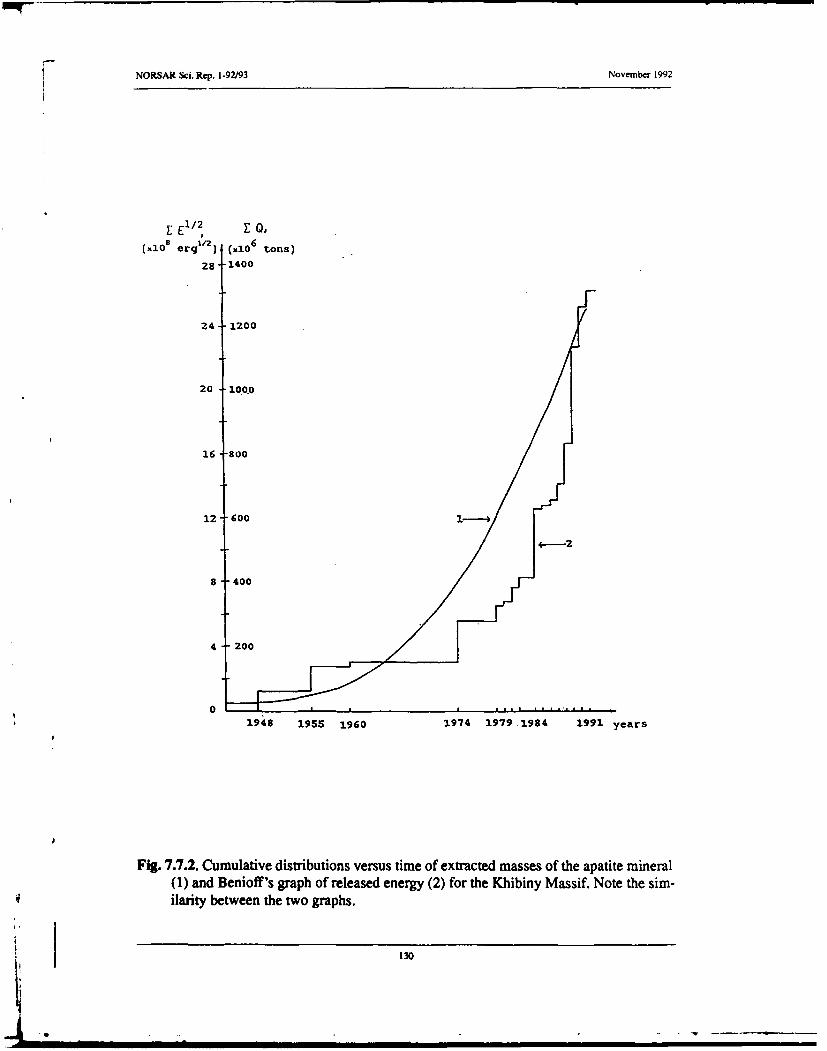
NORSAR Sci. Rep. 1-92/93 November 1992
SE 1/2 6
(x.10 erg •2 (xlO6 tons)
285 1400
24 1200
20 100.0
16 '800
12 -600
400
0 . . .
1948 1955 1960 1974 1979 .1984 1991 years
Fig. 7.7.2. Cumulative distributions versus time of extracted masses of the apatite mineral(1) and Benioff's graph of released energy (2) for the Khibiny Massif. Note the sim-ilarity between the two graphs.
130

NORSAR Sci. Rep. 1-92/93 November 1992
FKX 156,7 :reum FR06 At 1989-106:06.55.38.505 snr 1736.8Phose PN vel 7.70 ozI 123.60 rpw 0.760 q 1 a 72273.8 t 0.202 fbond 4.0 8.0-r Fý•N TPN
FRS.A.sz T- .' " 89392.
FRS-A 1.sz AL ".. ..,-,--. - -r......... .. 88069.
FRS.A2.sz IF I - .. 79894.1
FR S.A 3.sz r , . . t -.- - - - .. . . . . . ' j.- 1 0 5 41 7
ý',,-B ...1" .. -- .... .. . .. 79764.
FRSB2.sz 1 4 68551
* FRS.83.sz 4 0 59069.
I FRS.B4.sZ 0 167063.
FRS.B5.sz W 64491.
S7RO6 $04 4 0 76405.
,FR06 108770
06.36
1989- 106:06.35.08.505 16/04/89 09:09:00 NORSAR
Fig. 7.7.3. ARCESS recordings of the 16 April 1989 earthquake (ML = 4.1) in the KhibinyMassif. The earthquake occurred almost simultaneously with a 240 ton explosion,and it is not possible to visually separate the P phases for the two events.
131

NORSAR Sci. Rep. -92/93 November 1992
32284
6495 Displacement Z-comp, [nM]6495
,
3.62E+05- velocity Z-comp. InM/sec]
' 72 E.O5 Acceleration Z-comp. [nM/sec°"2]
L I
20.000 30.000 40.000 50.000 00,000
1992- 154:12.18 19.300 APAAPA.SP
Fig. 7.7.4. A double earthquake in the Khibiny Massif on 2 June 1992 (ML(ARCESS)2.0 and 2.5, respectively). The figure shows APA SPZ recordings, initial trace aswell as displacement, velocity and acceleration. These earthquakes were not associ-
J j ated with any mining explosion.
132