Embed Size (px)
Citation preview

The Profitability of OrganicThe Profitability of Organic Agriculture: Lessons from the
Sustainable Agriculture Farming Systems Project (SAFS)Systems Project (SAFS)
D K Kl kDr. Karen KlonskyDept. of Agricultural & Resource Economics
University of California, Davis
Variety of research areas at Russell Ranch
Riparian Reser e Runoff plots
Main plots
Small plotsHabitat Restoration area
Riparian Reserve Runoff plots
Main plots
Organic plotsFarm buildings
Conventional commercial farmFarm buildings
•Small plots for shorter term investigations: e.g., comparison of cover crop mixes, biofuels crops, impact of continuous cover on soil biology, comparison of drip vs furrow irrigation
•Runoff plots: impact of management on runoff of nutrients and pesticides
•Large plots under organic management, currently unassigned
•Conventional commercial farm: surrounding land leased by neighboring grower, managed conventionally
•Habitat restoration area (as mitigation for UC Davis development)
•Putah Creek Riparian Reserve adjacent to Russell Ranch

Russell Ranch / SAFS HistoryRussell Ranch / SAFS History
Years Events
1992 – 1993Russell Ranch purchased by UC DavisIrrigated, unfertilized Sudan grass planted to create uniform soil fertility conditionssoil fertility conditions
1994 ‐ 2007
Two‐year rotations of processing tomato and corn & othersOrganic, low input, and conventionalEach system/crop combination each year
2003 SAFS relocates to Russell Ranch from Vegetable Crops facility
2003 2007 Each system split into conservation tillage and standard tillage2003 ‐ 2007 Each system split into conservation tillage and standard tillage
2008 ‐ present
Two‐year rotations of processing tomato and wheatOrganic, low input, and conventionalAll t ti tillAll systems are conservation tillage
SAFS Systems and RotationsSAFS Systems and Rotations
Cover crop Tomato Corn
Organic
p
Low input
Conventional
Fall/Winter Spring/Summer Fall/Winter Spring/Summer
YEAR 1 YEAR 2

PRODUCTION PRACTICES AT SAFSPRODUCTION PRACTICES AT SAFS
Tomato Preplant OperationsTomato Preplant Operations
Organic Conventionalg
October/November
Mow residuePlant cover crop
Mow residueSubsoil, disc, roll, triplanePrepare beds
December
January Spray weeds
FebruaryFebruary
March Spray weeds
April Mow cover cropApply compost
Smooth bedsStarter fertilizerApply compost
Ground prepMake beds
Starter fertilizer
May Transplant TransplantMay Transplant TransplantSidedress fertilizer

Tomato bed managementTomato bed management
1 Strip till1. Strip till
2. Full bed mulch
3 S i ill d il3. Strip till detail
1
2 3
FertilityFertility
OrganicTOMATOLow Input Conventional
Cover crop 1994 ‐ 2006 2004 – 2006 only
Chicken manureRates reduced after 1997after 1997
Synthetic N None1994 – 2003 = conv2004 – 2006 reduced
15‐15‐15, ammonium sulfate
Organic CORN
Low Input Conventional
Cover crop 1994 ‐ 2006 1994 ‐ 2006Cover crop 1994 2006 1994 2006
Chicken manure Same as tomato
Synthetic N None None Urea
Fertility ‐ 2007Fertility 2007
OrganicTOMATOLow Input Conventional
Cover crop Bell beans/vetch Bell beans/vetch
Poultry compost 4 tons
Synthetic N
Preplant15 – 15 ‐15 @ 45 lbs.
Preplant15‐15‐15 @ 45 lbs.
Sidedress21 0 0 24 @100 lbs21‐0‐0‐24 @100 lbs.
Organic CORN
Low Input Conventional
Cover crop Bell beans/vetch Bell beans/vetch
Poultry compost 4 tons
Synthetic NPost plant 46‐0‐0 @ 165 lbs.Sidedress 15‐15‐15 @ 45 lbs.
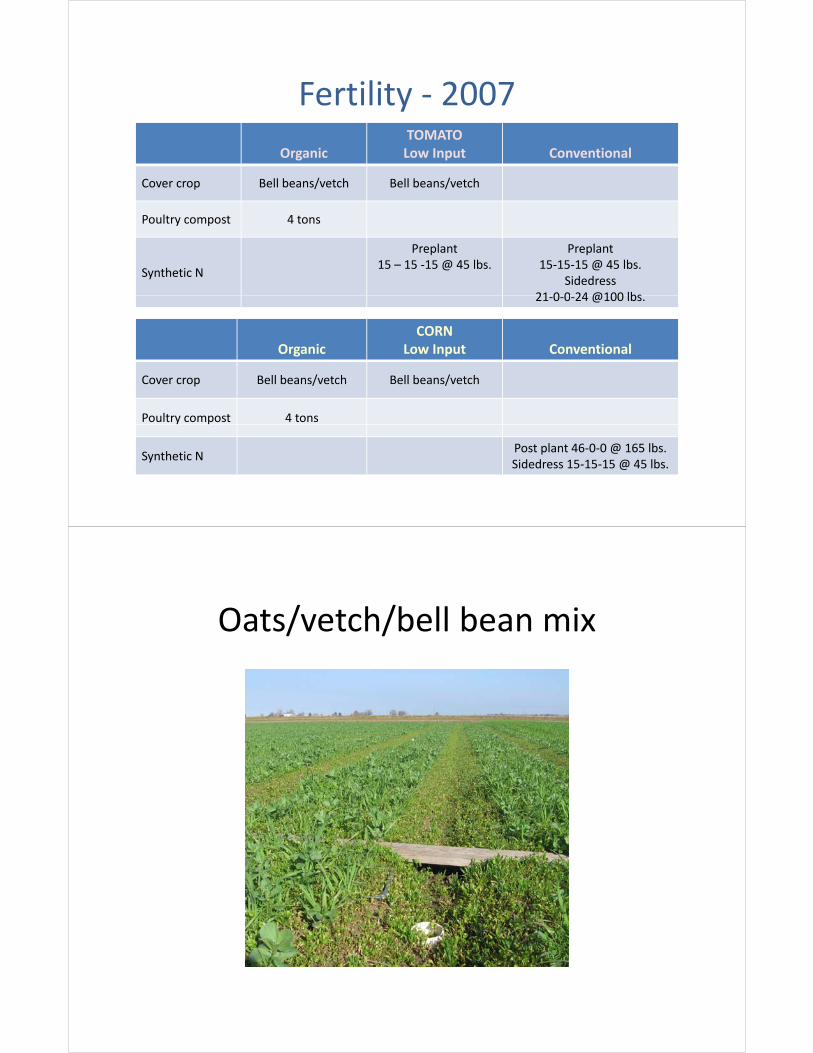
Oats/vetch/bell bean mixOats/vetch/bell bean mix

Reel chopping cover crop to initiate d ddry down prior to incorporation
Cover crop and incorporationp p
2 Bell bean/wheat cover crop2. Bell bean/wheat cover crop
3. Bed disc for full incorporation
l il i4. Flail mowing cover crop

Weed control ‐ 2007Weed control 2007
OrganicTOMATOLow Input Conventional
TillageStrip till 5XCultivate 4X
Strip till 5XCultivate 3X
Strip till 2XCultivate 2X
Hand hoeing 35 hours 11 hours 6 hoursg
HerbicideMay July
February May JulyJuly
Organic CORN
Low Input Conventional
Tillage Cultivate 3X Cultivate 2X Cultivate 2X
bi idFebruary
ilHerbicideMay
AprilMay
Pest control ‐ 2007Pest control 2007
OrganicTOMATOLow Input Conventional
Insecticide/Miticide Oberon 8.5 oz. Oberon 8.5 oz.
Worms Sulfur 20 lbs. Sulfur 20 lbs.

COST OF PRODUCTOINCultural Costs
COST OF PRODUCTOIN
Costs of Production by Management CategoryCosts of Production by Management Category
Fertility Weed control Pest control
Tomato conventional
y
Tomato ‐ organic
Field corn ‐ conventional
0 100 200 300 400 500 600 700 800
Field corn ‐ organic
0 100 200 300 400 500 600 700 800
$ per Acre

Cost of Production ‐ CornCost of Production Corn
Organic ‐ $465/A Conventional ‐ $390/AOrganic ‐ $465/AGround prep$34 7% Cover crop
Manage residue$17 4%
Conventional ‐ $390/A
Ground prep$23
Manage residue$17 Cover crop
$75 16%Compost
$171 37%
$23 6%
Weed controlFertilize
$4%
Weed control$29 6%
control$85 22%
Fertilize$99 25%
Plant$56 12%Irrigate
$83
Plant$86 22%
Irrigate$80 21%
18%
Comparison of Cultural Costs – CornOrganic $465/A ~ Conventional $390/A
$23G d
$75
$34
$85
$23
W d t l
Cover crop
Ground prep
$56
$29
$80
$86
$85
I i
Plant
Weed control
Conventional
$171
$83
$17
$99
$80
Fertilizer/Compost
Irrigate Organic
$17 $17
0 50 100 150 200
Manage residue
$$ per Acre

Cost of Production ‐ TomatoCost of Production Tomato
Organic ‐ $1 432/A Conventional ‐ $1 012/AOrganic ‐ $1,432/AGround prep$45 3%
Cover crop$72Pest
Compost$184 13%
Manage residue
$7 1%
Conventional ‐ $1,012/A
Ground prep$13 Fertilize
Manage residue$393% $72
5%
Weed control
Irrigate
Pest control$65 5%
13% 1% $13 1%
Weed control$205
Pest control
Fertilize$96 10%
$39 4%
$379 26%
Irrigate$105 7%
$205 20%
Irrigate$90
$73 7%
Plant$575
Plant$496
9%
40% 49%
Comparison of Cultural Costs – TomatoOrganic $1,432/A ~ Conventional $1,012/A
13Ground prep
379
72
45
0
13
Weed control
Cover crop
Ground prep
105
575
379
90
496
Irrigate
Plant
Conventional
65
184
73
96
Insect control
Fertilizer/Compost Organic
739
0 200 400 600 800
Manage residue
$$ per Acre
REVENUEYield and Price
REVENUE
Processing Tomato HarvesterProcessing Tomato Harvester

P i T HProcessing Tomato Harvester
Processing Tomato HarvestProcessing Tomato Harvest

Average Tomato Yields2003 ‐ 2007
35
25
30
15
20
ns per acre
5
10
15
Ton
0
5
Conv CT Conv ST Low CT Low ST Org CT Org STConv CT Conv ST Low CT Low ST Org CT Org ST
2007 Tomato Yields2007 Tomato Yields
45
35
40
20
25
30
ns per acre
10
15
Ton
0
5
Conv CT Conv ST Low CT Low ST Org CT Org STConv CT Conv ST Low CT Low ST Org CT Org ST

Average Corn Yields 2003 ‐ 2007
12000
8000
10000
6000
8000
ns per acre
2000
4000
Ton
0
2000
Conv CT Conv ST Low CT Low ST Org CT Org STConv CT Conv ST Low CT Low ST Org CT Org ST
2007 Corn Yields2007 Corn Yields
45
35
40
20
25
30
10
15
20
0
5
Conv CT Conv ST Low CT Low ST Org CT Org STConv CT Conv ST Low CT Low ST Org CT Org ST

Organic and Conventional PricesProcessing Tomatoes
120
100
60
80
per ton
Organic
20
40
$
Conventional
0
20
89 91 93 95 97 99 01 03 05 07 0989 91 93 95 97 99 01 03 05 07 09
Organic and Conventional PricesfCorn for Grain
300
250
150
200
per ton
Organic
50
100
$
Conventional
0
50
92 94 96 98 00 02 04 0692 94 96 98 00 02 04 06

NET RETURNS2007
NET RETURNS
Revenue, Operating Costs, and Net Returns
PROCESSING TOMATOES 2007PROCESSING TOMATOES 2007Organic Conventional Low Input
2,865 3,000
3,500
g p
1,644
2,190
1 487
2,000
2,500
1,221 1,038 1,152
1,487
1,061
426
1,000
1,500
426
‐
500
Revenue Cost Net returnsRevenue Cost Net returns

Runoff as a Percentage of Rainfall Events Cover crop – organic and low inputCover crop organic and low input
Manure – organic only
Organic Low Input Conventional
38%36%
g p
18%
8%
18%
10%
3% 4%2% 3% 2%3% 3% 2% 3% 4%
Feb. 7 Feb. 9 Feb. 18 Feb. 20 March 9
Revenue, Operating Costs, and Net Returns
CORN 2007CORN 2007Organic Conventional Low Input
1,075 1,074
1,000
1,200
g p
485590
756
600
800
485
318 312 265
200
400
600
47
‐
200
Revenue Cost Net returnsRevenue Cost Net returns

RESOURCE USERESOURCE USE
Labor Hours by Management Category Fi ld CField Crops
Machine Labor Hand Labor
Tomato conventional
Tomato ‐ organic
Field corn ‐ conventional
0 10 20 30 40 50
Field corn ‐ organic
0 10 20 30 40 50
Hours per Acre

Fuel Use for Cultural PracticesFuel Use for Cultural Practices
FuelFuel(Gallons/Acre)
Times over the Field
O C O CO C O C
Tomatoes 57 51
Corn 33 37
Average Water UseAverage Water Use
Corn Tomato49
37
44
40
50
Corn Tomato
37
2931
19
30
40
nches
19
10
20
Acre in
0
Organic Low Input ConventionalOrganic Low Input Conventional

Sources of NitrogenSources of NitrogenOrganicTomato
Low InputTomato
ConventionalTomato
Cover crop 1994 ‐ 2006 2004 – 2006 only
Chicken manureRates reduced after 1997after 1997
Synthetic N None1994 – 2003 = conv2004 – 2006 reduced
15‐15‐15, ammonium sulfate
OrganicCorn
Low InputCorn
ConventionalCorn
Cover crop 1994 ‐ 2006Cover crop 1994 2006
Chicken manureHigher than for
tomatoes
Synthetic N None None Urea
Corn Nitrogen Inputs 02 ‐ 06Corn Nitrogen Inputs 02 06
250
200
e
150
per hectare
Manure
Cover Crop
50
100
Kg N p Cover Crop
Fertilizer
0
Conventional Organic Low InputConventional Organic Low Input

Tomato Nitrogen Inputs 04 ‐ 06Tomato Nitrogen Inputs 04 06
250
200
e
150
per hectare
Manure
Fertilizer
50
100
Kg N p Fertilizer
Cover Crop
0
Conventional Organic Low InputConventional Organic Low Input
ENVIRONMENTAL IMPACTSENVIRONMENTAL IMPACTS

Corn Nitrogen lInputs, Outputs, Balance
250
200
e
150
per hectare
Inputs
Output
50
100
Kg N p Output
Balance
0
Conventional Organic Low InputConventional Organic Low Input
Tomato Nitrogen lInputs, Outputs, Balance
250
200
e
150
per hectare
Inputs
Output
50
100
Kg N p Output
Balance
0
Conventional Organic Low InputConventional Organic Low Input

Nitrogen Balance (Corn and Tomato)Soil Storage and UnaccountedSoil Storage and Unaccounted
Accumulated 1994 ‐ 20064,000
3,000
3,500
e
2,000
2,500
per hectare
Unaccounted
1,000
1,500
Kg N p Soil Storage
0
500
Organic Low Input ConventionalOrganic Low Input Conventional
Nitrous Oxide EmissionsNitrous Oxide Emissions
450
350
400
r)
200
250
300
g/M
2/hour
No cover
100
150
200
N2O (m Cover Crop
0
50
C ti Till St d d TillConservation Tillage Standard Tillage

Nitrous Oxide EmissionsNitrous Oxide Emissions
• Emissions were higher with winter legumeEmissions were higher with winter legume cover crops for both tillage systems
• This may be the result of adding N to the soil• This may be the result of adding N to the soil in a form that can be transformed into N2O under ideal soil moisture and temperatureunder ideal soil moisture and temperature conditions
Soil organic carbon in the top 30 cmSoil organic carbon in the top 30 cm
55
50
e
Cover crop every yearHigh inputmanure
45
per hectare
Organic
Low Input
Cover cropevery year
manure
Cover crop every other year
35
40
Mg C Low Input
ConventionalConservation
Tillage
30
1993 1995 1997 1999 2001 2003 2005 20071993 1995 1997 1999 2001 2003 2005 2007

Runoff as a Percentage of Rainfall EventsStandard Tillage ‐ 1999
4%
2%3%
35%
4%
F b 20
March 9
2%
8%
4%
10%Feb. 18
Feb. 20
Conventional
Low Input
4%
2%
4%
8%
38%Feb. 9
Feb. 18 Low Input
Organic
3%
4%
3%18%
7‐Feb
Conventional — Winter Fallowed
Organic and Low Input — Winter Cover Cropped

Runoff Water Quality ‐ 2007Runoff Water Quality 2007
Conventional Low Input Organic
Applied Detected Applied Detected Applied Detected
Tillam (herbicide) X x X x ‐‐‐‐‐‐ ‐‐‐‐‐‐Tillam (herbicide) X x X x ‐‐‐‐‐‐ ‐‐‐‐‐‐
Trifluralin (pre‐emergent herbicide) X ‐‐‐‐‐ X ‐‐‐‐‐‐ ‐‐‐‐‐‐ ‐‐‐‐‐‐
M l hl (h bi id ) X X X XMetolachlor (herbicide) X X X X ‐‐‐‐‐‐ ‐‐‐‐‐‐
L‐cyhalothrin (pyrethroid insecticide) X ‐‐‐‐‐‐ X ‐‐‐‐‐‐ ‐‐‐‐‐‐ ‐‐‐‐‐‐
Runoff Water Quality ‐ 2007Low Input and Conventional Systems
Standard Conservation Tillage Tillage
% of Samples % of Samples
Tillam (herbicide) .05% ‐‐‐‐‐‐
Trifluralin (pre‐emergent herbicide) ‐‐‐‐‐‐ ‐‐‐‐‐‐
Metolachlor (herbicide) 63% 25%
L‐cyhalothrin (pyrethroid insecticide) ‐‐‐‐‐‐ ‐‐‐‐‐‐

Runoff Water Quality ‐ 2007Pesticide Concentration
Low Input Conventional
0 25
0.3
0.35
mg/m
l)p
0.15
0.2
0.25
on in
ppb (m
0
0.05
0.1
oncentratio
0
Conservation Tillage Standard Tillage
Co
Note: No pesticides were found in organic system runoff
Sweeping Generalizations About Organic AgricultureOrganic Agriculture(at least in California)
• Relies on cover crops, compost, and sometimes liquid p , p , qfertilizers
• Fertility costs more than for conventional
• Only crops that rely on hand hoeing for weed control use hand hoeing in organic
• When used labor costs for hand hoeing are higher• When used, labor costs for hand hoeing are higher
• Fewer pest and disease control tools are available
• Some crops are easier to grow organically than othersSome crops are easier to grow organically than others
• Organic price premiums vary from crop to crop but are not trending downward over time
Cover Crop Impacts Not Captured in d lCost and Return Analyses
• May delay planting in SpringMay delay planting in Spring
• May replace a cash crop in a rotation
• Reduces winter runoff• Reduces winter runoff
• Improves the quality of winter runoff
I b t ti• Increases carbon sequestration
• May increase greenhouse gas emissions
• Provides habitat
• Reduces erosion