Embed Size (px)
Citation preview
Keeping your farm health:
Logging, monitoring and throttling
Mirjam van Olst
Macaw
About Mirjam
• Blog: http://sharepointchick.com
• Email: [email protected]
• Twitter: @mirjamvanolst
Agenda
• Logging and monitoring
• HTTP Throttling
• List Throttling
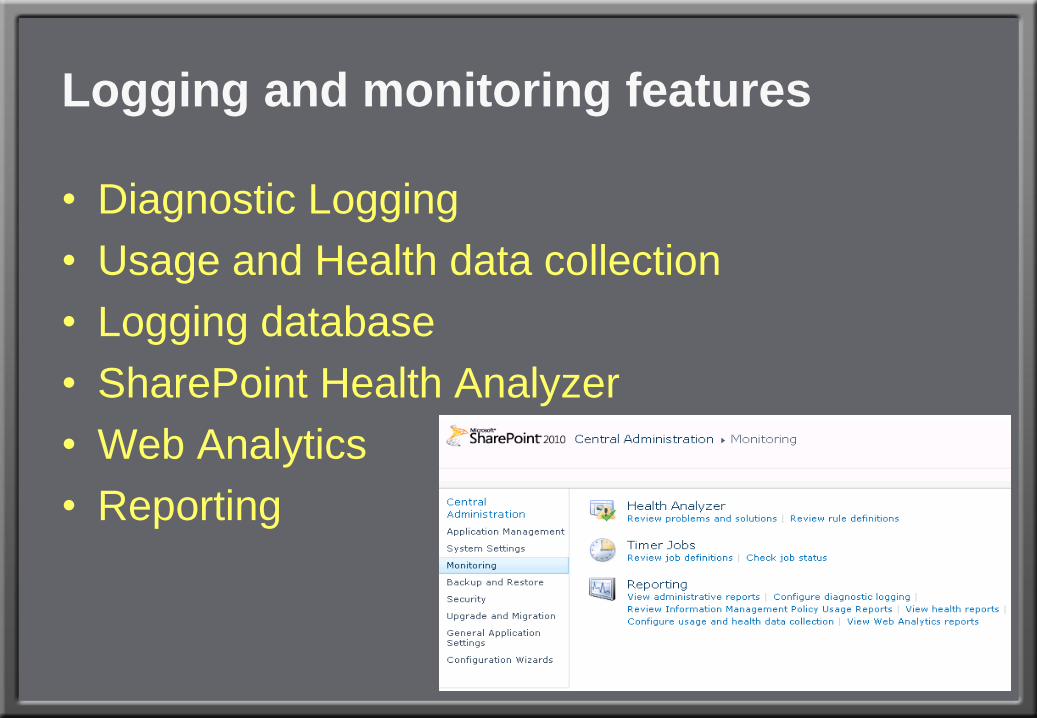
• Diagnostic Logging
• Usage and Health data collection
• Logging database
• SharePoint Health Analyzer
• Web Analytics
• Reporting
Logging and monitoring features
• Collect Event and Trace information
• Available in SharePoint 2007, but improved
• Data collection in
● ULS Logs
● Windows Event Logs
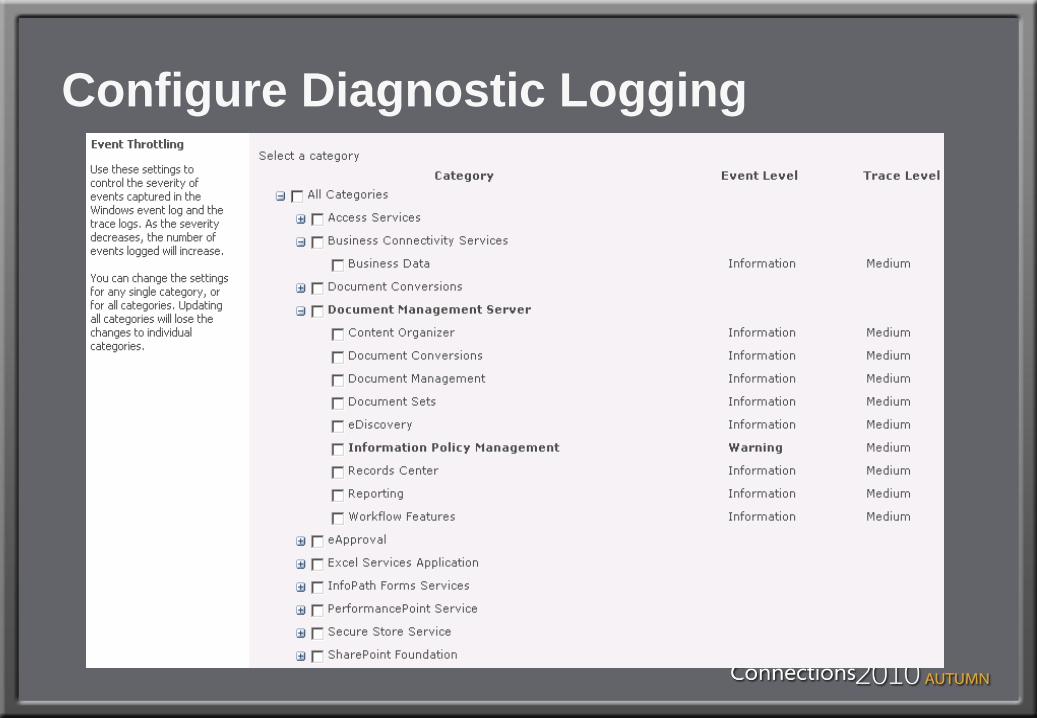
Diagnostic Logging
• Central Administration => Monitoring => Configure diagnostic logging
• Set event throttle level per category
• Enable event log flood protection ● Will suppress repeating messages until conditions return to
normal
● Will prevent your event log from filling up with the same repeating event
● By default messages will be suppressed if they occur more than 5 times in 2 minutes
● You can use PowerShell to adjust this setting
Configure Diagnostic Logging
Configure Diagnostic Logging
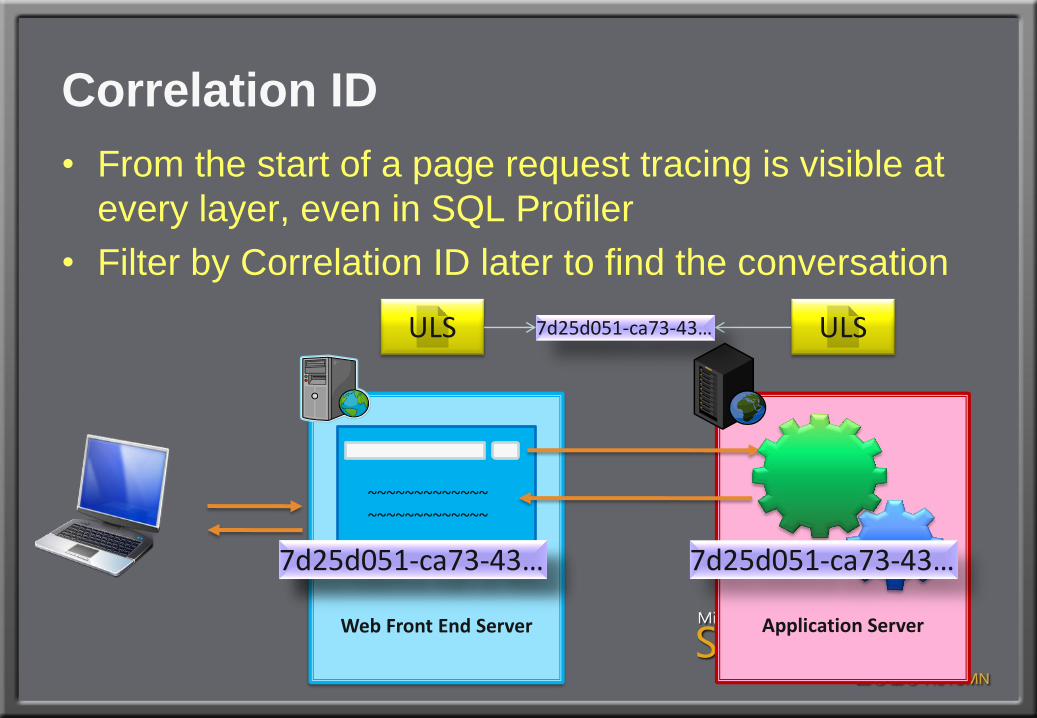
Correlation ID
• From the start of a page request tracing is visible at
every layer, even in SQL Profiler
• Filter by Correlation ID later to find the conversation
Web Front End Server Application Server
~~~~~~~~~~~~~ ~~~~~~~~~~~~~
ULS
7d25d051-ca73-43…
ULS 7d25d051-ca73-43…
7d25d051-ca73-43… 7d25d051-ca73-43…
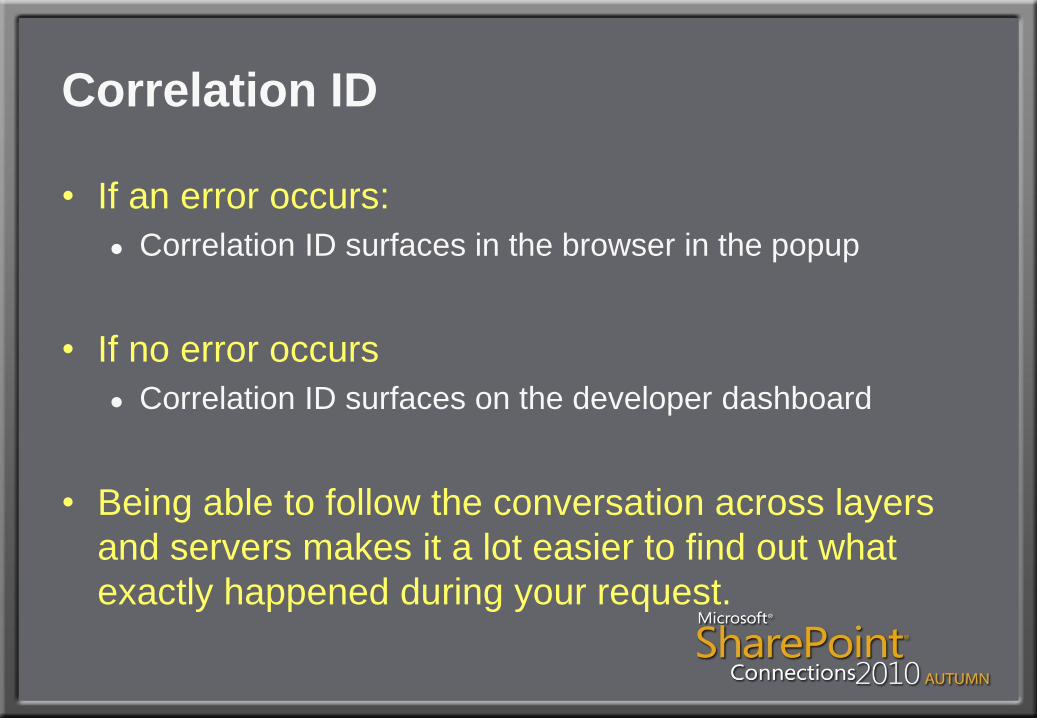
Correlation ID
• If an error occurs:
● Correlation ID surfaces in the browser in the popup
• If no error occurs
● Correlation ID surfaces on the developer dashboard
• Being able to follow the conversation across layers
and servers makes it a lot easier to find out what
exactly happened during your request.
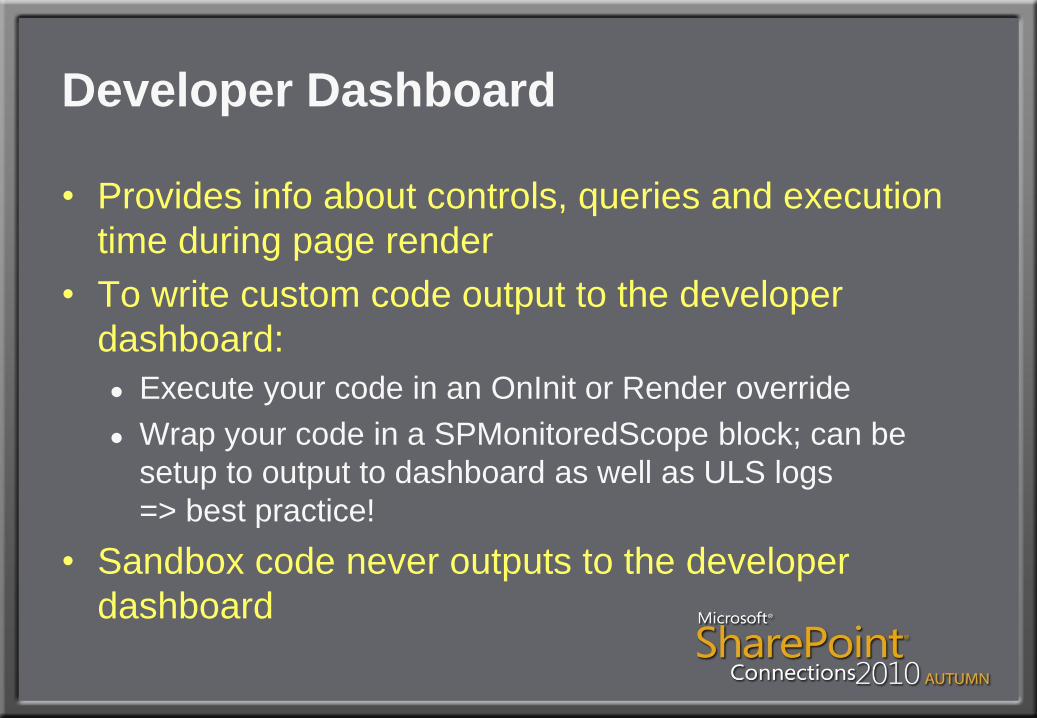
Developer Dashboard
• Provides info about controls, queries and execution
time during page render
• To write custom code output to the developer
dashboard:
● Execute your code in an OnInit or Render override
● Wrap your code in a SPMonitoredScope block; can be
setup to output to dashboard as well as ULS logs
=> best practice!
• Sandbox code never outputs to the developer
dashboard
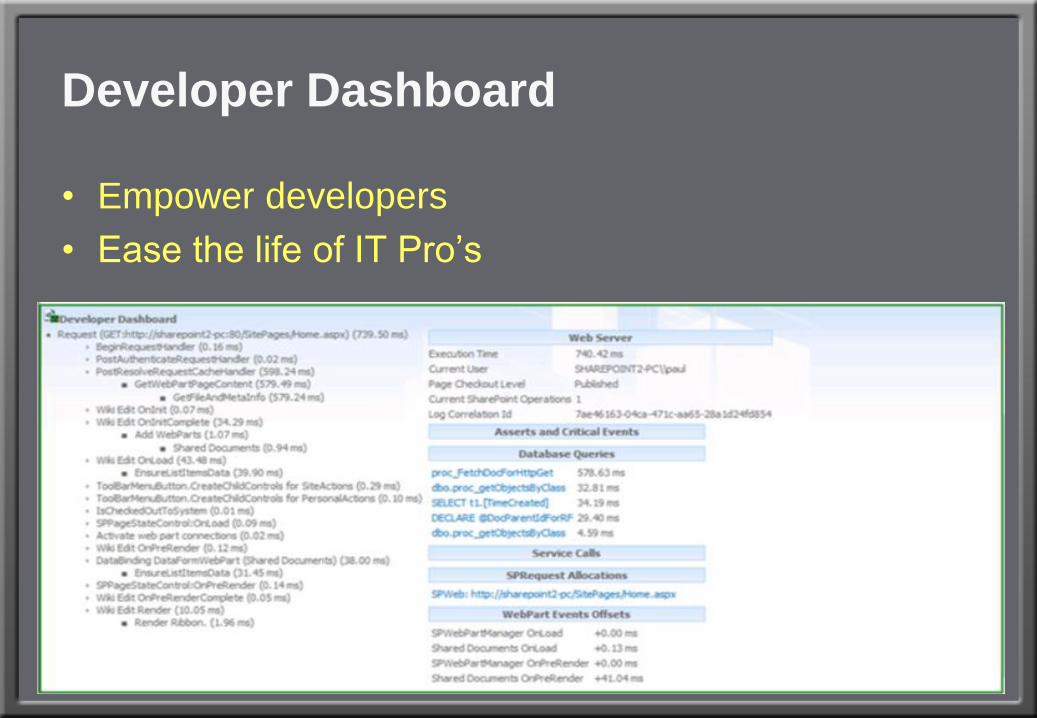
Developer Dashboard
• Empower developers
• Ease the life of IT Pro’s
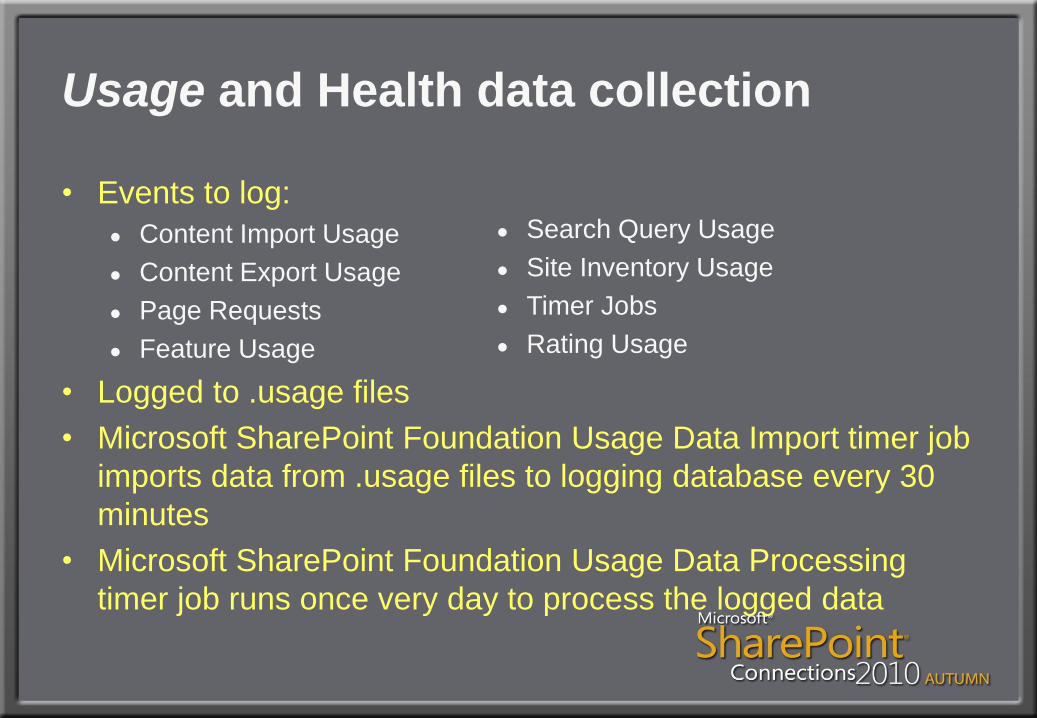
Usage and Health data collection
• Events to log:
● Content Import Usage
● Content Export Usage
● Page Requests
● Feature Usage
• Logged to .usage files
• Microsoft SharePoint Foundation Usage Data Import timer job
imports data from .usage files to logging database every 30
minutes
• Microsoft SharePoint Foundation Usage Data Processing
timer job runs once very day to process the logged data
● Search Query Usage
● Site Inventory Usage
● Timer Jobs
● Rating Usage
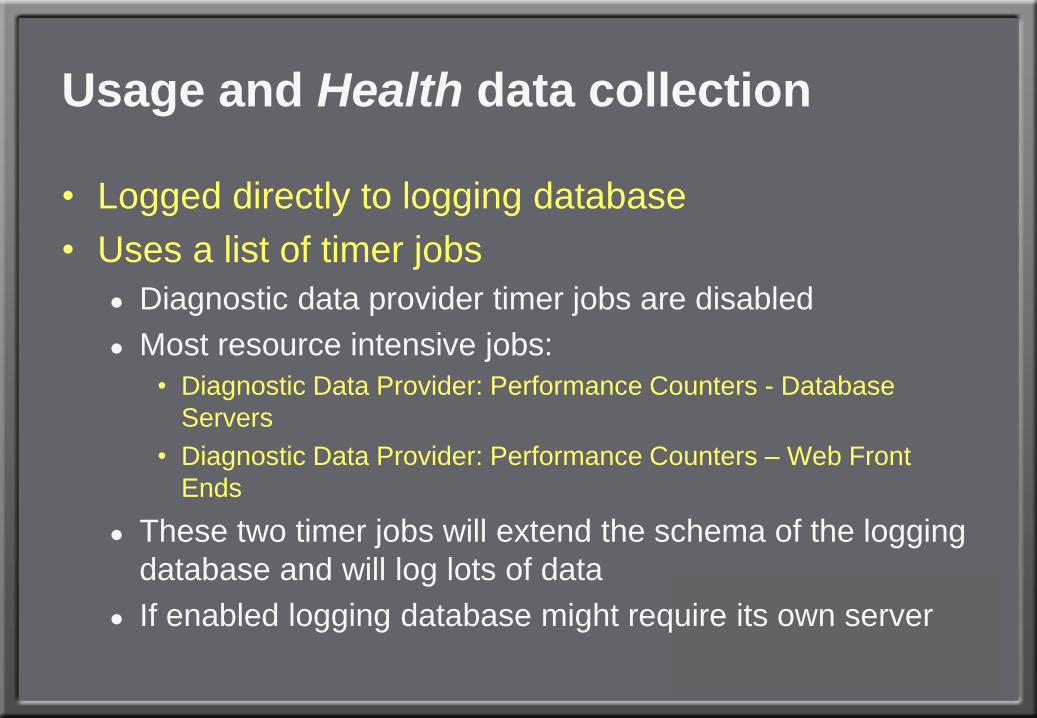
Usage and Health data collection
• Logged directly to logging database
• Uses a list of timer jobs
● Diagnostic data provider timer jobs are disabled
● Most resource intensive jobs:
• Diagnostic Data Provider: Performance Counters - Database
Servers
• Diagnostic Data Provider: Performance Counters – Web Front
Ends
● These two timer jobs will extend the schema of the logging
database and will log lots of data
● If enabled logging database might require its own server
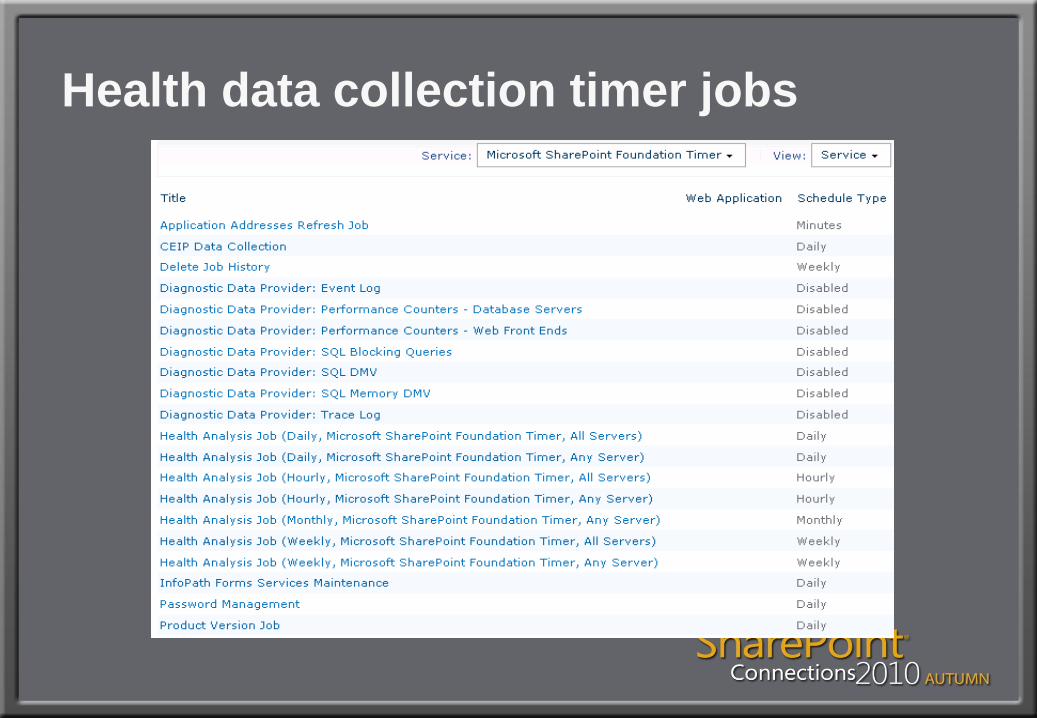
Health data collection timer jobs
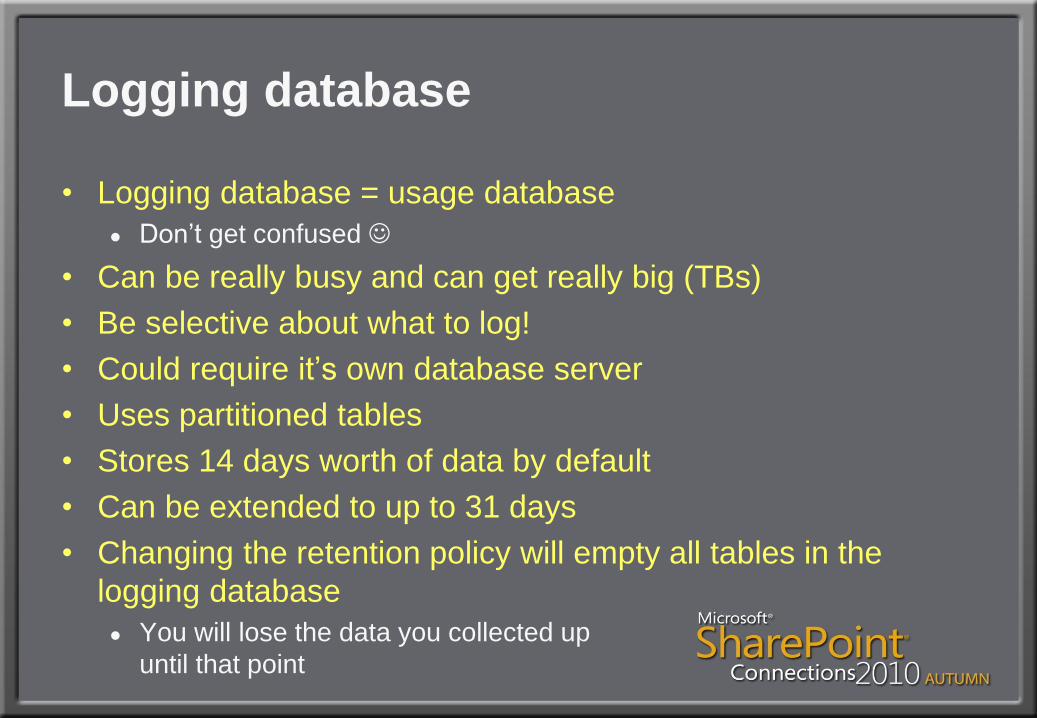
Logging database
• Logging database = usage database
● Don’t get confused
• Can be really busy and can get really big (TBs)
• Be selective about what to log!
• Could require it’s own database server
• Uses partitioned tables
• Stores 14 days worth of data by default
• Can be extended to up to 31 days
• Changing the retention policy will empty all tables in the
logging database
● You will lose the data you collected up
until that point
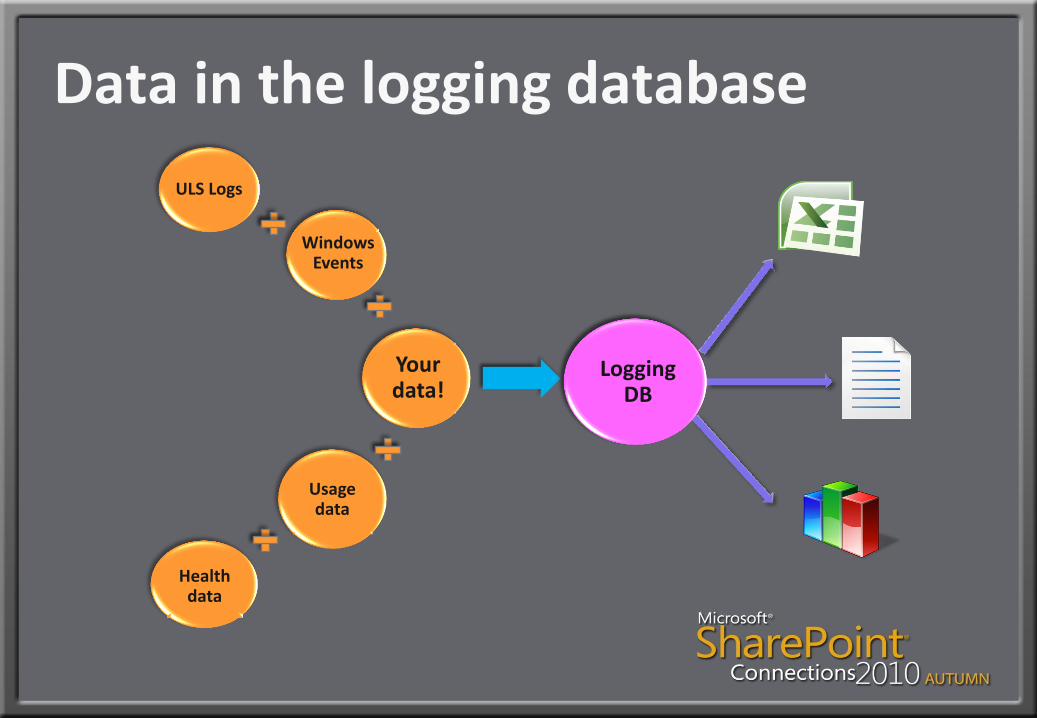
Data in the logging database
ULS Logs
Windows Events
Your data!
Usage data
Health data
Logging DB
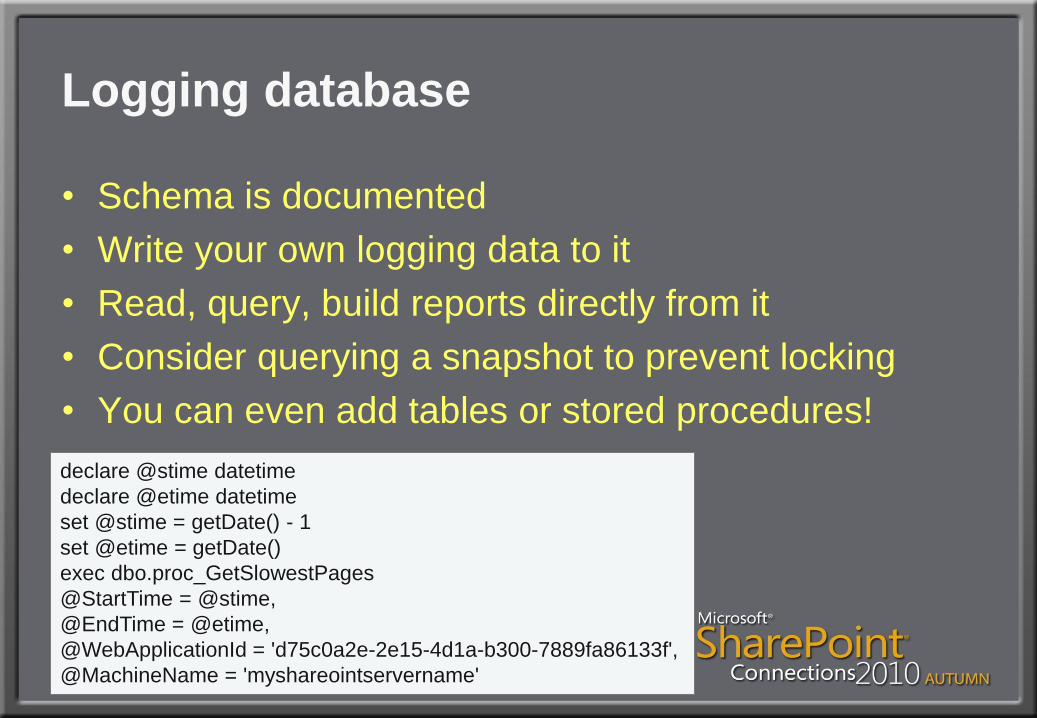
Logging database
• Schema is documented
• Write your own logging data to it
• Read, query, build reports directly from it
• Consider querying a snapshot to prevent locking
• You can even add tables or stored procedures!
declare @stime datetime
declare @etime datetime
set @stime = getDate() - 1
set @etime = getDate()
exec dbo.proc_GetSlowestPages
@StartTime = @stime,
@EndTime = @etime,
@WebApplicationId = 'd75c0a2e-2e15-4d1a-b300-7889fa86133f',
@MachineName = 'myshareointservername'
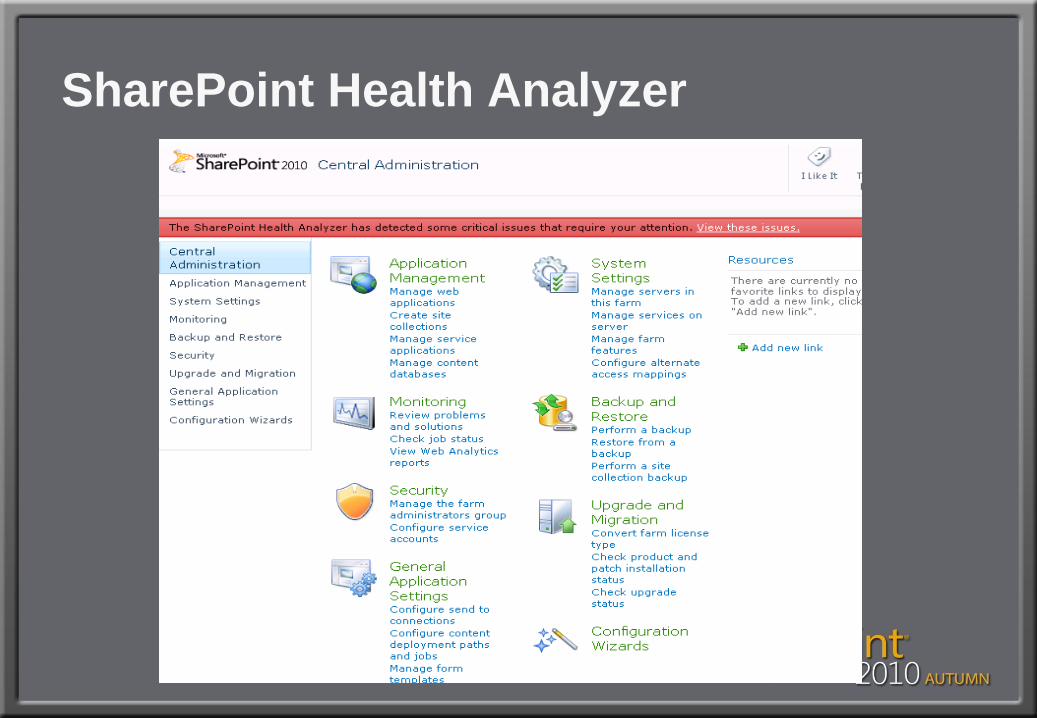
SharePoint Health Analyzer
• New health analysis tool
• Enables you to proactively check for potential
problems
● Configuration
● Performance
● Usage problems
• Runs predefined health rules against all servers in
the farm
• Health rule runs a test and returns a status
• SharePoint can sometimes help to resolve problems
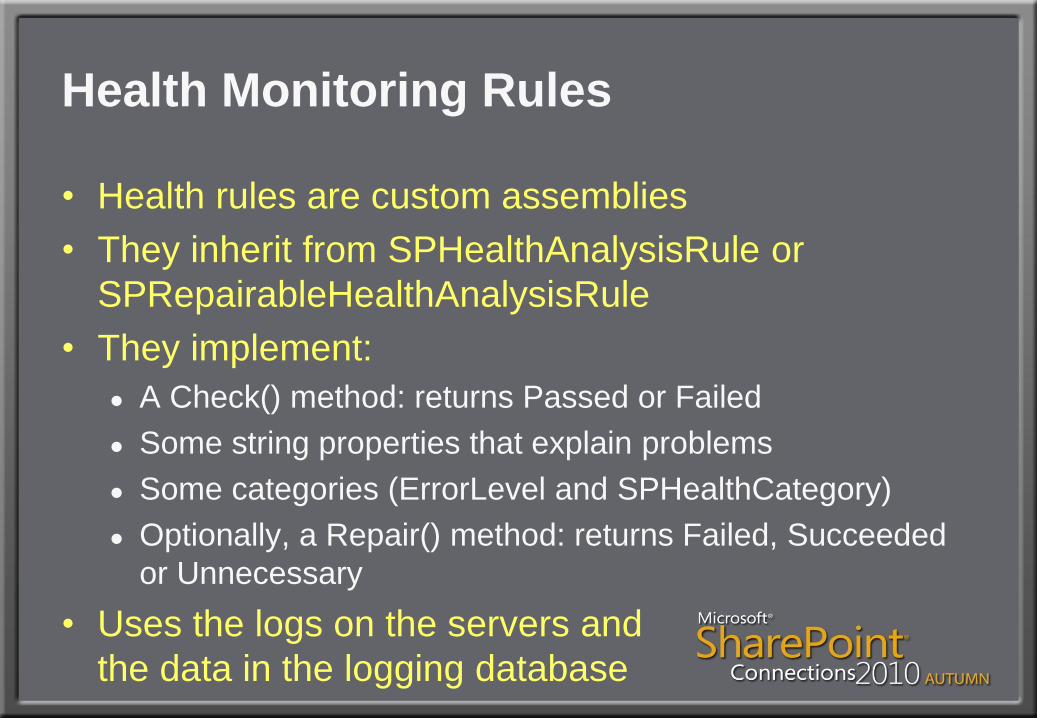
Health Monitoring Rules
• Health rules are custom assemblies
• They inherit from SPHealthAnalysisRule or
SPRepairableHealthAnalysisRule
• They implement:
● A Check() method: returns Passed or Failed
● Some string properties that explain problems
● Some categories (ErrorLevel and SPHealthCategory)
● Optionally, a Repair() method: returns Failed, Succeeded
or Unnecessary
• Uses the logs on the servers and
the data in the logging database
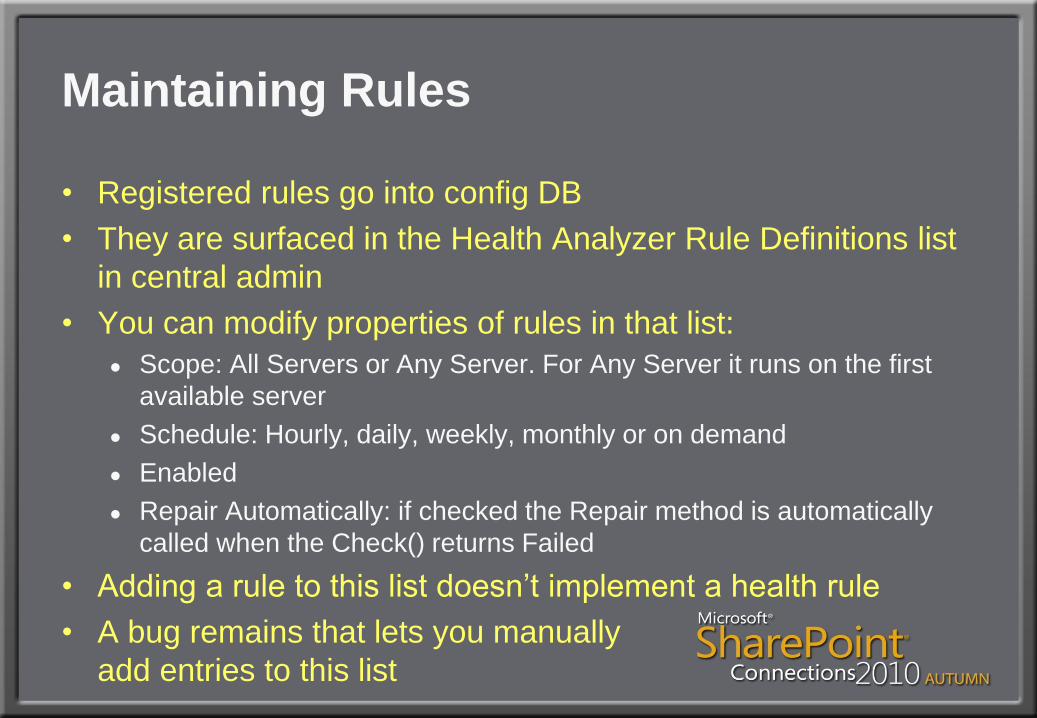
Maintaining Rules
• Registered rules go into config DB
• They are surfaced in the Health Analyzer Rule Definitions list
in central admin
• You can modify properties of rules in that list:
● Scope: All Servers or Any Server. For Any Server it runs on the first
available server
● Schedule: Hourly, daily, weekly, monthly or on demand
● Enabled
● Repair Automatically: if checked the Repair method is automatically
called when the Check() returns Failed
• Adding a rule to this list doesn’t implement a health rule
• A bug remains that lets you manually
add entries to this list
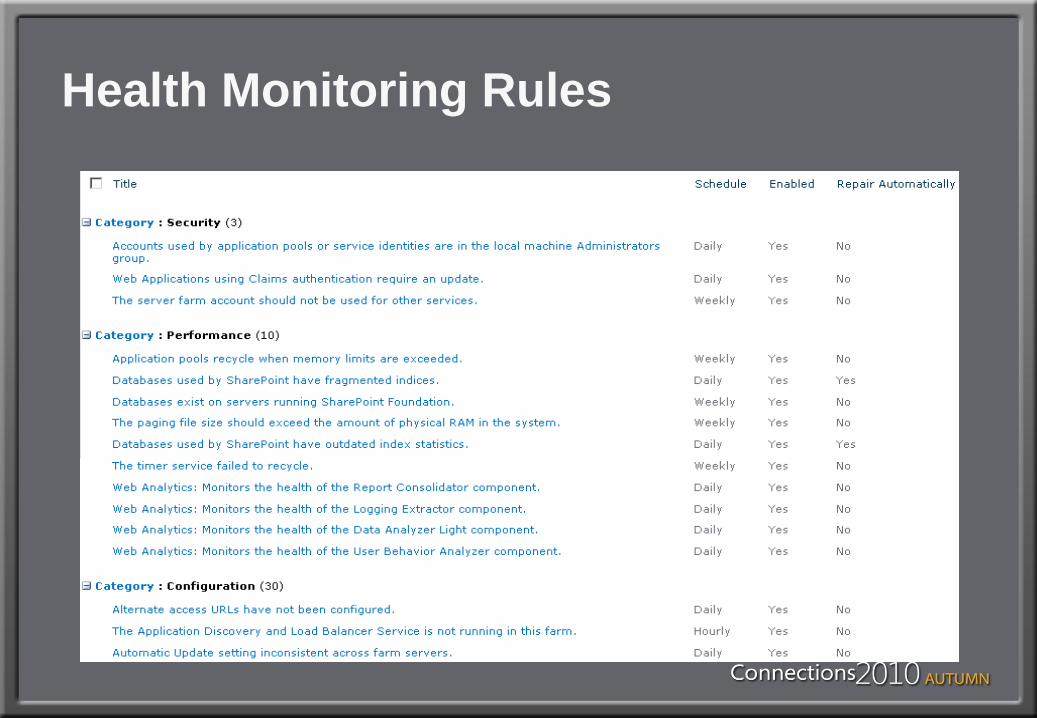
Health Monitoring Rules
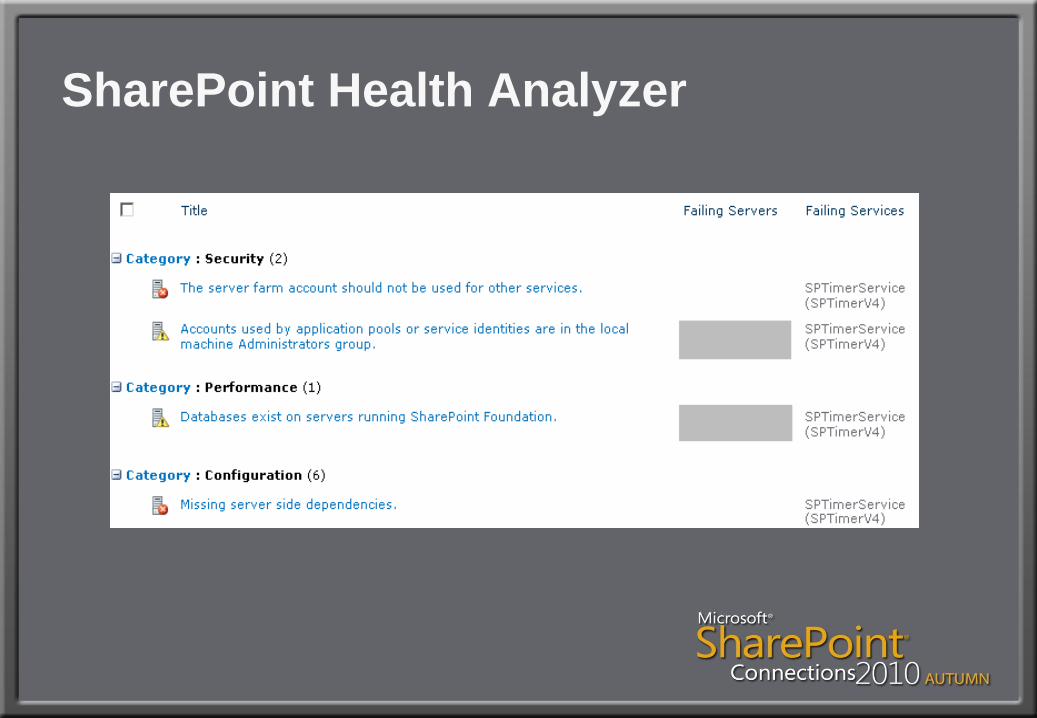
Reporting Problems
• Health rules are run by one of the many timer jobs
whose name starts with “Health Analysis Job”
• Issues reported by health rules are surfaced in the
Review problems and solutions list in central admin
• Includes an option to Reanalyze Now, which runs the
rule again
• You can use normal list features like Alerts and RSS
feeds to stay on top of reported health issues
SharePoint Health Analyzer
SharePoint Health Analyzer
“Default” errors
• There will always be messages in the list of problems in the
Review problems and solutions list
• “Missing server side dependencies”
● Is looking for a dll that is apparently missing on the server out of the
box, even if you installed everything the way it should be installed
• “The server farm account should not be used for other
services”
● Will popup if you are running the user profile service. This will by
default use the farm account. There is no way around this, you can’t
change it, or your user profile synchronization won’t work. You
shouldn’t use the farm account for any of the other services.
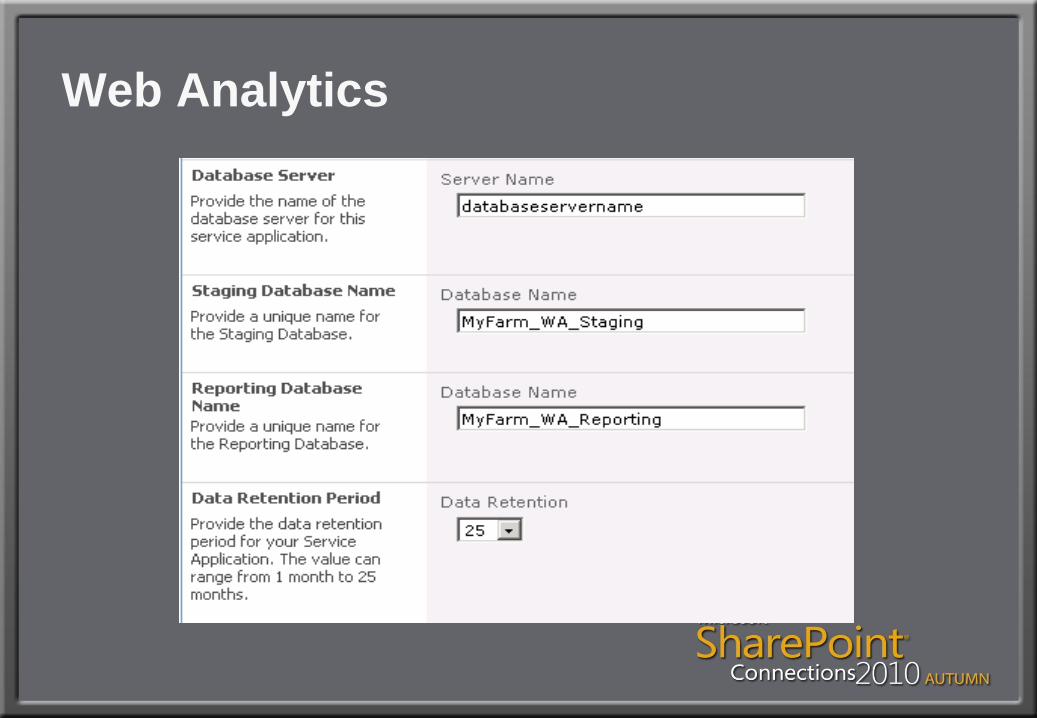
Web Analytics
• Separate web analytics service application
• Has its own databases
● Staging database
● Reporting database
• Web Analytics doesn’t write data to the logging
database
• “Web Analytics Data Processing” timer job will collect
data from the .usage files
• Usage data collection must be enabled for the web
analytics service to work
Web Analytics
Reporting
• Diagnostic logging:
● Surfaced in the ULS logs and in the Windows Event Logs.
● Will mainly be used to track down the cause of problems
on your environment and not necessarily to generate
reports
• Usage and health data:
● Stored in the logging database
● Surfaced in reports on the view administrative reports and
the view health reports pages
Reporting
• Health analyzer:
● Messages are stored in the Review problems and solutions
list and in the Windows Event Viewer
• Web analytics:
● Reports are shown on the View Web Analytics reports
page
● Web analytics reports show data collected per web
application
● Go to the site settings pages for the following reports:
• Site Collection Web Analytics reports
• Site Web Analytics reports
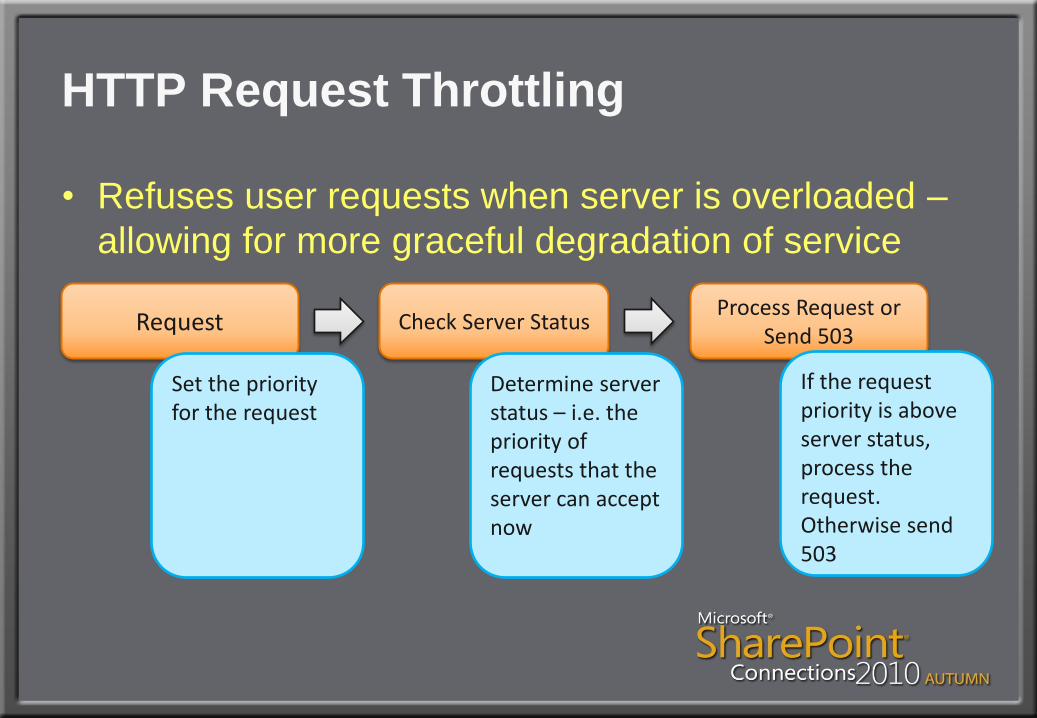
HTTP Request Throttling
• Refuses user requests when server is overloaded –
allowing for more graceful degradation of service
Request Check Server Status Process Request or
Send 503
Set the priority for the request
Determine server status – i.e. the priority of requests that the server can accept now
If the request priority is above server status, process the request. Otherwise send 503
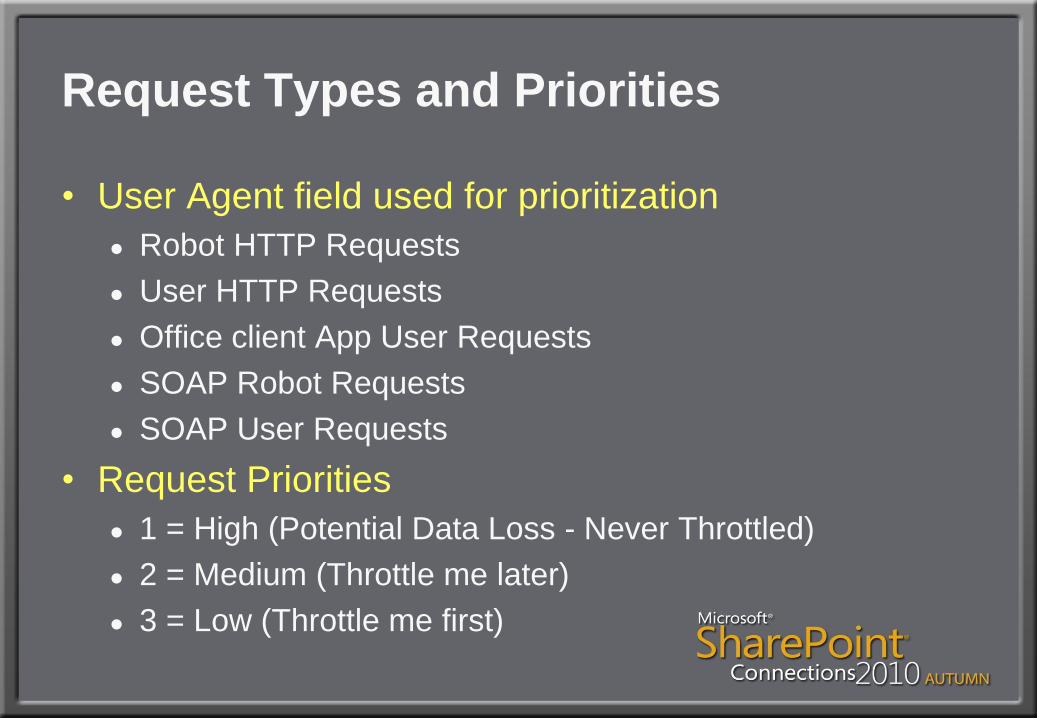
Request Types and Priorities
• User Agent field used for prioritization
● Robot HTTP Requests
● User HTTP Requests
● Office client App User Requests
● SOAP Robot Requests
● SOAP User Requests
• Request Priorities
● 1 = High (Potential Data Loss - Never Throttled)
● 2 = Medium (Throttle me later)
● 3 = Low (Throttle me first)
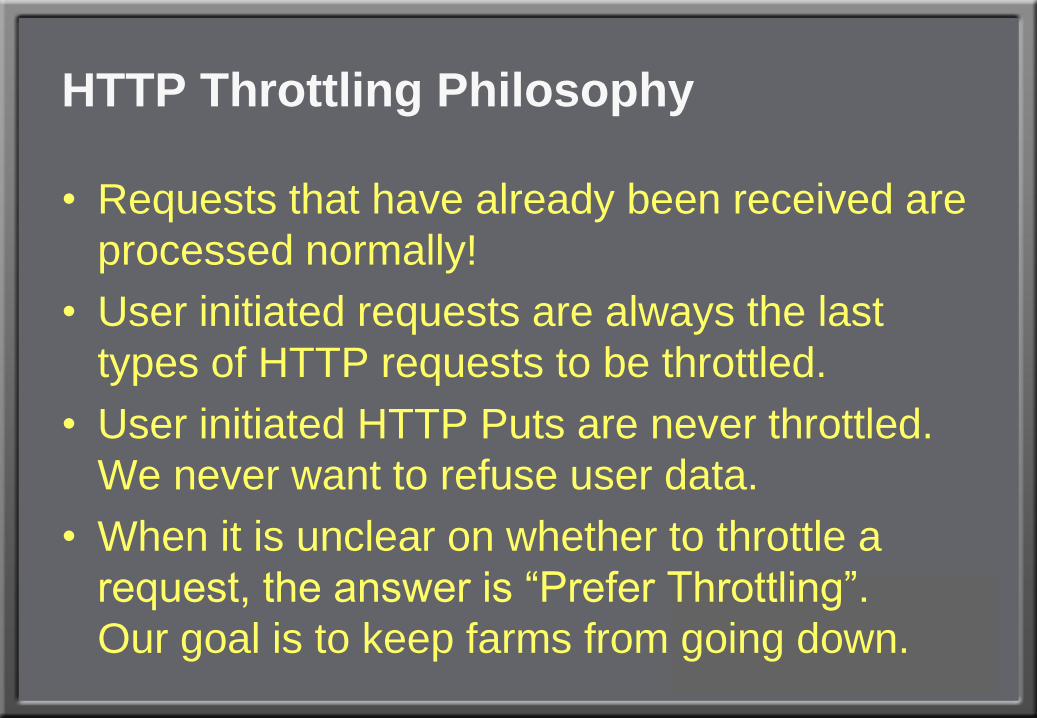
HTTP Throttling Philosophy
• Requests that have already been received are
processed normally!
• User initiated requests are always the last
types of HTTP requests to be throttled.
• User initiated HTTP Puts are never throttled.
We never want to refuse user data.
• When it is unclear on whether to throttle a
request, the answer is “Prefer Throttling”.
Our goal is to keep farms from going down.
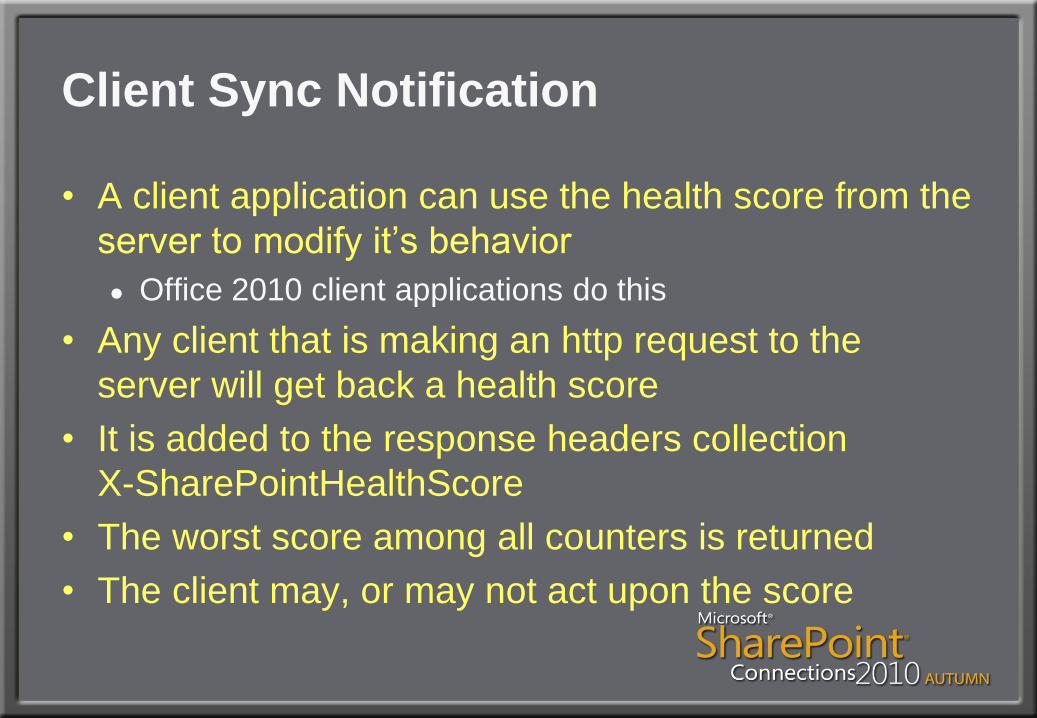
Client Sync Notification
• A client application can use the health score from the
server to modify it’s behavior
● Office 2010 client applications do this
• Any client that is making an http request to the
server will get back a health score
• It is added to the response headers collection
X-SharePointHealthScore
• The worst score among all counters is returned
• The client may, or may not act upon the score
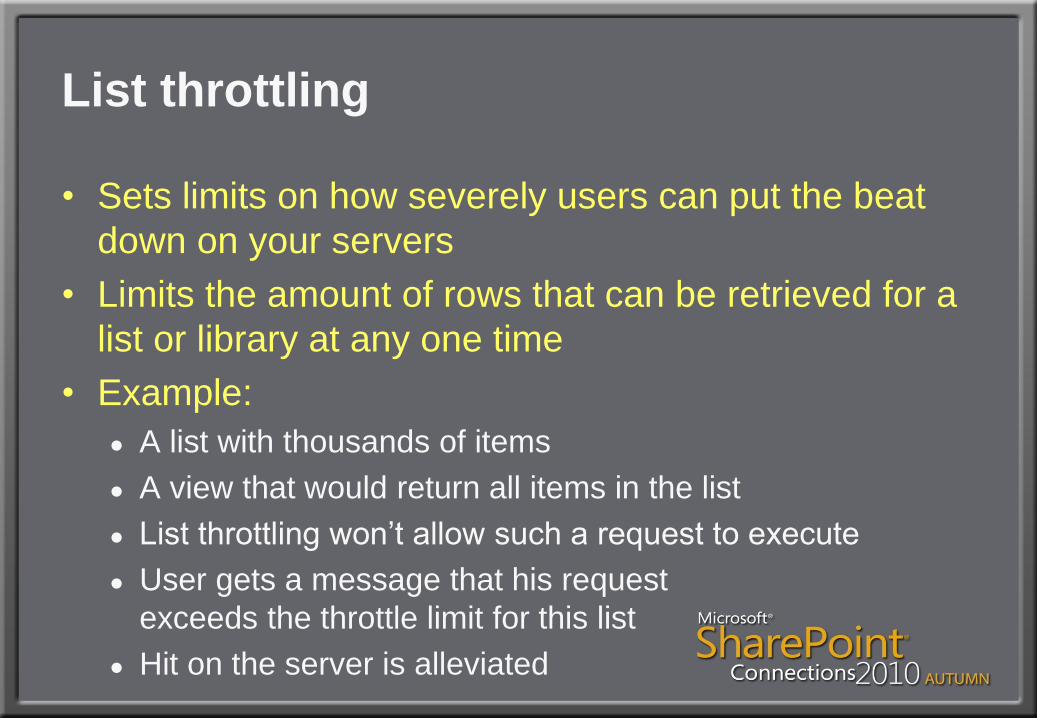
List throttling
• Sets limits on how severely users can put the beat
down on your servers
• Limits the amount of rows that can be retrieved for a
list or library at any one time
• Example:
● A list with thousands of items
● A view that would return all items in the list
● List throttling won’t allow such a request to execute
● User gets a message that his request
exceeds the throttle limit for this list
● Hit on the server is alleviated
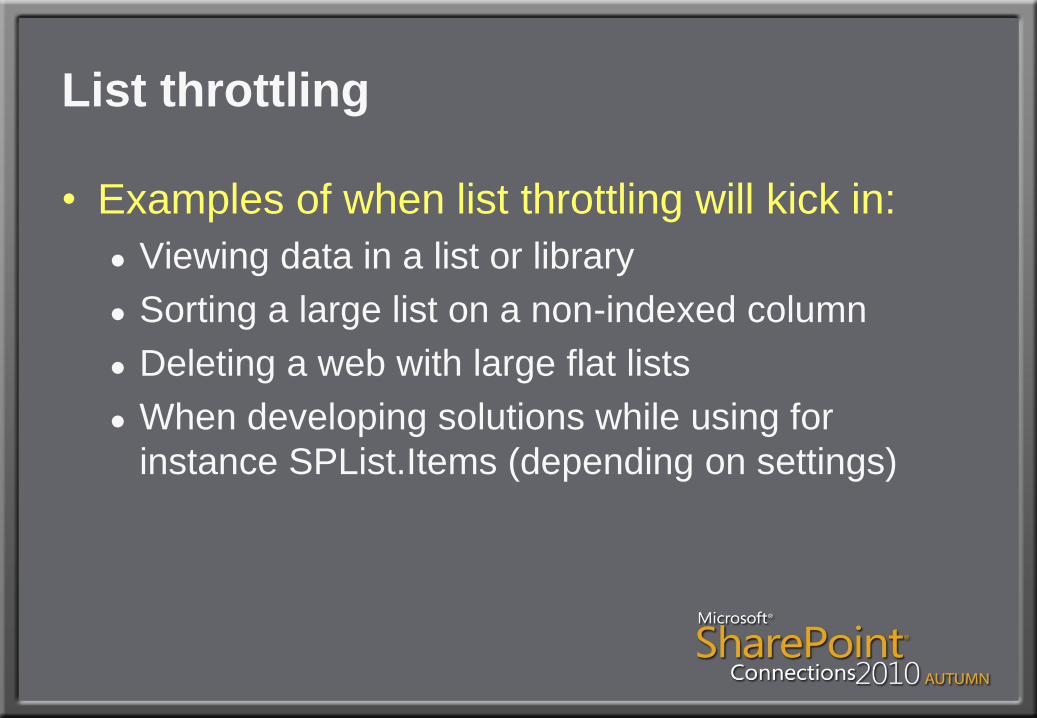
List throttling
• Examples of when list throttling will kick in:
● Viewing data in a list or library
● Sorting a large list on a non-indexed column
● Deleting a web with large flat lists
● When developing solutions while using for
instance SPList.Items (depending on settings)
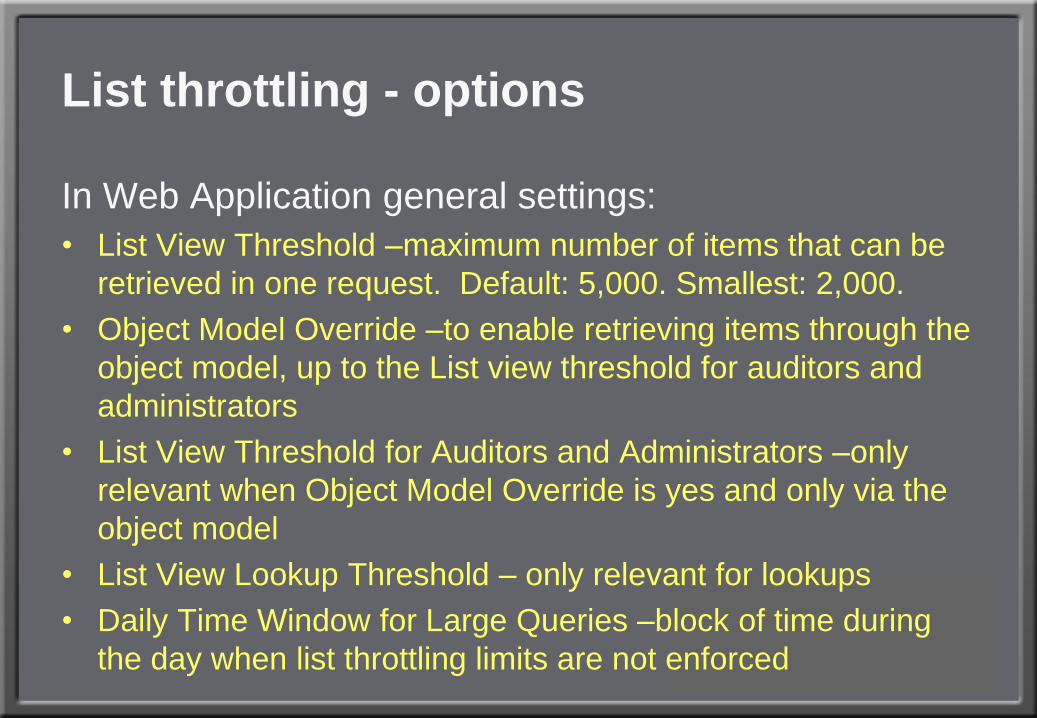
List throttling - options
In Web Application general settings:
• List View Threshold –maximum number of items that can be
retrieved in one request. Default: 5,000. Smallest: 2,000.
• Object Model Override –to enable retrieving items through the
object model, up to the List view threshold for auditors and
administrators
• List View Threshold for Auditors and Administrators –only
relevant when Object Model Override is yes and only via the
object model
• List View Lookup Threshold – only relevant for lookups
• Daily Time Window for Large Queries –block of time during
the day when list throttling limits are not enforced
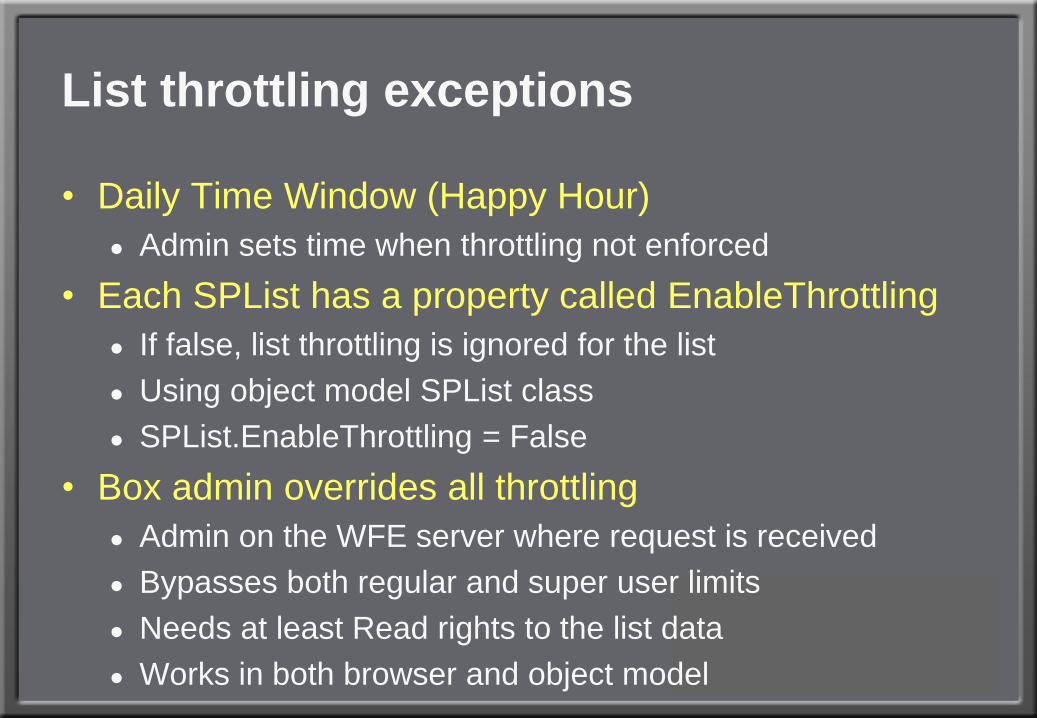
List throttling exceptions
• Daily Time Window (Happy Hour)
● Admin sets time when throttling not enforced
• Each SPList has a property called EnableThrottling
● If false, list throttling is ignored for the list
● Using object model SPList class
● SPList.EnableThrottling = False
• Box admin overrides all throttling
● Admin on the WFE server where request is received
● Bypasses both regular and super user limits
● Needs at least Read rights to the list data
● Works in both browser and object model
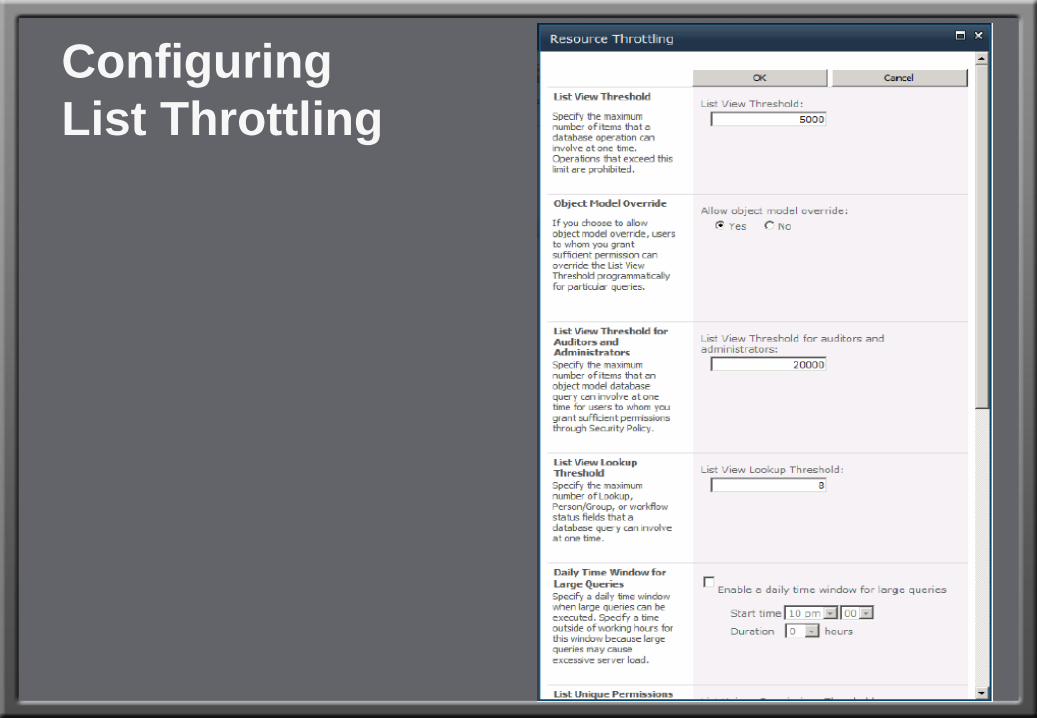
Configuring
List Throttling
List Throttling
Your Feedback is Important
Please fill out a session evaluation form.
Thank you!