Embed Size (px)
Citation preview
arX
iv:a
stro
-ph/
0406
675v
1 3
0 Ju
n 20
04Astronomy & Astrophysicsmanuscript no. 1207rev July 17, 2018(DOI: will be inserted by hand later)
Warm water vapor envelope in Mira variables and its effects onthe apparent size from the near-infrared to the mid-infrared
Keiichi Ohnaka
Max-Planck-Institut fur Radioastronomie, Auf dem Hugel69, D-53121 Bonn, Germany
Received/ Accepted
Abstract. We present a possible interpretation for the increase of theangular diameter of the Mira variableso Cet, R Leo,andχ Cyg from theK band to the 11µm region revealed by the recent interferometric observations using narrow bandpasseswhere no salient spectral feature is present (Weiner et al. 2003a, 2003b). A simple two-layer model consisting of hot andcoolH2O layers for the warm water vapor envelope, whose presence inMira variables was revealed by previous spectroscopicobservations, can reproduce the angular diameters observed with Infrared Spatial Interferometer as well as the high-resolutionTEXES spectra obtained in the 11µm region. The warm water vapor layers are optically thick in the lines, and therefore, strongabsorption due to H2O can be expected from such a dense water vapor envelope. However, the absorption lines are filled in byemission from the extended part of the envelope, and this results in the high-resolution 11µm spectra which exhibit only weak,fine spectral features, masking the spectroscopic evidences of the dense, warm water vapor envelope. On the other hand, thepresence of the warm water vapor envelope manifests itself as the larger angular diameters in the 11µm region as comparedto those measured in the near-infrared. Furthermore, comparison of the visibilities predicted in the near-infrared (1.5–3.8µm)with observational results available in the literature demonstrates that our two-layer model for the warm water vapor envelopecan also reproduce the observed near-infrared visibilities and angular diameters, and suggests that the wavelength dependenceof the angular size of Mira variables in the infrared largelyreflects the H2O opacity. The radii of the hot H2O layers in the threeMira variables are derived to be 1.5–1.7R⋆ with temperatures of 1800–2000 K and H2O column densities of (1–5)×1021 cm−2,while the radii of the cool H2O layers are derived to be 2.2–2.5R⋆ with temperatures of 1200–1400 K and H2O column densitiesof (1–7)× 1021 cm−2.
Key words. infrared: stars – molecular processes – techniques: interferometric – stars: late-type – stars: AGB and post-AGB –stars: individual:o Cet, R Leo,χ Cyg
1. Introduction
An increase of the angular size from the near-infrared towardlonger wavelengths appears to be a common phenomenon ob-served in various classes of cool luminous stars such as M(super)giants and Mira variables. Mennesson et al. (2002) re-vealed that the uniform disk (UD) diameters of semiregu-lar M giants as well as Mira variables measured in theL′
band are 20–100% larger than those measured in theK′ band.Recently, Weiner et al. (2000, 2003a, and 2003b, hereafterW00, WHT03a, and WHT03b, respectively) have measured theangular size at 11µm for the M supergiantsα Ori andα Her aswell as the Mira variableso Cet, R Leo, andχ Cyg, using theInfrared Spatial Interferometer (ISI) with a spectral bandwidthof 0.17 cm−1. They found that the uniform disk diameters ofthe two M supergiants measured at 11µm are∼30% larger thanthose measured in theK band, while the 11µm uniform diskdiameters of the three Mira variables are roughly twice as largeas those measured in theK band.
Send offprint requests to: Keiichi Ohnaka,e-mail:[email protected]
Although these Mira variables exhibit dust emission fromthe circumstellar envelope, the observed increase of the angu-lar diameter from the near-infrared to the mid-infrared cannotsimply be attributed to the dust shell, as discussed in detail byWHT03a. The radii of the inner boundary of the circumstellardust shell are estimated to be 2–4R⋆ for o Cet and R Leo, and∼20 R⋆ for χ Cyg (Danchi et al. 1994, Schuller et al. 2004),and such extended dust shells are completely resolved with thebaselines of 20–56 m used in the ISI observations by W00,WHT03a, and WHT03b. In other words, the visibility compo-nent resulting from the dust shell is nearly zero at these baselinelengths, and the effect of the dust shell is to lower the total vis-ibility by an amount equal to the fraction of flux originatinginthe dust shell in the field of view. This effect is already takeninto account in the determination of the uniform disk diametersby W00, WHT03a, and WHT03b, and therefore, it is unlikelythat the extended dust shell causes the 11µm angular size toappear larger than in the near-infrared.
Instead, the increase of the angular size from theK band totheL′ band as well as to the 11µm region can be attributed toextended gaseous layers close to the photosphere. Mennesson
2 K. Ohnaka: Warm water vapor envelope in Mira variables
et al. (2002) conclude that the observed increase of the an-gular diameter from theK′ band to theL′ band can be ex-plained by an optically thin layer (τ ≈ 0.5) extending to∼3 R⋆with a (pseudo)continuous opacity. Perrin et al. (2004) applya similar model to interferometric observations ofα Ori andα Her obtained in theK andL bands as well as in the 11µmregion, and conclude that the extended gaseous layer is opti-cally thin in theK andL bands (τK = 0.06 andτL = 0.026),but optically thick in the 11µm region (τ11µm = 2.33). BothMennesson et al. (2002) and Perrin et al. (2004) suspect opac-ities due to molecular species such as H2O, CO, and SiO asthe source of the (pseudo)continuous opacity. The presenceofsuch a warm molecular envelope is already confirmed by anal-yses of infrared molecular spectra. Tsuji (1978) interpreted in-frared spectral data of the M supergiantµ Cep and the Miravariable R Cas in terms of a warm water vapor envelope,and Tsuji (1988) further found evidence of the presence ofthe warm molecular envelope in the high-resolution spectraof M (super)giants. More recently, infrared spectra obtainedwith the Short Wavelength Spectrometer (SWS) onboard theInfrared Space Observatory (ISO) have provided ample infor-mation on physical parameters of the warm molecular envelope(e.g., Tsuji et al. 1997, Yamamura et al. 1999, Cami et al. 2000,Matsuura et al. 2002).
However, the high-resolution 11µm spectra of the M su-pergiantsα Ori andα Her as well as the Mira variableso Cet,R Leo, andχ Cyg presented by WHT03a and WHT03b turnout to pose difficulty in interpreting the increase of the angu-lar diameter in terms of the extended, warm water vapor en-velope. These 11µm spectra were obtained using the TEXESinstrument mounted on the Infrared Telescope Facility tele-scope with a spectral resolution of∼105 (Lacy et al. 2002).The high-resolution TEXES spectra of the above M supergiantsand Mira variables reveal that no salient spectral featuresarepresent within the bandpasses used in the ISI observations,andtherefore, these spectroscopic observations appear to be in con-tradiction with the interpretation that the dense, warm water va-por envelope is responsible for the increase of the angular sizefrom the near-infrared to the 11µm region.
Ohnaka (2004, hereafter Paper I) demonstrates that thewarm water vapor envelope extending to 1.4–1.5R⋆ with tem-peratures of∼2000 K and H2O column densities of the orderof 1020 cm−2 can reproduce the observed increase of the an-gular diameter from the near-infrared to the 11µm region inα Ori and α Her and, simultaneously, their featureless high-resolution spectra at 11µm. While significant absorption is ex-pected from such a warm water vapor envelope, the absorptionlines are filled in by the emission of H2O lines from the ex-tended part of the envelope, which leads to spectra without anyconspicuous spectral features as observed with the TEXES in-strument. On the other hand, the emission from the extendedwater vapor envelope causes the apparent size of the objectsto be significantly larger than the photospheric size, in agree-ment with the interferometric observations with ISI presentedby WHT03b.
If the warm water vapor envelope is present even in earlyM supergiants such asα Ori andµ Cep and causes the stel-lar angular size in the mid-infrared to appear larger than that
Thot NhotRhot
Rcool
I )(p,ω
Tcool Ncool
p
T eff
R*
θ
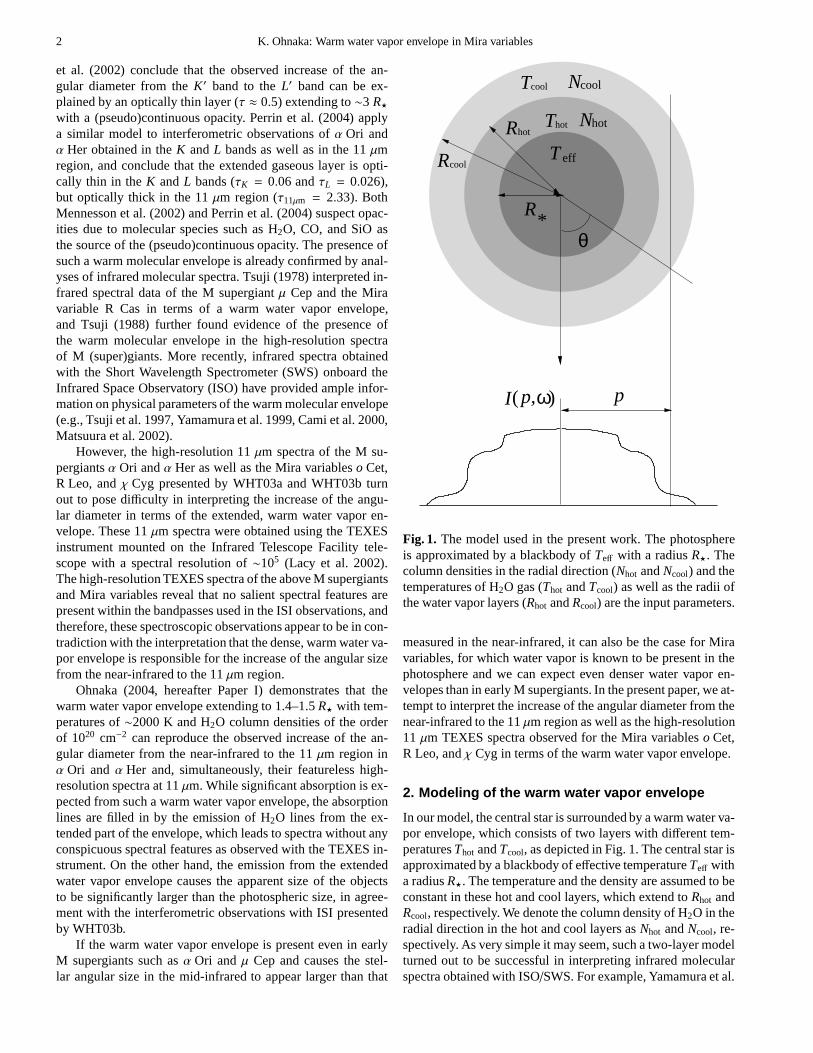
Fig. 1. The model used in the present work. The photosphereis approximated by a blackbody ofTeff with a radiusR⋆. Thecolumn densities in the radial direction (Nhot andNcool) and thetemperatures of H2O gas (Thot andTcool) as well as the radii ofthe water vapor layers (Rhot andRcool) are the input parameters.
measured in the near-infrared, it can also be the case for Miravariables, for which water vapor is known to be present in thephotosphere and we can expect even denser water vapor en-velopes than in early M supergiants. In the present paper, weat-tempt to interpret the increase of the angular diameter fromthenear-infrared to the 11µm region as well as the high-resolution11 µm TEXES spectra observed for the Mira variableso Cet,R Leo, andχ Cyg in terms of the warm water vapor envelope.
2. Modeling of the warm water vapor envelope
In our model, the central star is surrounded by a warm water va-por envelope, which consists of two layers with different tem-peraturesThot andTcool, as depicted in Fig. 1. The central star isapproximated by a blackbody of effective temperatureTeff witha radiusR⋆. The temperature and the density are assumed to beconstant in these hot and cool layers, which extend toRhot andRcool, respectively. We denote the column density of H2O in theradial direction in the hot and cool layers asNhot andNcool, re-spectively. As very simple it may seem, such a two-layer modelturned out to be successful in interpreting infrared molecularspectra obtained with ISO/SWS. For example, Yamamura et al.
K. Ohnaka: Warm water vapor envelope in Mira variables 3
(1999) and Matsuura et al. (2002) could reproduce H2O spec-tra of Mira variables obtained with ISO/SWS using a two-layermodel, although their two-layer model consists of a stack ofplane-parallel slabs, instead of spherical layers as adopted inthe present work.
We adopt an effective temperature of 3000 K for the Miravariables studied in the present work. While the effective tem-peratures of Mira variables are known to show temporal varia-tions with phase (e.g., van Belle et al. 1996, Perrin et al. 1999,Woodruff et al. 2004), the effect of the uncertainty of the ef-fective temperature adopted in our model turns out to be minoras we show below, because the warm water vapor envelope isquite optically thick in the wavelength regions discussed in thepresent work.
We first calculate the line opacity due to H2O assuming aGaussian profile. We adopt a velocity of 5 km s−1 for the sumof the thermal velocity and the micro-turbulent velocity. Thegf -values and the lower excitation potentials of H2O lines arecalculated using the HITEMP line list (Rothman 1997) and thelist compiled by Partridge & Schwenke (1997, hereafter PS97).The HITEMP line list is an extension of the HITRAN databasetoward high temperatures expected in stellar atmospheres,andthe HITEMP H2O line list used here is calculated for a tem-perature of 1000 K. As we demonstrate below, the temperatureof the warm water vapor envelope can be as high as∼2000 K,and therefore, the HITEMP H2O line list for 1000 K may notbe adequate for such a high temperature. The PS97 H2O linelist is generated for a temperature of 4000 K and appears to bethe most extensive line list of H2O up to date. We use both linelists for our calculation to study possible effects of the differ-ence between the two H2O line lists.
The energy level populations of H2O are calculated assum-ing local thermodynamical equilibrium (LTE). We examine thevalidity of LTE in the temperature and density ranges relevantfor the present work, using the order-of-magnitude estimatesof collisional and radiative de-excitation rates, as adopted inPaper I. The collisional de-excitation rateCul is given byCul ∼Nσulvrel, whereN is the density of the primary collision part-ner,σul is the cross section, which we approximate with thegeometrical cross section, andvrel is the relative velocity be-tween the collision partner species and H2O molecules. As wewill show below, for the hot layer of the warm water vaporenvelope ino Cet, R Leo, andχ Cyg, the column density ofH2O is found to be of the order of 1021 cm−2 with tempera-tures of 1800–2000 K, and the geometrical thickness is derivedto be∼0.5 R⋆, which translates into 1× 1013 cm with a stel-lar radius of 300R⊙ assumed. The number density of H2Ois then estimated to be 1× 108 cm−3. For temperatures anddensities found in the hot layer of the warm water vapor en-velope, H atoms appear to be the primary collision partner ofH2O molecules, and the ratio of the number density of H atomsto that of H2O molecules expected in chemical equilibrium isapproximately 104 for the relevant temperatures and densities.Therefore, the number density of H atoms in the hot layer isestimated to be∼1× 1012 cm−3. With a geometrical cross sec-tion σul of 10−15 cm2 and a relative velocityvrel of 5 km s−1
assumed, this number density of H atoms leads to a collisionalde-excitation rate of∼ 500 s−1. For the cool component of the
water vapor envelope, we derive temperatures of 1200–1400 K,geometrical thicknesses of∼1.5 R⋆, and H2O column densitiesof the order of 1021 cm−2, which leads to a number density ofH2O of∼3×107 cm−3. At these temperatures and densities, H2
molecules are the main collision partner of H2O molecules, andthe ratio of the number density of H2 molecules to that of H2Omolecules expected in chemical equilibrium is∼3×10³, whichleads to a collisional de-excitation rate of∼50 s−1. On the otherhand, the rate of spontaneous emission can be estimated fromthe Einstein coefficientsAul. For the H2O molecule, the rangesof Aul are approximately∼10−4–3×10² s−1, ∼10−5–3×10² s−1,and<∼ 10 s−1 in the 11µm region,K band, andL′ band, respec-tively. Therefore, for these wavelength regions we will discussbelow, the assumption of LTE is valid for weak and moder-ately strong H2O lines both in the hot and cool layers of thewarm water vapor envelope, while non-LTE effects may not benegligible for very strong lines. However, a comprehensivecal-culation with non-LTE effects taken into account is beyond thescope of the present paper, and we assume LTE for the H2Olines considered here.
Once the line opacity has been obtained, the monochro-matic intensity profile as well as the spectrum (emergent flux)can be calculated at an appropriate wavenumber interval, asdescribed in Paper I. In order to compare with the observedTEXES spectra of the three Mira variables, synthetic spectraare spectrally convolved with a Gaussian profile which repre-sents the effects of the spectral resolution of the instrument aswell as of the macro-turbulent velocity in the atmosphere ofthe Mira variables. The spectral resolution of the TEXES in-strument is 105, which translates into an instrumental broad-ening of 3 km s−1. The macro-turbulent velocity in the atmo-sphere of Mira variables is not well known. For non-Mira Mgiants, however, analyses of high-resolution spectra are avail-able, and they may be used as a guide to estimate the macro-turbulent velocity in the atmosphere of Mira variables. Tsuji(1986) analyzed the CO first-overtone bands of non-Mira K andM giants and obtained macro-turbulent velocities ranging from∼1 km s−1 to ∼4 km s−1. In the present work, we tentativelyassume a macro-turbulent velocity of 3 km s−1 for the threeMiras, and the FWHM of the Gaussian profile to represent thespectral resolution of the instrument and the macro-turbulentvelocity is calculated as
√32 + 32 = 4.24 km s−1. The spec-
trum convolved with this Gaussian profile and normalized,Fω,is then diluted as follows, taking the effect of continuous dustemission from the circumstellar dust shell into account:
Fdilutedω = (1− fdust)Fω + fdust, (1)
whereFdilutedω is the final spectrum andfdust is the fraction of
the flux contribution of the circumstellar dust shell.We calculate the monochromatic visibility from the
monochromatic intensity profile at each wavenumber usingthe Hankel transform, and then the monochromatic visibilityis spectrally convolved with an appropriate response functionwhich represents the spectral resolution of the interferometricobservation at issue. For the ISI observations we will discussbelow, WHT03a and WHT03b used narrow bandpasses with awidth of 0.17 cm−1. Therefore, the spectral response functionis assumed to be a top-hat function with a width of 0.17 cm−1.
4 K. Ohnaka: Warm water vapor envelope in Mira variables
We compare synthetic spectra and uniform disk diameterswith the TEXES spectra as well as the 11µm uniform disk di-ameters obtained by WHT03a and WHT03b, searching for aparameter set which can best reproduce these observationalre-sults. The ranges of the input parameters are as follows:Thot
(K) = 1600 ... 2000 with∆Thot = 100 K, Tcool (K) = 1000 ...1400 with∆Tcool = 100 K, Rhot (R⋆) = 1.3, 1.5, 1.7, and 2.0,and Rcool (R⋆) = 2.0, 2.2, 2.5, 2.7, and 3.0 with a conditionRhot < Rcool. The grid forNhot (cm−2 ) andNcool (cm−2 ) is 1019,1020, 5 × 10²⁰, 1021, 3 × 10²¹, 5 × 10²¹, 7 × 10²¹, and 1022.The uncertainties of the derived temperatures and radii of theH2O layers are estimated to be±100 K and±0.2 R⋆, respec-tively, while the uncertainties of the H2O column densities areapproximately a factor of 2. The adoption of an effective tem-perature of 2800 K, instead of 3000 K, leads to no noticeablechanges in the spectra and visibilities discussed in the presentwork. In the next section, we discuss comparison between ob-servation and model for each object.
3. Comparison with the observed spectra andangular diameters
3.1. o Cet
3.1.1. 11 µm spectrum
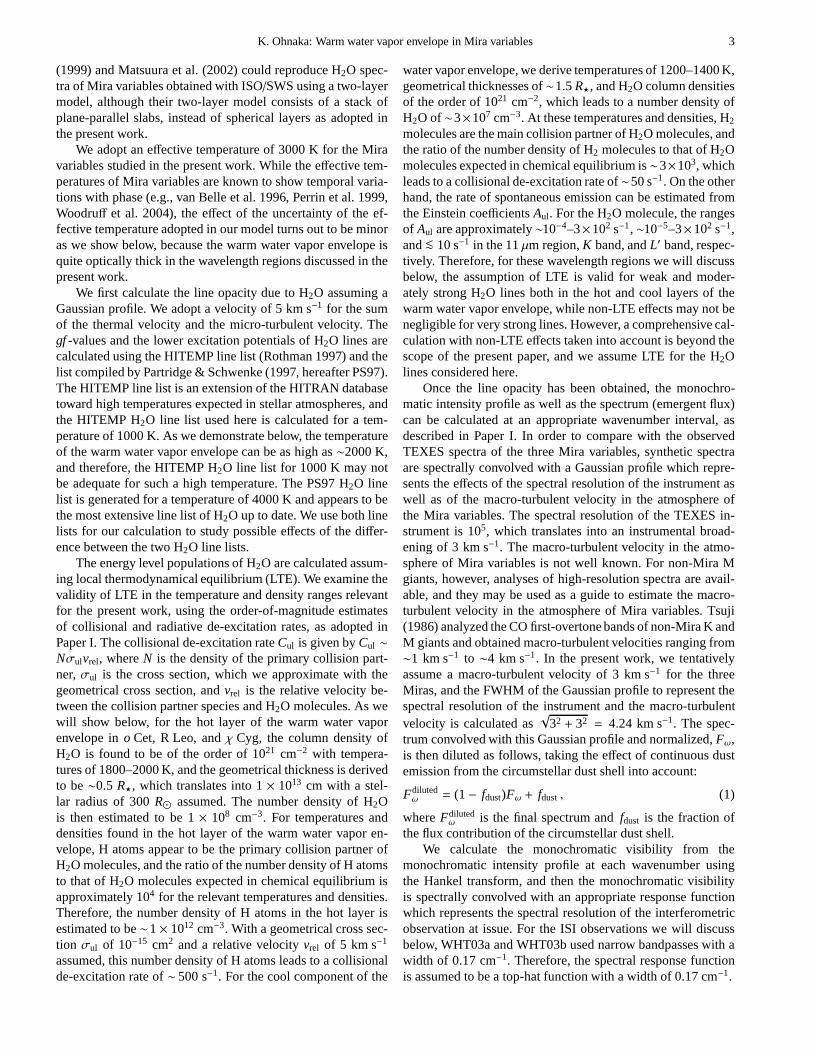
For o Cet, we find that the 11µm spectrum observed at phase0.36, which is presented in WHT03a, as well as the 11µm uni-form disk diameters obtained by W00 and WHT03a can be bestreproduced by a model withThot = 1800 K, Rhot = 1.5 R⋆,Nhot = 5 × 1021 cm−2, Tcool = 1400 K, Rcool = 2.2 R⋆, andNcool = 1× 1021 cm−2. Figure 2 shows the synthetic spectra inthe 11µm region predicted by the best-fit model foro Cet, to-gether with the TEXES spectrum obtained at phase 0.36, whichwas read off Fig. 2 in WHT03a. The synthetic spectrum cal-culated with the HITEMP H2O line list is represented by thegreen solid line, while that calculated with the PS97 H2O linelist is represented by the blue solid line. The synthetic spec-tra are redshifted by 83 km s−1 to match the observation (seeWHT03a). WHT03a derived the fraction of the flux contribu-tion of the stellar disk ofo Cet ranging from 0.24 to 0.47 at11 µm, which corresponds to the fraction of the flux contri-bution of the dust shell between 0.76 and 0.53. We adoptedfdust = 0.7 in our calculation of the 11µm region foro Cet.While the synthetic spectrum calculated with the PS97 line listshows H2O features which are not seen in the spectrum calcu-lated with the HITEMP database, the discrepancy between thetwo synthetic spectra is not very serious or systematic for thetemperatures and densities relevant for the present calculation,given the uncertainties of the line positions of both line lists.For example, Ryde et al. (2002) found that the uncertainty ofthe positions of H2O pure rotation lines around 12µm predictedby PS97 is∼0.05 cm−1. On the other hand, the uncertainty ofH2O line positions in the HITEMP database is between∼0.1and∼1.0 cm−1. Figure 2 shows that the two synthetic spec-tra can reproduce the approximate depths and heights of theobserved fine spectral features and, in particular, the observedspectra free from any conspicuous spectral features in the band-
Fig. 2. Spectra ofo Cet in the 11µm region at phase 0.36. Thered dots represent the observed spectrum ofo Cet presented inWHT03a, while the green and blue solid lines represent thecalculated spectra using the HITEMP database and the PS97line list, respectively. The parameters of the best-fit model foro Cet areThot = 1800 K,Rhot = 1.5 R⋆, Nhot = 5× 1021 cm−2,Tcool = 1400 K,Rcool = 2.2R⋆, andNcool = 1× 1021 cm−2. Thesynthetic spectra are convolved with a Gaussian with a FWHMof 0.013 cm−1 to account for the effects of the instrument aswell as of the macro-turbulent velocity, and are redshiftedby83 km s−1 to match the observation. The dashed lines repre-sent the bandpasses used in the ISI observations. The positionsof the H2O lines whose intensity at 2000 K is stronger than1 × 10−24 cm molecule−1 are marked with upper ticks (PS97line list) and lower ticks (HITEMP database). These line posi-tions are also redshifted by 83 km s−1 with respect to the restwavenumber.
passes at around∼896.83 cm−1 and∼895.1 cm−1 (dashed lines)used for the ISI observations. In these bandpasses, a numberof H2O lines are present, as marked by the ticks in Fig. 2.The continuum-like appearance of the spectra is a result of thefilling-in of the absorption lines by emission from the extendedpart of the warm water vapor envelope, as we will discuss be-low. On the other hand, the match for the individual line profilesis not very good, which can partially be attributed to the uncer-tainties of the line positions predicted by both line lists,but it isalso due to the simplicity of our model, which cannot accountfor complicated physical and chemical processes taking placein the outer atmosphere of Mira variables. For example, thestrong H2O lines at 897.40, 897.45, 902.04, and 918.57 cm−1
K. Ohnaka: Warm water vapor envelope in Mira variables 5
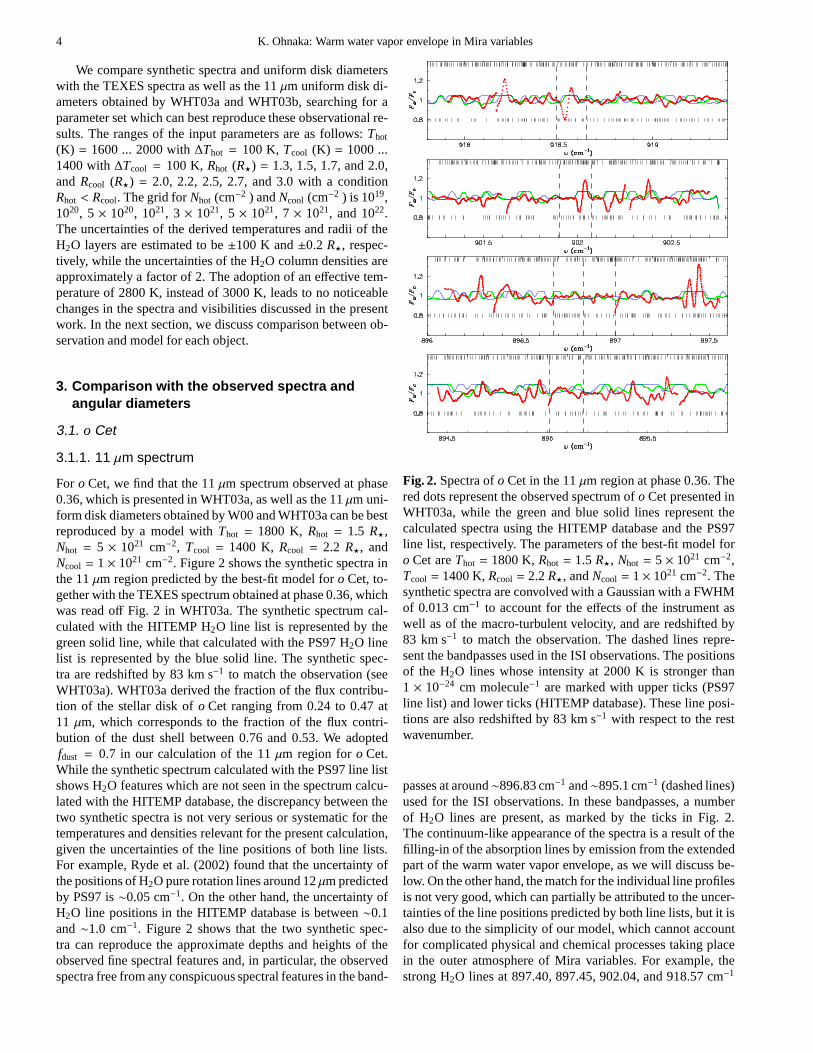
Fig. 3. a: 11 µm spectra predicted from the best-fit model foro Cet at the stellar disk center (µ = 1, top spectrum), near thelimb of the warm H2O envelope (µ = 0.2, bottom spectrum),and between the disk center and the limb (µ = 0.85, mid-dle spectrum). The continuum level is shown with the dashedline, and the HITEMP database is used in the calculation. Theflux contribution of dust emission is not included in the spec-tra shown.b: The dotted line represents the spectrum (emer-gent flux) expected for the whole object (stellar disk+ warmwater vapor envelope) without the dilution effect due to dustemission. The solid line represents the final spectrum with aflux contribution of dust emission of 70% taken into account.c: Optical depth in the radial direction due to H2O lines in thesame spectral region. The positions of the H2O lines are markedwith ticks. The spectra and the flux shown ina andb as well asthe optical depth shown inc are redshifted by 83 km s−1 withrespect to the rest wavenumber to match the observed spectrumshown in Fig. 2, butnot convolved with the Gaussian represent-ing the instrumental effect and the macro-turbulent velocity.
show inverse P-Cygni profiles, which suggest an inflow witha velocity of 11 km s−1. Such a dynamical process is not takeninto account in our model, and therefore, these line profilescan-not be well reproduced by our two-layer model.
The continuum-like appearance of the spectrum ofo Cet inthe 11µm region can be explained by the filling-in effect dueto H2O line emission from the extended part of the warm watervapor envelope. This effect is illustrated in Fig. 3, where thespectra expected at the disk center (µ = 1, whereµ ≡ cosθwith θ defined in Fig. 1), at a position between the disk centerand the limb (µ = 0.85), and near the limb (µ = 0.2) are shownin the top panel. The bottom panel of Fig. 3 shows the opti-cal depth of the water vapor envelope, and the figure reveals
that the water vapor envelope is optically thick (τω ≈ 1–60).These spectra as well as the optical depth are calculated withthe HITEMP database. The H2O lines appear as strong absorp-tion in the spectrum at the disk center, as the top spectrum inFig. 3a shows. On the other hand, the spectrum near the limb(bottom spectrum in Fig. 3a) shows emission at the positionsofthe H2O lines, and these emission lines originate in the coolerH2O layer. The spectrum for a line of sight between the diskcenter and the limb (middle spectrum in Fig. 3a) is dominatedby the H2O emission lines originating in the hotter layer over-laid by the H2O absorption lines originating in the cooler layer.Since the spectrum (emergent flux) of the object is obtained byintegrating the intensity over the area that the object projectsonto the plane of the sky, the absorption due to H2O lines is sig-nificantly filled in by emission from the limb, resulting in thespectrum showing only moderately strong emission features,as plotted with the dotted line in Fig. 3b. These emission fea-tures are further weakened by dilution due to continuous dustemission, as the final spectrum (solid line) in Fig. 3b shows.
The parameters derived above are similar to those derivedby Yamamura et al. (1999) foro Cet at phase 0.99:Thot =
2000 K,Rhot = 2.0R⋆, Nhot = 3.0× 1021 cm−2, Tcool = 1400 K,Rcool = 2.3 R⋆, and Ncool = 3.0 × 1020 cm−2. However, it isnot straightforward to discuss the phase dependence of thesephysical properties, not only because of the uncertaintiesof thederived parameters, but also because of the phase dependenceof the stellar continuum radius. The analysis by Woodruffet al. (2004) demonstrates that the stellar radius ofo Cet inthe 1.04µm continuum predicted by dynamical model atmo-spheres shows a sinusoidal variation from phase 0.0 to 0.5 witha maximum at around phase 0.25, while the relatively large er-rors of the observationally derived continuum radii resultingfrom the uncertainty of the distance prevented the authors fromconfirming this theoretical prediction. Interferometric observa-tions with spectral resolution high enough to resolve molecularbands would be useful for obtaining reliable stellar continuumdiameters and studying temporal variations of physical proper-ties of the warm water vapor envelope.
3.1.2. 11 µm angular diameter
We now calculate the angular diameter ofo Cet predicted fromthe above model for the warm water vapor envelope. In order tocompare with the observed uniform disk diameters, it is neces-sary to estimate the angular size of the star, which correspondsto R⋆. Woodruff et al. (2004) analyzed theK-band interfero-metric data ofo Cet obtained with VLTI/VINCI at phases from0.13 to 0.40. They derived the Rosseland radius as well as thecontinuum radius at 1.04µm at each phase by fitting the ob-served visibilities with theoretical ones predicted by dynami-cal model atmospheres, and found that the continuum diame-ter at 1.04µm at phase 0.40 is 340R⊙, which corresponds to29.5 mas (see Fig. 7 in Woodruff et al. 2004). In the presentcalculation, we adopt this value as the diameter of the stel-lar disk. Figures 4a and 4b show the predicted visibilities anduniform disk diameters, using the HITEMP database and thePS97 line list. The visibilities as well as the uniform disk di-
6 K. Ohnaka: Warm water vapor envelope in Mira variables
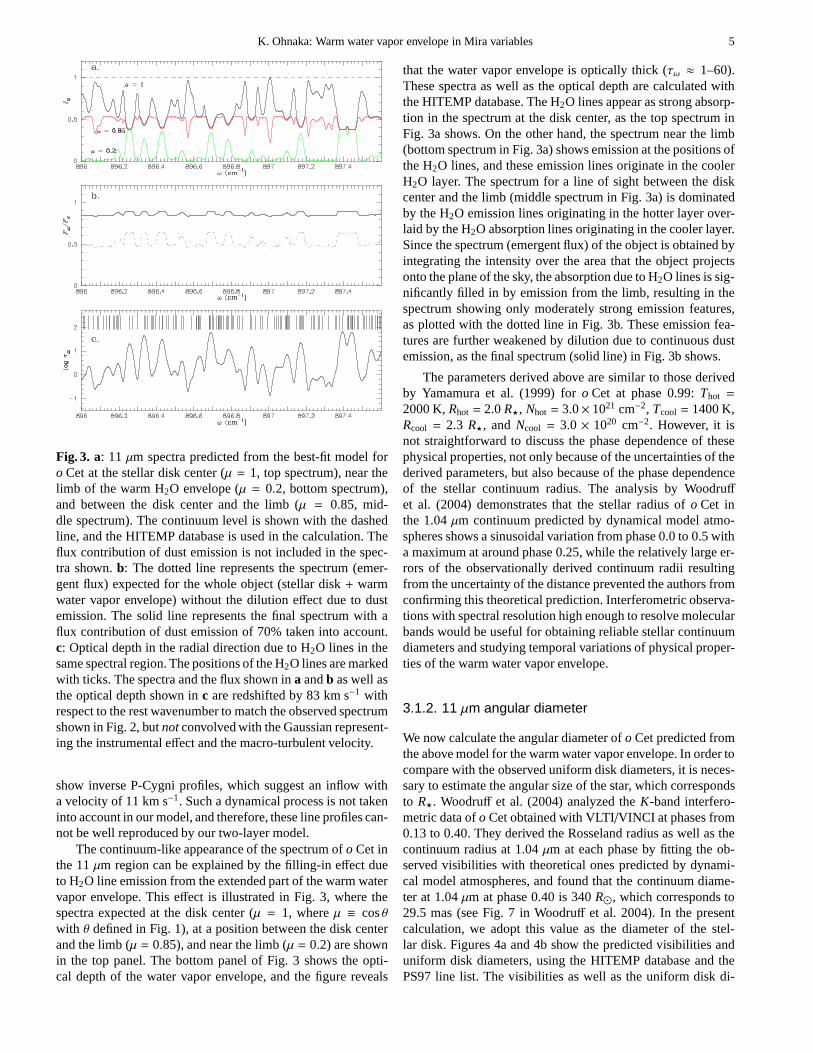
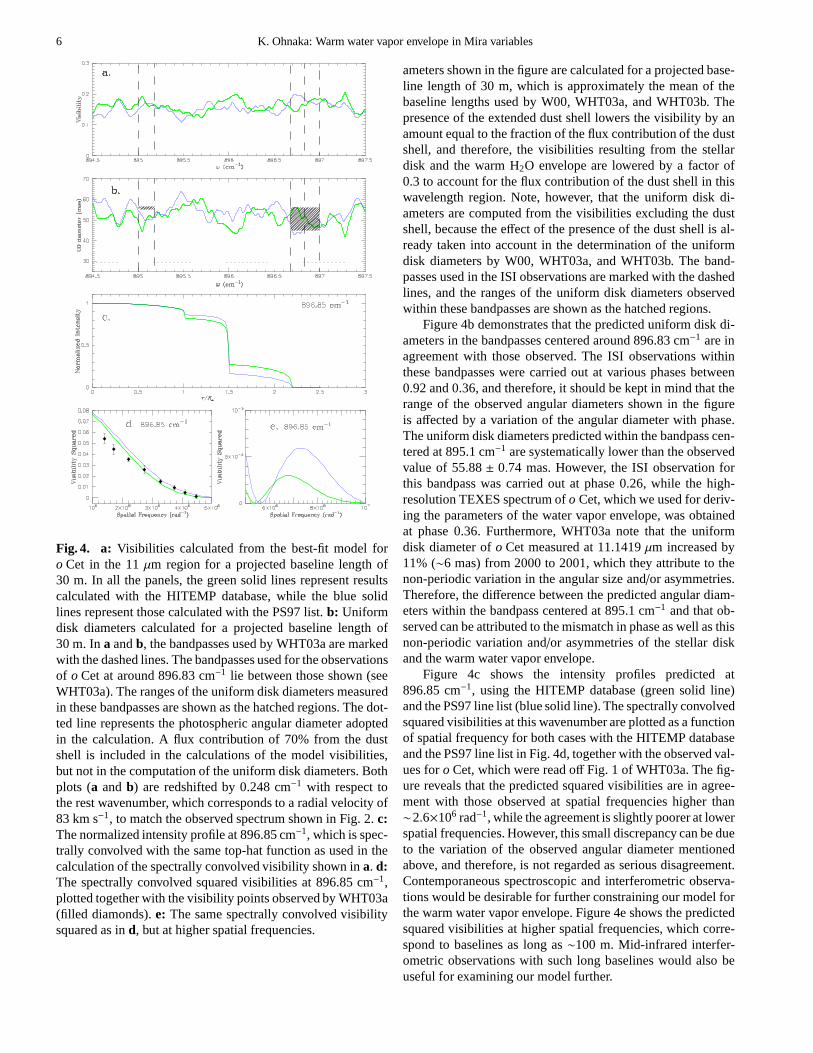
Fig. 4. a: Visibilities calculated from the best-fit model foro Cet in the 11µm region for a projected baseline length of30 m. In all the panels, the green solid lines represent resultscalculated with the HITEMP database, while the blue solidlines represent those calculated with the PS97 list.b: Uniformdisk diameters calculated for a projected baseline length of30 m. Ina andb, the bandpasses used by WHT03a are markedwith the dashed lines. The bandpasses used for the observationsof o Cet at around 896.83 cm−1 lie between those shown (seeWHT03a). The ranges of the uniform disk diameters measuredin these bandpasses are shown as the hatched regions. The dot-ted line represents the photospheric angular diameter adoptedin the calculation. A flux contribution of 70% from the dustshell is included in the calculations of the model visibilities,but not in the computation of the uniform disk diameters. Bothplots (a andb) are redshifted by 0.248 cm−1 with respect tothe rest wavenumber, which corresponds to a radial velocityof83 km s−1, to match the observed spectrum shown in Fig. 2.c:The normalized intensity profile at 896.85 cm−1, which is spec-trally convolved with the same top-hat function as used in thecalculation of the spectrally convolved visibility shown in a. d:The spectrally convolved squared visibilities at 896.85 cm−1,plotted together with the visibility points observed by WHT03a(filled diamonds).e: The same spectrally convolved visibilitysquared as ind, but at higher spatial frequencies.
ameters shown in the figure are calculated for a projected base-line length of 30 m, which is approximately the mean of thebaseline lengths used by W00, WHT03a, and WHT03b. Thepresence of the extended dust shell lowers the visibility byanamount equal to the fraction of the flux contribution of the dustshell, and therefore, the visibilities resulting from the stellardisk and the warm H2O envelope are lowered by a factor of0.3 to account for the flux contribution of the dust shell in thiswavelength region. Note, however, that the uniform disk di-ameters are computed from the visibilities excluding the dustshell, because the effect of the presence of the dust shell is al-ready taken into account in the determination of the uniformdisk diameters by W00, WHT03a, and WHT03b. The band-passes used in the ISI observations are marked with the dashedlines, and the ranges of the uniform disk diameters observedwithin these bandpasses are shown as the hatched regions.
Figure 4b demonstrates that the predicted uniform disk di-ameters in the bandpasses centered around 896.83 cm−1 are inagreement with those observed. The ISI observations withinthese bandpasses were carried out at various phases between0.92 and 0.36, and therefore, it should be kept in mind that therange of the observed angular diameters shown in the figureis affected by a variation of the angular diameter with phase.The uniform disk diameters predicted within the bandpass cen-tered at 895.1 cm−1 are systematically lower than the observedvalue of 55.88± 0.74 mas. However, the ISI observation forthis bandpass was carried out at phase 0.26, while the high-resolution TEXES spectrum ofo Cet, which we used for deriv-ing the parameters of the water vapor envelope, was obtainedat phase 0.36. Furthermore, WHT03a note that the uniformdisk diameter ofo Cet measured at 11.1419µm increased by11% (∼6 mas) from 2000 to 2001, which they attribute to thenon-periodic variation in the angular size and/or asymmetries.Therefore, the difference between the predicted angular diam-eters within the bandpass centered at 895.1 cm−1 and that ob-served can be attributed to the mismatch in phase as well as thisnon-periodic variation and/or asymmetries of the stellar diskand the warm water vapor envelope.
Figure 4c shows the intensity profiles predicted at896.85 cm−1, using the HITEMP database (green solid line)and the PS97 line list (blue solid line). The spectrally convolvedsquared visibilities at this wavenumber are plotted as a functionof spatial frequency for both cases with the HITEMP databaseand the PS97 line list in Fig. 4d, together with the observed val-ues foro Cet, which were read off Fig. 1 of WHT03a. The fig-ure reveals that the predicted squared visibilities are in agree-ment with those observed at spatial frequencies higher than∼2.6×10⁶ rad−1, while the agreement is slightly poorer at lowerspatial frequencies. However, this small discrepancy can be dueto the variation of the observed angular diameter mentionedabove, and therefore, is not regarded as serious disagreement.Contemporaneous spectroscopic and interferometric observa-tions would be desirable for further constraining our modelforthe warm water vapor envelope. Figure 4e shows the predictedsquared visibilities at higher spatial frequencies, whichcorre-spond to baselines as long as∼100 m. Mid-infrared interfer-ometric observations with such long baselines would also beuseful for examining our model further.
K. Ohnaka: Warm water vapor envelope in Mira variables 7
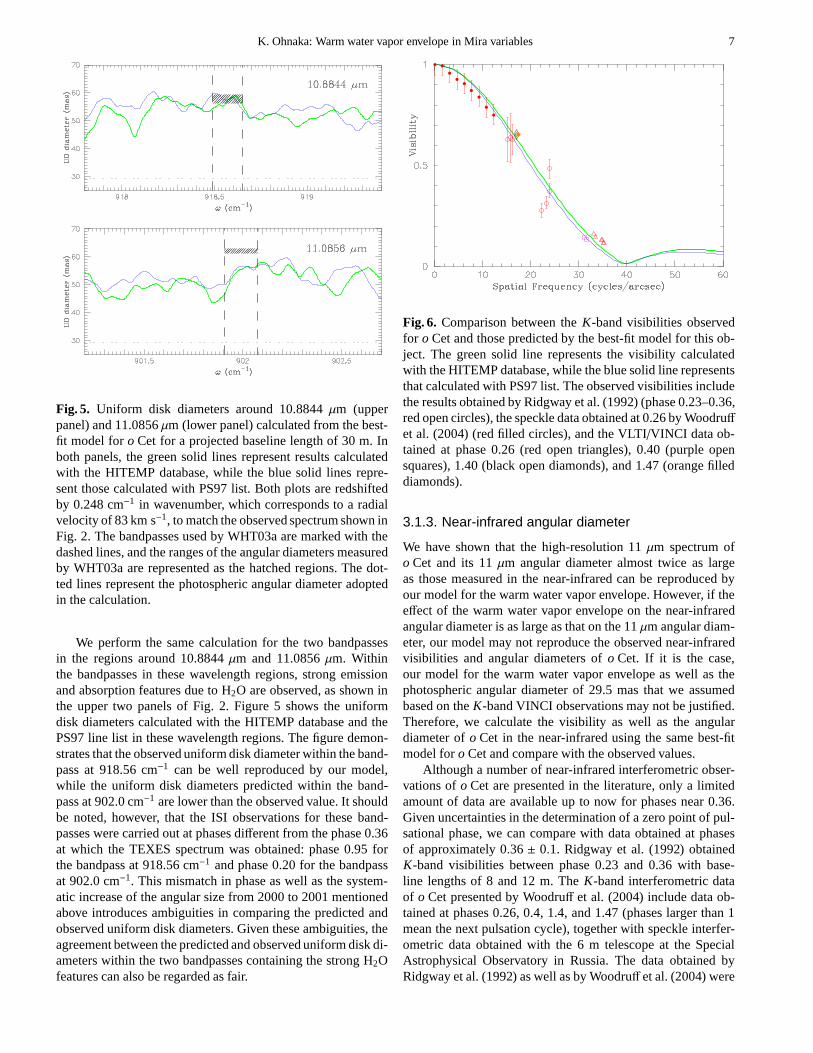
Fig. 5. Uniform disk diameters around 10.8844µm (upperpanel) and 11.0856µm (lower panel) calculated from the best-fit model foro Cet for a projected baseline length of 30 m. Inboth panels, the green solid lines represent results calculatedwith the HITEMP database, while the blue solid lines repre-sent those calculated with PS97 list. Both plots are redshiftedby 0.248 cm−1 in wavenumber, which corresponds to a radialvelocity of 83 km s−1, to match the observed spectrum shown inFig. 2. The bandpasses used by WHT03a are marked with thedashed lines, and the ranges of the angular diameters measuredby WHT03a are represented as the hatched regions. The dot-ted lines represent the photospheric angular diameter adoptedin the calculation.
We perform the same calculation for the two bandpassesin the regions around 10.8844µm and 11.0856µm. Withinthe bandpasses in these wavelength regions, strong emissionand absorption features due to H2O are observed, as shown inthe upper two panels of Fig. 2. Figure 5 shows the uniformdisk diameters calculated with the HITEMP database and thePS97 line list in these wavelength regions. The figure demon-strates that the observed uniform disk diameter within the band-pass at 918.56 cm−1 can be well reproduced by our model,while the uniform disk diameters predicted within the band-pass at 902.0 cm−1 are lower than the observed value. It shouldbe noted, however, that the ISI observations for these band-passes were carried out at phases different from the phase 0.36at which the TEXES spectrum was obtained: phase 0.95 forthe bandpass at 918.56 cm−1 and phase 0.20 for the bandpassat 902.0 cm−1. This mismatch in phase as well as the system-atic increase of the angular size from 2000 to 2001 mentionedabove introduces ambiguities in comparing the predicted andobserved uniform disk diameters. Given these ambiguities,theagreement between the predicted and observed uniform disk di-ameters within the two bandpasses containing the strong H2Ofeatures can also be regarded as fair.
Fig. 6. Comparison between theK-band visibilities observedfor o Cet and those predicted by the best-fit model for this ob-ject. The green solid line represents the visibility calculatedwith the HITEMP database, while the blue solid line representsthat calculated with PS97 list. The observed visibilities includethe results obtained by Ridgway et al. (1992) (phase 0.23–0.36,red open circles), the speckle data obtained at 0.26 by Woodruffet al. (2004) (red filled circles), and the VLTI/VINCI data ob-tained at phase 0.26 (red open triangles), 0.40 (purple opensquares), 1.40 (black open diamonds), and 1.47 (orange filleddiamonds).
3.1.3. Near-infrared angular diameter
We have shown that the high-resolution 11µm spectrum ofo Cet and its 11µm angular diameter almost twice as largeas those measured in the near-infrared can be reproduced byour model for the warm water vapor envelope. However, if theeffect of the warm water vapor envelope on the near-infraredangular diameter is as large as that on the 11µm angular diam-eter, our model may not reproduce the observed near-infraredvisibilities and angular diameters ofo Cet. If it is the case,our model for the warm water vapor envelope as well as thephotospheric angular diameter of 29.5 mas that we assumedbased on theK-band VINCI observations may not be justified.Therefore, we calculate the visibility as well as the angulardiameter ofo Cet in the near-infrared using the same best-fitmodel foro Cet and compare with the observed values.
Although a number of near-infrared interferometric obser-vations ofo Cet are presented in the literature, only a limitedamount of data are available up to now for phases near 0.36.Given uncertainties in the determination of a zero point of pul-sational phase, we can compare with data obtained at phasesof approximately 0.36± 0.1. Ridgway et al. (1992) obtainedK-band visibilities between phase 0.23 and 0.36 with base-line lengths of 8 and 12 m. TheK-band interferometric dataof o Cet presented by Woodruff et al. (2004) include data ob-tained at phases 0.26, 0.4, 1.4, and 1.47 (phases larger than1mean the next pulsation cycle), together with speckle interfer-ometric data obtained with the 6 m telescope at the SpecialAstrophysical Observatory in Russia. The data obtained byRidgway et al. (1992) as well as by Woodruff et al. (2004) were
8 K. Ohnaka: Warm water vapor envelope in Mira variables
acquired with a broadbandK filter, which means that the de-rived apparent size is affected by molecular spectral featuresoriginating in the warm molecular envelope, in particular,H2Olines located at the shorter and longer edges of theK band. Wecalculate the uniform disk diameter in theK band in almostthe same manner as in the 11µm region. The only differenceis that we calculate the monochromatic visibility squared fromthe monochromatic intensity profile, and this monochromaticvisibility squared is spectrally convolved for comparisonwiththe aboveK-band visibility measurements. We include onlyH2O lines in the calculation, and theK-band filter is approx-imated with a top-hat function centered at 2.2µm with ∆λ =0.4 µm. TheK-band speckle visibility obtained at phase 0.26shows no evidence of an extended dust shell, whose presencewould result in a steep drop of visibility at low spatial frequen-cies (see Fig. 2 in Woodruff et al. 2004). While a possible ap-pearance of significant dust emission in theK band at phasesother than 0.26 cannot be ruled out, it seems to be unlikely thatdust emission has a noticeable effect on theK-band visibility atphase 0.36. Therefore, no flux contribution from the dust shellis included in the calculation of visibilities in this wavelengthregion. Figure 6 shows a comparison between the observedK-band visibilities mentioned above and those predicted by thebest-fit model foro Cet. The figure illustrates that the observedvisibilities are well reproduced by our model.
We also compare the predictedK-band uniform disk di-ameters with that observationally derived. From the predictedvisibilities shown in Fig. 6, the uniform disk diameter is de-rived for a projected baseline length of 15 m, which is roughlythe mean of the baselines used in the observations presentedby Woodruff et al. (2004). TheK-band uniform disk diame-ters predicted from the best-fit model foro Cet are 34.1 maswith the HITEMP database and 34.9 mas with the PS97 linelist. These predicted values are in agreement with the uniformdisk diameter of 33.27± 0.33 mas at phase 0.40 obtained byWoodruff et al (2004), and this agreement lends support to ourmodel for the warm water vapor envelope as well as the photo-spheric angular diameter adopted in the present calculation.
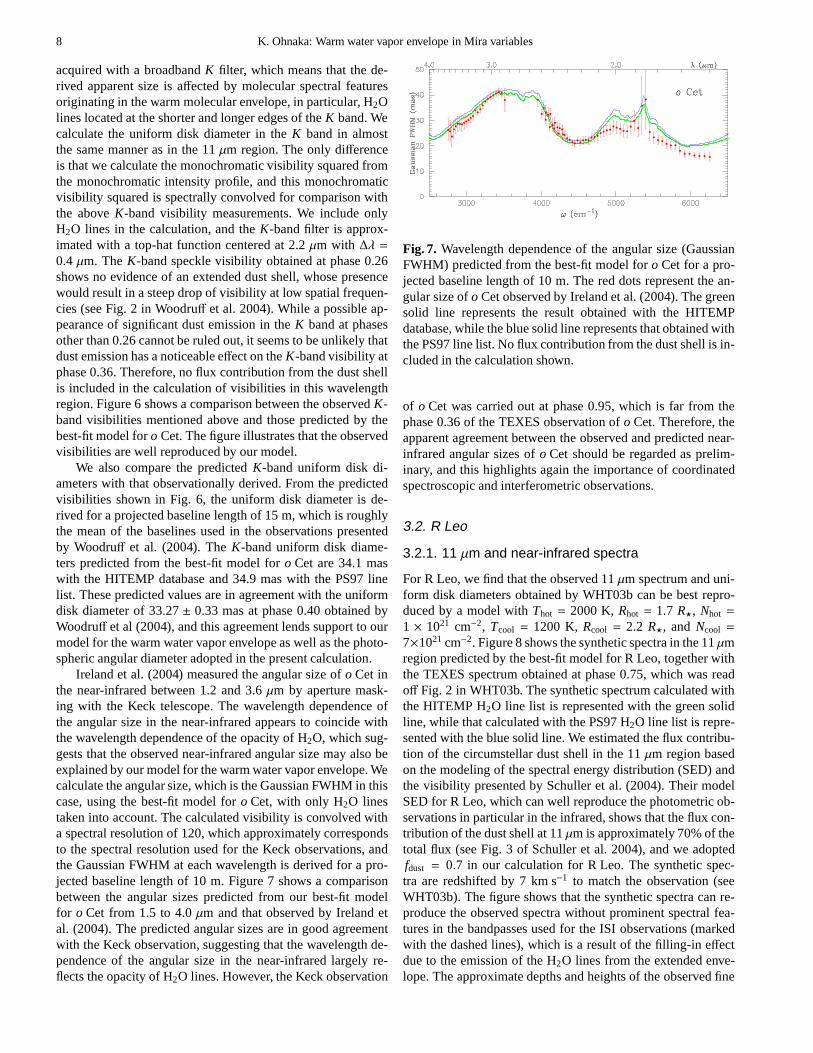
Ireland et al. (2004) measured the angular size ofo Cet inthe near-infrared between 1.2 and 3.6µm by aperture mask-ing with the Keck telescope. The wavelength dependence ofthe angular size in the near-infrared appears to coincide withthe wavelength dependence of the opacity of H2O, which sug-gests that the observed near-infrared angular size may alsobeexplained by our model for the warm water vapor envelope. Wecalculate the angular size, which is the Gaussian FWHM in thiscase, using the best-fit model foro Cet, with only H2O linestaken into account. The calculated visibility is convolvedwitha spectral resolution of 120, which approximately correspondsto the spectral resolution used for the Keck observations, andthe Gaussian FWHM at each wavelength is derived for a pro-jected baseline length of 10 m. Figure 7 shows a comparisonbetween the angular sizes predicted from our best-fit modelfor o Cet from 1.5 to 4.0µm and that observed by Ireland etal. (2004). The predicted angular sizes are in good agreementwith the Keck observation, suggesting that the wavelength de-pendence of the angular size in the near-infrared largely re-flects the opacity of H2O lines. However, the Keck observation
Fig. 7. Wavelength dependence of the angular size (GaussianFWHM) predicted from the best-fit model foro Cet for a pro-jected baseline length of 10 m. The red dots represent the an-gular size ofo Cet observed by Ireland et al. (2004). The greensolid line represents the result obtained with the HITEMPdatabase, while the blue solid line represents that obtained withthe PS97 line list. No flux contribution from the dust shell isin-cluded in the calculation shown.
of o Cet was carried out at phase 0.95, which is far from thephase 0.36 of the TEXES observation ofo Cet. Therefore, theapparent agreement between the observed and predicted near-infrared angular sizes ofo Cet should be regarded as prelim-inary, and this highlights again the importance of coordinatedspectroscopic and interferometric observations.
3.2. R Leo
3.2.1. 11 µm and near-infrared spectra
For R Leo, we find that the observed 11µm spectrum and uni-form disk diameters obtained by WHT03b can be best repro-duced by a model withThot = 2000 K, Rhot = 1.7 R⋆, Nhot =
1 × 1021 cm−2, Tcool = 1200 K, Rcool = 2.2 R⋆, and Ncool =
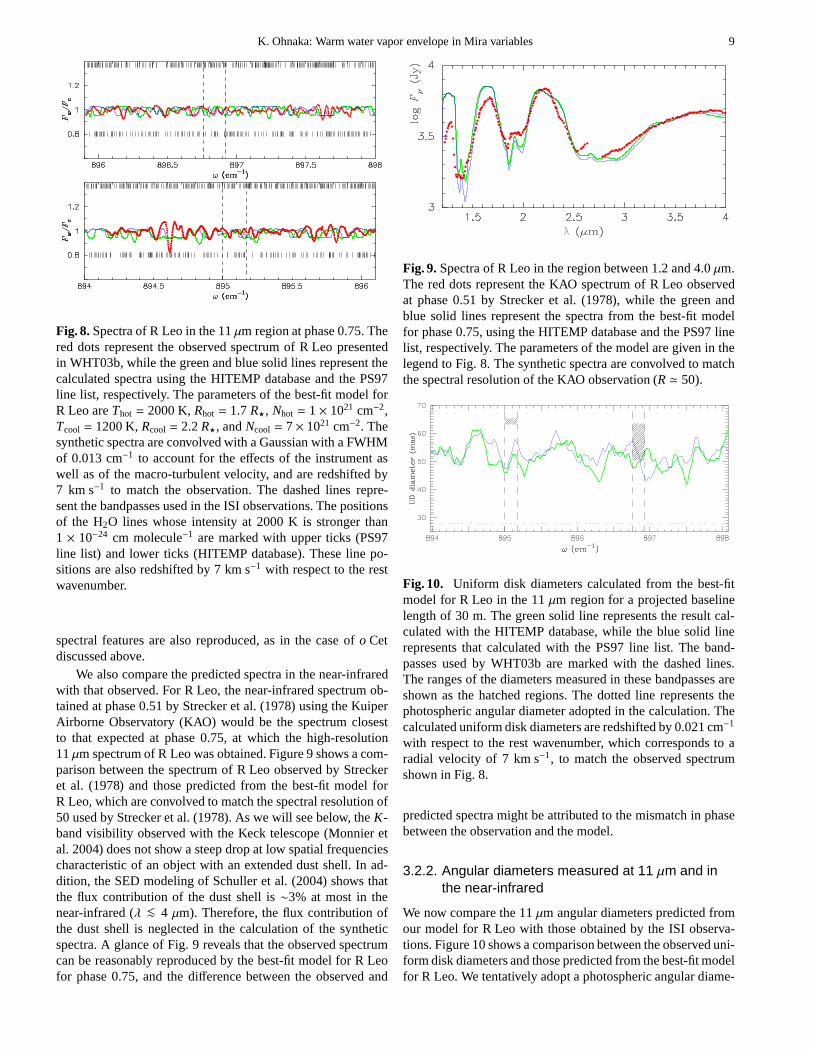
7×1021 cm−2. Figure 8 shows the synthetic spectra in the 11µmregion predicted by the best-fit model for R Leo, together withthe TEXES spectrum obtained at phase 0.75, which was readoff Fig. 2 in WHT03b. The synthetic spectrum calculated withthe HITEMP H2O line list is represented with the green solidline, while that calculated with the PS97 H2O line list is repre-sented with the blue solid line. We estimated the flux contribu-tion of the circumstellar dust shell in the 11µm region basedon the modeling of the spectral energy distribution (SED) andthe visibility presented by Schuller et al. (2004). Their modelSED for R Leo, which can well reproduce the photometric ob-servations in particular in the infrared, shows that the fluxcon-tribution of the dust shell at 11µm is approximately 70% of thetotal flux (see Fig. 3 of Schuller et al. 2004), and we adoptedfdust = 0.7 in our calculation for R Leo. The synthetic spec-tra are redshifted by 7 km s−1 to match the observation (seeWHT03b). The figure shows that the synthetic spectra can re-produce the observed spectra without prominent spectral fea-tures in the bandpasses used for the ISI observations (markedwith the dashed lines), which is a result of the filling-in effectdue to the emission of the H2O lines from the extended enve-lope. The approximate depths and heights of the observed fine
K. Ohnaka: Warm water vapor envelope in Mira variables 9
Fig. 8. Spectra of R Leo in the 11µm region at phase 0.75. Thered dots represent the observed spectrum of R Leo presentedin WHT03b, while the green and blue solid lines represent thecalculated spectra using the HITEMP database and the PS97line list, respectively. The parameters of the best-fit model forR Leo areThot = 2000 K,Rhot = 1.7R⋆, Nhot = 1× 1021 cm−2,Tcool = 1200 K,Rcool = 2.2R⋆, andNcool = 7× 1021 cm−2. Thesynthetic spectra are convolved with a Gaussian with a FWHMof 0.013 cm−1 to account for the effects of the instrument aswell as of the macro-turbulent velocity, and are redshiftedby7 km s−1 to match the observation. The dashed lines repre-sent the bandpasses used in the ISI observations. The positionsof the H2O lines whose intensity at 2000 K is stronger than1 × 10−24 cm molecule−1 are marked with upper ticks (PS97line list) and lower ticks (HITEMP database). These line po-sitions are also redshifted by 7 km s−1 with respect to the restwavenumber.
spectral features are also reproduced, as in the case ofo Cetdiscussed above.
We also compare the predicted spectra in the near-infraredwith that observed. For R Leo, the near-infrared spectrum ob-tained at phase 0.51 by Strecker et al. (1978) using the KuiperAirborne Observatory (KAO) would be the spectrum closestto that expected at phase 0.75, at which the high-resolution11µm spectrum of R Leo was obtained. Figure 9 shows a com-parison between the spectrum of R Leo observed by Streckeret al. (1978) and those predicted from the best-fit model forR Leo, which are convolved to match the spectral resolution of50 used by Strecker et al. (1978). As we will see below, theK-band visibility observed with the Keck telescope (Monnier etal. 2004) does not show a steep drop at low spatial frequenciescharacteristic of an object with an extended dust shell. In ad-dition, the SED modeling of Schuller et al. (2004) shows thatthe flux contribution of the dust shell is∼3% at most in thenear-infrared (λ <∼ 4 µm). Therefore, the flux contribution ofthe dust shell is neglected in the calculation of the syntheticspectra. A glance of Fig. 9 reveals that the observed spectrumcan be reasonably reproduced by the best-fit model for R Leofor phase 0.75, and the difference between the observed and
Fig. 9. Spectra of R Leo in the region between 1.2 and 4.0µm.The red dots represent the KAO spectrum of R Leo observedat phase 0.51 by Strecker et al. (1978), while the green andblue solid lines represent the spectra from the best-fit modelfor phase 0.75, using the HITEMP database and the PS97 linelist, respectively. The parameters of the model are given inthelegend to Fig. 8. The synthetic spectra are convolved to matchthe spectral resolution of the KAO observation (R ≃ 50).
Fig. 10. Uniform disk diameters calculated from the best-fitmodel for R Leo in the 11µm region for a projected baselinelength of 30 m. The green solid line represents the result cal-culated with the HITEMP database, while the blue solid linerepresents that calculated with the PS97 line list. The band-passes used by WHT03b are marked with the dashed lines.The ranges of the diameters measured in these bandpasses areshown as the hatched regions. The dotted line represents thephotospheric angular diameter adopted in the calculation.Thecalculated uniform disk diameters are redshifted by 0.021 cm−1
with respect to the rest wavenumber, which corresponds to aradial velocity of 7 km s−1, to match the observed spectrumshown in Fig. 8.
predicted spectra might be attributed to the mismatch in phasebetween the observation and the model.
3.2.2. Angular diameters measured at 11 µm and inthe near-infrared
We now compare the 11µm angular diameters predicted fromour model for R Leo with those obtained by the ISI observa-tions. Figure 10 shows a comparison between the observed uni-form disk diameters and those predicted from the best-fit modelfor R Leo. We tentatively adopt a photospheric angular diame-
10 K. Ohnaka: Warm water vapor envelope in Mira variables
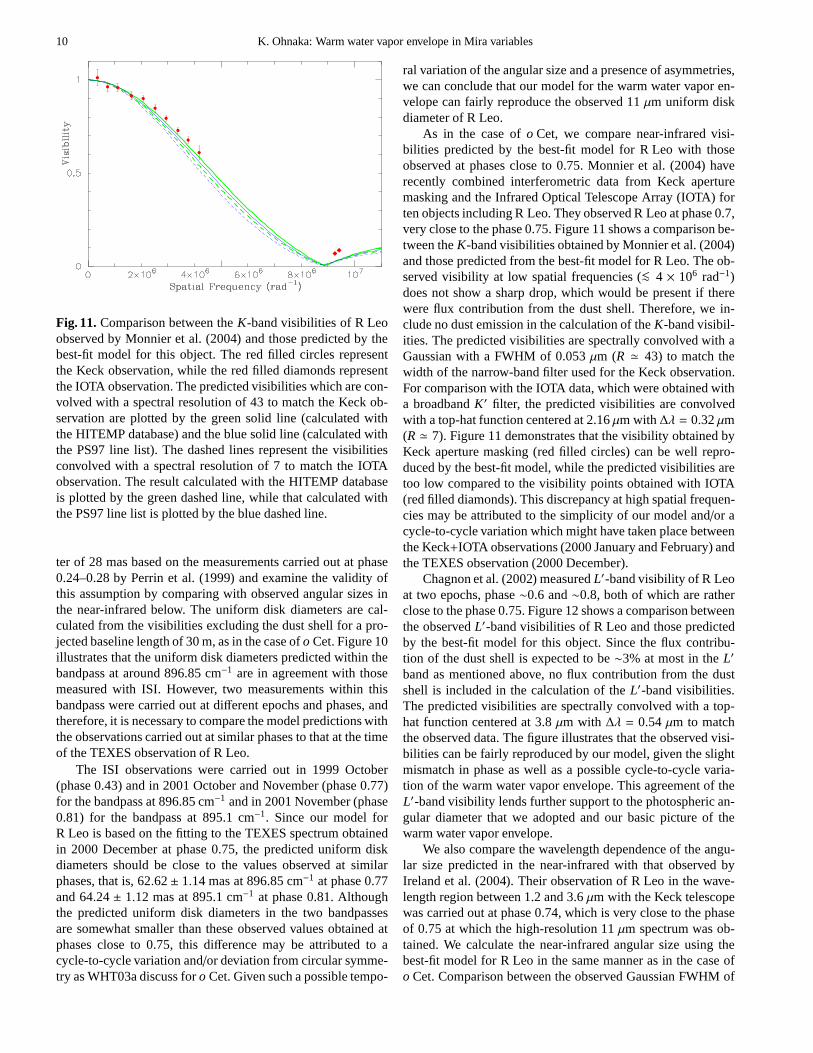
Fig. 11. Comparison between theK-band visibilities of R Leoobserved by Monnier et al. (2004) and those predicted by thebest-fit model for this object. The red filled circles representthe Keck observation, while the red filled diamonds representthe IOTA observation. The predicted visibilities which arecon-volved with a spectral resolution of 43 to match the Keck ob-servation are plotted by the green solid line (calculated withthe HITEMP database) and the blue solid line (calculated withthe PS97 line list). The dashed lines represent the visibilitiesconvolved with a spectral resolution of 7 to match the IOTAobservation. The result calculated with the HITEMP databaseis plotted by the green dashed line, while that calculated withthe PS97 line list is plotted by the blue dashed line.
ter of 28 mas based on the measurements carried out at phase0.24–0.28 by Perrin et al. (1999) and examine the validity ofthis assumption by comparing with observed angular sizes inthe near-infrared below. The uniform disk diameters are cal-culated from the visibilities excluding the dust shell for apro-jected baseline length of 30 m, as in the case ofo Cet. Figure 10illustrates that the uniform disk diameters predicted within thebandpass at around 896.85 cm−1 are in agreement with thosemeasured with ISI. However, two measurements within thisbandpass were carried out at different epochs and phases, andtherefore, it is necessary to compare the model predictionswiththe observations carried out at similar phases to that at thetimeof the TEXES observation of R Leo.
The ISI observations were carried out in 1999 October(phase 0.43) and in 2001 October and November (phase 0.77)for the bandpass at 896.85 cm−1 and in 2001 November (phase0.81) for the bandpass at 895.1 cm−1. Since our model forR Leo is based on the fitting to the TEXES spectrum obtainedin 2000 December at phase 0.75, the predicted uniform diskdiameters should be close to the values observed at similarphases, that is, 62.62± 1.14 mas at 896.85 cm−1 at phase 0.77and 64.24± 1.12 mas at 895.1 cm−1 at phase 0.81. Althoughthe predicted uniform disk diameters in the two bandpassesare somewhat smaller than these observed values obtained atphases close to 0.75, this difference may be attributed to acycle-to-cycle variation and/or deviation from circular symme-try as WHT03a discuss foro Cet. Given such a possible tempo-
ral variation of the angular size and a presence of asymmetries,we can conclude that our model for the warm water vapor en-velope can fairly reproduce the observed 11µm uniform diskdiameter of R Leo.
As in the case ofo Cet, we compare near-infrared visi-bilities predicted by the best-fit model for R Leo with thoseobserved at phases close to 0.75. Monnier et al. (2004) haverecently combined interferometric data from Keck aperturemasking and the Infrared Optical Telescope Array (IOTA) forten objects including R Leo. They observed R Leo at phase 0.7,very close to the phase 0.75. Figure 11 shows a comparison be-tween theK-band visibilities obtained by Monnier et al. (2004)and those predicted from the best-fit model for R Leo. The ob-served visibility at low spatial frequencies (<∼ 4 × 10⁶ rad−1)does not show a sharp drop, which would be present if therewere flux contribution from the dust shell. Therefore, we in-clude no dust emission in the calculation of theK-band visibil-ities. The predicted visibilities are spectrally convolved with aGaussian with a FWHM of 0.053µm (R ≃ 43) to match thewidth of the narrow-band filter used for the Keck observation.For comparison with the IOTA data, which were obtained witha broadbandK′ filter, the predicted visibilities are convolvedwith a top-hat function centered at 2.16µm with∆λ = 0.32µm(R ≃ 7). Figure 11 demonstrates that the visibility obtained byKeck aperture masking (red filled circles) can be well repro-duced by the best-fit model, while the predicted visibilities aretoo low compared to the visibility points obtained with IOTA(red filled diamonds). This discrepancy at high spatial frequen-cies may be attributed to the simplicity of our model and/or acycle-to-cycle variation which might have taken place betweenthe Keck+IOTA observations (2000 January and February) andthe TEXES observation (2000 December).
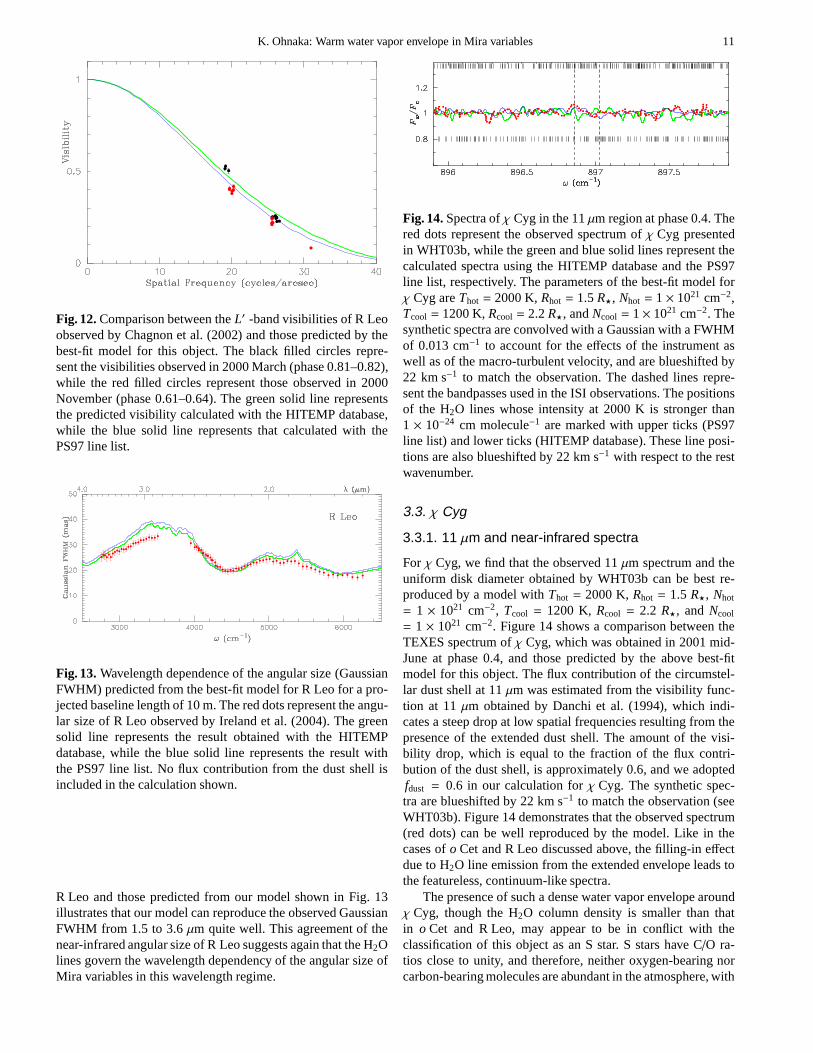
Chagnon et al. (2002) measuredL′-band visibility of R Leoat two epochs, phase∼0.6 and∼0.8, both of which are ratherclose to the phase 0.75. Figure 12 shows a comparison betweenthe observedL′-band visibilities of R Leo and those predictedby the best-fit model for this object. Since the flux contribu-tion of the dust shell is expected to be∼3% at most in theL′
band as mentioned above, no flux contribution from the dustshell is included in the calculation of theL′-band visibilities.The predicted visibilities are spectrally convolved with atop-hat function centered at 3.8µm with ∆λ = 0.54µm to matchthe observed data. The figure illustrates that the observed visi-bilities can be fairly reproduced by our model, given the slightmismatch in phase as well as a possible cycle-to-cycle varia-tion of the warm water vapor envelope. This agreement of theL′-band visibility lends further support to the photospherican-gular diameter that we adopted and our basic picture of thewarm water vapor envelope.
We also compare the wavelength dependence of the angu-lar size predicted in the near-infrared with that observed byIreland et al. (2004). Their observation of R Leo in the wave-length region between 1.2 and 3.6µm with the Keck telescopewas carried out at phase 0.74, which is very close to the phaseof 0.75 at which the high-resolution 11µm spectrum was ob-tained. We calculate the near-infrared angular size using thebest-fit model for R Leo in the same manner as in the case ofo Cet. Comparison between the observed Gaussian FWHM of
K. Ohnaka: Warm water vapor envelope in Mira variables 11
Fig. 12. Comparison between theL′ -band visibilities of R Leoobserved by Chagnon et al. (2002) and those predicted by thebest-fit model for this object. The black filled circles repre-sent the visibilities observed in 2000 March (phase 0.81–0.82),while the red filled circles represent those observed in 2000November (phase 0.61–0.64). The green solid line representsthe predicted visibility calculated with the HITEMP database,while the blue solid line represents that calculated with thePS97 line list.
Fig. 13. Wavelength dependence of the angular size (GaussianFWHM) predicted from the best-fit model for R Leo for a pro-jected baseline length of 10 m. The red dots represent the angu-lar size of R Leo observed by Ireland et al. (2004). The greensolid line represents the result obtained with the HITEMPdatabase, while the blue solid line represents the result withthe PS97 line list. No flux contribution from the dust shell isincluded in the calculation shown.
R Leo and those predicted from our model shown in Fig. 13illustrates that our model can reproduce the observed GaussianFWHM from 1.5 to 3.6µm quite well. This agreement of thenear-infrared angular size of R Leo suggests again that the H2Olines govern the wavelength dependency of the angular size ofMira variables in this wavelength regime.
Fig. 14. Spectra ofχ Cyg in the 11µm region at phase 0.4. Thered dots represent the observed spectrum ofχ Cyg presentedin WHT03b, while the green and blue solid lines represent thecalculated spectra using the HITEMP database and the PS97line list, respectively. The parameters of the best-fit model forχ Cyg areThot = 2000 K,Rhot = 1.5R⋆, Nhot = 1× 1021 cm−2,Tcool = 1200 K,Rcool = 2.2R⋆, andNcool = 1× 1021 cm−2. Thesynthetic spectra are convolved with a Gaussian with a FWHMof 0.013 cm−1 to account for the effects of the instrument aswell as of the macro-turbulent velocity, and are blueshifted by22 km s−1 to match the observation. The dashed lines repre-sent the bandpasses used in the ISI observations. The positionsof the H2O lines whose intensity at 2000 K is stronger than1 × 10−24 cm molecule−1 are marked with upper ticks (PS97line list) and lower ticks (HITEMP database). These line posi-tions are also blueshifted by 22 km s−1 with respect to the restwavenumber.
3.3. χ Cyg
3.3.1. 11 µm and near-infrared spectra
For χ Cyg, we find that the observed 11µm spectrum and theuniform disk diameter obtained by WHT03b can be best re-produced by a model withThot = 2000 K,Rhot = 1.5 R⋆, Nhot
= 1 × 1021 cm−2, Tcool = 1200 K, Rcool = 2.2 R⋆, and Ncool
= 1 × 1021 cm−2. Figure 14 shows a comparison between theTEXES spectrum ofχ Cyg, which was obtained in 2001 mid-June at phase 0.4, and those predicted by the above best-fitmodel for this object. The flux contribution of the circumstel-lar dust shell at 11µm was estimated from the visibility func-tion at 11µm obtained by Danchi et al. (1994), which indi-cates a steep drop at low spatial frequencies resulting fromthepresence of the extended dust shell. The amount of the visi-bility drop, which is equal to the fraction of the flux contri-bution of the dust shell, is approximately 0.6, and we adoptedfdust = 0.6 in our calculation forχ Cyg. The synthetic spec-tra are blueshifted by 22 km s−1 to match the observation (seeWHT03b). Figure 14 demonstrates that the observed spectrum(red dots) can be well reproduced by the model. Like in thecases ofo Cet and R Leo discussed above, the filling-in effectdue to H2O line emission from the extended envelope leads tothe featureless, continuum-like spectra.
The presence of such a dense water vapor envelope aroundχ Cyg, though the H2O column density is smaller than thatin o Cet and R Leo, may appear to be in conflict with theclassification of this object as an S star. S stars have C/O ra-tios close to unity, and therefore, neither oxygen-bearingnorcarbon-bearing molecules are abundant in the atmosphere, with
12 K. Ohnaka: Warm water vapor envelope in Mira variables
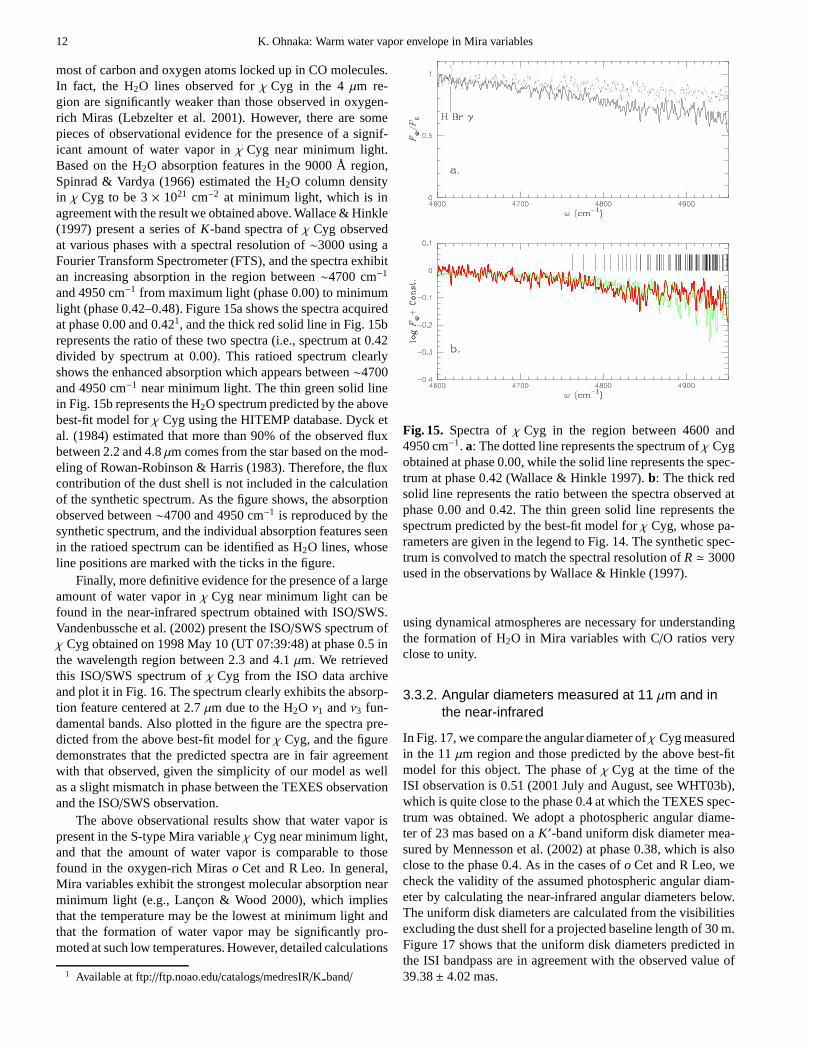
most of carbon and oxygen atoms locked up in CO molecules.In fact, the H2O lines observed forχ Cyg in the 4µm re-gion are significantly weaker than those observed in oxygen-rich Miras (Lebzelter et al. 2001). However, there are somepieces of observational evidence for the presence of a signif-icant amount of water vapor inχ Cyg near minimum light.Based on the H2O absorption features in the 9000 Å region,Spinrad & Vardya (1966) estimated the H2O column densityin χ Cyg to be 3× 1021 cm−2 at minimum light, which is inagreement with the result we obtained above. Wallace & Hinkle(1997) present a series ofK-band spectra ofχ Cyg observedat various phases with a spectral resolution of∼3000 using aFourier Transform Spectrometer (FTS), and the spectra exhibitan increasing absorption in the region between∼4700 cm−1
and 4950 cm−1 from maximum light (phase 0.00) to minimumlight (phase 0.42–0.48). Figure 15a shows the spectra acquiredat phase 0.00 and 0.421, and the thick red solid line in Fig. 15brepresents the ratio of these two spectra (i.e., spectrum at0.42divided by spectrum at 0.00). This ratioed spectrum clearlyshows the enhanced absorption which appears between∼4700and 4950 cm−1 near minimum light. The thin green solid linein Fig. 15b represents the H2O spectrum predicted by the abovebest-fit model forχ Cyg using the HITEMP database. Dyck etal. (1984) estimated that more than 90% of the observed fluxbetween 2.2 and 4.8µm comes from the star based on the mod-eling of Rowan-Robinson & Harris (1983). Therefore, the fluxcontribution of the dust shell is not included in the calculationof the synthetic spectrum. As the figure shows, the absorptionobserved between∼4700 and 4950 cm−1 is reproduced by thesynthetic spectrum, and the individual absorption features seenin the ratioed spectrum can be identified as H2O lines, whoseline positions are marked with the ticks in the figure.
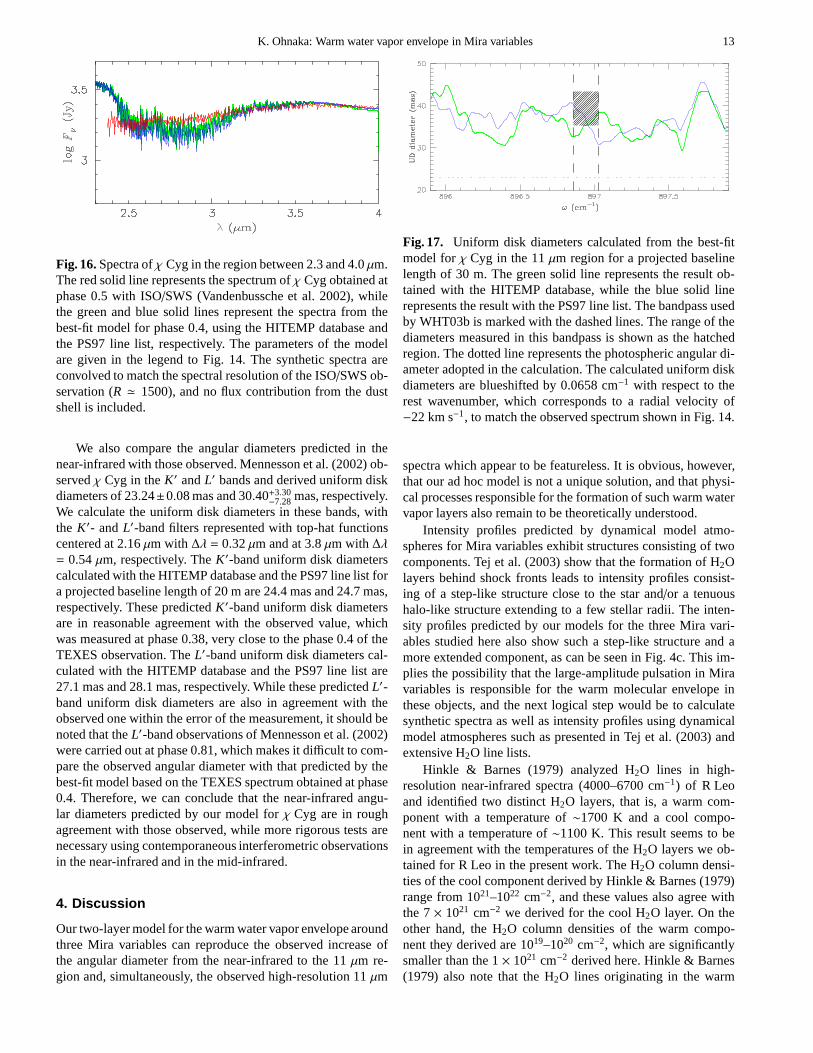
Finally, more definitive evidence for the presence of a largeamount of water vapor inχ Cyg near minimum light can befound in the near-infrared spectrum obtained with ISO/SWS.Vandenbussche et al. (2002) present the ISO/SWS spectrum ofχ Cyg obtained on 1998 May 10 (UT 07:39:48) at phase 0.5 inthe wavelength region between 2.3 and 4.1µm. We retrievedthis ISO/SWS spectrum ofχ Cyg from the ISO data archiveand plot it in Fig. 16. The spectrum clearly exhibits the absorp-tion feature centered at 2.7µm due to the H2O ν1 andν3 fun-damental bands. Also plotted in the figure are the spectra pre-dicted from the above best-fit model forχ Cyg, and the figuredemonstrates that the predicted spectra are in fair agreementwith that observed, given the simplicity of our model as wellas a slight mismatch in phase between the TEXES observationand the ISO/SWS observation.
The above observational results show that water vapor ispresent in the S-type Mira variableχ Cyg near minimum light,and that the amount of water vapor is comparable to thosefound in the oxygen-rich Miraso Cet and R Leo. In general,Mira variables exhibit the strongest molecular absorptionnearminimum light (e.g., Lancon & Wood 2000), which impliesthat the temperature may be the lowest at minimum light andthat the formation of water vapor may be significantly pro-moted at such low temperatures. However, detailed calculations
1 Available at ftp://ftp.noao.edu/catalogs/medresIR/K band/
Fig. 15. Spectra ofχ Cyg in the region between 4600 and4950 cm−1. a: The dotted line represents the spectrum ofχ Cygobtained at phase 0.00, while the solid line represents the spec-trum at phase 0.42 (Wallace & Hinkle 1997).b: The thick redsolid line represents the ratio between the spectra observed atphase 0.00 and 0.42. The thin green solid line represents thespectrum predicted by the best-fit model forχ Cyg, whose pa-rameters are given in the legend to Fig. 14. The synthetic spec-trum is convolved to match the spectral resolution ofR ≃ 3000used in the observations by Wallace & Hinkle (1997).
using dynamical atmospheres are necessary for understandingthe formation of H2O in Mira variables with C/O ratios veryclose to unity.
3.3.2. Angular diameters measured at 11 µm and inthe near-infrared
In Fig. 17, we compare the angular diameter ofχ Cyg measuredin the 11µm region and those predicted by the above best-fitmodel for this object. The phase ofχ Cyg at the time of theISI observation is 0.51 (2001 July and August, see WHT03b),which is quite close to the phase 0.4 at which the TEXES spec-trum was obtained. We adopt a photospheric angular diame-ter of 23 mas based on aK′-band uniform disk diameter mea-sured by Mennesson et al. (2002) at phase 0.38, which is alsoclose to the phase 0.4. As in the cases ofo Cet and R Leo, wecheck the validity of the assumed photospheric angular diam-eter by calculating the near-infrared angular diameters below.The uniform disk diameters are calculated from the visibilitiesexcluding the dust shell for a projected baseline length of 30 m.Figure 17 shows that the uniform disk diameters predicted inthe ISI bandpass are in agreement with the observed value of39.38± 4.02 mas.
K. Ohnaka: Warm water vapor envelope in Mira variables 13
Fig. 16. Spectra ofχ Cyg in the region between 2.3 and 4.0µm.The red solid line represents the spectrum ofχ Cyg obtained atphase 0.5 with ISO/SWS (Vandenbussche et al. 2002), whilethe green and blue solid lines represent the spectra from thebest-fit model for phase 0.4, using the HITEMP database andthe PS97 line list, respectively. The parameters of the modelare given in the legend to Fig. 14. The synthetic spectra areconvolved to match the spectral resolution of the ISO/SWS ob-servation (R ≃ 1500), and no flux contribution from the dustshell is included.
We also compare the angular diameters predicted in thenear-infrared with those observed. Mennesson et al. (2002)ob-servedχ Cyg in theK′ andL′ bands and derived uniform diskdiameters of 23.24±0.08 mas and 30.40+3.30
−7.28 mas, respectively.We calculate the uniform disk diameters in these bands, withthe K′- andL′-band filters represented with top-hat functionscentered at 2.16µm with ∆λ = 0.32µm and at 3.8µm with∆λ= 0.54µm, respectively. TheK′-band uniform disk diameterscalculated with the HITEMP database and the PS97 line list fora projected baseline length of 20 m are 24.4 mas and 24.7 mas,respectively. These predictedK′-band uniform disk diametersare in reasonable agreement with the observed value, whichwas measured at phase 0.38, very close to the phase 0.4 of theTEXES observation. TheL′-band uniform disk diameters cal-culated with the HITEMP database and the PS97 line list are27.1 mas and 28.1 mas, respectively. While these predictedL′-band uniform disk diameters are also in agreement with theobserved one within the error of the measurement, it should benoted that theL′-band observations of Mennesson et al. (2002)were carried out at phase 0.81, which makes it difficult to com-pare the observed angular diameter with that predicted by thebest-fit model based on the TEXES spectrum obtained at phase0.4. Therefore, we can conclude that the near-infrared angu-lar diameters predicted by our model forχ Cyg are in roughagreement with those observed, while more rigorous tests arenecessary using contemporaneous interferometric observationsin the near-infrared and in the mid-infrared.
4. Discussion
Our two-layer model for the warm water vapor envelope aroundthree Mira variables can reproduce the observed increase ofthe angular diameter from the near-infrared to the 11µm re-gion and, simultaneously, the observed high-resolution 11µm
Fig. 17. Uniform disk diameters calculated from the best-fitmodel forχ Cyg in the 11µm region for a projected baselinelength of 30 m. The green solid line represents the result ob-tained with the HITEMP database, while the blue solid linerepresents the result with the PS97 line list. The bandpass usedby WHT03b is marked with the dashed lines. The range of thediameters measured in this bandpass is shown as the hatchedregion. The dotted line represents the photospheric angular di-ameter adopted in the calculation. The calculated uniform diskdiameters are blueshifted by 0.0658 cm−1 with respect to therest wavenumber, which corresponds to a radial velocity of−22 km s−1, to match the observed spectrum shown in Fig. 14.
spectra which appear to be featureless. It is obvious, however,that our ad hoc model is not a unique solution, and that physi-cal processes responsible for the formation of such warm watervapor layers also remain to be theoretically understood.
Intensity profiles predicted by dynamical model atmo-spheres for Mira variables exhibit structures consisting of twocomponents. Tej et al. (2003) show that the formation of H2Olayers behind shock fronts leads to intensity profiles consist-ing of a step-like structure close to the star and/or a tenuoushalo-like structure extending to a few stellar radii. The inten-sity profiles predicted by our models for the three Mira vari-ables studied here also show such a step-like structure and amore extended component, as can be seen in Fig. 4c. This im-plies the possibility that the large-amplitude pulsation in Miravariables is responsible for the warm molecular envelope inthese objects, and the next logical step would be to calculatesynthetic spectra as well as intensity profiles using dynamicalmodel atmospheres such as presented in Tej et al. (2003) andextensive H2O line lists.
Hinkle & Barnes (1979) analyzed H2O lines in high-resolution near-infrared spectra (4000–6700 cm−1) of R Leoand identified two distinct H2O layers, that is, a warm com-ponent with a temperature of∼1700 K and a cool compo-nent with a temperature of∼1100 K. This result seems to bein agreement with the temperatures of the H2O layers we ob-tained for R Leo in the present work. The H2O column densi-ties of the cool component derived by Hinkle & Barnes (1979)range from 1021–1022 cm−2, and these values also agree withthe 7× 1021 cm−2 we derived for the cool H2O layer. On theother hand, the H2O column densities of the warm compo-nent they derived are 1019–1020 cm−2, which are significantlysmaller than the 1× 1021 cm−2 derived here. Hinkle & Barnes(1979) also note that the H2O lines originating in the warm
14 K. Ohnaka: Warm water vapor envelope in Mira variables
component are never predominant compared to those originat-ing in the cool component, which shows a marked contrast toour result that the hot H2O layer contributes significantly in thespectrum as well as in the intensity profile. However, Hinkle& Barnes (1979) derived the H2O column densities at phases0.94, 0.00, 0.14, and 0.20, but not at phases between 0.5 and 0.9because of the blend of H2O lines originating in the two com-ponents. Since our model for R Leo is based on the TEXESspectrum obtained at phase 0.75, the above discrepancy of theH2O column density of the warm component might be due tothe mismatch in phase. Comparison with synthetic spectra us-ing dynamical model atmospheres would be necessary to derivephysical parameters such as excitation temperature and columndensity from the high-resolution spectra observed near mini-mum light which are severely affected by the blend of lines.
5. Concluding remarks
We have shown that our two-layer model for the warm wa-ter vapor envelope around the Mira variableso Cet, R Leo,andχ Cyg can reproduce the observed increase of the angu-lar diameter from the near-infrared to the 11µm region and,simultaneously, the observed high-resolution 11µm spectra.While a number of H2O pure rotation lines are present in thewavelength region observed with ISI and strong absorption canbe expected, the absorption lines are filled in by the emissionlines originating in the extended part of the water vapor en-velope, which leads to the featureless, continuum-like spectra.This filling-in effect masks the spectroscopic fingerprints of thewarm water vapor envelope, but its presence manifests itselfas an increase of the angular diameter from the near-infraredto the mid-infrared: invisible for spectrometers but not for in-terferometers. The radii, temperatures, and H2O column den-sities of the hot H2O layer in the three Mira variables stud-ied here are derived to be 1.5–1.7R⋆, 1800–2000 K, and (1–5) × 1021 cm−2, respectively. The cool H2O layer is found tohave temperatures of 1200–1400 K, extending to 2.2–2.5R⋆with H2O column densities of (1–7)× 1021 cm−2. Our modelswhich reproduce the spectra and angular diameters observedat11µm have turned out to also reproduce the spectra and the vis-ibilities as well as the angular diameters observed in the near-infrared. Comparison between the near-infrared angular sizespredicted foro Cet as well as for R Leo and those observedwith the Keck telescope suggests that the wavelength depen-dence of the angular size of Mira variables in the near-infraredlargely reflects the H2O opacity.
We have also found evidence for the presence of a largeamount of water vapor inχ Cyg near minimum light in the FTSspectra obtained in theK band as well as in the ISO/SWS spec-trum between 2.3 and 4.1µm. The observed H2O absorptionfeatures can be reasonably well reproduced by our water vaporenvelope model whose parameters are derived from the com-parison of the spectrum and the angular diameter observed at11 µm. While S-type Miras are known to exhibit significantlyweak spectral features due to oxygen-bearing molecules com-pared to oxygen-rich Miras, water vapor of an amount com-parable to that in oxygen-rich Miras is present inχ Cyg nearminimum light.
In order to test our model for the warm water vapor enve-lope further, contemporaneous spectroscopic and interferomet-ric observations are indispensable, given the variations of thespectra and the angular size not only with phase but also on atime scale longer than the variability period. ISI observationsusing many more bandpasses in the 11µm region and/or witheven higher spectral resolution would also be useful for thispurpose.
Acknowledgements. The author would like to thank Dr. M. Irelandfor kindly providing the result of the Keck observations ofo Cet andR Leo in electronic format, and Dr. J. Weiner for the information onthe dates of the TEXES observations of R Leo andχ Cyg. The authoris also indebted to Dr. T. Driebe and the referee Dr. D. D. S. Hale forvaluable and constructive comments.
References
Cami, J., Yamamura, I., de Jong, T., et al. 2000, A&A, 360, 562Chagnon, G., Mennesson, B., Perrin, G., et al. 2002, AJ, 124,2821Danchi, W. C., Bester, M., Degiacomi, C. G., Greenhill, L. J., &
Townes, C. H. 1994, AJ, 107, 1469Dyck, H. M., Zuckerman, B., Leinert Ch., & Beckwith, S. 1984,ApJ,
287, 801Hinkle, K. H., & Barnes, T. G. 1979, ApJ, 227, 923Ireland, M., Tuthill, P., Robertson, G., et al. 2004, In: Variable Stars
in the Local Group, eds. D. W. Kurtz & K. Pollard, ASP. Conf.Series, in press
Lacy, J. H., Richter, M. J., Greathouse, T. K., Jaffe, D. T., & Zhu, Q.2002, PASP, 114, 153
Lancon, A., & Wood, P. R. 2000, A&AS, 146, 217Lebzelter, T., Hinkle, K. H., & Aringer, B. 2001, A&A, 377, 617Matsuura, M., Yamamura, I., Cami, J., Onaka, T., & Murakami,H.
2002, A&A, 383, 972Mennesson, B., Perrin, G., Chagnon, G., et al. 2002, ApJ, 579, 446Monnier, J. D., Millan-Gabet, R., Tuthill, P. G., et al. 2004, ApJ, 605,
436Ohnaka, K. 2004, A&A, 421, 1149 (Paper I)Partridge, H., & Schwenke, D. W. 1997, J. Chem. Phys., 106, 4618Perrin, G., Coude du Foresto, V., Ridgway, S. T., et al. 1999, A&A,
345, 221Perrin, G., Ridgway, S. T., Coude du Foresto, V., et al. 2004, A&A,
418, 675Ridgway, S. T., Benson, J. A., Dyck, H. M., Townsley, L. K., &
Hermann, R. A. 1992, AJ, 104, 2224Rothman, L. S. 1997, HITEMP CD-ROM (Andover: ONTAR Co.)Rowan-Robinson, M., & Harris, S. 1983, MNRAS, 202, 767Ryde, N., Lambert, D. L., Richter, M. J., & Lacy, J. H. 2002, ApJ, 580,
447Schuller, P., Salome, P., Perrin, G., et al. 2004, A&A, 418,151Spinrad, H., & Vardya, M. S. 1966, ApJ, 146, 399Strecker, D. W., Erickson, E. F., & Witteborn, F. C. 1978, AJ,83, 26Tej, A., Lancon, A., & Scholz, M. 2003, A&A, 401, 347Tsuji, T. 1978, A&A, 68, L23Tsuji, T. 1986, A&A, 156, 8Tsuji, T. 1988, A&A, 197, 185Tsuji, T., Ohnaka K., Aoki, W., & Yamamura, I. 1997, A&A, 320,L1van Belle, G. T., Dyck, H. M., Benson, J. A., & Lacasse, M. G. 1996,
AJ, 112, 2147Vandenbussche, B., Beintema, D., de Graauw, T., et al. 2002,A&A,
390, 1033Wallace, L., & Hinkle, K. 1997, ApJS, 111, 445
K. Ohnaka: Warm water vapor envelope in Mira variables 15
Weiner, J., Danchi, W. C., Hale, D. D. S., et al. 2000, ApJ, 544, 1097(W00)
Weiner, J., Hale, D. D. S., & Townes, C. H. 2003a, ApJ 588, 1064(WHT03a)
Weiner, J., Hale, D. D. S., & Townes, C. H. 2003b, ApJ 589, 976(WHT03b)
Woodruff, C., Eberhardt, M., Driebe, T., et al. 2004, A&A, 421, 703Yamamura, I., de Jong, T., & Cami, J. 1999, A&A, 348, L55