Embed Size (px)
Citation preview

www.kelanicables.com
Kelani C
ables PLC
| Annual R
eport 2010/11
ContentsOur History 2
Financial Highlights 4
Chairman’s Review 6
Board of Directors 10
Senior and Middle Management Team 12
Operational Review 14
Product Portfolio 16
Corporate Social Responsibility 18
Human Resources 19
Risk Management 21
Corporate Governance 25
Audit Committee Report 29
Remuneration Committee Report 30
Report of The Directors 31
Directors’ Responsibility For Financial Reporting 33
Financial Information
Independent Auditors’ Report 37
Income Statement 38
Balance Sheet 39
Statement of Changes in Equity 40
Cash Flow Statement 41
Notes to the Financial Statements 42
Statement of Value Addition 65
Investor Information 66
Decade at a Glance 68
Glossary of Financial Terms 70
Notice of Meeting 71
Notes 72
Corporate Information Inner Back Cover
Name of the CompanyKelani Cables PLC
Company Registration NumberPQ 117
Legal FormA Public Quoted Company with Limited Liability, incorporated as Ceylon Non-Ferrous Metal Industries Limited on 27th January 1969. Thereafter on 18th December 1973 the name was changed to Kelani Cables Limited. With the adoption of the Companies Act No. 7 of 2007, re-registered as Kelani Cables PLC in February 2008.
Registered OfficeNo.60, Rodney Street, Colombo 08Tel: +94 11 7608300, 94 11 2695567Fax: +94 11 2667758
Principle Place of Business P.O. Box 14, Wewelduwa, KelaniyaTel: +94 11 2911224, 94 11 5399600Fax: +94 11 2910481
Board of DirectorsMr. U. G. MadanayakeMr. Suren MadanayakeMr. Hemantha Prerera – resigned with effect from 31st March 2011Mrs. N. C. MadanayakeDr. Bandula PereraDr. Ranjith Cabral
Company Secretaries Corporate Affairs (Private) LimitedNo: 24/2, Sri Siddhartha Road,Colombo 05
AuditorsKPMG Ford, Rhodes, Thornton & Co.,Chartered Accountants32A, Sir Mohamed Macan Markar MawathaP.O. Box 186Colombo 03
BankersHatton National Bank PLCHongkong and Shanghai Banking Corporation LimitedPeople’s BankStandard Chartered Bank
Corporate Websitewww.kelanicables.com
CORPORATE INFORMATION
Produced by Copyline (Pvt) Ltd Photography by Studio Times Digital Plates by Imageline (Pvt) Ltd Printed by Gunaratne Offset Ltd

Kelani Cables PLC | Annual Report 2010/111
Our VisionTo be “A House of Special Cables”
Our MissionDeliver optimum value to our stakeholders through product development, advanced technology, improved productivity and efficiency, while creating an open culture within the organisation to harness innovation and creativity
I t takes a lot to be recognised as a wor ld c lass
business. Hard work, out of the box th ink ing and
attent ion to va lue and deta i l are a l l factors that
ensure our p lace as that k ind of venture. One
that reaches beyond i tse l f to something greater,
hold ing i tse l f to a standard that is hard to match
by any other. Here at Kelani Cables, we are top of
the c lass; our dedicated team ensures i t and our
v is ion can only strengthen i t .
TOP OF THE CLASS
Kelani Cables PLC | Annual Report 2010/112
OUR HISTORYKelani Cables PLC is Sr i Lanka’s reputed
manufacturer and distr ibutor of power and
te lecommunicat ion cables and enamel led winding
wires. The company has mainta ined th is posi t ion
in the industry for over four decades.
Founded by the Wi jegoonawardena fami ly in 1969
with only 12 workers, i t has grown into a leading
cable manufactur ing company with a workforce
in excess of 400. The Company was l is ted
on the Colombo Stock Exchange as a publ ic
quoted company in 1973. In 1994 i t became a
subsid iary of the Austra l ian Mult i Nat ional Paci f ic
Dunlop Cables Group with a v iew to expand i ts
operat ions and share technica l knowledge. Dur ing
the per iod Company t ransformed and enhanced
i ts operat ions in many ways. In late 1999, ACL
Cables bought the shares held by Paci f ic Dunlop
Cables Group and became the major share holder.

Kelani Cables PLC | Annual Report 2010/113
System & Product Certifications and Awards
Year 1980• Kelani Cables’ obtained SLS 40 Product Certification
for its Building Wires & Flexible Cords. This was later evolved to SLS 733 & SLS 1143
Year 1986• Kelani Cables’ obtained SLS 750 Product Certification
for its All Aluminium Conductors
Year 1994• Kelani Cables’ obtained SLS 412 Product Certification
for its Auto Cables
Year 1999• Kelani Cables obtained ISO 9001 Quality Management
System Certification
Year 2004• Kelani Cables’ obtained UL certification for its
Enamelled Winding Wires from Underwriters Laboratories India
Year 2005• CNCI Achiever of Industrial Excellence -Silver Award• Sri Lanka National Quality Awards - under the Large
Scale Manufacturing Category - Merit Certificate• Taiki Akimoto 5S Award - All Island 2nd Runner Up• National Productivity Awards - 2nd Runner-up and
Provincial Productivity Awards - 2nd Runner-up
Year 2006• Sri Lanka National Quality Awards - manufacturing
category - Award Winner• CNCI Achiever of Industrial Excellence-Gold Award• Taiki Akimoto 5S Award - All Island 1st Runner Up• Business Excellence Awards -Processing,
Manufacturing & Industrial Engineering Sector - 2nd Runner Up
Year 2007• Taiki Akimoto 5S Awards Overall Gold award winner Gold award winner - Manufacturing sector• CNCI Achiever of Industrial Excellence - Gold Award• Business Excellence Awards Processing,
Manufacturing, Industrial Engineering - 2nd Runner Up• National Convention in Quality Circles - Seven trophies
received• LMD, the premier business magazine, rated Kelani
Cables as one of the most valuable brands• Awarded Business Superbrand status Voted one of
Sri Lanka’s strongest brands• Kelani brand was accredited with the Soorya Sinha
Logo
Year 2008• CNCI Achiever of Industrial Excellence - Crystal Award
for having won the Gold award for three consecutive years -2006, 2007 & 2008
Year 2010• National Safety Awards 2010 - Award winner in
Manufacturing and Processing Sector• National Engineering & Technology Exhibition 2010
- Silver Award for the stall with best display of local products.
• SLIM Brand Excellence 2010 - Award for the Best Entry Kit
• Annual Report Awards 2010 - Certificate of Compliance in Manufacturing Sector
Kelani Cables PLC | Annual Report 2010/114
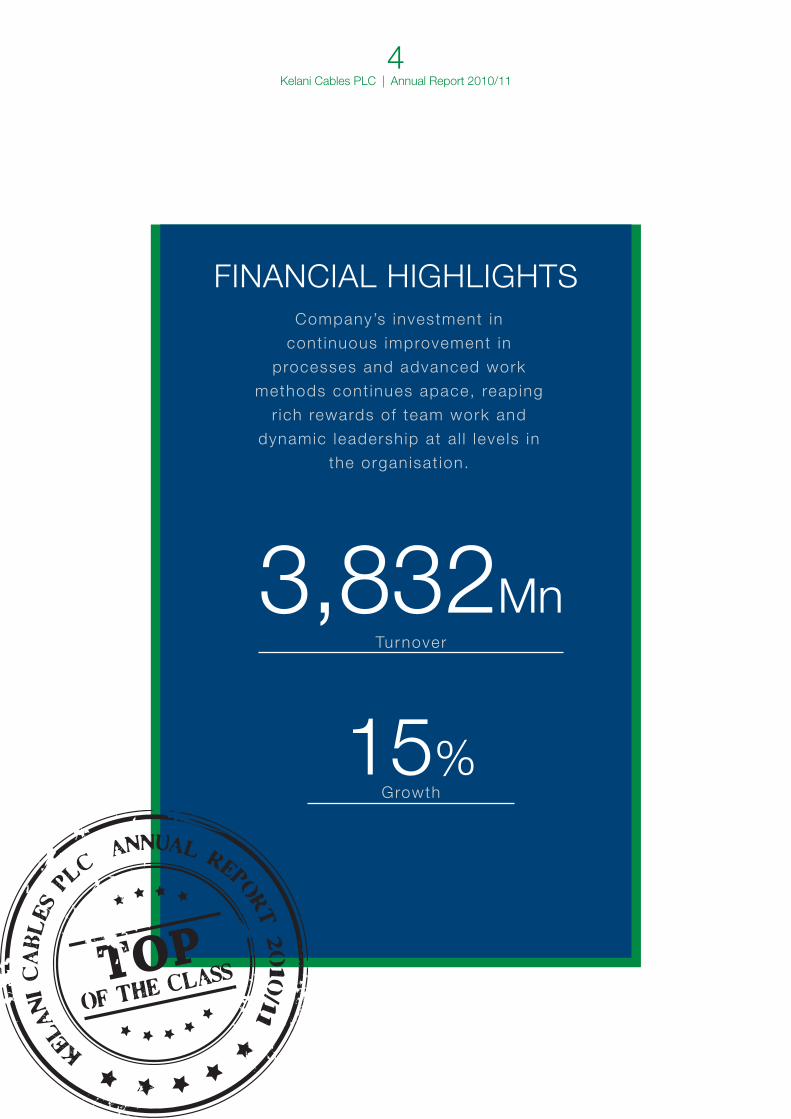
Company’s investment in
cont inuous improvement in
processes and advanced work
methods cont inues apace, reaping
r ich rewards of team work and
dynamic leadership at a l l leve ls in
the organisat ion.
FINANCIAL HIGHLIGHTS
Turnover
3,832Mn
Growth15%
Kelani Cables PLC | Annual Report 2010/115
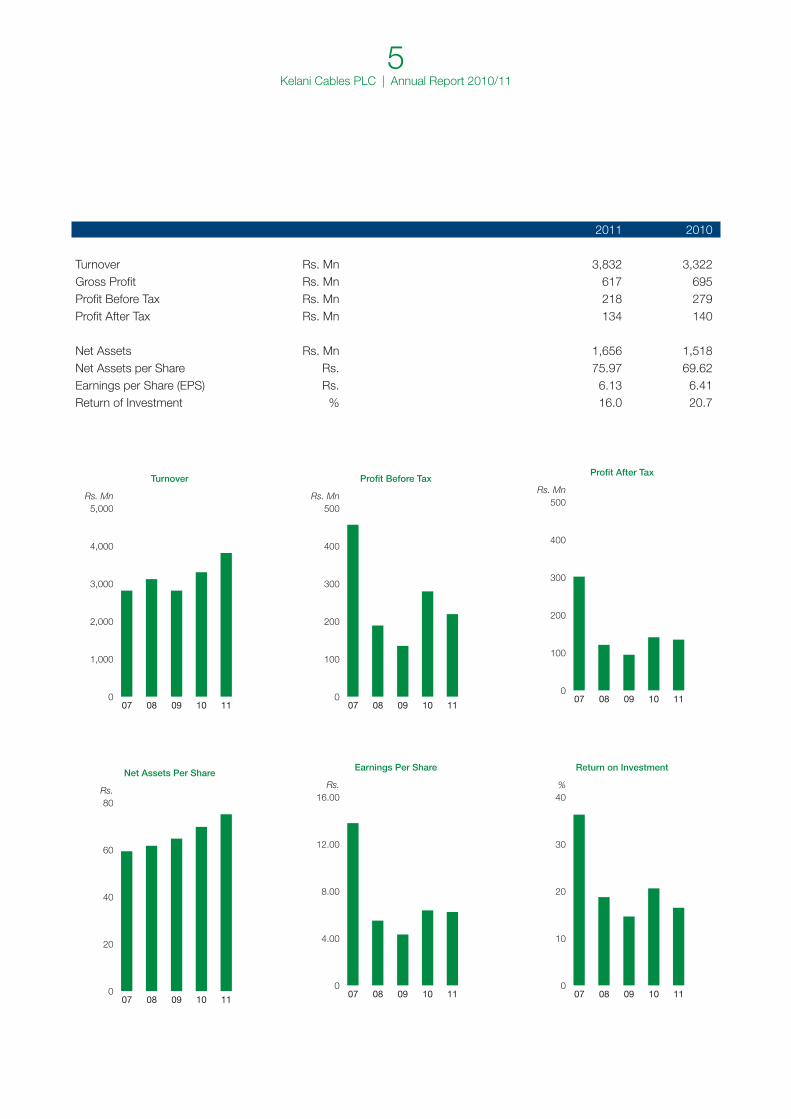
2011 2010
Turnover Rs. Mn 3,832 3,322Gross Profit Rs. Mn 617 695Profit Before Tax Rs. Mn 218 279Profit After Tax Rs. Mn 134 140 Net Assets Rs. Mn 1,656 1,518Net Assets per Share Rs. 75.97 69.62Earnings per Share (EPS) Rs. 6.13 6.41Return of Investment % 16.0 20.7
07 08 09 10 11
Rs. Mn
0
1,000
2,000
3,000
4,000
5,000
Turnover
07 08 09 10 11
Rs. Mn
0
100
200
300
400
500
Profit Before Tax
07 08 09 10 11
Rs. Mn
0
100
200
300
400
500
Profit After Tax
07 08 09 10 11
Rs.
0
20
40
60
80
Net Assets Per Share
07 08 09 10 11
Rs.
0
4.00
8.00
12.00
16.00
Earnings Per Share
07 08 09 10 11
%
0
10
20
30
40
Return on Investment
Kelani Cables PLC | Annual Report 2010/116
“Your Company was able to expand operat ions
in the North and East in tandem with rura l
development pro jects, thereby strengthening the
brand’s presence in these newly-opened regions.”
“For the year 2010/11, your Company posted a
Net Revenue of Rs. 3,832.2 Mn, which marks an
increase of 15.3% over the prev ious year.”
CHAIRMAN’S REVIEW
Upali MadanayakeChairman

Kelani Cables PLC | Annual Report 2010/117
It is with great pleasure that I place before you the Annual Report & Audited Accounts for 2011 on behalf of the Board of Directors of Kelani Cables PLC. The year under review witnessed notable improvements in the economy, following commendable growth in the first half of the year. The economy succeeded in sustaining this positive growth momentum through the rest of the year, providing a glimpse into its growth potential. It is indeed heartening to see the country engaged in large scale reconstruction and much-needed development projects following decades of conflict that succeeded in stifling the economy and deterred investments in enhancing the country’s infrastructure.
The positive economic trends were reflected in the industry, with the year under review witnessing increasing demand for electricity supply and thereby generating a clear demand for our products. The reconstruction of roads and highways in the North and East of the island, and other mega construction projects in other areas has created a further demand for cabling.
As regards the highly volatile LME prices, the prices for the period October 2010 to March 2011 were above USD 8,000 - much higher than the previous year. Cables industry is a fiercely competitive one and the year 2010 witnessed
Kelani Cables PLC | Annual Report 2010/118
acceleration in the level of competition, necessitating your Company to bring its sales, marketing and brand building expertise to the fore in a bid to stave off competition. Moreover, your Company was able to expand operations in the North and East in tandem with rural development projects, thereby strengthening the brand’s presence in these newly-opened regions.
Financial Performance
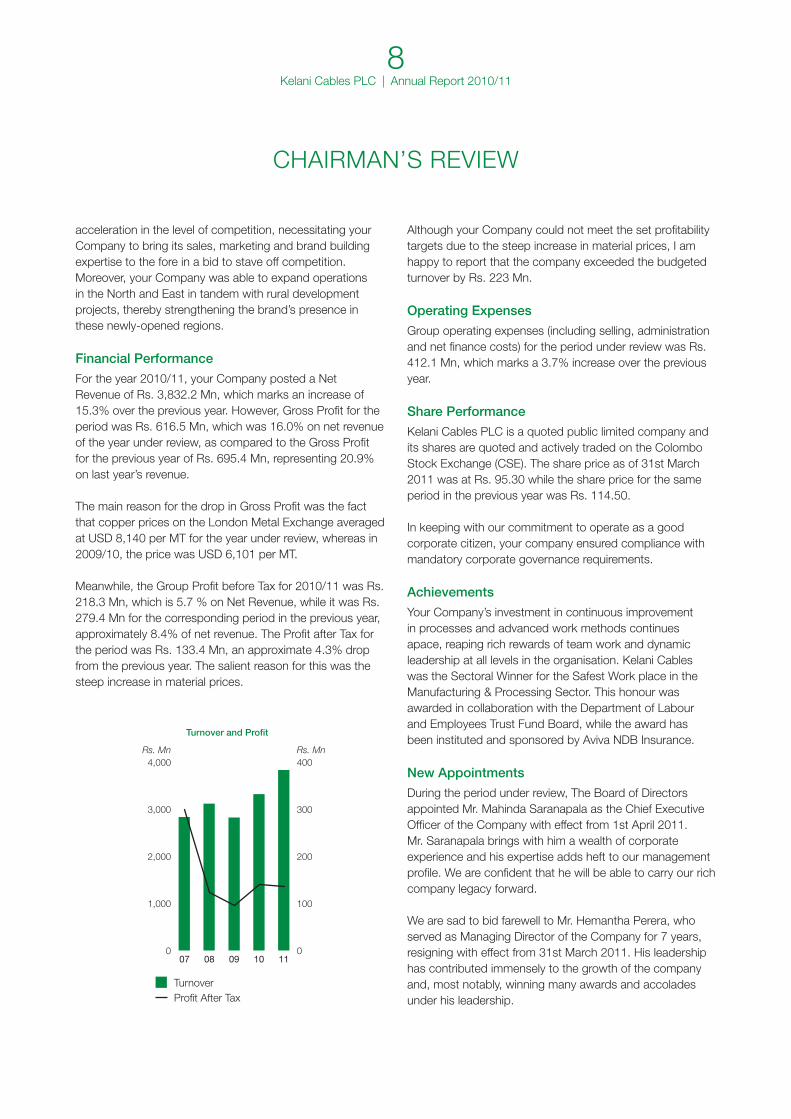
For the year 2010/11, your Company posted a Net Revenue of Rs. 3,832.2 Mn, which marks an increase of 15.3% over the previous year. However, Gross Profit for the period was Rs. 616.5 Mn, which was 16.0% on net revenue of the year under review, as compared to the Gross Profit for the previous year of Rs. 695.4 Mn, representing 20.9% on last year’s revenue.
The main reason for the drop in Gross Profit was the fact that copper prices on the London Metal Exchange averaged at USD 8,140 per MT for the year under review, whereas in 2009/10, the price was USD 6,101 per MT.
Meanwhile, the Group Profit before Tax for 2010/11 was Rs. 218.3 Mn, which is 5.7 % on Net Revenue, while it was Rs. 279.4 Mn for the corresponding period in the previous year, approximately 8.4% of net revenue. The Profit after Tax for the period was Rs. 133.4 Mn, an approximate 4.3% drop from the previous year. The salient reason for this was the steep increase in material prices.
Although your Company could not meet the set profitability targets due to the steep increase in material prices, I am happy to report that the company exceeded the budgeted turnover by Rs. 223 Mn.
Operating Expenses
Group operating expenses (including selling, administration and net finance costs) for the period under review was Rs. 412.1 Mn, which marks a 3.7% increase over the previous year.
Share Performance
Kelani Cables PLC is a quoted public limited company and its shares are quoted and actively traded on the Colombo Stock Exchange (CSE). The share price as of 31st March 2011 was at Rs. 95.30 while the share price for the same period in the previous year was Rs. 114.50.
In keeping with our commitment to operate as a good corporate citizen, your company ensured compliance with mandatory corporate governance requirements.
Achievements
Your Company’s investment in continuous improvement in processes and advanced work methods continues apace, reaping rich rewards of team work and dynamic leadership at all levels in the organisation. Kelani Cables was the Sectoral Winner for the Safest Work place in the Manufacturing & Processing Sector. This honour was awarded in collaboration with the Department of Labour and Employees Trust Fund Board, while the award has been instituted and sponsored by Aviva NDB Insurance.
New Appointments
During the period under review, The Board of Directors appointed Mr. Mahinda Saranapala as the Chief Executive Officer of the Company with effect from 1st April 2011. Mr. Saranapala brings with him a wealth of corporate experience and his expertise adds heft to our management profile. We are confident that he will be able to carry our rich company legacy forward.
We are sad to bid farewell to Mr. Hemantha Perera, who served as Managing Director of the Company for 7 years, resigning with effect from 31st March 2011. His leadership has contributed immensely to the growth of the company and, most notably, winning many awards and accolades under his leadership.
CHAIRMAN’S REVIEW
TurnoverProfit After Tax
Rs. Mn
0
100
200
300
400
07 08 09 10 11
Rs. Mn
0
1,000
2,000
3,000
4,000
Turnover and Profit
Kelani Cables PLC | Annual Report 2010/119
Future Outlook
Kelani Cables has set a clear strategic direction for the next three years and the entire company remains committed to work towards the goal of developing a ‘World-Class Company’. We envisage achieving our vision by leveraging on the four-pillar total change management strategy, building on the existing rock-solid fundamentals that we possess. Financial consolidation, discipline, sustainable profits and growth will be derived from all aspects of our operations, while our focus will be to harness the full potential of our most valued asset – our employees. As always, we will strive to make our employees an integral part of the change strategy and its implementation.
Acknowledgements
I wish to thank the Board of Directors for their continued support and guidance through the year, as also to the outgoing Managing Director, Mr. Hemantha Perera, and my fellow Directors. My deepest gratitude goes out to our valued customers, distributors, dealers, bankers, suppliers for their loyalty to the company. I would like to extend my appreciation to employees of Kelani Cables for their significant contribution during the financial year. On behalf of the Board of Directors I would like to express my heartfelt thanks to the shareholders for placing their faith in Kelani Cables.
Upali MadanayakeChairman
Colombo5th August 2011

BOARD OF DIRECTORS
10Kelani Cables PLC | Annual Report 2010/11
Mr. Upali Madanayake Mr. Suren Madanayake
Mr. Hemantha Perera Mrs. N.C. Madanayake
Dr. Bandula Perera Dr. Ranjith Cabral
Kelani Cables PLC | Annual Report 2010/1111
Mr. Upali Madanayake - ChairmanMr. Upali Madanayake graduated from the University of Cambridge, England, in 1958 and had his MA (Cantab.), conferred on him in 1962. He is a Barrister at Law (Lincoln’s Inn) and an Attorney at Law of the Supreme Court of Sri Lanka. He started his working life managing family owned plantations until most of these properties were taken over by the State under the Land Reform Law of 1972. He continues to take an active interest in agriculture.
Later, he was appointed to the Board of Associated Motorways Limited and subsequently became Deputy Chairman of the Company. He was appointed to the Board of ACL Cables Ltd in 1963, Managing Director of the Company in 1978, and Chairman/Managing Director in 1990. Presently he serves as the Chairman of ACL Cables PLC.
With the acquisition of Kelani Cables Limited by the ACL Group in 1999, he was appointed as Chairman of Kelani Cables and Lanka Olex Cables (Private) Ltd., which is the holding Company of Kelani Cables.
Mr. Madanayake is the Chairman of Fab Foods Pvt. Limited, Ceylon Tapioca Limited, ACL Plastics PLC, ACL Metals & Alloys (Pvt) Ltd., ACL Polymer (Pvt) Ltd., and ACL Kelani Magnet Wire (Private) Limited. He is a Director of Ceylon Bulbs & Electricals Ltd.
He has over forty years of experience in the cable industry.
Mr. Suren Madanayake - Deputy ChairmanMr. Suren Madanayake qualified as a Mechanical Engineer from the University of Texas, at Austin, USA. He was appointed to the Board of ACL Cables Ltd in 1991 and appointed as Managing Director in 2005. When ACL Group acquired Kelani Cables Limited, in 1999 he was appointed as Managing Director of Kelani Cables PLC and Lanka Olex Cables (Private) Ltd., which is the holding Company of Kelani Cables PLC. In 2003 he was appointed as Deputy Chairman of Kelani Cables PLC.
He also serves as the Managing Director of Ceylon Bulbs and Electricals Ltd., ACL Plastics PLC and Director of ACL Metals & Alloys (Pvt) Ltd, ACL Polymer (Pvt) Ltd , ACL Kelani Magnet Wire (Private) Ltd, Fab Foods Pvt Limited and Ceylon Tapioca Limited.
Mr. Hemantha Perera - Managing Director(resigned w.e.f. 31/03/2011)
Mr. Hemantha Perera holds a Masters degree in Business Administration from USA. He began his career in 1984 working for the John Keells Holdings Limited as a Trainee Executive in the Tea Department. Later he moved to Keells Aquariums, where he went on to become Director, Sales and Marketing.
Mr. Perera was appointed to the Board of Directors of ACL Cables Ltd and ACL Kelani Magnet Wire (Private) Limited in 2001. He was appointed to the Board of Kelani Cables as Managing Director in 2003. He is also a member of Sri Lanka Institute of Directors.
Mrs. N.C. Madanayake - DirectorMrs. Madanayake was appointed to the Board of Kelani Cables Limited in 1999. She is also a Director of ACL Cables PLC, ACL Plastics PLC, Ceylon Bulbs and Electricals Ltd., and Ceylon Tapioca Limited.
Mrs. Madanayake is a pioneering Director of Fab Foods Private Limited and now serves as Managing Director of the Company.
Dr. Bandula Perera - DirectorDr. Bandula Perera counts more than forty years of experience in both Public and Private sectors.
He is a former Chairman of SME Bank, former Board Member of Credit Information Bureau of Sri Lanka, former Managing Director of Ceylon Glass Company, former Additional Director General of Board of Investments, former Chairman of the Industrial Development Board, former General Manager of Lanka Tiles Ltd and a former Chairman of the Ceylon National Chamber of Industries among others.
Dr. Perera is currently the Deputy Chairman of the Public Utilities Commission of Sri Lanka, serves in the Boards of Piramal Glass (Ceylon) PLC, DRTV Products Ltd, Industrial Technology Institute and the National Science and Technology Commission.
Dr. Perera holds a PhD and a BSc (Hons) from UK and also holds a BSc (Ceylon) and is a Fellow of the Institute of Metals, Materials and Mining (UK).
Dr. Ranjith Cabral - DirectorDr. Ranjith Cabral is a former Chairman of Colombo Gas Company, Vice Chairman of Ceylon Electricity Board and has served in the Boards of Ceylon Petroleum Corporation, Industrial Development Board and Management of the University of Colombo School of Computing (UCSC). Also served as a Member of the Councils of Open University and University of Colombo and currently of the Board of Faculty of Science, Kelaniya University and member of the advisory Board of Department of Industrial Management at University of Kelaniya.
Dr. Cabral has held several Senior Management positions in both Public and Private sectors including Ceylon Ceramics Corporation, Bank of Ceylon,University Grants Commission, Sri Lanka Institute of Development & Administration and Unilever Ceylon Ltd.
Dr. Cabral is currently a Council Member designate of the South Asian Institute of Technology and Management of Sri Lanka (SAITM), Director of Renewable Energy Development Partners (Pvt) Ltd and Chairmen of Sikshana Educational Investment (Pvt) Ltd and Opinion Polls Survey (Private) Limited and a Senior Consultant to Graduate School of Management of Sri Lanka.
Dr. Cabral is a Science Graduate from University of Ceylon and holds a Doctorate in Behavioral Science from Brunel University,UK.
He was appointed to the Board of Kelani Cables PLC in March 2008.
SENIOR AND MIDDLEMANAGEMENT TEAM
Kelani Cables PLC | Annual Report 2010/1112
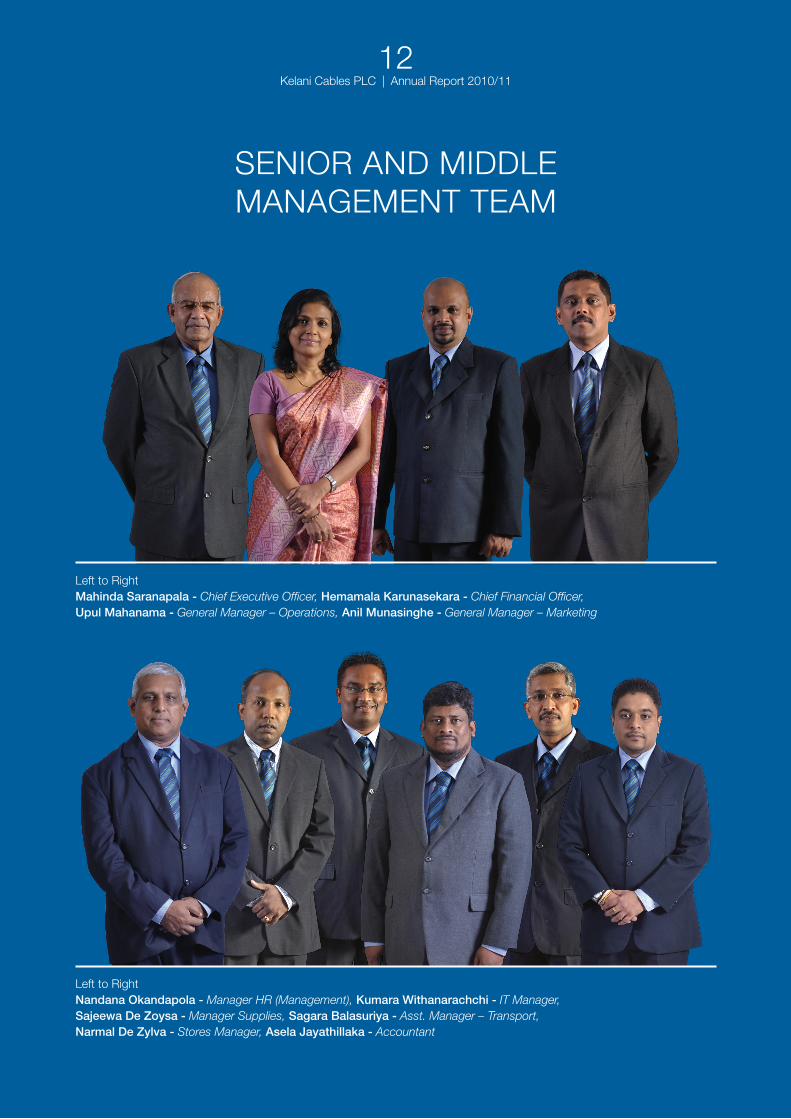
Left to RightMahinda Saranapala - Chief Executive Officer, Hemamala Karunasekara - Chief Financial Officer, Upul Mahanama - General Manager – Operations, Anil Munasinghe - General Manager – Marketing
Left to RightNandana Okandapola - Manager HR (Management), Kumara Withanarachchi - IT Manager, Sajeewa De Zoysa - Manager Supplies, Sagara Balasuriya - Asst. Manager – Transport, Narmal De Zylva - Stores Manager, Asela Jayathillaka - Accountant
Kelani Cables PLC | Annual Report 2010/1113
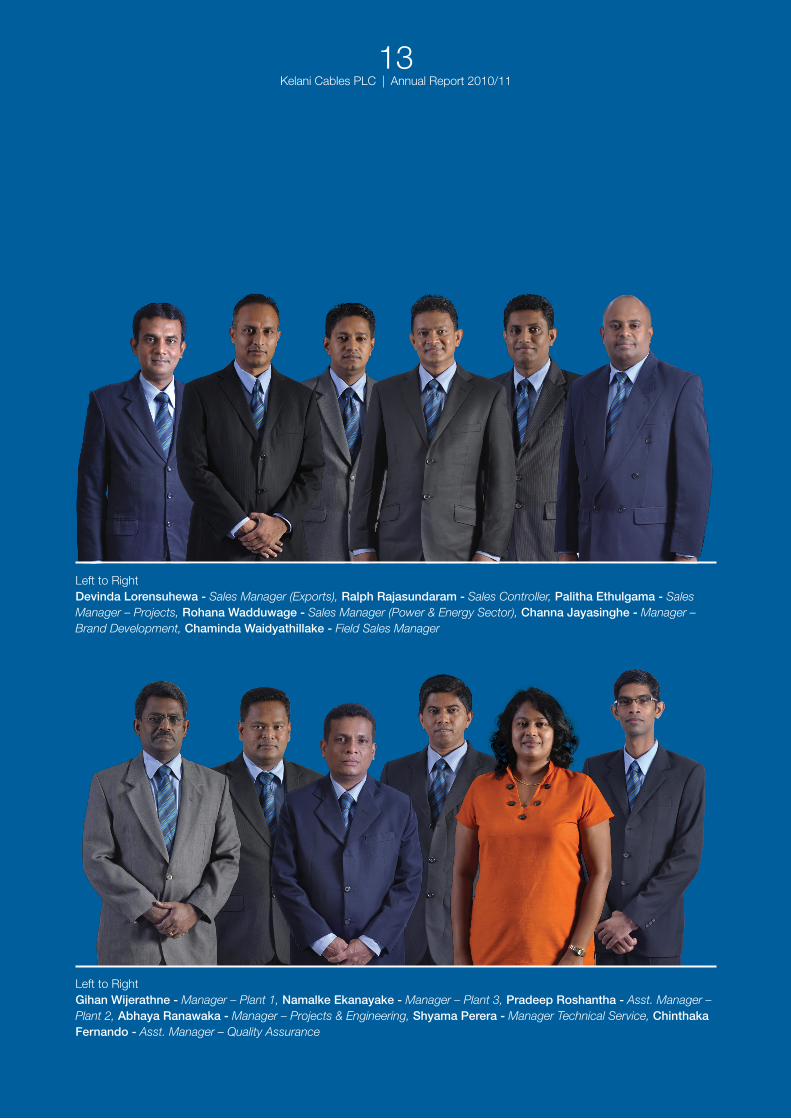
Left to RightDevinda Lorensuhewa - Sales Manager (Exports), Ralph Rajasundaram - Sales Controller, Palitha Ethulgama - Sales Manager – Projects, Rohana Wadduwage - Sales Manager (Power & Energy Sector), Channa Jayasinghe - Manager – Brand Development, Chaminda Waidyathillake - Field Sales Manager
Left to RightGihan Wijerathne - Manager – Plant 1, Namalke Ekanayake - Manager – Plant 3, Pradeep Roshantha - Asst. Manager – Plant 2, Abhaya Ranawaka - Manager – Projects & Engineering, Shyama Perera - Manager Technical Service, Chinthaka Fernando - Asst. Manager – Quality Assurance

Kelani Cables PLC | Annual Report 2010/1114
Business Overview and Marketing Strategy
The year in review was one which saw many changes especially in terms of the operating environment and after two decades of war we are now beginning to reap the benefits of peace.
Over the years, we have steadily built the Kelani Cables brand to be the household name in Sri Lanka it is today, and we continued our brand building activities throughout the year, to enhance brand equity. This was achieved through an integrated marketing campaign targeted at all key stakeholders.
Business Overview
In a nation which is enjoying long awaited freedom, many infrastructural projects are being implemented and this has resulted in steady growth in the power and energy sector amongst others.
Your company continued to ride on this growth curve, through expansions in production and distribution targeting the whole country, especially the North and East as well participating in numerous rural development projects. This strategy proved beneficial to the company, and helped us achieve significant growth both in revenue and profits.
In order to maintain the growth momentum special products were developed to cater to new market segments, while servicing the needs of existing segments with present products. This has resulted in our product portfolio showing greater depth and has helped your company in achieving a balanced contribution in terms of its product range.
Competitors continued to be active during the year and adopted low pricing strategies such as discounts etc. Our strategy was to compete on value rather than cost, and offer our customers and consumers a value proposition in terms of quality, service and trust.
Your company continued to build relationships with all stakeholders based on a win-win formula. We are confident that these relationships will enable your company to face the future with confidence.
Marketing Strategy
We continued to be a powerful force in the power and energy sector, based on our Kelani brand strength and over 40 years of experience in the industry. The Kelani brand is synonymous with safety at all times and at all locations.
Market Segments
We target 4 main segments.i. Dealer Segment This segment has grown exponentially and contributed
significantly to the growth of the company. A well developed distribution network is in place supported by a Field Sales Manager, eight Area Sales Managers, and forty Sales Promotion Officers. The Distribution strategy was to ensure 100% availability of our products Island wide and this strategy has delivered the desired results.
ii. Project Segment The governments drive in infrastructure development
has created a healthy knock on effect for this segment of our business and has resulted in us recording a healthy growth in this segment through efficient operational processes, excellent service and relationship building.
We looked further into improving our delivery times in terms of service and in order to provide faster and quicker service, we strengthened our project team further with qualified engineers and experienced sales executives.
iii. Export Segment Another area of business where much effort was
focused was in expanding our export market and we strived hard towards building on our existing lucrative markets and looking into new markets. During the year under review we have consolidated our position in the Maldives and exported products to several other markets. We are exploring further market opportunities in the African continent, Middle East and SAARC regions, which we are confident, will deliver results in the years to come.
iv. Power & Energy Segment Given the rapid electrification in the country, a new
segment was created in order to cater to the specific needs of this segment. A dedicated team is already in place to achieve the required sales volumes.
OPERATIONAL REVIEW
Kelani Cables PLC | Annual Report 2010/1115
New Products
Innovation and new product development are “watchwords” at Kelani and a key driving force of your company’s activities. Aerial Bundled Cables which was launched in 2009/2010 has recorded success and in the year under review we have launched several new products, namely Iron Cables, Rosette Cables, Boat Cables and Speaker Cables. Many new products are in the pipeline and will deliver incremental growth in the years, to come.
Brand Building
During the year under review, your company invested significantly in building the Kelani brand as a household name in Sri Lanka. A combination of above-the-line and below-the-line promotional campaigns were conducted throughout the year.
The external visibility of the brand has been dramatically improved, specially in the North and East. A significant branding exercise was carried out at the Nagadeepa Temple with the objective of educating pilgrims on proper behavior and safety. This is in line with the positioning of the company and product brand; which is safety at all times. The strength of the brand was further epitomised by the ranking received in a study conducted by LMD in 2010.

Kelani Cables PLC | Annual Report 2010/1116
PRODUCT PORTFOLIO
Bare Conductors All Aluminium Conductors (AAC) and Aluminium Conductors Steel Reinforced (ACSR), up to 400mm2 manufactured to BS 215 and ASTM.
Armoured and Unarmoured Power CablesCopper conductors with PVC or XLPE insulated steel wire armoured and PVC sheathed designated as armoured cables. Copper conductors with PVC or XLPE insulated and PVC sheathed designated as unarmoured cables. Manufactured to BS 6346 and 5467 to a voltage rating of 600/1000V.
Kelani Lead Free Submersible Pump CablesKelani Submersible Pump Cables are manufactured with lead free PVC compound which is resistant to water, oil and moisture. High flexibility is guaranteed and manufactured to BS and IS standards.
Auto CablesFlexible copper conductors with PVC insulation. Manufactured to SLS 412 to a voltage range of 100V.
House & Building WiresCopper conductors with PVC insulated and sheathed. Manufactured to BS 6004 to a voltage ratings of 450/750V and 300/500V.
Kelani Welding CablesHigh conductivity bare copper flexible conductors, with a covering that consists of two layers with specially developed flexible Elastomer, meeting the requirements of IS 9857. Outer layer is Black or Orange.
TV Down Leads/ RG SeriesAnnealed copper conductors with polyethylene insulated and copper braided and PVC sheathed Co-axial & RG cables, manufactured to JIS, MIL & BELDON standards. Categories are, 3C-2V, 5C-2V, RG 6, RG 11A/U, RG 58B/U, RG 59B/U and RG 213/U.
Control CablesMultiple conductor cable with PVC insulated and PVC sheathed. Number of cores range from 5 to 48. Manufactured to BS 6346 to a voltage rating of 600/1000V. The cables can be armoured or unarmoured and either screened or unscreened.

Kelani Cables PLC | Annual Report 2010/1117
Telephone CablesPlain annealed copper conductors, PE insulated and PVC sheathed. Manufactured from single pair to 25 pair.
Iron CablesHigh quality nylon braided flexible cords for electronic irons & such applications. It is specially designed with an inner cover to avoid damages to insulation cores. The cotton braiding and the insulation are special heat resistant type materials.
Kelani Enamelled Winding WiresEnamelled winding wire manufactured to IEC standards. The Company holds the prestigious UL Certification for the Dual Coated Enamelled winding wires (Keldual & Kelduale).
Flexible CordsFlexible cords with Class V copper conductors and PVC insulated twisted twin, parallel twin & PVC insulated & sheathed circular multi core cables. Manufactured to BS 6500 to a voltage rating of 300/500V.
Instrumentation CablesAnnealed copper conductors with PVC insulated, copper braided and PVC sheathed in two core, three core & four core. Manufactured to BS 6500.
Rosette Telephone CablePlain annealed Copper conductors, PE insulated and PVC sheathed Rosette cables 4 core flat cables).
Speaker CableFlexible Tinned Copper conductor with special transparent PVC insulation available in several sizes such as AWG 10,AWG 12 ,AWG16,AWG18 &AWG 20. Speaker Cables are used for speaker applications in home theatre or audio systems.
Ariel Bundled Conductor (ABC) CablesAluminium compacted conductors with XLPE insulation with or without messenger neutral core; manufactured to NF C 33-209 to a voltage rating of 600/1000. ABC is mainly used for secondary overhead lines on poles.

Kelani Cables PLC | Annual Report 2010/1118
For the forth consecutive year our unique CSR initiative “Kelani Saviya” set up to promote professionalism in the Electricians’ occupation was conducted under the patronage of Vice Chancellor, University of Peradeniya, Prof. S.B.S. Abeykoon one of the key founders of the programme. During the year under review the fourth batch was commenced with 73 students. The key objective of this programme is to persuade youth to achieve high standards in their chosen vocation as electricians and gain social recognition as well as better career stability and prospects. Set up in 2007, the course registered 149 students from across the island to date, with over 50 achieving the required goals and completing the all three levels to obtain full qualification.
Apart from the above our technical service engineers host knowledge sharing seminars for Engineers from the Ceylon Electricity Board as well as students from technical colleges.
Kelani Electricians Club –our pioneering effort towards raising the standards of electricians, both professionally and socially, completed another successful year conducting 11 seminars throughout the country with over 100 participants attending each. These covered the areas of usage, safety and conservation of electricity, and our “Free technical advice service” to house holders, electricians and also to contractors.
The company has awarded 33 scholarships to children of electricians who have successfully completed the year 5 scholarship, in keeping with the Club’s objective of raising the profile of electricians and helping to uplift their social standing. The insurance scheme for electricians is also continued for another year and claims are coordinated to support and provide assurance to their families.
To strengthen the bond between motor winders and the company we continue to provide empowerment and support through various activities.
As part of community welfare activities of the year we constructed toilet facilities at the Kelaniya Kovil premises, continued our annual alms giving to Victoria Home, provision of dry rations to flood victims in Eastern Region in January 2011, donation to Ridhi Viharaya Perahera Fund and also a contribution to St. Anthonys Church Boralesgamuwa.
Kelani Cables PLC has initiated many cleaner production aspects as it plans to obtain ISO 14001 certification in the coming months.
CORPORATE SOCIAL RESPONSIBILITY

Kelani Cables PLC | Annual Report 2010/1119
Our Backbone
Winning through human resources has been the backbone of Kelani Cable’s success. We recognise that our success in performance is mainly due to our highly motivated and committed staff; and it is their spirit that drives Kelani Cables to success. Every employee is treated with equal consideration and the company has created a culture where all employees feel valued, respected and supported; and, employees are given the opportunity to excel in their careers and reach their full potential.
Investing in our Staff
During the year under review, training and development was focused at all levels to meet changing business needs. Through the training needs identified and derived from the annual appraisal system, customised and specialist programs relating to personality development, managerial competency development and technical competency development were conducted. In addition, customer service and presentation skills programmes were conducted to upgrade the skills of our island wide sales team.
HR Information System
The ongoing implementation of the HR information system to integrate the workflow, achieved, yet another mile stone this year by successfully implementing the ‘Employee Dynamics’ module. This module has been instrumental in increasing operational efficiency.
All Inclusive Management
The joint consultative council was set up in 2003 to focus on building employee relations. This initiative has delivered rewards since its inception enabling the company to enhance quality and productivity whilst promoting an energised and inspired workforce. Open interactive forums with representation from all levels of employees has encouraged participatory management and created a harmonious and friendly culture not to mention sustained transparency.
Caring for Our Employees
Continuing to build on staff relations, the welfare Society organised a fun filled day out for all employees at Pegasus Reef Hotel. The much awaited Sinhala & Hindu New Year celebrations and Christmas Party, which are well patronised by all employees including their families, were celebrated this year with games, entertainment and distribution of gifts. The annual fund raising event organised by the Kelani Welfare Society, supports a series of welfare activities including renovation of houses of needy employees, donation of funds to employees in instances of critical illnesses and providing financial support to employees children for further education. Further, children of employees who excel at the GCE Ordinary Level and Advanced Level Examinations and gain entry to the university were awarded scholarships.
This year the Company took a decision to extend its recognition programmes further, to include employee’s children by unveiling the Kelani Talent Star Award. This was organised by the Human Resources Division and the award recognised the outstanding talent of employee’s children from ages 3 to 14 in the categories of Art, Handwork, Language and General Knowledge. Children were given an opportunity to see the Kelani production process and the awards day concluded with a grand award ceremony.
Future Outlook
Over the years, human resources initiatives taken have been instrumental in building and sustaining a great team of employees who are ready to act on today’s opportunities for a better tomorrow. We will continue to adopt focused human resources strategies that satisfy the needs of employees whilst achieving company objectives.
HUMAN RESOURCES

Kelani Cables PLC | Annual Report 2010/1120
HUMAN RESOURCES
New Year Celebration 2010
Singithi Awurudu Kumariya 2010
Kelani Talent Star 2010 - Art & Hand Work Exhibition
Employee’s Day 2010 at Pegasuss Reef Hotel Wattala
Kelani Talent Star 2010-General Knowledge Competition
Joint Consultative Committee - 2011
Time & Task Management Training
Kelani Talent Star 2010 - Factory Visit
Kelani Cables PLC | Annual Report 2010/1121
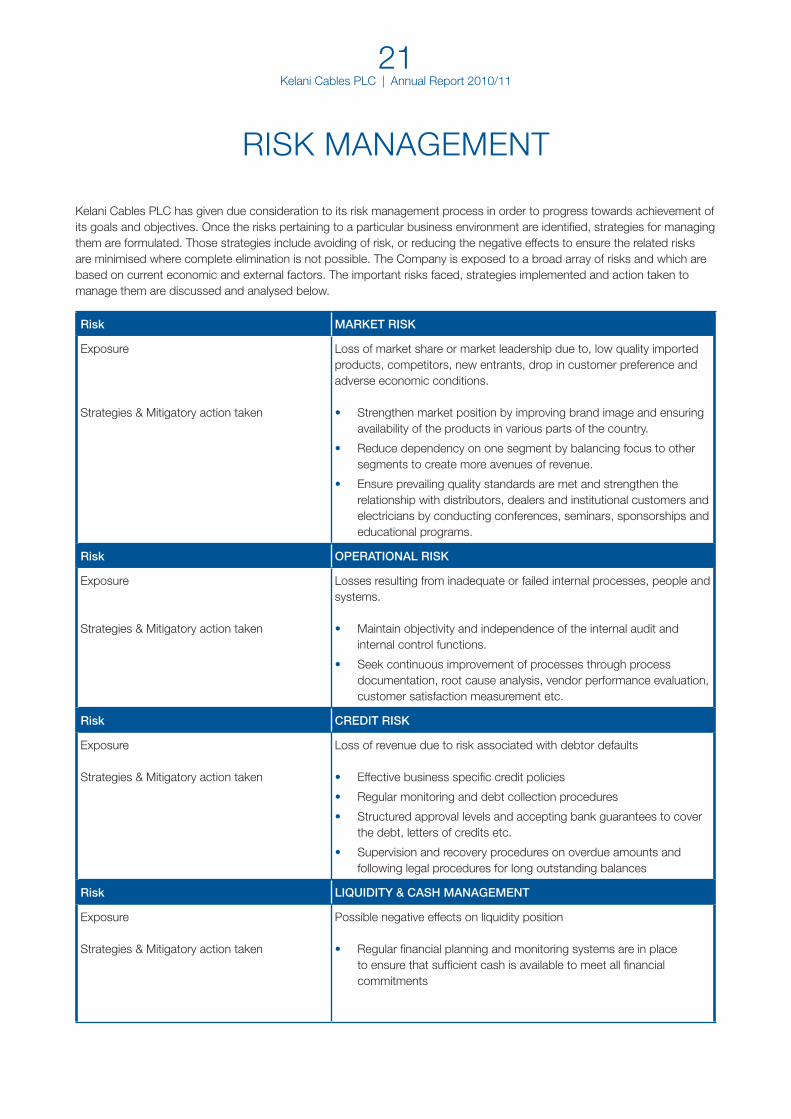
Kelani Cables PLC has given due consideration to its risk management process in order to progress towards achievement of its goals and objectives. Once the risks pertaining to a particular business environment are identified, strategies for managing them are formulated. Those strategies include avoiding of risk, or reducing the negative effects to ensure the related risks are minimised where complete elimination is not possible. The Company is exposed to a broad array of risks and which are based on current economic and external factors. The important risks faced, strategies implemented and action taken to manage them are discussed and analysed below.
Risk MARKET RISK
Exposure
Strategies & Mitigatory action taken
Loss of market share or market leadership due to, low quality imported products, competitors, new entrants, drop in customer preference and adverse economic conditions.
• Strengthen market position by improving brand image and ensuring availability of the products in various parts of the country.
• Reduce dependency on one segment by balancing focus to other segments to create more avenues of revenue.
• Ensure prevailing quality standards are met and strengthen the relationship with distributors, dealers and institutional customers and electricians by conducting conferences, seminars, sponsorships and educational programs.
Risk OPERATIONAL RISK
Exposure
Strategies & Mitigatory action taken
Losses resulting from inadequate or failed internal processes, people and systems.
• Maintain objectivity and independence of the internal audit and internal control functions.
• Seek continuous improvement of processes through process documentation, root cause analysis, vendor performance evaluation, customer satisfaction measurement etc.
Risk CREDIT RISK
Exposure
Strategies & Mitigatory action taken
Loss of revenue due to risk associated with debtor defaults
• Effective business specific credit policies
• Regular monitoring and debt collection procedures
• Structured approval levels and accepting bank guarantees to cover the debt, letters of credits etc.
• Supervision and recovery procedures on overdue amounts and following legal procedures for long outstanding balances
Risk LIQUIDITY & CASH MANAGEMENT
Exposure
Strategies & Mitigatory action taken
Possible negative effects on liquidity position
• Regular financial planning and monitoring systems are in place to ensure that sufficient cash is available to meet all financial commitments
RISK MANAGEMENT

Kelani Cables PLC | Annual Report 2010/1122
Risk INTEREST RATE RISK
Exposure
Strategies & Mitigatory action taken
Adverse effects of interest rate volatility
• Negotiate and take supplier credit to mitigate the loss due to adverse fluctuations in local interest rates
• The Company has sufficient assets to offer as collateral for future funding requirements to avoid adverse fluctuations
Risk CURRENCY RISK
Exposure
Strategies & Mitigatory action taken
Fluctuations in foreign currency rates of foreign currency receipts and payments.
• Use foreign currency receipts to settle payments denominated in same currency
Risk ASSET RISK
Exposure
Strategies & Mitigatory action taken
Potential losses that may be caused due to machine breakdowns and damages from fire or theft
• Obtain comprehensive insurance covers for plant and machinery
• Carry out planned preventive maintenance programs at regular intervals
• Maintain firefighting equipment within standards
• Upkeep security precautionary systems
Risk HUMAN RESOURCE
Exposure
Strategies & Mitigatory action taken
Risk arising from inability to attract and retain skilled and experienced staff, drop in productivity and quality and increase in human errors
• Strengthen employer employee relationship
• Develop a highly loyal workforce and build long term commitment through continuous training and development, career planning and performance based reward systems
• Ensure adaptability through training and adopting best practices
• Ensure compensation is aligned with market values.
• Maintain a healthy and cordial relationship with employees at all levels through joint consultative committees
RISK MANAGEMENT
Kelani Cables PLC | Annual Report 2010/1123
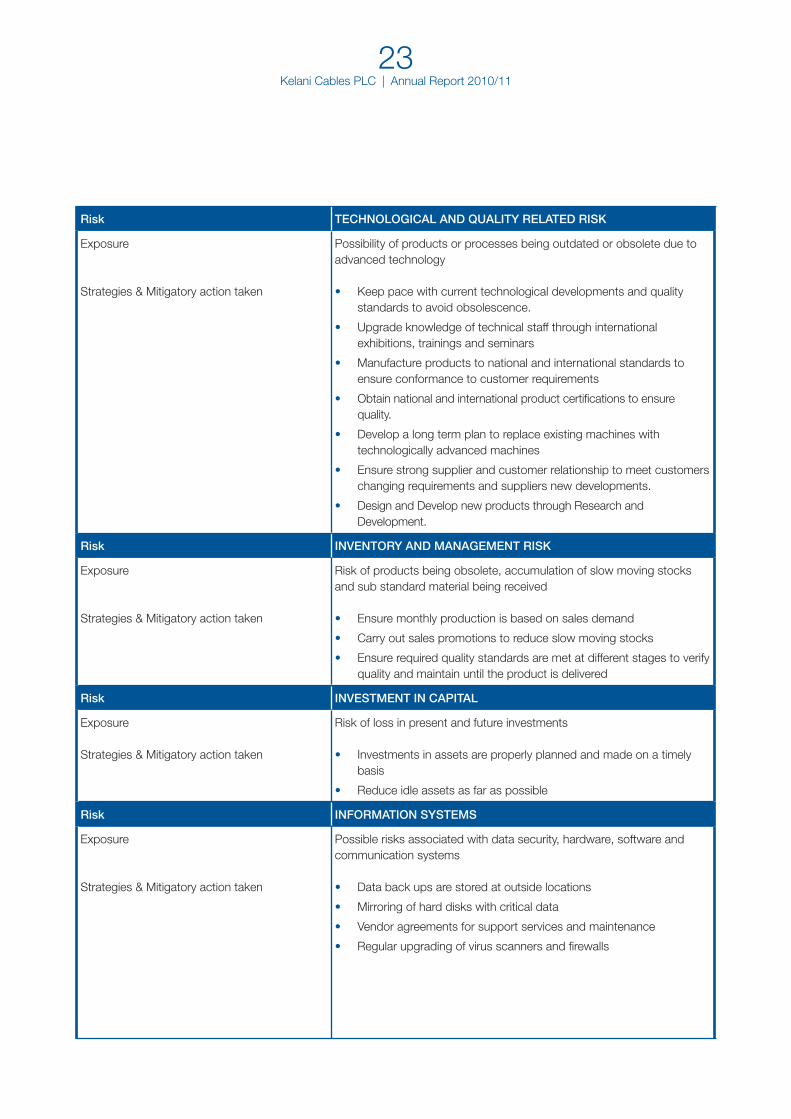
Risk TECHNOLOGICAL AND QUALITY RELATED RISK
Exposure
Strategies & Mitigatory action taken
Possibility of products or processes being outdated or obsolete due to advanced technology
• Keep pace with current technological developments and quality standards to avoid obsolescence.
• Upgrade knowledge of technical staff through international exhibitions, trainings and seminars
• Manufacture products to national and international standards to ensure conformance to customer requirements
• Obtain national and international product certifications to ensure quality.
• Develop a long term plan to replace existing machines with technologically advanced machines
• Ensure strong supplier and customer relationship to meet customers changing requirements and suppliers new developments.
• Design and Develop new products through Research and Development.
Risk INVENTORY AND MANAGEMENT RISK
Exposure
Strategies & Mitigatory action taken
Risk of products being obsolete, accumulation of slow moving stocks and sub standard material being received
• Ensure monthly production is based on sales demand
• Carry out sales promotions to reduce slow moving stocks
• Ensure required quality standards are met at different stages to verify quality and maintain until the product is delivered
Risk INVESTMENT IN CAPITAL
Exposure
Strategies & Mitigatory action taken
Risk of loss in present and future investments
• Investments in assets are properly planned and made on a timely basis
• Reduce idle assets as far as possible
Risk INFORMATION SYSTEMS
Exposure
Strategies & Mitigatory action taken
Possible risks associated with data security, hardware, software and communication systems
• Data back ups are stored at outside locations
• Mirroring of hard disks with critical data
• Vendor agreements for support services and maintenance
• Regular upgrading of virus scanners and firewalls
Kelani Cables PLC | Annual Report 2010/1124
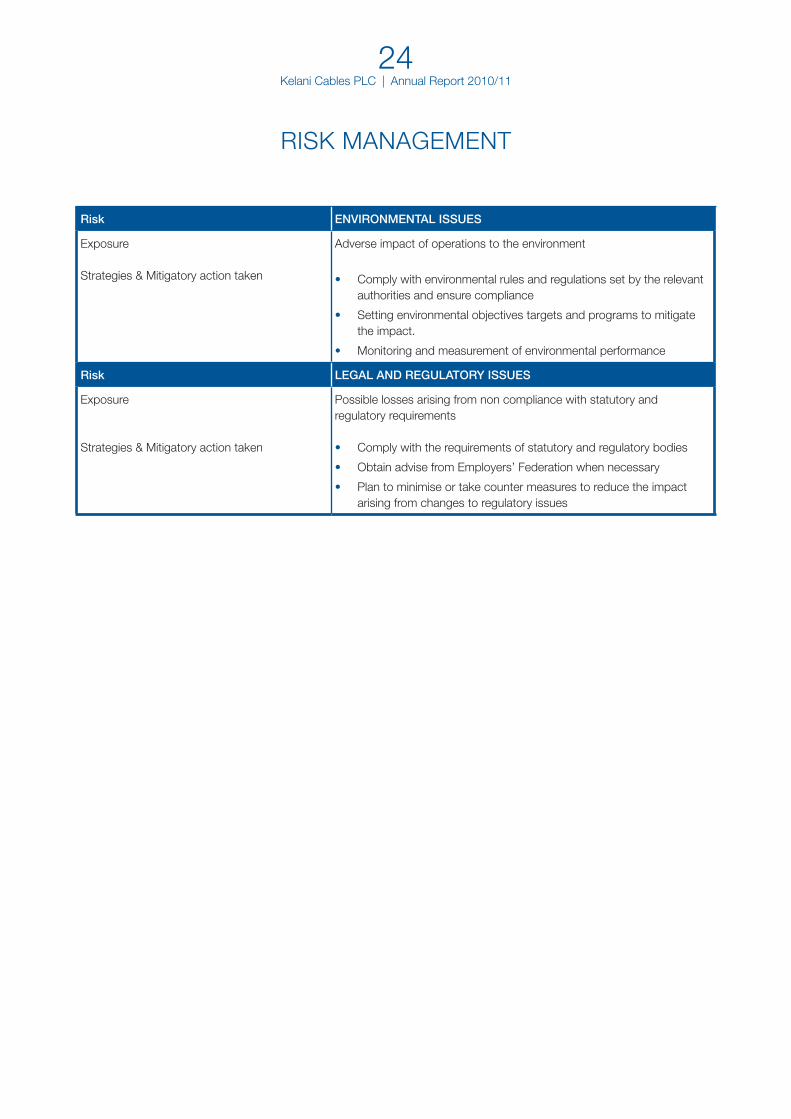
Risk ENVIRONMENTAL ISSUES
Exposure
Strategies & Mitigatory action taken
Adverse impact of operations to the environment
• Comply with environmental rules and regulations set by the relevant authorities and ensure compliance
• Setting environmental objectives targets and programs to mitigate the impact.
• Monitoring and measurement of environmental performance
Risk LEGAL AND REGULATORY ISSUES
Exposure
Strategies & Mitigatory action taken
Possible losses arising from non compliance with statutory and regulatory requirements
• Comply with the requirements of statutory and regulatory bodies
• Obtain advise from Employers’ Federation when necessary
• Plan to minimise or take counter measures to reduce the impact arising from changes to regulatory issues
RISK MANAGEMENT
Kelani Cables PLC | Annual Report 2010/1125
The Board of Directors of Kelani Cables PLC is committed and takes responsibility to maintain highest standards of Corporate Governance. The Company complies with the rules on Corporate Governance, included in the Listing Rules of the Colombo Stock Exchange, and is guided by the principles included in the Code of Best Practices on Corporate Governance issued jointly by the Securities and Exchange Commission of Sri Lanka and the Institute of Chartered Accountants of Sri Lanka. Corporate Governance principles are complied with by the Company is given below.
Board of Directors
Composition of the Board and Attendance at Board Meetings
The Board consisted of six Directors as at 31st March 2011 of whom five are Non-executive Directors. The names and profiles of the Directors are given on pages 10 to 11 of this Report. They possess the skills experience and knowledge to set the directions and oversee the operations of the Company. Mr. Hemantha Perera, Managing Director of the Company resigned from the Board of Directors with effect from 31st March 2011.
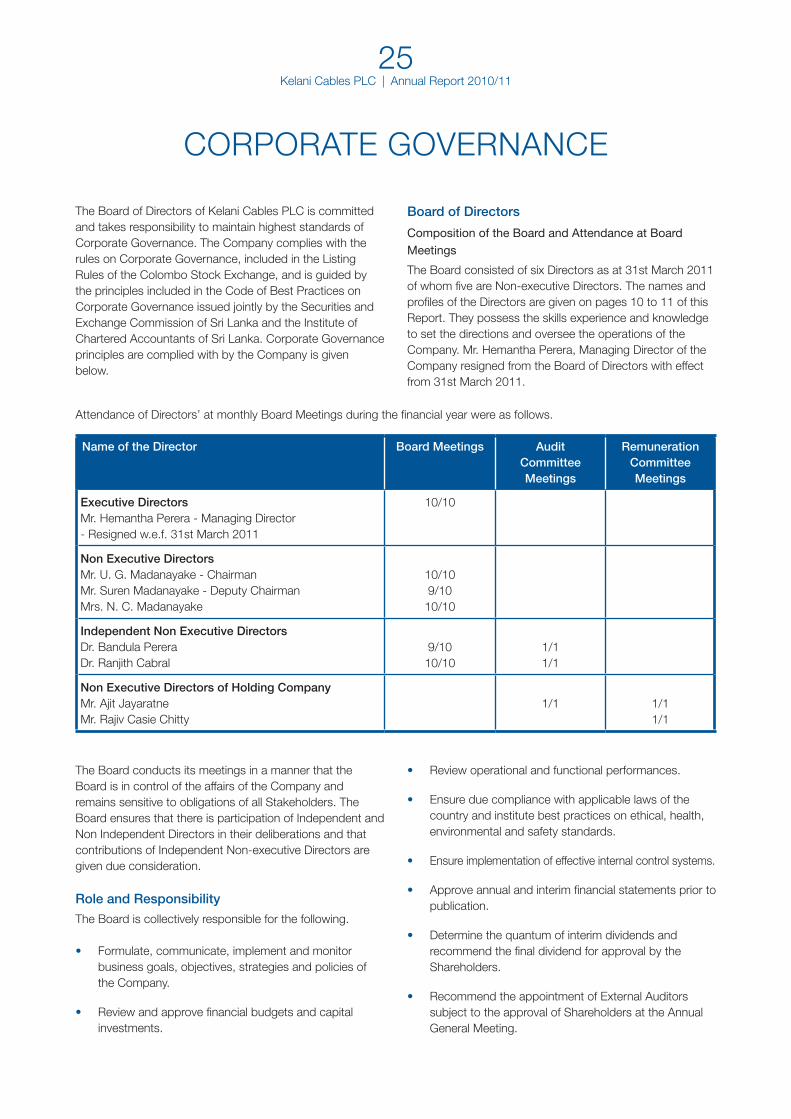
Attendance of Directors’ at monthly Board Meetings during the financial year were as follows.
Name of the Director Board Meetings AuditCommitteeMeetings
RemunerationCommitteeMeetings
Executive DirectorsMr. Hemantha Perera - Managing Director- Resigned w.e.f. 31st March 2011
10/10
Non Executive DirectorsMr. U. G. Madanayake - ChairmanMr. Suren Madanayake - Deputy ChairmanMrs. N. C. Madanayake
10/109/10
10/10
Independent Non Executive DirectorsDr. Bandula PereraDr. Ranjith Cabral
9/1010/10
1/11/1
Non Executive Directors of Holding CompanyMr. Ajit JayaratneMr. Rajiv Casie Chitty
1/1 1/11/1
The Board conducts its meetings in a manner that the Board is in control of the affairs of the Company and remains sensitive to obligations of all Stakeholders. The Board ensures that there is participation of Independent and Non Independent Directors in their deliberations and that contributions of Independent Non-executive Directors are given due consideration.
Role and Responsibility
The Board is collectively responsible for the following.
• Formulate, communicate, implement and monitor business goals, objectives, strategies and policies of the Company.
• Review and approve financial budgets and capital investments.
• Review operational and functional performances.
• Ensure due compliance with applicable laws of the country and institute best practices on ethical, health, environmental and safety standards.
• Ensure implementation of effective internal control systems.
• Approve annual and interim financial statements prior to publication.
• Determine the quantum of interim dividends and recommend the final dividend for approval by the Shareholders.
• Recommend the appointment of External Auditors subject to the approval of Shareholders at the Annual General Meeting.
CORPORATE GOVERNANCE
Kelani Cables PLC | Annual Report 2010/1126
Board Committees
The Board is assisted in fulfilling its responsibilities by two Committees which have been appointed by the Board. They are the Remuneration Committee and the Audit Committee, composition of which are given below.
Remuneration Committee
The remuneration of the Executive Director is decided by the Remuneration Committee of the Listed Parent Company. This committee consists of two Non-executive Directors of the Listed Parent Company-ACL Cables PLC, Mr. Ajit M. De. S. Jayaratne (Chairman of the Committee) and Mr. Rajiv Casie Chitty.
The Committee formulates and reviews remuneration package of the Executive Director.
No Director is involved in determining his or her own remuneration.
Audit Committee
The Audit Committee consists of three Directors two of whom are Non-executive Directors of the Company chaired by the Chairman of the Audit committee of the Parent Company. Members of the Audit Committee are Mr. Ajit M. De. S. Jayaratne (Chairman of the Committee), Dr. Bandula Perera (Member) and Dr. Ranjith Cabral (Member).
The Committee is empowered to examine all matters relating to financial affairs of the Company and its internal and external audits. The Committee reviews the internal control procedures, accounting policies and compliance with accounting standards.
Disclosure of Directors’ Remuneration
As at 31st March 2011, there was only one Executive Director receiving a remuneration and all other Non-executive Directors did not receive any form of remuneration, except for an allowance given for attendance at Board Meetings .
The total remuneration and fees paid to Executive and Non- executive Directors of the Company are disclosed in Note 6 to the Financial Statements.
Accountability & Audit
The financial statements of the Company and its Subsidiaries that are incorporated in this report have been prepared in accordance with the Sri Lanka Accounting Standards and the Companies Act No. 7 of 2007.
Consolidated financial statements and financial statements of the Company were audited by Messrs. KPMG Ford, Rhodes Thornton & Co., Chartered Accountants.
Report of the Directors is provided on pages 31 to 32 of the Annual report. The Auditors’ Report on financial statements for the year ended 31st March 2011 is presented on page 37 of this report.
The Chairman’s Review is presented on pages 6 to 9 of this report.
Going Concern-Declaration by Board of Directors in this regard is presented in the Report of Directors on page 32 of this report.
Internal Controls
The Board of Directors acknowledges its overall responsibility for maintaining a sound system of internal controls to safeguard Shareholders investment and assets of the Company.
The Statement of Directors’ Responsibility for the Financial Reporting is given on page 33 of this report.
Compliance with the Colombo Stock Exchange Rules on Corporate Governance
The Company complied with rules on Corporate Governance of the Colombo Stock Exchange and the Annual Report contains affirmative statements.
CORPORATE GOVERNANCE

Kelani Cables PLC | Annual Report 2010/1127
Rule No. Subject Requirement Compliance Status
Remarks
7.10.1(a)
Non-Executive Directors
Two or at least one third of the total number of Directors should be Non-Executive Directors, whichever is higher
Compliant Five out of six Directors are Non-Executive Directors as at the date of the Annual Report. Mr. Hemantha Perera who served as an executive Director ceased to hold such office with effect from 31st March 2011.
7.10.2
(a)
(b)
Independent Directors
Two or one third of Non-Executive Directors, whichever is higher, should be independent
Each Non-executive Director should submit a declaration of independence/non-independence in the prescribed format.
Compliant
Compliant
Two Directors are independent.
Non- Executive Directors have submitted the declaration.
7.10.3
(a)
(b)
(c)
(d)
Disclosure relating to Directors
The Board shall annually make a determination as to the independence or otherwise of the Non-Executive Directors.
Names of the independent Directors should be disclosed in the Annual Report
A brief resume of each Director should be published in the Annual Report including the areas of Expertise
Company should send a brief resume upon appointment of each new Director to the Stock Exchange.
Compliant
Compliant
Compliant
Compliant
Based on the Declarations received from Directors at year end, Board had determined the independence and non-independence as reported on page 25 of the Annual report.
Please refer page 25 of this report.
Pages 10 to 11 of the Annual Report include profiles of Directors.
No new Directors were appointed during the year.
7.10.5 Remuneration Committee
A listed Company shall have a Remuneration Committee. The Remuneration committee of the listed parent company may function as the Remuneration Committee.
Compliant Please refer page 30 of this report.
Kelani Cables PLC | Annual Report 2010/1128
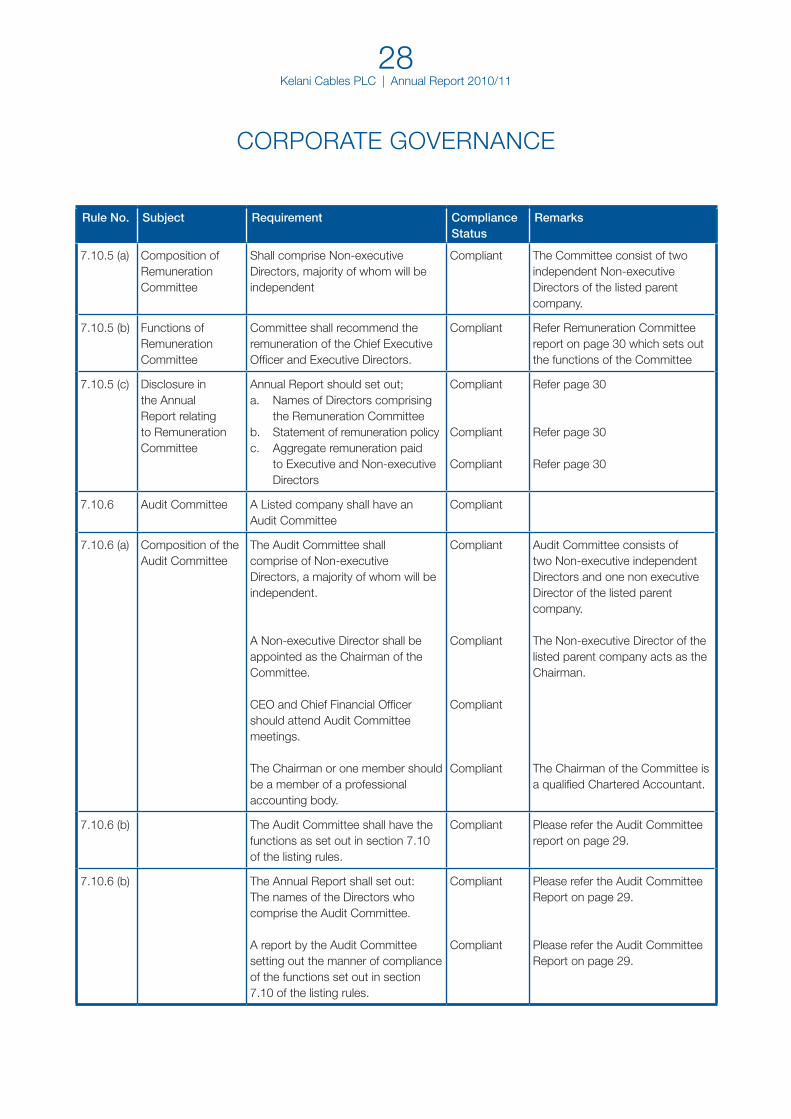
Rule No. Subject Requirement Compliance Status
Remarks
7.10.5 (a) Composition of Remuneration Committee
Shall comprise Non-executive Directors, majority of whom will be independent
Compliant The Committee consist of two independent Non-executive Directors of the listed parent company.
7.10.5 (b) Functions of Remuneration Committee
Committee shall recommend the remuneration of the Chief Executive Officer and Executive Directors.
Compliant Refer Remuneration Committee report on page 30 which sets out the functions of the Committee
7.10.5 (c) Disclosure in the Annual Report relating to Remuneration Committee
Annual Report should set out;a. Names of Directors comprising
the Remuneration Committeeb. Statement of remuneration policyc. Aggregate remuneration paid
to Executive and Non-executive Directors
Compliant
Compliant
Compliant
Refer page 30
Refer page 30
Refer page 30
7.10.6 Audit Committee A Listed company shall have an Audit Committee
Compliant
7.10.6 (a) Composition of the Audit Committee
The Audit Committee shall comprise of Non-executive Directors, a majority of whom will be independent.
A Non-executive Director shall be appointed as the Chairman of the Committee.
CEO and Chief Financial Officer should attend Audit Committee meetings.
The Chairman or one member should be a member of a professional accounting body.
Compliant
Compliant
Compliant
Compliant
Audit Committee consists of two Non-executive independent Directors and one non executive Director of the listed parent company.
The Non-executive Director of the listed parent company acts as the Chairman.
The Chairman of the Committee is a qualified Chartered Accountant.
7.10.6 (b) The Audit Committee shall have the functions as set out in section 7.10 of the listing rules.
Compliant Please refer the Audit Committee report on page 29.
7.10.6 (b) The Annual Report shall set out:The names of the Directors who comprise the Audit Committee.
A report by the Audit Committee setting out the manner of compliance of the functions set out in section 7.10 of the listing rules.
Compliant
Compliant
Please refer the Audit Committee Report on page 29.
Please refer the Audit Committee Report on page 29.
CORPORATE GOVERNANCE
Kelani Cables PLC | Annual Report 2010/1129
AUDIT COMMITTEE REPORT
The Audit Committee consists of three Directors two of whom are Non-executive Directors of the Company and the committee is chaired by the Chairman of the Parent Company Audit committee. The members of the Audit Committee are as follows.
Mr. Ajit Jayaratne - Chairman of the CommitteeDr. Bandula Perera - Member Dr. Ranjith Cabral - Member
The Committee is empowered to examine all matters relating to financial affairs of the Company and its internal and external audits. The Committee reviews the internal control procedures, accounting policies, compliance with accounting standards. The Audit Committee held one meeting during the last financial year to review the operations.
Above members have significant recent and relevant experience as required by the Code of Best Practice in Corporate Governance, issued by the Institute of Chartered Accountants of Sri Lanka and the Listing Rules of the Colombo Stock Exchange.
Role
The primary role of the Audit Committee, which reports its findings to the Board of Directors, is to ensure the integrity of the financial reporting and audit processes and the maintenance of a sound internal control and risk management system. The Committees` responsibilities include monitoring and reviewing the following.
• The integrity of the Group’s financial statements and the significant reporting judgments contained in them.
• The effectiveness of the Group’s internal control and risk management systems.
• The appropriateness of the Group’s relationship with the external auditors, including auditor independence, fees and provision of non-audit services.
• The effectiveness of the external audit process and making recommendations to the Board of Directors on the appointment of the external auditors.
In the performance of its duties, the Committee has independent access to the services of Internal Audit and to the External Auditors, and may obtain outside professional advice as necessary. Comprehensive briefing papers are circulated to Committee members in advance of each meeting and made available to other Directors.
Meetings & attendance
The Committee met once in 2010/2011 and reviewed the findings of the Internal Audit of the twelve month period to coincide with the financial and reporting cycles of the Company. Members’ attendance at these meetings is set out in the Corporate Governance Report. The Chairman, Deputy Chairman Managing Director & Chief Executive Officer, Group Financial Controller and Chief Financial officer are invited to attend meetings when required.
Financial Reporting
The Audit Committee considered a wide range of financial reporting and related matters in respect of the 2010/2011 published Financial Statements. The Committee reviewed any significant areas of judgment that materially impacted reported results, key points of disclosure and presentation to ensure the adequacy, clarity and completeness of the Interim Financial Statements.
External Auditors
The Audit Committee is responsible for the development, implementation and monitoring of the Company’s policies on external audit. The policies, designed to maintain the objectivity and independence of the external auditors, regulate the appointment of former employees of the external audit firm to positions in the Group and set out the approach to be taken when using the external auditors for non audit work.
The Audit Committee having evaluated the performance of the external auditors decided to recommend to the Board of Kelani Cables PLC, the re-appointment of Messrs KPMG Ford Rhodes Thornton & Co., as auditors of the Company, subject to the approval of the shareholders at the Annual General Meeting. Details of the fees payable to external auditors for 2010/2011 are given in note 6 to the financial statements.
Internal Control System
In 2010/2011 the Committee reviewed the results of the audits undertaken by Internal Auditors, Messrs Ernst & Young Advisory Services (Pvt) Ltd and considered the adequacy of management’s response to the matters raised, including the implementation of any recommendations made.
In conclusion, my sincere thanks to Dr. Bandula Perera and Dr. Ranjith Cabral, members of the committee for their valuable contribution to the work of the Committee.
On behalf of the Committee
(Sgd.)Mr. Ajit JayaratneChairman of the Audit Committee
5th August 2011
Kelani Cables PLC | Annual Report 2010/1130
REMUNERATION COMMITTEE REPORT
The Remuneration Committee comprises of the two Non-Executive Directors of the Holding Company namely,
Mr. Ajit Jayaratne-Chairman of the CommitteeMr. Rajiv Casie Chitty.
Role
The Remuneration Committee formulates the Group’s policy for the remuneration of the executive Director of Kelani Cables PLC. It reviews the policy annually and recommends any changes to the Board for formal approval.
The Remuneration Committee determined the Company’s Remuneration Policy of the Executive Director, having regard to performance and existing industry practice. No executive director is involved in deciding his own remuneration package.
Activities
The Committee considered a range of issues including,• A review of the Directors’ remuneration and severance
policies• Determining the fees of directors and• A formal evaluation of its own performance.
Members’ attendance at meetings of the Remuneration Committee in 2010/2011 is set out in the table in the Corporate Governance Report.
Executive Directors
The Holding Company remuneration policy for executive Directors is designed to attract, retain and motivate Directors of high caliber required to ensure that the Group is managed successfully to the benefit of shareholders. To achieve this, a competitive package of incentive and rewards linked to performance is provided.
In setting remuneration levels the Committee takes into consideration the remuneration practices found in other leading companies and also ensures that the remuneration arrangements for executive Directors are compatible with those for executives throughout the Group.
In conclusion, my sincere thanks to Mr. Rajiv Casie Chitty, member of the committee for his valuable contribution to the work of the Committee.
On behalf of the Committee
(Sgd.)Mr. Ajit JayaratneChairman of the Remuneration Committee
5th August 2011
Kelani Cables PLC | Annual Report 2010/1131
REPORT OF THE DIRECTORS
The Directors have pleasure in presenting their Report to the shareholders, together with the Audited Consolidated Financial Statements for the year ended 31st March 2011.
Principal Activities
The principal activities of the Company are manufacturing and selling of Power Cables, Telecommunication Cables and Enamelled Winding Wires.
Review of Operations
A review of the financial and operational performance of the Company during the year is contained in the Chairman’s Review (pages 6 to 9) and Operational Review sections of this Annual Report (pages 14 to 15).
Auditors
The Report of the Auditors on the Financial Statements is given on page 37.
Financial Statements
The Audited Financial Statements are given on pages 37 to 64 of this Report. The said Financial Statements are prepared in compliance with the requirements of Sections 151 (2) and 153 (2) to 153 (7) of the Companies Act No. 7 of 2007.
Accounting Policies
The accounting policies adopted in preparation of the Financial Statements are given on pages 42 to 47 in this Annual Report.
Board of Directors
The Board of Directors of the Company consists of six Directors throughout the financial year and their profiles are given on pages 10 to 11.
Mr. Hemantha Perera, Managing Director of the Company resigned from the Board of Directors with effect from 31st March 2011.
The Director retiring by rotation in terms of Section 85 of Articles of Association will be Dr. Bandula Perera, who being eligible in terms of Section 86 of Articles of Association, is recommended for re-election.
Directors’ Responsibilities for Financial Statements
The Statement of the Directors’ Responsibilities for Financial Statements is given on page 33 of this Annual Report.
Events Occurring after the Balance Sheet Date
No circumstance have arisen since the Balance Sheet date which would require adjustments to or disclosure in the Financial Statements other than those disclosed in Note 9 to the Financial Statements.
Interest Register
The Interest Register is maintained by the Company, as per the Companies Act No. 7 of 2007. All Directors have made declarations in accordance with the aforesaid Act. The Interest Register is available for inspection as required by the Companies Act at the registered office of the Company.
Directors’ Interest in Shares of the Company
The shareholdings of Directors at the beginning and at the end of the year were as follows:
No. of Shares % Holding
As at 31st March 2011 2010 2011 2010
Mr. Upali Madanayake Nil Nil Nil Nil
Mr. Suren Madanayake 14,000 14,000 0.06 0.06
Mr. Hemantha Perera
(resigned w.e.f. 31.3.2011) Nil Nil Nil Nil
Mrs. N. C. Madanayake Nil Nil Nil Nil
Dr. Bandula Perera Nil Nil Nil Nil
Dr. Ranjith Cabral Nil Nil Nil Nil
Directors’ Interests in Contracts
Directors’ interests in contracts of the Company are disclosed in Note 30 to the Financial Statements and no Director of the Company is directly or indirectly interested in any other contracts with the Company.
Directors’ Remuneration
Remuneration received by the Directors is given in Note 6 to the Financial Statements, on page 49.
Corporate Governance
The management and operation of the Company are effectively directed and controlled within the Corporate Governance framework as set out in pages 25 to 28 in this Report.

Kelani Cables PLC | Annual Report 2010/1132
Directors’ Meetings
The details of Directors’ meetings are set out on page 25 under Corporate Governance of the Annual Report.
Audit Committee
Please refer page 26 on Corporate Governance.
Remuneration Committee
Please refer page 30 of this Report.
Dividends
The Board of Directors has declared an interim dividend of Rs.0.50 per Share on 27th July 2011, subject to satisfactory compliance of the solvency Test required by the Companies Act No. 07 of 2007.
Going Concern
The Board is satisfied that the Company will continue its operations in the foreseeable future. For this reason, the Company continues to adopt the going concern basis in preparing the Financial Statements.
Stated Capital
The stated capital of the Company as at 31st March 2011 was Rs. 218,000,000.00 and was unchanged during the year.
Statutory Payments
All known statutory payments have been made by the Company.
Donations to Charity
Donations amounting to Rs. 135,940.00 were made during the year under review.
By Order of the Board
(Sgd.)Corporate Affairs (Private) LimitedCompany Secretaries
5th August 2011
REPORT OF THE DIRECTORS

Kelani Cables PLC | Annual Report 2010/1133
DIRECTORS’ RESPONSIBILITY FOR FINANCIAL REPORTING
The Board accepts responsibility for the preparation and fair presentation of Financial Statements in accordance with Sri Lanka Accounting Standards. This responsibility includes: designing, implementing and maintaining internal controls relevant to the preparation and fair presentation of Financial Statements that are free from material misstatement, whether due to fraud or error; selecting and applying appropriate accounting policies; and making accounting estimates that are reasonable in the circumstance.
In discharging this responsibility, the Directors have instituted a system of internal financial controls and a system for monitoring its effectiveness. The system of controls provide reasonable and not absolute assurance of safeguarding of Company’s assets, maintenance of proper accounting records and the reliability of financial information.
The Financial Statements reflect a true and fair view of the state of affairs of the Company and the Group as at 31st March 2011 and provide the information required by the Companies Act No. 7 of 2007. The Financial Statements have been prepared on the going concern basis as the Board is satisfied that the Company will continue its operations in the foreseeable future.
Approval of Financial Statements
The directors’ report and the financial statements of the Company and of the Group were approved by the Board of Directors on 5th August 2011.
By Order of the Board
(Sgd.)Corporate Affairs (Private) LimitedCompany Secretaries
5th August 2011

Kelani Cables PLC | Annual Report 2010/1134
Kelani Cables PLC | Annual Report 2010/1135
FINANCIAL INFORMATION
Independent Auditors’ Report 37
Income Statement 38
Balance Sheet 39
Statement of Changes in Equity 40
Cash Flow Statement 41
Notes to the Financial Statements 42

Kelani Cables PLC | Annual Report 2010/1136
Kelani Cables PLC | Annual Report 2010/1137
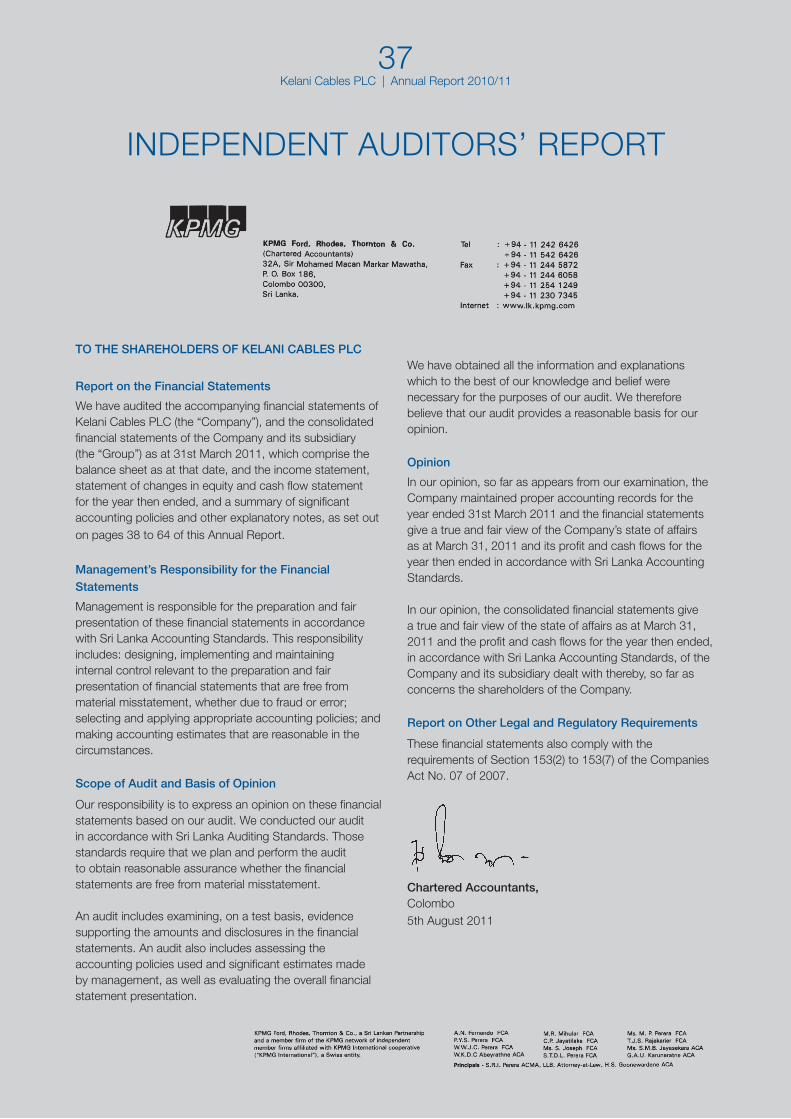
TO THE SHAREHOLDERS OF KELANI CABLES PLC
Report on the Financial Statements
We have audited the accompanying financial statements of Kelani Cables PLC (the “Company”), and the consolidated financial statements of the Company and its subsidiary (the “Group”) as at 31st March 2011, which comprise the balance sheet as at that date, and the income statement, statement of changes in equity and cash flow statement for the year then ended, and a summary of significant accounting policies and other explanatory notes, as set out on pages 38 to 64 of this Annual Report.
Management’s Responsibility for the Financial Statements
Management is responsible for the preparation and fair presentation of these financial statements in accordance with Sri Lanka Accounting Standards. This responsibility includes: designing, implementing and maintaining internal control relevant to the preparation and fair presentation of financial statements that are free from material misstatement, whether due to fraud or error; selecting and applying appropriate accounting policies; and making accounting estimates that are reasonable in the circumstances.
Scope of Audit and Basis of Opinion
Our responsibility is to express an opinion on these financial statements based on our audit. We conducted our audit in accordance with Sri Lanka Auditing Standards. Those standards require that we plan and perform the audit to obtain reasonable assurance whether the financial statements are free from material misstatement.
An audit includes examining, on a test basis, evidence supporting the amounts and disclosures in the financial statements. An audit also includes assessing the accounting policies used and significant estimates made by management, as well as evaluating the overall financial statement presentation.
INDEPENDENT AUDITORS’ REPORT
We have obtained all the information and explanations which to the best of our knowledge and belief were necessary for the purposes of our audit. We therefore believe that our audit provides a reasonable basis for our opinion.
Opinion
In our opinion, so far as appears from our examination, the Company maintained proper accounting records for the year ended 31st March 2011 and the financial statements give a true and fair view of the Company’s state of affairs as at March 31, 2011 and its profit and cash flows for the year then ended in accordance with Sri Lanka Accounting Standards.
In our opinion, the consolidated financial statements give a true and fair view of the state of affairs as at March 31, 2011 and the profit and cash flows for the year then ended, in accordance with Sri Lanka Accounting Standards, of the Company and its subsidiary dealt with thereby, so far as concerns the shareholders of the Company.
Report on Other Legal and Regulatory Requirements
These financial statements also comply with the requirements of Section 153(2) to 153(7) of the Companies Act No. 07 of 2007.
Chartered Accountants,Colombo5th August 2011
Kelani Cables PLC | Annual Report 2010/1138
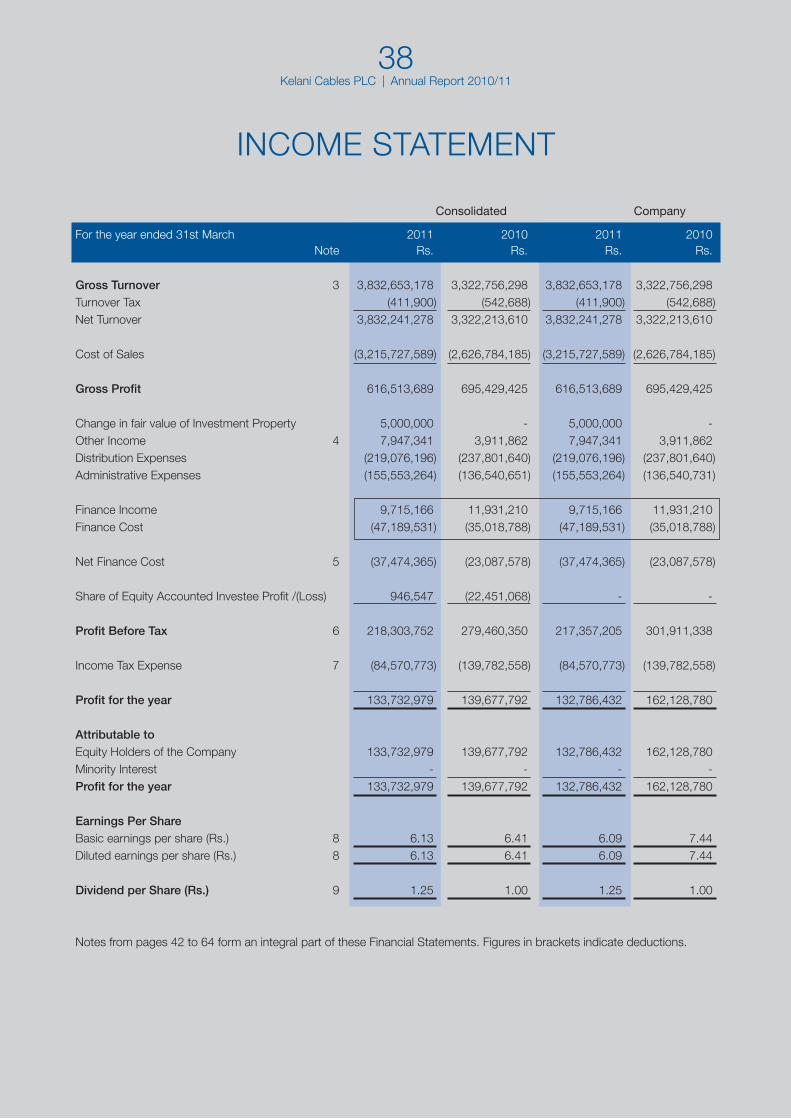
INCOME STATEMENT
Consolidated Company
For the year ended 31st March 2011 2010 2011 2010 Note Rs. Rs. Rs. Rs.
Gross Turnover 3 3,832,653,178 3,322,756,298 3,832,653,178 3,322,756,298Turnover Tax (411,900) (542,688) (411,900) (542,688)Net Turnover 3,832,241,278 3,322,213,610 3,832,241,278 3,322,213,610
Cost of Sales (3,215,727,589) (2,626,784,185) (3,215,727,589) (2,626,784,185)
Gross Profit 616,513,689 695,429,425 616,513,689 695,429,425
Change in fair value of Investment Property 5,000,000 - 5,000,000 -Other Income 4 7,947,341 3,911,862 7,947,341 3,911,862Distribution Expenses (219,076,196) (237,801,640) (219,076,196) (237,801,640)Administrative Expenses (155,553,264) (136,540,651) (155,553,264) (136,540,731)
Finance Income 9,715,166 11,931,210 9,715,166 11,931,210Finance Cost (47,189,531) (35,018,788) (47,189,531) (35,018,788)
Net Finance Cost 5 (37,474,365) (23,087,578) (37,474,365) (23,087,578)
Share of Equity Accounted Investee Profit /(Loss) 946,547 (22,451,068) - -
Profit Before Tax 6 218,303,752 279,460,350 217,357,205 301,911,338
Income Tax Expense 7 (84,570,773) (139,782,558) (84,570,773) (139,782,558)
Profit for the year 133,732,979 139,677,792 132,786,432 162,128,780
Attributable toEquity Holders of the Company 133,732,979 139,677,792 132,786,432 162,128,780Minority Interest - - - -Profit for the year 133,732,979 139,677,792 132,786,432 162,128,780
Earnings Per ShareBasic earnings per share (Rs.) 8 6.13 6.41 6.09 7.44Diluted earnings per share (Rs.) 8 6.13 6.41 6.09 7.44
Dividend per Share (Rs.) 9 1.25 1.00 1.25 1.00
Notes from pages 42 to 64 form an integral part of these Financial Statements. Figures in brackets indicate deductions.
Kelani Cables PLC | Annual Report 2010/1139
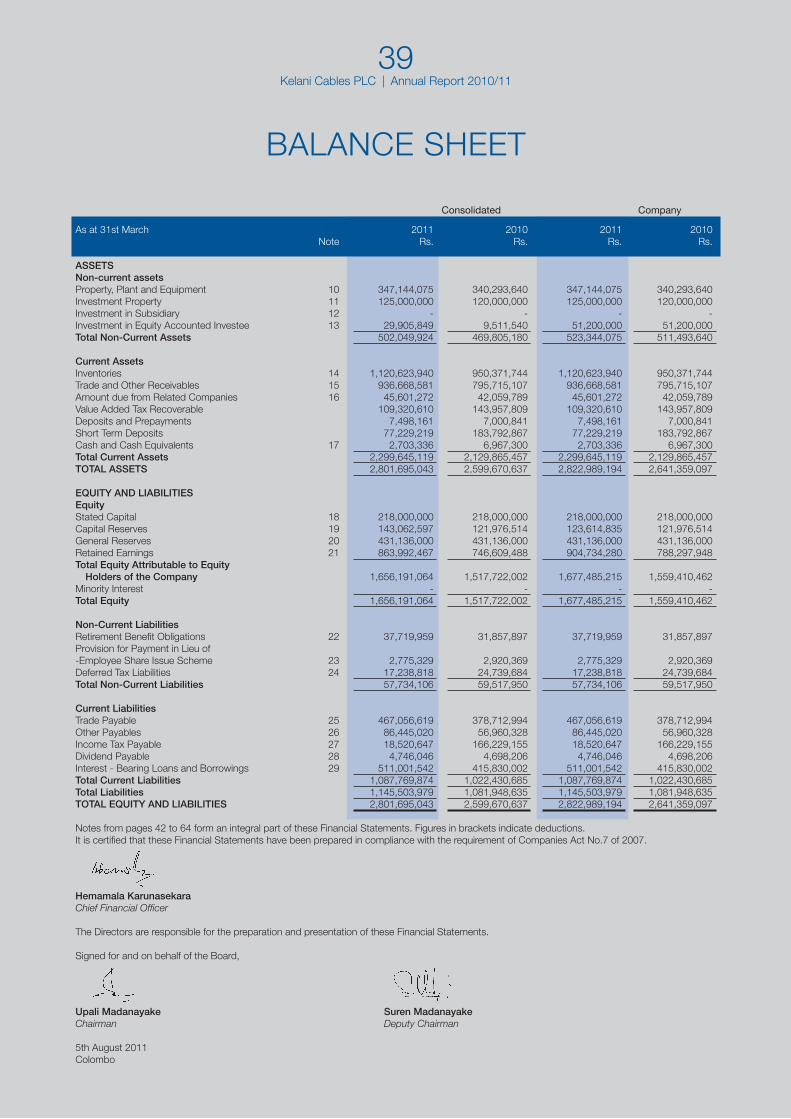
BALANCE SHEET
Consolidated Company
As at 31st March 2011 2010 2011 2010 Note Rs. Rs. Rs. Rs.
ASSETSNon-current assetsProperty, Plant and Equipment 10 347,144,075 340,293,640 347,144,075 340,293,640Investment Property 11 125,000,000 120,000,000 125,000,000 120,000,000Investment in Subsidiary 12 - - - -Investment in Equity Accounted Investee 13 29,905,849 9,511,540 51,200,000 51,200,000Total Non-Current Assets 502,049,924 469,805,180 523,344,075 511,493,640
Current AssetsInventories 14 1,120,623,940 950,371,744 1,120,623,940 950,371,744Trade and Other Receivables 15 936,668,581 795,715,107 936,668,581 795,715,107Amount due from Related Companies 16 45,601,272 42,059,789 45,601,272 42,059,789Value Added Tax Recoverable 109,320,610 143,957,809 109,320,610 143,957,809Deposits and Prepayments 7,498,161 7,000,841 7,498,161 7,000,841Short Term Deposits 77,229,219 183,792,867 77,229,219 183,792,867Cash and Cash Equivalents 17 2,703,336 6,967,300 2,703,336 6,967,300Total Current Assets 2,299,645,119 2,129,865,457 2,299,645,119 2,129,865,457TOTAL ASSETS 2,801,695,043 2,599,670,637 2,822,989,194 2,641,359,097
EQUITY AND LIABILITIESEquityStated Capital 18 218,000,000 218,000,000 218,000,000 218,000,000Capital Reserves 19 143,062,597 121,976,514 123,614,835 121,976,514General Reserves 20 431,136,000 431,136,000 431,136,000 431,136,000Retained Earnings 21 863,992,467 746,609,488 904,734,280 788,297,948Total Equity Attributable to Equity Holders of the Company 1,656,191,064 1,517,722,002 1,677,485,215 1,559,410,462Minority Interest - - - -Total Equity 1,656,191,064 1,517,722,002 1,677,485,215 1,559,410,462
Non-Current LiabilitiesRetirement Benefit Obligations 22 37,719,959 31,857,897 37,719,959 31,857,897Provision for Payment in Lieu of-Employee Share Issue Scheme 23 2,775,329 2,920,369 2,775,329 2,920,369Deferred Tax Liabilities 24 17,238,818 24,739,684 17,238,818 24,739,684Total Non-Current Liabilities 57,734,106 59,517,950 57,734,106 59,517,950
Current LiabilitiesTrade Payable 25 467,056,619 378,712,994 467,056,619 378,712,994Other Payables 26 86,445,020 56,960,328 86,445,020 56,960,328Income Tax Payable 27 18,520,647 166,229,155 18,520,647 166,229,155Dividend Payable 28 4,746,046 4,698,206 4,746,046 4,698,206Interest - Bearing Loans and Borrowings 29 511,001,542 415,830,002 511,001,542 415,830,002Total Current Liabilities 1,087,769,874 1,022,430,685 1,087,769,874 1,022,430,685Total Liabilities 1,145,503,979 1,081,948,635 1,145,503,979 1,081,948,635TOTAL EQUITY AND LIABILITIES 2,801,695,043 2,599,670,637 2,822,989,194 2,641,359,097
Notes from pages 42 to 64 form an integral part of these Financial Statements. Figures in brackets indicate deductions.It is certified that these Financial Statements have been prepared in compliance with the requirement of Companies Act No.7 of 2007.
Hemamala KarunasekaraChief Financial Officer
The Directors are responsible for the preparation and presentation of these Financial Statements.
Signed for and on behalf of the Board,
Upali Madanayake Suren MadanayakeChairman Deputy Chairman
5th August 2011Colombo
Kelani Cables PLC | Annual Report 2010/1140
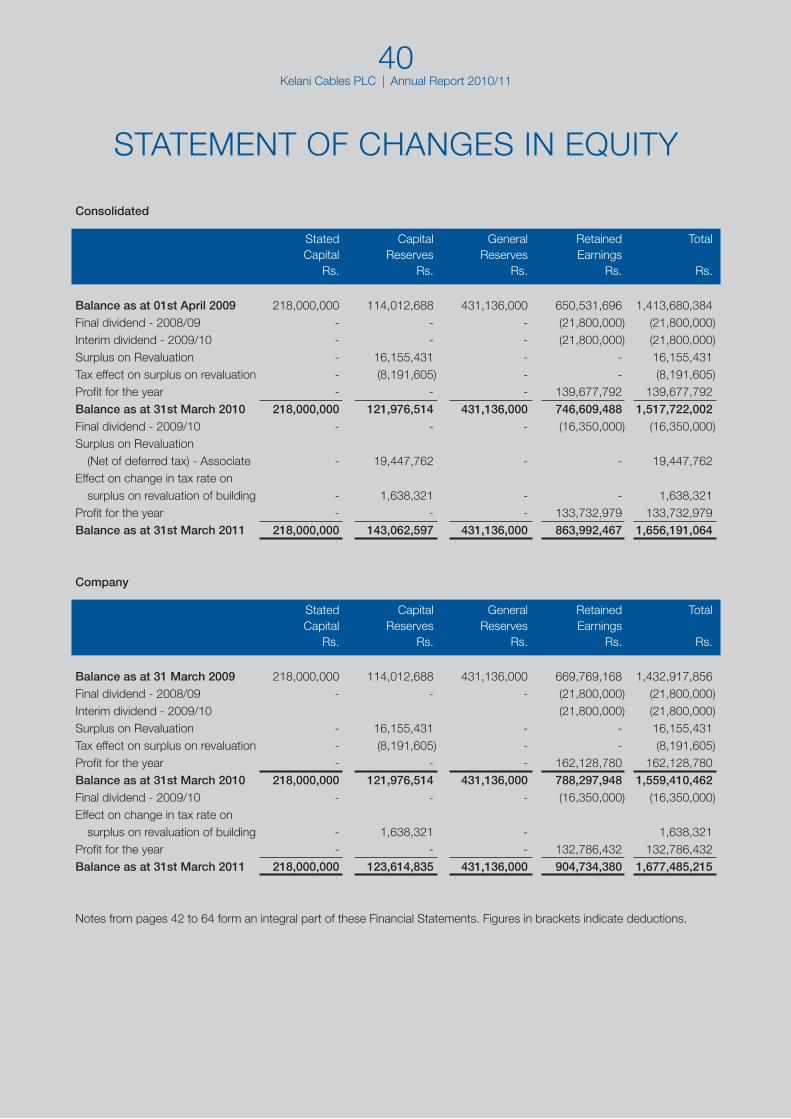
Consolidated
Stated Capital General Retained Total Capital Reserves Reserves Earnings Rs. Rs. Rs. Rs. Rs.
Balance as at 01st April 2009 218,000,000 114,012,688 431,136,000 650,531,696 1,413,680,384Final dividend - 2008/09 - - - (21,800,000) (21,800,000)Interim dividend - 2009/10 - - - (21,800,000) (21,800,000)Surplus on Revaluation - 16,155,431 - - 16,155,431Tax effect on surplus on revaluation - (8,191,605) - - (8,191,605)Profit for the year - - - 139,677,792 139,677,792Balance as at 31st March 2010 218,000,000 121,976,514 431,136,000 746,609,488 1,517,722,002Final dividend - 2009/10 - - - (16,350,000) (16,350,000)Surplus on Revaluation (Net of deferred tax) - Associate - 19,447,762 - - 19,447,762Effect on change in tax rate on surplus on revaluation of building - 1,638,321 - - 1,638,321Profit for the year - - - 133,732,979 133,732,979Balance as at 31st March 2011 218,000,000 143,062,597 431,136,000 863,992,467 1,656,191,064
Company
Stated Capital General Retained Total Capital Reserves Reserves Earnings Rs. Rs. Rs. Rs. Rs.
Balance as at 31 March 2009 218,000,000 114,012,688 431,136,000 669,769,168 1,432,917,856Final dividend - 2008/09 - - - (21,800,000) (21,800,000)Interim dividend - 2009/10 (21,800,000) (21,800,000)Surplus on Revaluation - 16,155,431 - - 16,155,431Tax effect on surplus on revaluation - (8,191,605) - - (8,191,605)Profit for the year - - - 162,128,780 162,128,780Balance as at 31st March 2010 218,000,000 121,976,514 431,136,000 788,297,948 1,559,410,462Final dividend - 2009/10 - - - (16,350,000) (16,350,000)Effect on change in tax rate on surplus on revaluation of building - 1,638,321 - 1,638,321Profit for the year - - - 132,786,432 132,786,432Balance as at 31st March 2011 218,000,000 123,614,835 431,136,000 904,734,380 1,677,485,215
Notes from pages 42 to 64 form an integral part of these Financial Statements. Figures in brackets indicate deductions.
STATEMENT OF CHANGES IN EQUITY
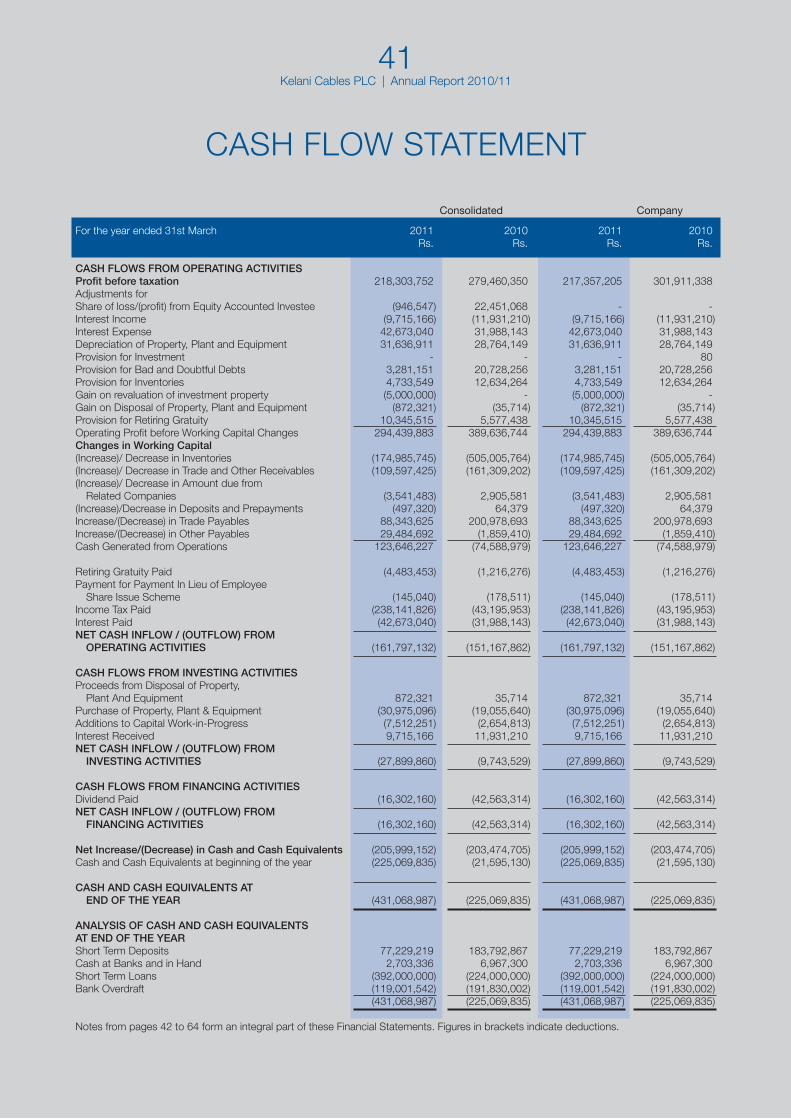
Kelani Cables PLC | Annual Report 2010/1141
Consolidated Company
For the year ended 31st March 2011 2010 2011 2010 Rs. Rs. Rs. Rs.
CASH FLOWS FROM OPERATING ACTIVITIESProfit before taxation 218,303,752 279,460,350 217,357,205 301,911,338Adjustments forShare of loss/(profit) from Equity Accounted Investee (946,547) 22,451,068 - -Interest Income (9,715,166) (11,931,210) (9,715,166) (11,931,210)Interest Expense 42,673,040 31,988,143 42,673,040 31,988,143Depreciation of Property, Plant and Equipment 31,636,911 28,764,149 31,636,911 28,764,149Provision for Investment - - - 80Provision for Bad and Doubtful Debts 3,281,151 20,728,256 3,281,151 20,728,256Provision for Inventories 4,733,549 12,634,264 4,733,549 12,634,264Gain on revaluation of investment property (5,000,000) - (5,000,000) -Gain on Disposal of Property, Plant and Equipment (872,321) (35,714) (872,321) (35,714)Provision for Retiring Gratuity 10,345,515 5,577,438 10,345,515 5,577,438Operating Profit before Working Capital Changes 294,439,883 389,636,744 294,439,883 389,636,744Changes in Working Capital(Increase)/ Decrease in Inventories (174,985,745) (505,005,764) (174,985,745) (505,005,764)(Increase)/ Decrease in Trade and Other Receivables (109,597,425) (161,309,202) (109,597,425) (161,309,202)(Increase)/ Decrease in Amount due from Related Companies (3,541,483) 2,905,581 (3,541,483) 2,905,581(Increase)/Decrease in Deposits and Prepayments (497,320) 64,379 (497,320) 64,379Increase/(Decrease) in Trade Payables 88,343,625 200,978,693 88,343,625 200,978,693Increase/(Decrease) in Other Payables 29,484,692 (1,859,410) 29,484,692 (1,859,410)Cash Generated from Operations 123,646,227 (74,588,979) 123,646,227 (74,588,979)
Retiring Gratuity Paid (4,483,453) (1,216,276) (4,483,453) (1,216,276)Payment for Payment In Lieu of Employee Share Issue Scheme (145,040) (178,511) (145,040) (178,511)Income Tax Paid (238,141,826) (43,195,953) (238,141,826) (43,195,953)Interest Paid (42,673,040) (31,988,143) (42,673,040) (31,988,143)NET CASH INFLOW / (OUTFLOW) FROM OPERATING ACTIVITIES (161,797,132) (151,167,862) (161,797,132) (151,167,862)
CASH FLOWS FROM INVESTING ACTIVITIESProceeds from Disposal of Property, Plant And Equipment 872,321 35,714 872,321 35,714Purchase of Property, Plant & Equipment (30,975,096) (19,055,640) (30,975,096) (19,055,640)Additions to Capital Work-in-Progress (7,512,251) (2,654,813) (7,512,251) (2,654,813)Interest Received 9,715,166 11,931,210 9,715,166 11,931,210NET CASH INFLOW / (OUTFLOW) FROM INVESTING ACTIVITIES (27,899,860) (9,743,529) (27,899,860) (9,743,529)
CASH FLOWS FROM FINANCING ACTIVITIESDividend Paid (16,302,160) (42,563,314) (16,302,160) (42,563,314)NET CASH INFLOW / (OUTFLOW) FROM FINANCING ACTIVITIES (16,302,160) (42,563,314) (16,302,160) (42,563,314)
Net Increase/(Decrease) in Cash and Cash Equivalents (205,999,152) (203,474,705) (205,999,152) (203,474,705)Cash and Cash Equivalents at beginning of the year (225,069,835) (21,595,130) (225,069,835) (21,595,130)
CASH AND CASH EQUIVALENTS AT END OF THE YEAR (431,068,987) (225,069,835) (431,068,987) (225,069,835)
ANALYSIS OF CASH AND CASH EQUIVALENTSAT END OF THE YEARShort Term Deposits 77,229,219 183,792,867 77,229,219 183,792,867Cash at Banks and in Hand 2,703,336 6,967,300 2,703,336 6,967,300Short Term Loans (392,000,000) (224,000,000) (392,000,000) (224,000,000)Bank Overdraft (119,001,542) (191,830,002) (119,001,542) (191,830,002) (431,068,987) (225,069,835) (431,068,987) (225,069,835)
Notes from pages 42 to 64 form an integral part of these Financial Statements. Figures in brackets indicate deductions.
CASH FLOW STATEMENT
Kelani Cables PLC | Annual Report 2010/1142
NOTES TO THE FINANCIAL STATEMENTS
REPORTING ENTITY
General
Kelani Cables PLC is a limited liability Company incorporated and domiciled in Sri Lanka. The Registered Office of the Company is located at No 21, Norris Cannel Road Colombo 10 and the principal place of business is situated at the Wewelduwa Kelaniya (PO Box 14).
In the Report of the Directors and in the Financial Statements, ‘the Company’ refers to Kelani Cables PLC as the holding Company and ‘the Group’ refers to the Consolidated Financial Statements of Kelani Cables PLC and its subsidiary, Kelani Electrical Accessories (Pvt) Limited (together referred to as the “Group”) and the Group’s interest in an equity accounted investee.
Companies in the Group
Subsidiary- A fully owned subsidiary, Kelani Electrical Accessories (Pvt) Limited, has been dormant since the cessation of operations in September 1995.
Equity accounted investee of the Group, whose results have been included in the financial statements is;
• ACL – Kelani Magnet Wire (Pvt) Limited
All the above Companies are incorporated in Sri Lanka.
The financial statements of all the Companies in the Group are prepared for a common financial year, which ends on 31st March.
Parent Enterprise and Ultimate Parent EnterpriseThe Company’s ultimate parent undertaking and controlling party is ACL Cables PLC, which is incorporated in Sri Lanka.
Date of Authorisation of IssueThe financial statements for the year ended 31st March 2011 were authorised for issue in accordance with a resolution on the Board of Directors on 5th August 2011.
1. BASIS OF PREPARATION
1.1 Statement of Compliance
The financial statements have been prepared in accordance with Sri Lanka Accounting Standards (SLAS), adopted by the Institute of Chartered Accountants of Sri Lanka (ICASL), and the requirements of the Companies Act No.07 of 2007 and Sri Lanka Accounting and Auditing Standards Act No.15 of 1995.
1.2 Basis of Measurement
The financial statements have been prepared on the historical cost basis except for land and buildings which are measured at fair value as explained in paragraph 2.3.1.1 below and retirement benefit obligations which are measured at the present value of the defined benefit plan as explained in Notes 2.3.1.1 and 2.4.1.2 to the financial statements respectively.
1.3 Functional & Presentation Currency
The financial statements are presented in Sri Lankan rupees which is the Group’s functional currency. All information presented has been rounded to the nearest thousand.
1.4 Use of Estimates and Judgements
The preparation of financial statements in conformity with SLAS requires management to make judgments, estimates and assumptions that affect the application of accounting policies and the reported amounts of assets, liabilities, income and expenses. Actual results may differ from these estimates and judgmental decisions.
Estimates and underlying assumptions are reviewed on an ongoing basis. Revisions to accounting estimates are recognised in the period in which the estimates are revised if the revision affects only that period or in the period of the revision and future periods if the revision affects both current and future periods.
Information about significant areas of estimation uncertainty and critical judgments in applying accounting policies that have the most significant effect on the amounts recognised in the financial statements is included in the following notes:
• Note 22 – Measurement of defined benefit obligations• Note 24 – Deferred tax liabilities
Kelani Cables PLC | Annual Report 2010/1143
2. SIGNIFICANT ACCOUNTING POLICIES
The accounting policies set out below are consistent with those used in the previous year. Accounting policies of subsidiaries have been changed where necessary to ensure consistency with the policies adopted by the Group.
The Directors have made an assessment of the Company’s ability to continue as a going concern in the foreseeable future, and they do not foresee a need for liquidation or cessation of trading.
2.1 Basis of Consolidation
2.1.1 Subsidiaries
Subsidiaries are those entities controlled by the Group. Control exists when the Group has the power to govern the financial and operating policies of an entity so as to obtain benefits from its activities. In assessing control, potential voting rights are taken into account. The financial statements of the subsidiaries are included in the consolidated financial statements from the date that control commences until the date that control ceases.
2.1.2 Equity accounted investees
Equity accounted investees is those entities in which the Group has significant influence, but not control, over financial and operating policies. Significant influence is presumed to exist when the Group holds between 20 and 50 percent of the voting power of another entity. Equity accounted investees is accounted for using the equity method and is recognised initially at cost. The consolidated financial statements include the Group’s share of the income and expenses and equity movements of equity accounted investee, from the date that significant influence commences until the date that significant influence ceases.
When the Group’s share of losses exceeds its investment in an equity accounted investee, the carrying amount of that interest is reduced to nil and the recognition of further losses is discontinued except to the extent that the Group has an obligation or has made payments on behalf of the investee.
2.1.3 Transactions eliminated on Consolidation
Intra-group balances and transactions, and any unrealised income and expenses arising from intra-group transactions, are eliminated in preparing the consolidated financial statements. Unrealised gains arising from transactions with equity accounted investees are eliminated against the investment to the extent of the Group’s interest in the investee. Unrealised losses are eliminated in the same way as unrealised gains, but only to the extent that there is no evidence of impairment.
2.1.6 Goodwill
Goodwill arising on an acquisition represents the excess of the cost of acquisition over the fair value of the net assets acquired. Goodwill is measured at cost less accumulated impairment losses. In respect of equity accounted investees, the carrying amount of goodwill is included in the carrying amount of the investment.
2.1.7 Intra group transaction
Pricing policies of all intra group sales are identical to those adopted for normal trading transaction, which are at market prices.
2.2 Foreign Currency
2.2.1 Foreign currency transactions
Transactions in foreign currencies are translated in to the Sri Lankan Rupees at exchange rates applicable at the dates of the transactions. Monetary assets and liabilities denominated in foreign currencies at the reporting date are retranslated to the Sri Lankan Rupees at the exchange rate ruling at that date. Foreign currency differences arising on translation are recognised in profit and loss.
2.3 Assets and Bases of their Valuation
Assets classified as current assets on the Balance Sheet are cash and bank balances and those which are expected to be realised in cash during the normal operating cycle of the Company’s business or within one year from the reporting date, whichever is shorter.
2.3.1 Property, Plant and Equipment
Items of property, plant & equipment are measured at cost (or at fair value in the case of land and buildings) less accumulated depreciation and accumulated impairment losses.

Kelani Cables PLC | Annual Report 2010/1144
2.3.1.1 Recognition and measurement
The cost of Property, plant & equipment includes expenditures that are directly attributable to the acquisition of the asset. The cost of self-constructed assets includes the cost of materials and direct labour, any other costs directly attributable to bringing the asset to a working condition for its intended use, and the costs of dismantling and removing the items and restoring the site on which they are located. Purchased software that is integral to the functionality of the related equipment is capitalised as part of that equipment.
A revaluation of land & building is done when there is a substantial difference between the fair value and the carrying amount of the land, and is undertaken by professionally qualified valuers.
Increases in the carrying amount on revaluation are credited to the revaluation reserve in shareholders’ equity. Decreases that offset previous increases of the same individual asset are charged against revaluation reserve directly in equity. All other decreases are expensed in profit and loss.
Gains and losses arising from disposal of property, plant and equipment are determined by comparing the proceeds from disposal with the carrying amount of property, plant and equipment and are recognised net within “other income” in profit and loss. When revalued assets are sold, the amounts included in the revaluation surplus reserve are transferred to retained earnings.
2.3.2 Investment property
Investment property is property held either to earn rental income or for capital appreciation or for both, but not for sale in the ordinary course of business, use in the production or supply of goods or services or for administrative purposes. Investment property is measured at cost on initial recognition and subsequently at fair value with any change therein recognised in profit and loss.
2.3.3 Subsequent expenditure
The cost of replacing part of an item of property, plant and equipment is recognised in the carrying amount of the item if it is probable that the future economic benefits embodied within the part will flow to the Group and its cost can be measured reliably.
The carrying amount of those parts that are replaced is derecognised in accordance with the derecognition policy given below.
The costs of the day-to-day servicing of property, plant and equipment are recognised in profit and loss as incurred.
2.3.4 Derecognition
The carrying amount of an item of property, plant and equipment is derecognised on disposal or when no future economic benefits are expected from its use or disposal. Gains or losses on derecognition are recognised in profit and loss and gains are not classified as revenue.
2.3.5 Depreciation
Depreciation is based on the cost of an asset less its residual value. Depreciation is recognised in profit and loss on a straight-line basis over the estimated useful lives of each part of an item of property, plant & equipment, Freehold land is not depreciated.
The estimated useful lives for the current and comparative periods are as follows:
Buildings 25 yearsPlant and Machinery 10 yearsElectrical Fittings 10 yearsOffice Equipment 10 yearsFurniture and Fittings 10 yearsMotor Vehicles 5 yearsBusiness Machines 5 yearsSoftware 1 year
Depreciation of an asset begins when it is available for use and ceases at the earlier of the date on which the asset is classified as held for sale or is derecognised.
Depreciation methods, useful lives and residual values are reassessed at the reporting date.
2.3.6 Investments
2.3.6.1 Current investments
Current investments are stated at lower of cost and market value determined on an aggregate portfolio basis, with any resultant gain or loss recognized in profit and loss.
NOTES TO THE FINANCIAL STATEMENTS

Kelani Cables PLC | Annual Report 2010/1145
2.3.6.2 Non –Current Investments
Quoted and unquoted investments in shares held on long term basis are measured at cost.
In the parent Company’s financial statements, investments in subsidiaries and equity accounted investee are carried at cost less provision for fall in value.
Provision for fall in value is made when in the opinion of the Directors there has been a decline other than temporary in the carrying amount of the investment.
2.3.7 Inventories
Inventories are measured at the lower of cost and net realisable value, after making due allowances for obsolete and slow moving items. Net realisable value is the estimated selling price in the ordinary course of business less the estimated cost of completion and selling expenses. The cost of inventories is based on weighted average principle and includes expenditure incurred on acquiring the inventories and bringing them to their existing location and condition.
2.3.8 Trade and other receivables
Trade and other receivables are stated at the amounts they are estimated to realise net of provisions for bad and doubtful debts.
Other receivables and dues from related parties are recognised at cost, less provision for bad and doubtful receivables.
2.3.9 Cash and cash equivalents
Cash and cash equivalents comprise cash balances and short term deposits. Bank overdrafts that are repayable on demand and form an integral part of the Group’s cash management are included as a component of cash and cash equivalents for the purpose of presenting the Cash Flow Statement.
2.3.10 Impairment
The carrying amounts of the Group’s assets are reviewed at each reporting date to determine whether there is any indication of impairment. If any such indication exists then the asset’s recoverable amount is estimated.
The recoverable amount of an asset or CGU (Cash Generating Unit) is the greater of its value in use and its fair value less cost to sell. In assessing value in use, the estimated future cash flows are discounted to present value using a pre-tax discount rate that reflects current market assessments of the time value of money and the risks specific to that asset. A CGU is the smallest identifiable asset group that generates cash flows that are largely independent from other asset groups.
An impairment loss is recognised if the carrying amount of an asset or its CGU exceeds its recoverable amount. Impairment losses are recognised in profit and loss. Impairment losses recognised in respect of CGU’s are allocated first to reduce the carrying amount of any goodwill allocated to the CGU and then to reduce the carrying amount of other assets in the unit on a pro rata basis.
Reversal of impairment losses are recognised only to the extent that the asset’s carrying amount does not exceed the carrying amount that would have been determined, net of depreciation or amortisation, if no impairment loss had been recognised.
2.4 Liabilities & Provisions
Liabilities classified as current liabilities on the Balance Sheet are those which fall due for payment on demand or within one year from the reporting date. Non-current liabilities are those balances that fall due for payment later than one year from the reporting date.
All known liabilities have been accounted for in preparing the financial statements.
2.4.1 Employee benefits
2.4.1.1 Defined contribution plan
A defined contribution plan is a post- employment benefit plan under which an entity pays a fixed contribution into a separate entity and will have no legal or constructive obligation to pay further amounts. Obligations for contributions to Provident and Trust Funds covering all employees are recognised as an expense in profit and loss in the periods during which services are rendered by employees.
Kelani Cables PLC | Annual Report 2010/1146
2.4.1.2 Defined Benefit Plans
A defined benefit plan is a post employment benefit plan other than a defined contribution plan. The liability recognised in the balance sheet in respect of defined benefit plans is the present value of the defined benefit obligation at the reporting date. The defined benefit obligation is calculated annually using the projected unit credit method. The present value of the defined benefit obligation is determined by discounting the estimated future cash flows using interest rates that are denominated in the currency in which the benefits will be paid, and that have terms of maturity approximating to the terms of the liability.
Provision has been made in the financial statements for retiring gratuities from the first year of service for all employees, in conformity with SLAS 16 (Revised 2006) on Retirement Benefit Costs.
However according to the Payment of Gratuity Act No. 12 of 1983, the liability for payment to an employee arises only after the completion of 5 years continued service.
The liability is not externally funded.
2.4.2 Provisions
A provision is recognised if, as a result of a past event, the Group has a present legal or constructive obligation that can be estimated reliably, and it is probable that an outflow of economic benefits will be required to settle the obligation.
2.4.3 Trade and other payables
Trade and other payables are stated at their cost.
2.5 Income Statements
For the purpose of presentation of the Income Statement, the function of expenses method is adopted, as it represents fairly the elements of Company performance.
2.5.1 Revenue
Revenue is recognised to the extent that it is probable that the economic benefits will flow to the Company and the revenue and associated costs incurred or to be incurred can be reliably measured. Revenue is measured at the fair value of the consideration received or receivable, net of returns and allowances, trade discounts and turnover taxes. The following specific criteria are used for the purpose of recognition of revenue:
• Revenue from the sale of goods is recognised when the significant risks and rewards of ownership have been transferred to the buyer which normally occurs upon the delivery of goods.
• Interest Income is recognised in the profit and loss as it accrues.
• Net gains/(losses) of a revenue nature on the disposal of Property, Plant & Equipment and other non – current assets including investments have been accounted for in profit and loss, having deducted from proceeds on disposal, the carrying amount of the assets and related selling
2.5.2 Expenditure
All expenditure incurred in the running of the business has been charged to income in arriving at the profit for the year. Repairs and renewals are charged to profit and loss in the year in which the expenditure is incurred.
2.5.2.1 Borrowing cost
Borrowing costs are recognised as an expense in the period in which they are incurred.
2.5.2.2 Net Finance Cost
Finance income comprises interest income on funds invested, dividend income and gain on translation of foreign currency.
Finance expense comprises interest payable on borrowings and loss on translation of foreign currency. The interest expense component of finance lease payments is recognised in profit and loss using the effective interest rate method.
2.5.2.3 Income tax expense
Income tax expense comprises current and deferred tax. Income tax expense is recognised in profit and loss except to the extent that it relates to items recognised directly in equity, when it is recognised in equity.
2.5.2.3.1 Current tax
Current tax is the expected tax payable on the taxable income for the year, using tax rates enacted at the reportingDate and any adjustments to tax payable in respect of previous years.
NOTES TO THE FINANCIAL STATEMENTS
Kelani Cables PLC | Annual Report 2010/1147
2.5.2.3.2 Deferred taxation
Deferred tax is recognised in respect of temporary differences between the carrying amounts of assets and liabilities for financial reporting purposes and the amounts used for taxation purposes. Deferred tax is measured at the tax rates that are expected to be applied to the temporary differences when they reverse, based on the laws that have been enacted or substantively enacted by the reporting date.
A deferred tax asset is recognised for unused tax losses and deductible temporary differences, to the extent that it is probable that future taxable profits will be available against which the asset can be utilised. Deferred tax assets are reviewed at each reporting date and are reduced to the extent that it is no longer probable that the related tax benefit will be realised.
2.6 General
2.6.1 Cash flow statement
The Cash flow statement has been prepared using the “indirect method”. Interest paid is classified as operating cash flows, interest and dividends received are classified as investing cash flows while dividends paid and government grants received are classified as financing cash flows for the purpose of presenting of Cash Flow Statement.
2.6.2 Events Occurring After the Balance Sheet Date
All material post Balance Sheet events have been considered and disclosed or adjusted where applicable.
2.6.3 Movement in Reserves
Movements in reserves are disclosed in the Statement of Changes in Equity.
2.6.4 Comparative Figures
Where necessary, comparative figures have been adjusted to conform to changes in presentation in the current financial year.
2.6.5 Capital Commitments and Contingencies
Capital Commitments and Contingencies have been disclosed in respective notes to the accounts.
2.6.6 Earnings per share
The Group presents basic and diluted earnings per share (EPS) for its ordinary shares. Basic EPS is calculated by dividing the profit or loss attributable to ordinary shareholders of the company by the weighted average number of ordinary shares outstanding during the period. Diluted EPS is determined by adjusting the profit or loss attributable to ordinary shareholders and the weighted average number of ordinary shares outstanding for the effects of all dilutive potential ordinary shares.
2.6.7 New Accounting Standards Issued but not effective as at balance sheet date
The Institute of Chartered Accountants of Sri Lanka issued a new volume of Sri Lanka Accounting Standards, which become applicable for annual periods beginning on or after 01st January 2012.Accordingly these Standards have not been applied in preparing these financial statements as they are not effective for the year ended 31st March 2011.
The Company is currently in the process of evaluating the potential effect of these Standards on its financial statements and the impacts on the adoption of these Standards have not been quantified as at the reporting date.

Kelani Cables PLC | Annual Report 2010/1148
3. GROSS TURNOVER
Consolidated Company
For the year ended 2010/11 2009/10 2010/11 2009/10 Rs. Rs. Rs. Rs.
Manufacturing and Fabrication 3,188,660,029 2,841,819,943 3,188,660,029 2,841,819,943Export Sales 590,476,928 432,482,111 590,476,928 432,482,111Trading 53,516,221 48,454,244 53,516,221 48,454,244Gross Turnover 3,832,653,178 3,322,756,298 3,832,653,178 3,322,756,298Less : Turnover Tax (411,900) (542,688) (411,900) (542,688)Net Turnover 3,832,241,278 3,322,213,610 3,832,241,278 3,322,213,610
4. OTHER INCOME
Consolidated Company
For the year ended 2010/11 2009/10 2010/11 2009/10 Rs. Rs. Rs. Rs.
Gain on disposal of property, plant and equipment 872,321 35,714 872,321 35,714Sundry income 7,075,020 3,876,148 7,075,020 3,876,148 7,947,341 3,911,862 7,947,341 3,911,862
5. NET FINANCE COST
Consolidated Company
For the year ended 2010/11 2009/10 2010/11 2009/10 Rs. Rs. Rs. Rs.
Finance IncomeInterest from foreign currency deposits 6,481,442 7,305,350 6,481,442 7,305,350Interest from local currency deposits 1,554 84,706 1,554 84,706Interest Income from loans granted to Holding - Company 3,232,170 4,541,154 3,232,170 4,541,154 9,715,166 11,931,210 9,715,166 11,931,210Finance CostLoss on translation of foreign currency (4,516,491) (3,030,645) (4,516,491) (3,030,645)Bank overdraft interest (18,833,916) (20,461,202) (18,833,916) (20,461,202)Interest on bank loans (22,379,873) (10,733,228) (22,379,873) (10,733,228)Interest on trade bills - (38,296) - (38,296)Interest on Distributor Deposit (1,459,251) (755,417) (1,459,251) (755,417) (47,189,531) (35,018,788) (47,189,531) (35,018,788)Net Finance Cost (37,474,365) (23,087,578) (37,474,365) (23,087,578)
NOTES TO THE FINANCIAL STATEMENTS
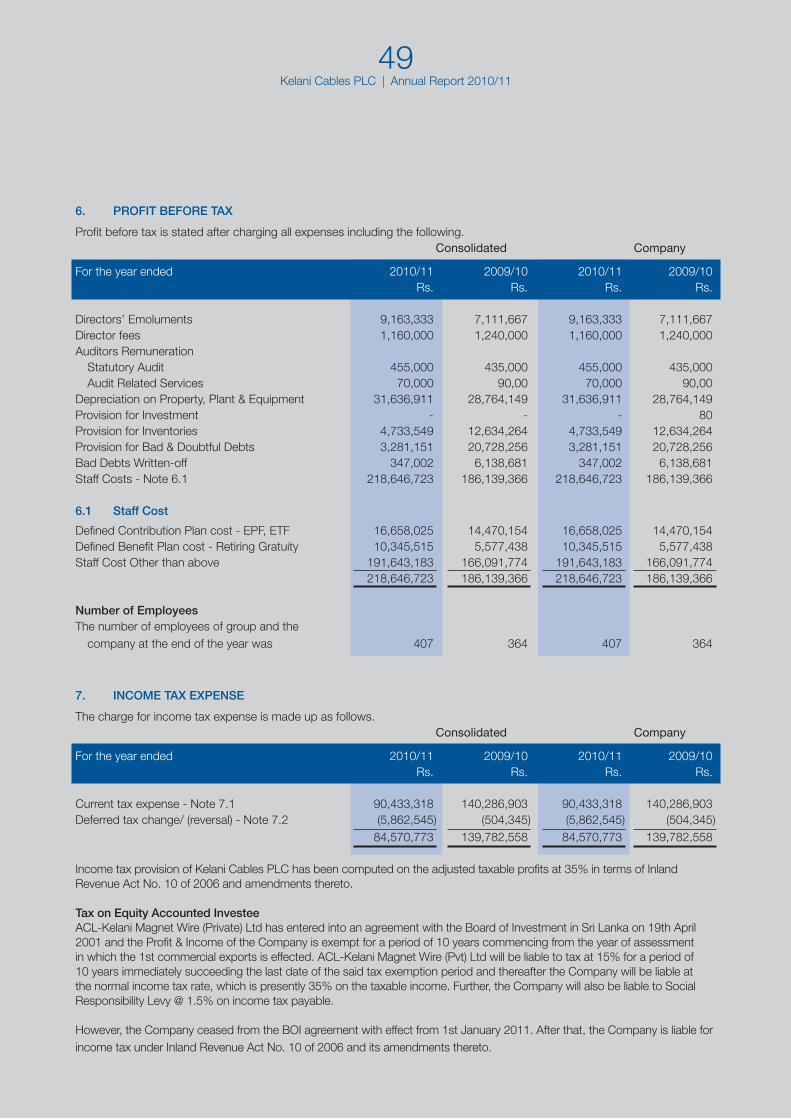
Kelani Cables PLC | Annual Report 2010/1149
6. PROFIT BEFORE TAX
Profit before tax is stated after charging all expenses including the following. Consolidated Company
For the year ended 2010/11 2009/10 2010/11 2009/10 Rs. Rs. Rs. Rs.
Directors’ Emoluments 9,163,333 7,111,667 9,163,333 7,111,667Director fees 1,160,000 1,240,000 1,160,000 1,240,000Auditors Remuneration Statutory Audit 455,000 435,000 455,000 435,000 Audit Related Services 70,000 90,00 70,000 90,00Depreciation on Property, Plant & Equipment 31,636,911 28,764,149 31,636,911 28,764,149Provision for Investment - - - 80Provision for Inventories 4,733,549 12,634,264 4,733,549 12,634,264Provision for Bad & Doubtful Debts 3,281,151 20,728,256 3,281,151 20,728,256Bad Debts Written-off 347,002 6,138,681 347,002 6,138,681Staff Costs - Note 6.1 218,646,723 186,139,366 218,646,723 186,139,366
6.1 Staff Cost
Defined Contribution Plan cost - EPF, ETF 16,658,025 14,470,154 16,658,025 14,470,154Defined Benefit Plan cost - Retiring Gratuity 10,345,515 5,577,438 10,345,515 5,577,438Staff Cost Other than above 191,643,183 166,091,774 191,643,183 166,091,774 218,646,723 186,139,366 218,646,723 186,139,366
Number of EmployeesThe number of employees of group and the company at the end of the year was 407 364 407 364
7. INCOME TAX EXPENSE
The charge for income tax expense is made up as follows. Consolidated Company
For the year ended 2010/11 2009/10 2010/11 2009/10 Rs. Rs. Rs. Rs.
Current tax expense - Note 7.1 90,433,318 140,286,903 90,433,318 140,286,903Deferred tax change/ (reversal) - Note 7.2 (5,862,545) (504,345) (5,862,545) (504,345) 84,570,773 139,782,558 84,570,773 139,782,558
Income tax provision of Kelani Cables PLC has been computed on the adjusted taxable profits at 35% in terms of Inland Revenue Act No. 10 of 2006 and amendments thereto.
Tax on Equity Accounted InvesteeACL-Kelani Magnet Wire (Private) Ltd has entered into an agreement with the Board of Investment in Sri Lanka on 19th April 2001 and the Profit & Income of the Company is exempt for a period of 10 years commencing from the year of assessment in which the 1st commercial exports is effected. ACL-Kelani Magnet Wire (Pvt) Ltd will be liable to tax at 15% for a period of 10 years immediately succeeding the last date of the said tax exemption period and thereafter the Company will be liable at the normal income tax rate, which is presently 35% on the taxable income. Further, the Company will also be liable to Social Responsibility Levy @ 1.5% on income tax payable.
However, the Company ceased from the BOI agreement with effect from 1st January 2011. After that, the Company is liable for income tax under Inland Revenue Act No. 10 of 2006 and its amendments thereto.
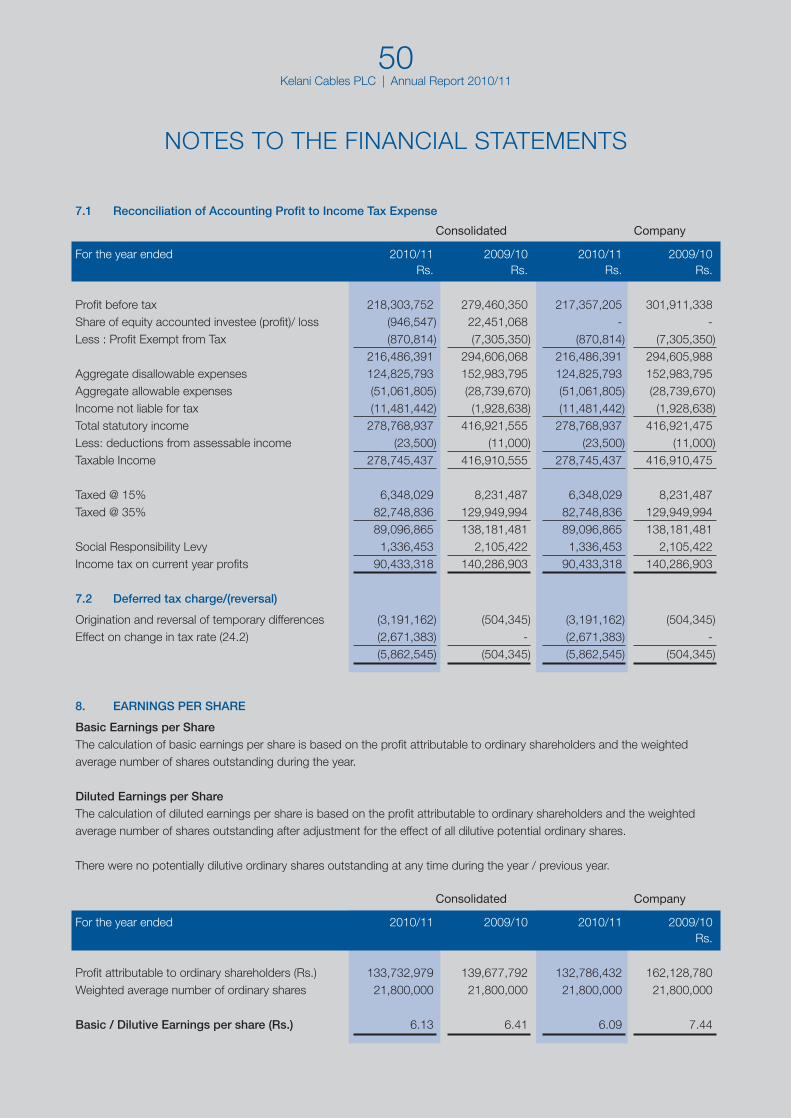
Kelani Cables PLC | Annual Report 2010/1150
7.1 Reconciliation of Accounting Profit to Income Tax Expense
Consolidated Company
For the year ended 2010/11 2009/10 2010/11 2009/10 Rs. Rs. Rs. Rs.
Profit before tax 218,303,752 279,460,350 217,357,205 301,911,338Share of equity accounted investee (profit)/ loss (946,547) 22,451,068 - -Less : Profit Exempt from Tax (870,814) (7,305,350) (870,814) (7,305,350) 216,486,391 294,606,068 216,486,391 294,605,988Aggregate disallowable expenses 124,825,793 152,983,795 124,825,793 152,983,795Aggregate allowable expenses (51,061,805) (28,739,670) (51,061,805) (28,739,670)Income not liable for tax (11,481,442) (1,928,638) (11,481,442) (1,928,638)Total statutory income 278,768,937 416,921,555 278,768,937 416,921,475Less: deductions from assessable income (23,500) (11,000) (23,500) (11,000)Taxable Income 278,745,437 416,910,555 278,745,437 416,910,475
Taxed @ 15% 6,348,029 8,231,487 6,348,029 8,231,487Taxed @ 35% 82,748,836 129,949,994 82,748,836 129,949,994 89,096,865 138,181,481 89,096,865 138,181,481Social Responsibility Levy 1,336,453 2,105,422 1,336,453 2,105,422Income tax on current year profits 90,433,318 140,286,903 90,433,318 140,286,903
7.2 Deferred tax charge/(reversal)
Origination and reversal of temporary differences (3,191,162) (504,345) (3,191,162) (504,345)Effect on change in tax rate (24.2) (2,671,383) - (2,671,383) - (5,862,545) (504,345) (5,862,545) (504,345)
8. EARNINGS PER SHARE
Basic Earnings per ShareThe calculation of basic earnings per share is based on the profit attributable to ordinary shareholders and the weighted average number of shares outstanding during the year.
Diluted Earnings per ShareThe calculation of diluted earnings per share is based on the profit attributable to ordinary shareholders and the weighted average number of shares outstanding after adjustment for the effect of all dilutive potential ordinary shares.
There were no potentially dilutive ordinary shares outstanding at any time during the year / previous year.
Consolidated Company
For the year ended 2010/11 2009/10 2010/11 2009/10 Rs.
Profit attributable to ordinary shareholders (Rs.) 133,732,979 139,677,792 132,786,432 162,128,780Weighted average number of ordinary shares 21,800,000 21,800,000 21,800,000 21,800,000
Basic / Dilutive Earnings per share (Rs.) 6.13 6.41 6.09 7.44
NOTES TO THE FINANCIAL STATEMENTS
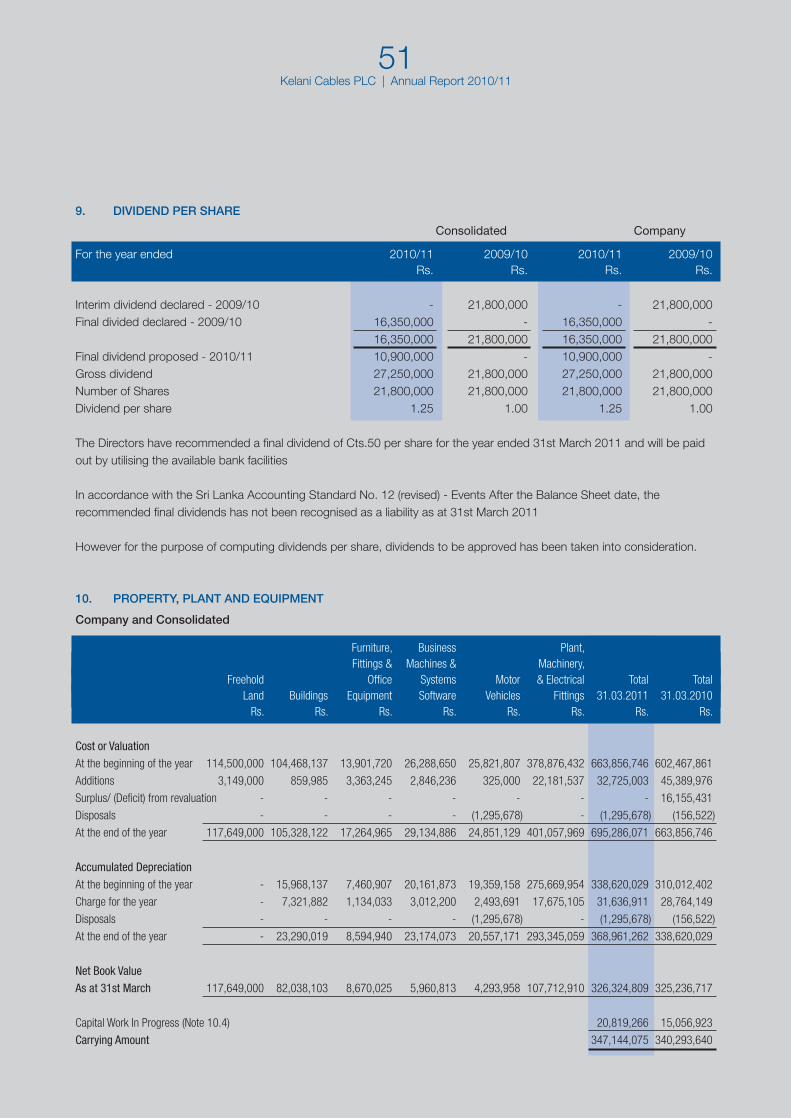
Kelani Cables PLC | Annual Report 2010/1151
9. DIVIDEND PER SHARE
Consolidated Company
For the year ended 2010/11 2009/10 2010/11 2009/10 Rs. Rs. Rs. Rs.
Interim dividend declared - 2009/10 - 21,800,000 - 21,800,000Final divided declared - 2009/10 16,350,000 - 16,350,000 - 16,350,000 21,800,000 16,350,000 21,800,000Final dividend proposed - 2010/11 10,900,000 - 10,900,000 -Gross dividend 27,250,000 21,800,000 27,250,000 21,800,000Number of Shares 21,800,000 21,800,000 21,800,000 21,800,000Dividend per share 1.25 1.00 1.25 1.00
The Directors have recommended a final dividend of Cts.50 per share for the year ended 31st March 2011 and will be paid out by utilising the available bank facilities
In accordance with the Sri Lanka Accounting Standard No. 12 (revised) - Events After the Balance Sheet date, the recommended final dividends has not been recognised as a liability as at 31st March 2011
However for the purpose of computing dividends per share, dividends to be approved has been taken into consideration.
10. PROPERTY, PLANT AND EQUIPMENT
Company and Consolidated
Furniture, Business Plant, Fittings & Machines & Machinery, Freehold Office Systems Motor & Electrical Total Total Land Buildings Equipment Software Vehicles Fittings 31.03.2011 31.03.2010 Rs. Rs. Rs. Rs. Rs. Rs. Rs. Rs.
Cost or Valuation
At the beginning of the year 114,500,000 104,468,137 13,901,720 26,288,650 25,821,807 378,876,432 663,856,746 602,467,861
Additions 3,149,000 859,985 3,363,245 2,846,236 325,000 22,181,537 32,725,003 45,389,976
Surplus/ (Deficit) from revaluation - - - - - - - 16,155,431
Disposals - - - - (1,295,678) - (1,295,678) (156,522)
At the end of the year 117,649,000 105,328,122 17,264,965 29,134,886 24,851,129 401,057,969 695,286,071 663,856,746
Accumulated Depreciation
At the beginning of the year - 15,968,137 7,460,907 20,161,873 19,359,158 275,669,954 338,620,029 310,012,402
Charge for the year - 7,321,882 1,134,033 3,012,200 2,493,691 17,675,105 31,636,911 28,764,149
Disposals - - - - (1,295,678) - (1,295,678) (156,522)
At the end of the year - 23,290,019 8,594,940 23,174,073 20,557,171 293,345,059 368,961,262 338,620,029
Net Book Value
As at 31st March 117,649,000 82,038,103 8,670,025 5,960,813 4,293,958 107,712,910 326,324,809 325,236,717
Capital Work In Progress (Note 10.4) 20,819,266 15,056,923
Carrying Amount 347,144,075 340,293,640
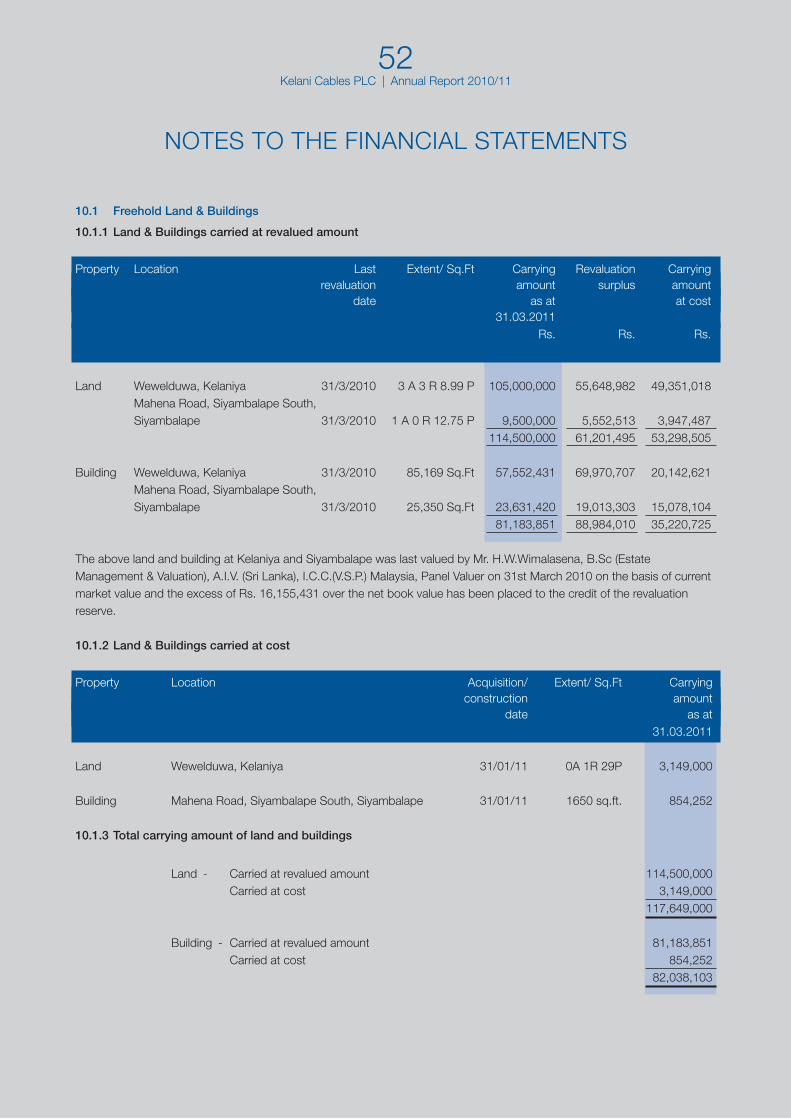
Kelani Cables PLC | Annual Report 2010/1152
10.1 Freehold Land & Buildings
10.1.1 Land & Buildings carried at revalued amount
Property Location Last Extent/ Sq.Ft Carrying Revaluation Carrying revaluation amount surplus amount date as at at cost 31.03.2011 Rs. Rs. Rs.
Land Wewelduwa, Kelaniya 31/3/2010 3 A 3 R 8.99 P 105,000,000 55,648,982 49,351,018 Mahena Road, Siyambalape South, Siyambalape 31/3/2010 1 A 0 R 12.75 P 9,500,000 5,552,513 3,947,487 114,500,000 61,201,495 53,298,505 Building Wewelduwa, Kelaniya 31/3/2010 85,169 Sq.Ft 57,552,431 69,970,707 20,142,621 Mahena Road, Siyambalape South, Siyambalape 31/3/2010 25,350 Sq.Ft 23,631,420 19,013,303 15,078,104 81,183,851 88,984,010 35,220,725
The above land and building at Kelaniya and Siyambalape was last valued by Mr. H.W.Wimalasena, B.Sc (Estate Management & Valuation), A.I.V. (Sri Lanka), I.C.C.(V.S.P.) Malaysia, Panel Valuer on 31st March 2010 on the basis of current market value and the excess of Rs. 16,155,431 over the net book value has been placed to the credit of the revaluation reserve.
10.1.2 Land & Buildings carried at cost
Property Location Acquisition/ Extent/ Sq.Ft Carrying construction amount date as at 31.03.2011
Land Wewelduwa, Kelaniya 31/01/11 0A 1R 29P 3,149,000 Building Mahena Road, Siyambalape South, Siyambalape 31/01/11 1650 sq.ft. 854,252 10.1.3 Total carrying amount of land and buildings
Land - Carried at revalued amount 114,500,000 Carried at cost 3,149,000 117,649,000 Building - Carried at revalued amount 81,183,851 Carried at cost 854,252 82,038,103
NOTES TO THE FINANCIAL STATEMENTS
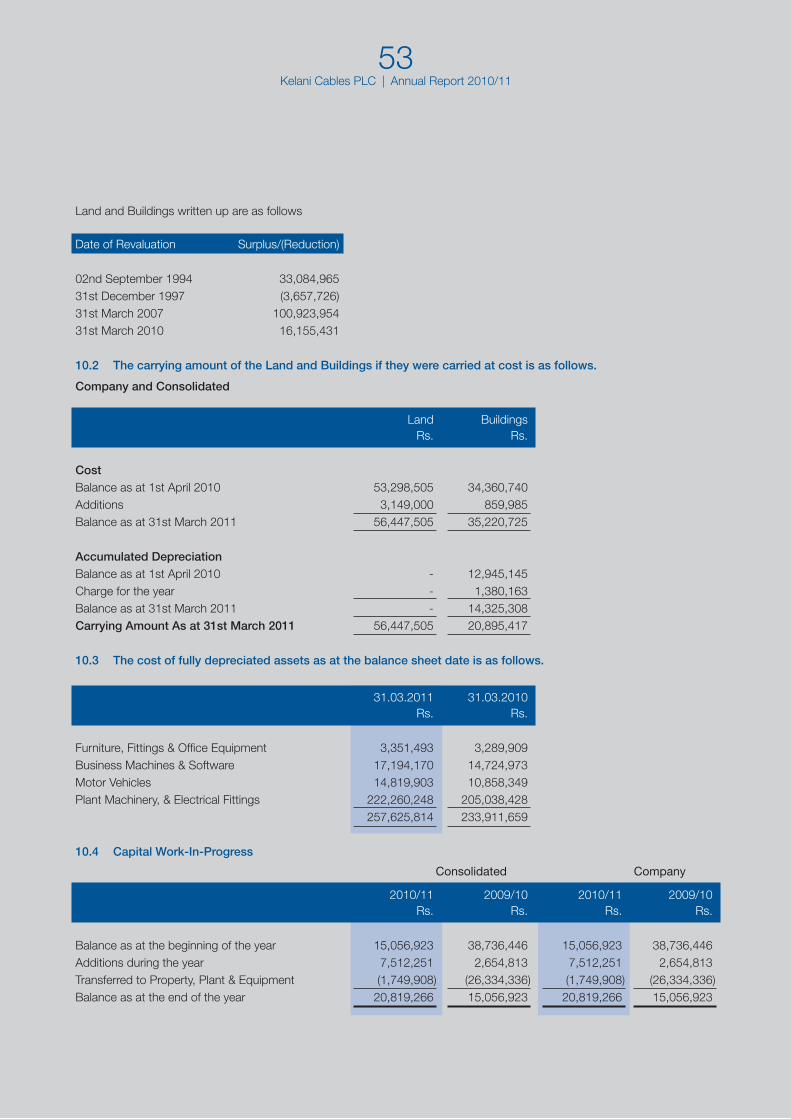
Kelani Cables PLC | Annual Report 2010/1153
Land and Buildings written up are as follows
Date of Revaluation Surplus/(Reduction)
02nd September 1994 33,084,96531st December 1997 (3,657,726)31st March 2007 100,923,95431st March 2010 16,155,431
10.2 The carrying amount of the Land and Buildings if they were carried at cost is as follows.
Company and Consolidated
Land Buildings Rs. Rs.
CostBalance as at 1st April 2010 53,298,505 34,360,740Additions 3,149,000 859,985Balance as at 31st March 2011 56,447,505 35,220,725
Accumulated DepreciationBalance as at 1st April 2010 - 12,945,145Charge for the year - 1,380,163Balance as at 31st March 2011 - 14,325,308Carrying Amount As at 31st March 2011 56,447,505 20,895,417
10.3 The cost of fully depreciated assets as at the balance sheet date is as follows.
31.03.2011 31.03.2010 Rs. Rs.
Furniture, Fittings & Office Equipment 3,351,493 3,289,909Business Machines & Software 17,194,170 14,724,973Motor Vehicles 14,819,903 10,858,349Plant Machinery, & Electrical Fittings 222,260,248 205,038,428 257,625,814 233,911,659
10.4 Capital Work-In-Progress
Consolidated Company
2010/11 2009/10 2010/11 2009/10 Rs. Rs. Rs. Rs.
Balance as at the beginning of the year 15,056,923 38,736,446 15,056,923 38,736,446Additions during the year 7,512,251 2,654,813 7,512,251 2,654,813Transferred to Property, Plant & Equipment (1,749,908) (26,334,336) (1,749,908) (26,334,336)Balance as at the end of the year 20,819,266 15,056,923 20,819,266 15,056,923
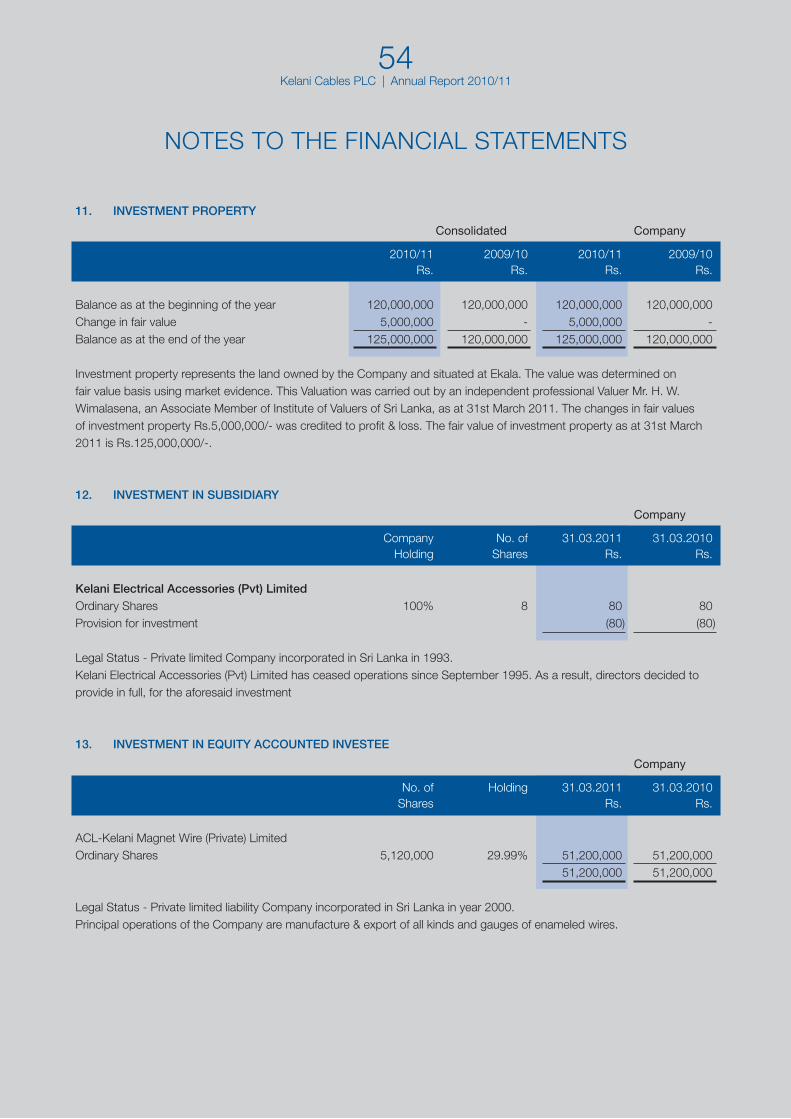
Kelani Cables PLC | Annual Report 2010/1154
11. INVESTMENT PROPERTY
Consolidated Company
2010/11 2009/10 2010/11 2009/10 Rs. Rs. Rs. Rs.
Balance as at the beginning of the year 120,000,000 120,000,000 120,000,000 120,000,000Change in fair value 5,000,000 - 5,000,000 -Balance as at the end of the year 125,000,000 120,000,000 125,000,000 120,000,000
Investment property represents the land owned by the Company and situated at Ekala. The value was determined on fair value basis using market evidence. This Valuation was carried out by an independent professional Valuer Mr. H. W. Wimalasena, an Associate Member of Institute of Valuers of Sri Lanka, as at 31st March 2011. The changes in fair values of investment property Rs.5,000,000/- was credited to profit & loss. The fair value of investment property as at 31st March 2011 is Rs.125,000,000/-.
12. INVESTMENT IN SUBSIDIARY
Company
Company No. of 31.03.2011 31.03.2010 Holding Shares Rs. Rs.
Kelani Electrical Accessories (Pvt) LimitedOrdinary Shares 100% 8 80 80Provision for investment (80) (80)
Legal Status - Private limited Company incorporated in Sri Lanka in 1993.Kelani Electrical Accessories (Pvt) Limited has ceased operations since September 1995. As a result, directors decided to provide in full, for the aforesaid investment
13. INVESTMENT IN EQUITY ACCOUNTED INVESTEE
Company
No. of Holding 31.03.2011 31.03.2010 Shares Rs. Rs.
ACL-Kelani Magnet Wire (Private) LimitedOrdinary Shares 5,120,000 29.99% 51,200,000 51,200,000 51,200,000 51,200,000
Legal Status - Private limited liability Company incorporated in Sri Lanka in year 2000.Principal operations of the Company are manufacture & export of all kinds and gauges of enameled wires.
NOTES TO THE FINANCIAL STATEMENTS
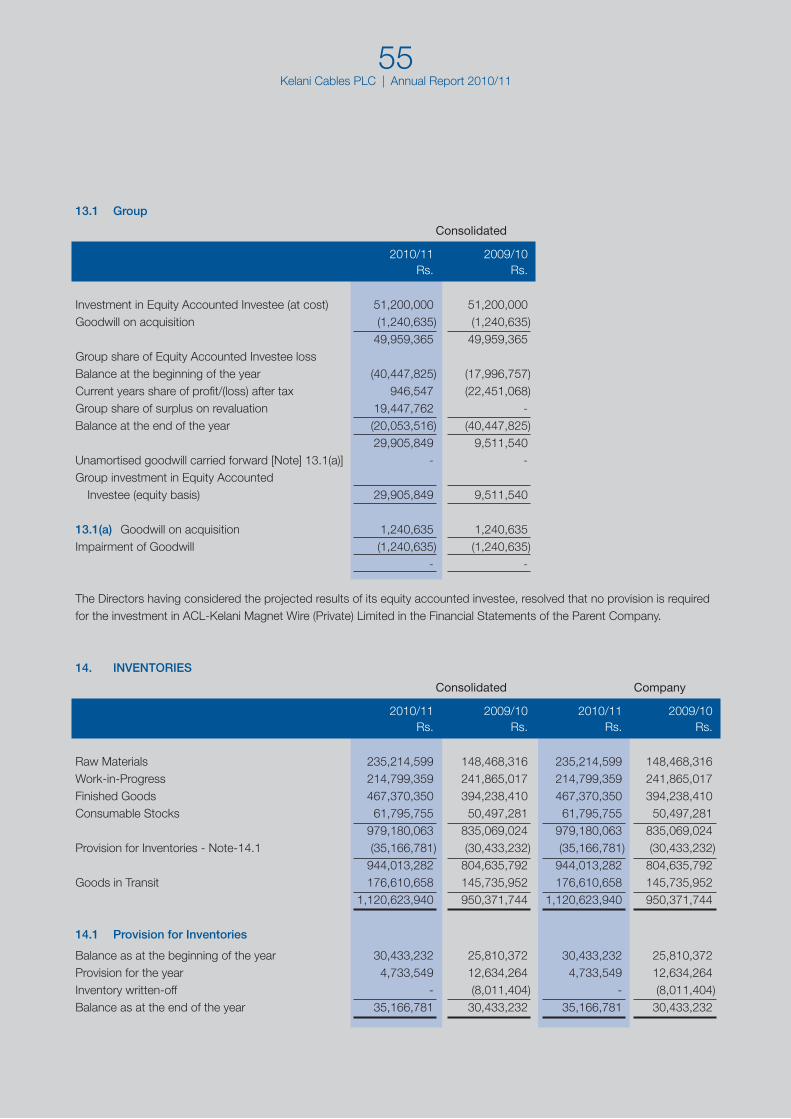
Kelani Cables PLC | Annual Report 2010/1155
13.1 Group
Consolidated
2010/11 2009/10 Rs. Rs.
Investment in Equity Accounted Investee (at cost) 51,200,000 51,200,000Goodwill on acquisition (1,240,635) (1,240,635) 49,959,365 49,959,365Group share of Equity Accounted Investee lossBalance at the beginning of the year (40,447,825) (17,996,757)Current years share of profit/(loss) after tax 946,547 (22,451,068)Group share of surplus on revaluation 19,447,762 -Balance at the end of the year (20,053,516) (40,447,825) 29,905,849 9,511,540Unamortised goodwill carried forward [Note] 13.1(a)] - -Group investment in Equity Accounted Investee (equity basis) 29,905,849 9,511,540
13.1(a) Goodwill on acquisition 1,240,635 1,240,635Impairment of Goodwill (1,240,635) (1,240,635) - -
The Directors having considered the projected results of its equity accounted investee, resolved that no provision is required for the investment in ACL-Kelani Magnet Wire (Private) Limited in the Financial Statements of the Parent Company.
14. INVENTORIES
Consolidated Company
2010/11 2009/10 2010/11 2009/10 Rs. Rs. Rs. Rs.
Raw Materials 235,214,599 148,468,316 235,214,599 148,468,316Work-in-Progress 214,799,359 241,865,017 214,799,359 241,865,017Finished Goods 467,370,350 394,238,410 467,370,350 394,238,410Consumable Stocks 61,795,755 50,497,281 61,795,755 50,497,281 979,180,063 835,069,024 979,180,063 835,069,024Provision for Inventories - Note-14.1 (35,166,781) (30,433,232) (35,166,781) (30,433,232) 944,013,282 804,635,792 944,013,282 804,635,792Goods in Transit 176,610,658 145,735,952 176,610,658 145,735,952 1,120,623,940 950,371,744 1,120,623,940 950,371,744
14.1 Provision for Inventories
Balance as at the beginning of the year 30,433,232 25,810,372 30,433,232 25,810,372Provision for the year 4,733,549 12,634,264 4,733,549 12,634,264Inventory written-off - (8,011,404) - (8,011,404)Balance as at the end of the year 35,166,781 30,433,232 35,166,781 30,433,232
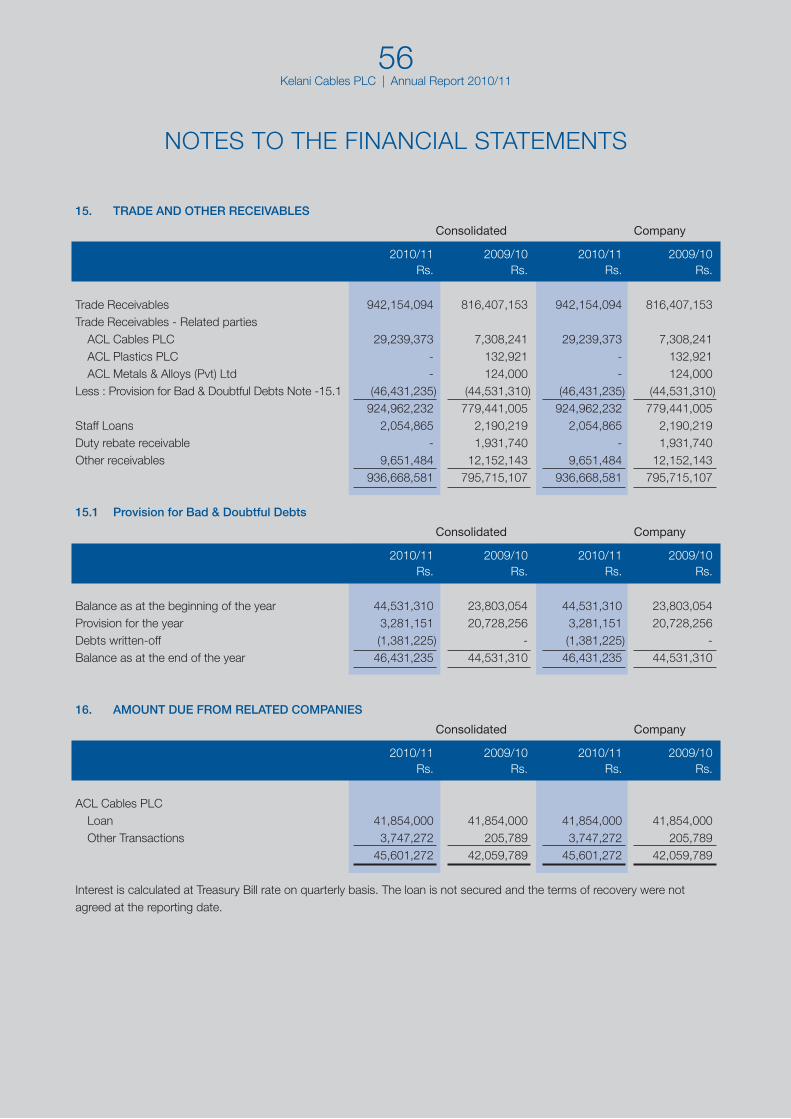
Kelani Cables PLC | Annual Report 2010/1156
15. TRADE AND OTHER RECEIVABLES
Consolidated Company
2010/11 2009/10 2010/11 2009/10 Rs. Rs. Rs. Rs.
Trade Receivables 942,154,094 816,407,153 942,154,094 816,407,153Trade Receivables - Related parties ACL Cables PLC 29,239,373 7,308,241 29,239,373 7,308,241 ACL Plastics PLC - 132,921 - 132,921 ACL Metals & Alloys (Pvt) Ltd - 124,000 - 124,000Less : Provision for Bad & Doubtful Debts Note -15.1 (46,431,235) (44,531,310) (46,431,235) (44,531,310) 924,962,232 779,441,005 924,962,232 779,441,005Staff Loans 2,054,865 2,190,219 2,054,865 2,190,219Duty rebate receivable - 1,931,740 - 1,931,740Other receivables 9,651,484 12,152,143 9,651,484 12,152,143 936,668,581 795,715,107 936,668,581 795,715,107
15.1 Provision for Bad & Doubtful Debts
Consolidated Company
2010/11 2009/10 2010/11 2009/10 Rs. Rs. Rs. Rs.
Balance as at the beginning of the year 44,531,310 23,803,054 44,531,310 23,803,054Provision for the year 3,281,151 20,728,256 3,281,151 20,728,256Debts written-off (1,381,225) - (1,381,225) -Balance as at the end of the year 46,431,235 44,531,310 46,431,235 44,531,310
16. AMOUNT DUE FROM RELATED COMPANIES
Consolidated Company
2010/11 2009/10 2010/11 2009/10 Rs. Rs. Rs. Rs.
ACL Cables PLC Loan 41,854,000 41,854,000 41,854,000 41,854,000 Other Transactions 3,747,272 205,789 3,747,272 205,789 45,601,272 42,059,789 45,601,272 42,059,789
Interest is calculated at Treasury Bill rate on quarterly basis. The loan is not secured and the terms of recovery were not agreed at the reporting date.
NOTES TO THE FINANCIAL STATEMENTS
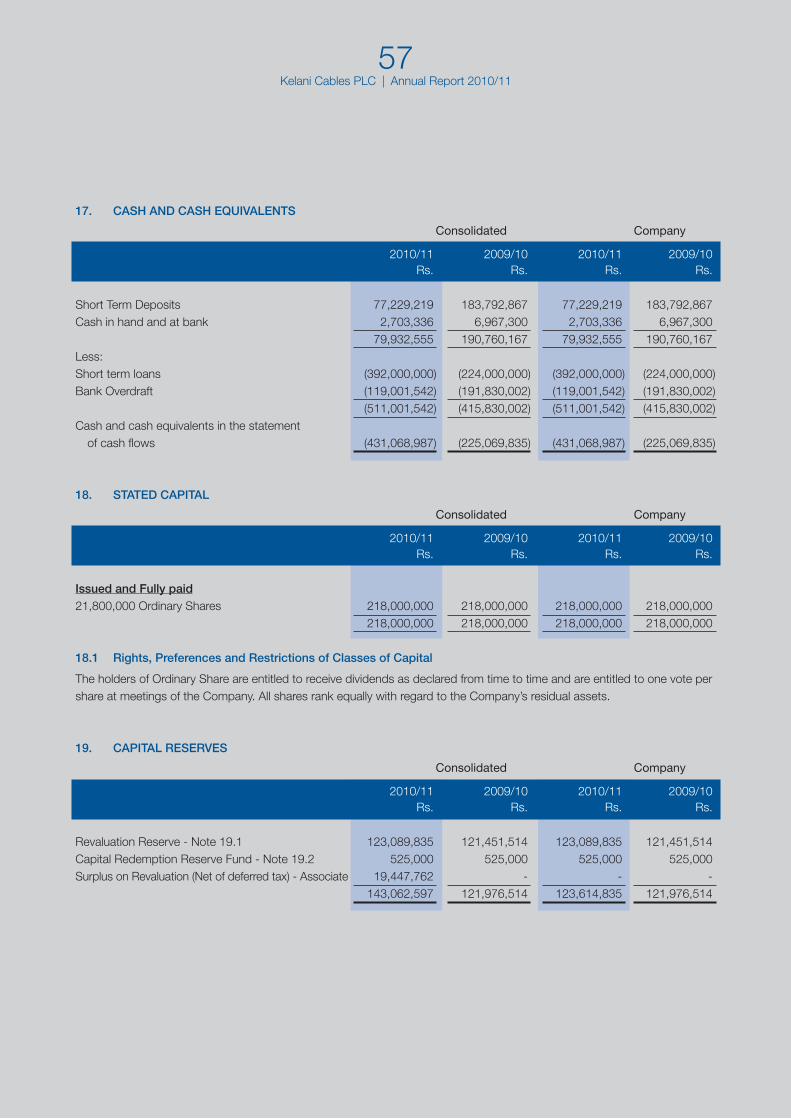
Kelani Cables PLC | Annual Report 2010/1157
17. CASH AND CASH EQUIVALENTS
Consolidated Company
2010/11 2009/10 2010/11 2009/10 Rs. Rs. Rs. Rs.
Short Term Deposits 77,229,219 183,792,867 77,229,219 183,792,867Cash in hand and at bank 2,703,336 6,967,300 2,703,336 6,967,300 79,932,555 190,760,167 79,932,555 190,760,167Less:Short term loans (392,000,000) (224,000,000) (392,000,000) (224,000,000)Bank Overdraft (119,001,542) (191,830,002) (119,001,542) (191,830,002) (511,001,542) (415,830,002) (511,001,542) (415,830,002)Cash and cash equivalents in the statement of cash flows (431,068,987) (225,069,835) (431,068,987) (225,069,835)
18. STATED CAPITAL
Consolidated Company
2010/11 2009/10 2010/11 2009/10 Rs. Rs. Rs. Rs.
Issued and Fully paid21,800,000 Ordinary Shares 218,000,000 218,000,000 218,000,000 218,000,000 218,000,000 218,000,000 218,000,000 218,000,000
18.1 Rights, Preferences and Restrictions of Classes of Capital
The holders of Ordinary Share are entitled to receive dividends as declared from time to time and are entitled to one vote per share at meetings of the Company. All shares rank equally with regard to the Company’s residual assets.
19. CAPITAL RESERVES
Consolidated Company
2010/11 2009/10 2010/11 2009/10 Rs. Rs. Rs. Rs.
Revaluation Reserve - Note 19.1 123,089,835 121,451,514 123,089,835 121,451,514Capital Redemption Reserve Fund - Note 19.2 525,000 525,000 525,000 525,000Surplus on Revaluation (Net of deferred tax) - Associate 19,447,762 - - - 143,062,597 121,976,514 123,614,835 121,976,514
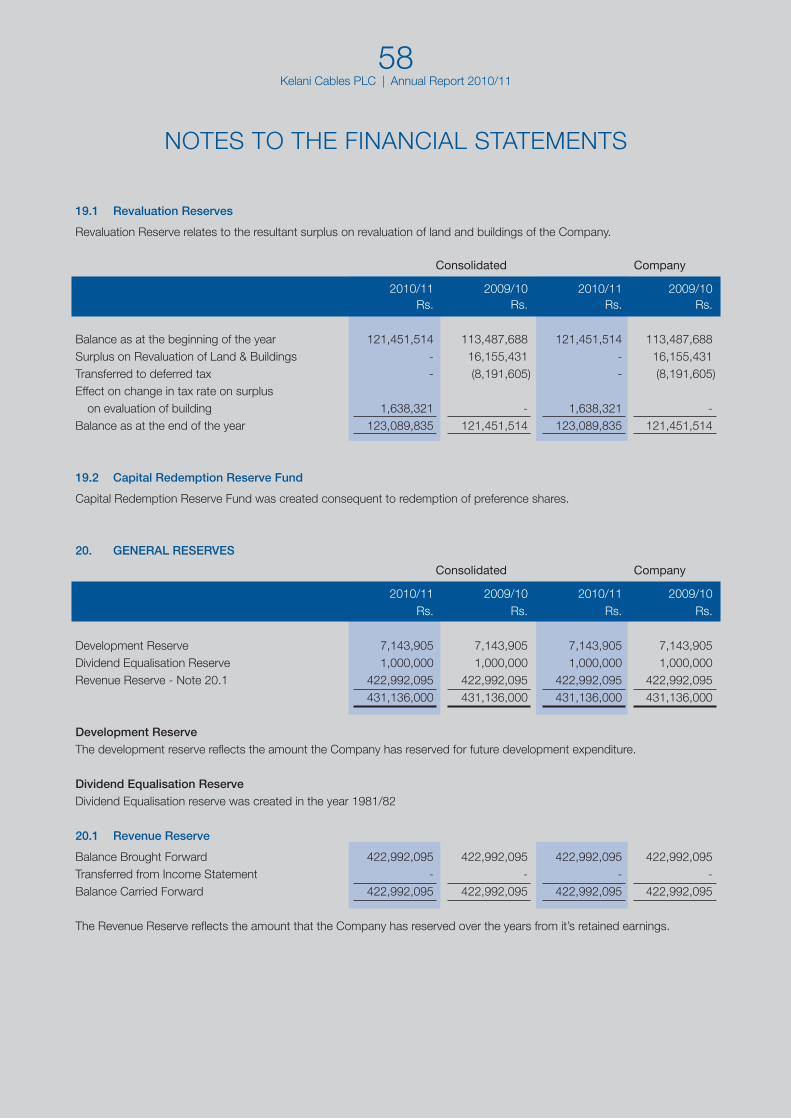
Kelani Cables PLC | Annual Report 2010/1158
19.1 Revaluation Reserves
Revaluation Reserve relates to the resultant surplus on revaluation of land and buildings of the Company.
Consolidated Company
2010/11 2009/10 2010/11 2009/10 Rs. Rs. Rs. Rs.
Balance as at the beginning of the year 121,451,514 113,487,688 121,451,514 113,487,688Surplus on Revaluation of Land & Buildings - 16,155,431 - 16,155,431Transferred to deferred tax - (8,191,605) - (8,191,605)Effect on change in tax rate on surplus on evaluation of building 1,638,321 - 1,638,321 -Balance as at the end of the year 123,089,835 121,451,514 123,089,835 121,451,514
19.2 Capital Redemption Reserve Fund
Capital Redemption Reserve Fund was created consequent to redemption of preference shares.
20. GENERAL RESERVES
Consolidated Company
2010/11 2009/10 2010/11 2009/10 Rs. Rs. Rs. Rs.
Development Reserve 7,143,905 7,143,905 7,143,905 7,143,905Dividend Equalisation Reserve 1,000,000 1,000,000 1,000,000 1,000,000Revenue Reserve - Note 20.1 422,992,095 422,992,095 422,992,095 422,992,095 431,136,000 431,136,000 431,136,000 431,136,000
Development ReserveThe development reserve reflects the amount the Company has reserved for future development expenditure.
Dividend Equalisation ReserveDividend Equalisation reserve was created in the year 1981/82
20.1 Revenue Reserve
Balance Brought Forward 422,992,095 422,992,095 422,992,095 422,992,095Transferred from Income Statement - - - -Balance Carried Forward 422,992,095 422,992,095 422,992,095 422,992,095
The Revenue Reserve reflects the amount that the Company has reserved over the years from it’s retained earnings.
NOTES TO THE FINANCIAL STATEMENTS
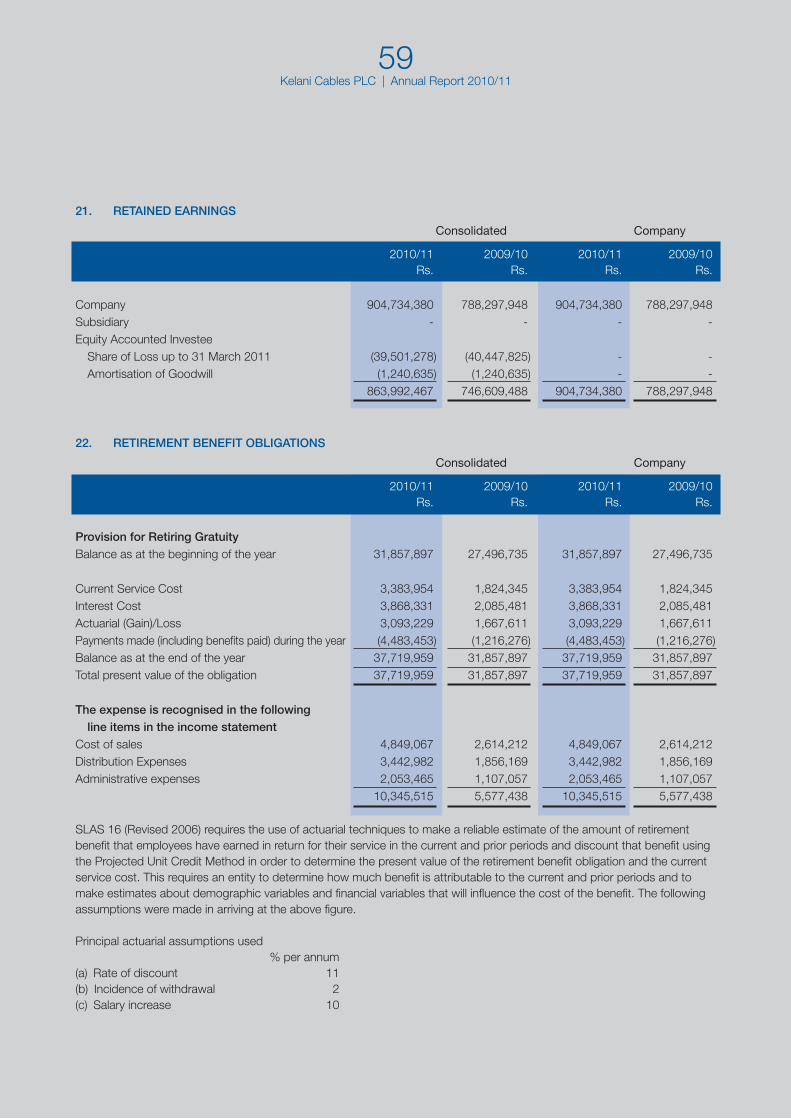
Kelani Cables PLC | Annual Report 2010/1159
21. RETAINED EARNINGS
Consolidated Company
2010/11 2009/10 2010/11 2009/10 Rs. Rs. Rs. Rs.
Company 904,734,380 788,297,948 904,734,380 788,297,948Subsidiary - - - -Equity Accounted Investee Share of Loss up to 31 March 2011 (39,501,278) (40,447,825) - - Amortisation of Goodwill (1,240,635) (1,240,635) - - 863,992,467 746,609,488 904,734,380 788,297,948
22. RETIREMENT BENEFIT OBLIGATIONS
Consolidated Company
2010/11 2009/10 2010/11 2009/10 Rs. Rs. Rs. Rs.
Provision for Retiring GratuityBalance as at the beginning of the year 31,857,897 27,496,735 31,857,897 27,496,735
Current Service Cost 3,383,954 1,824,345 3,383,954 1,824,345Interest Cost 3,868,331 2,085,481 3,868,331 2,085,481Actuarial (Gain)/Loss 3,093,229 1,667,611 3,093,229 1,667,611Payments made (including benefits paid) during the year (4,483,453) (1,216,276) (4,483,453) (1,216,276)Balance as at the end of the year 37,719,959 31,857,897 37,719,959 31,857,897Total present value of the obligation 37,719,959 31,857,897 37,719,959 31,857,897
The expense is recognised in the following line items in the income statementCost of sales 4,849,067 2,614,212 4,849,067 2,614,212Distribution Expenses 3,442,982 1,856,169 3,442,982 1,856,169Administrative expenses 2,053,465 1,107,057 2,053,465 1,107,057 10,345,515 5,577,438 10,345,515 5,577,438
SLAS 16 (Revised 2006) requires the use of actuarial techniques to make a reliable estimate of the amount of retirement benefit that employees have earned in return for their service in the current and prior periods and discount that benefit using the Projected Unit Credit Method in order to determine the present value of the retirement benefit obligation and the current service cost. This requires an entity to determine how much benefit is attributable to the current and prior periods and to make estimates about demographic variables and financial variables that will influence the cost of the benefit. The following assumptions were made in arriving at the above figure.
Principal actuarial assumptions used % per annum(a) Rate of discount 11(b) Incidence of withdrawal 2(c) Salary increase 10
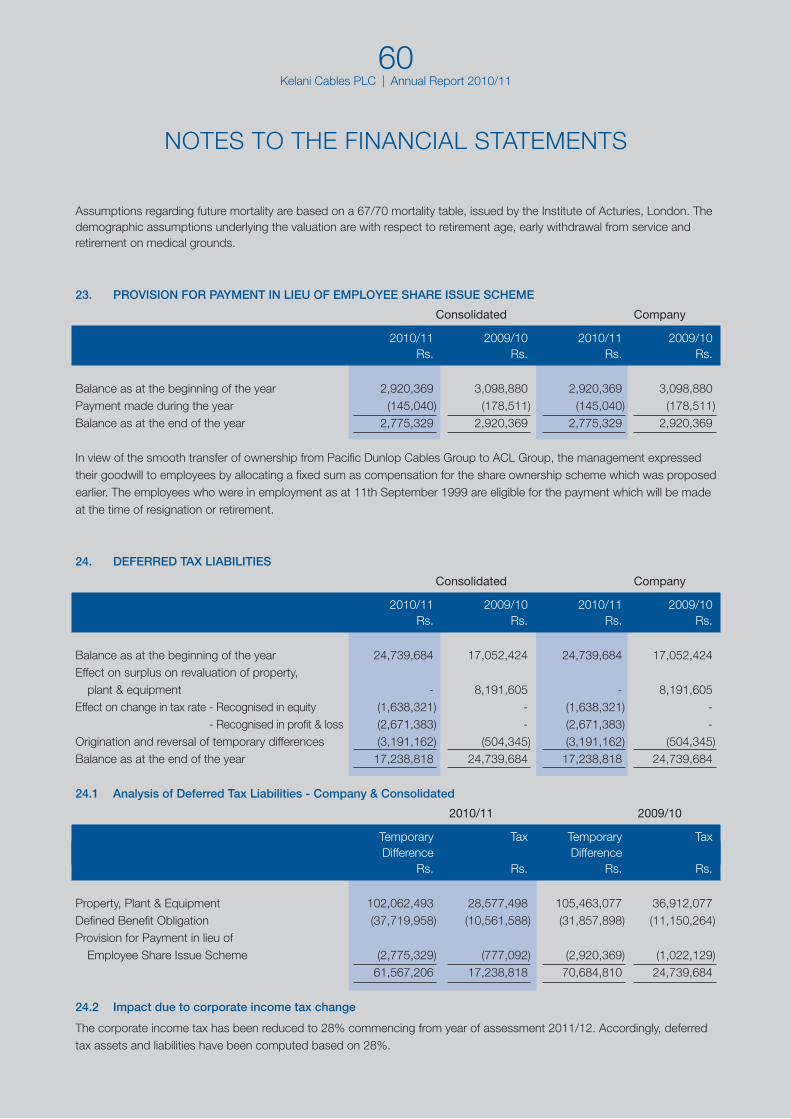
Kelani Cables PLC | Annual Report 2010/1160
Assumptions regarding future mortality are based on a 67/70 mortality table, issued by the Institute of Acturies, London. The demographic assumptions underlying the valuation are with respect to retirement age, early withdrawal from service and retirement on medical grounds.
23. PROVISION FOR PAYMENT IN LIEU OF EMPLOYEE SHARE ISSUE SCHEME
Consolidated Company
2010/11 2009/10 2010/11 2009/10 Rs. Rs. Rs. Rs.
Balance as at the beginning of the year 2,920,369 3,098,880 2,920,369 3,098,880Payment made during the year (145,040) (178,511) (145,040) (178,511)Balance as at the end of the year 2,775,329 2,920,369 2,775,329 2,920,369
In view of the smooth transfer of ownership from Pacific Dunlop Cables Group to ACL Group, the management expressed their goodwill to employees by allocating a fixed sum as compensation for the share ownership scheme which was proposed earlier. The employees who were in employment as at 11th September 1999 are eligible for the payment which will be made at the time of resignation or retirement.
24. DEFERRED TAX LIABILITIES
Consolidated Company
2010/11 2009/10 2010/11 2009/10 Rs. Rs. Rs. Rs.
Balance as at the beginning of the year 24,739,684 17,052,424 24,739,684 17,052,424Effect on surplus on revaluation of property, plant & equipment - 8,191,605 - 8,191,605Effect on change in tax rate - Recognised in equity (1,638,321) - (1,638,321) - - Recognised in profit & loss (2,671,383) - (2,671,383) -Origination and reversal of temporary differences (3,191,162) (504,345) (3,191,162) (504,345)Balance as at the end of the year 17,238,818 24,739,684 17,238,818 24,739,684
24.1 Analysis of Deferred Tax Liabilities - Company & Consolidated
2010/11 2009/10
Temporary Tax Temporary Tax Difference Difference Rs. Rs. Rs. Rs.
Property, Plant & Equipment 102,062,493 28,577,498 105,463,077 36,912,077Defined Benefit Obligation (37,719,958) (10,561,588) (31,857,898) (11,150,264)Provision for Payment in lieu of Employee Share Issue Scheme (2,775,329) (777,092) (2,920,369) (1,022,129) 61,567,206 17,238,818 70,684,810 24,739,684
24.2 Impact due to corporate income tax change
The corporate income tax has been reduced to 28% commencing from year of assessment 2011/12. Accordingly, deferred tax assets and liabilities have been computed based on 28%.
NOTES TO THE FINANCIAL STATEMENTS

Kelani Cables PLC | Annual Report 2010/1161
25. TRADE PAYABLES
Consolidated Company
2010/11 2009/10 2010/11 2009/10 Rs. Rs. Rs. Rs.
Trade Payables 340,099,508 290,994,269 340,099,508 290,994,269Trade Payables - Related parties ACL Cables PLC 63,758,412 27,266,186 63,758,412 27,266,186 ACL Plastics PLC 63,198,699 60,452,539 63,198,699 60,452,539 467,056,619 378,712,994 467,056,619 378,712,994
26. OTHER PAYABLES
Consolidated Company
2010/11 2009/10 2010/11 2009/10 Rs. Rs. Rs. Rs.
Accrued charges 23,503,871 31,806,303 23,503,871 31,806,303Sales Taxes Payable 1,316,739 223,334 1,316,739 223,334Distributors’ Deposits 20,137,572 9,915,224 20,137,572 9,915,224Advance from Debtors 26,206,508 6,337,653 26,206,508 6,337,653ESC Payable 9,743,012 6,402,415 9,743,012 6,402,415Other Payables 5,537,318 2,275,399 5,537,318 2,275,399 86,445,020 56,960,328 86,445,020 56,960,328
27. INCOME TAX PAYABLE
Consolidated Company
2010/11 2009/10 2010/11 2009/10 Rs. Rs. Rs. Rs.
Balance as at the beginning of the year 166,229,155 69,138,205 166,229,155 69,138,205Income tax provision on current years profits 90,433,318 140,286,903 90,433,318 140,286,903 256,662,473 209,425,108 256,662,473 209,425,108Economic Service Charge recoverable (46,749,899) (25,034,721) (46,749,899) (25,034,721)Payments made during the year (191,391,927) (18,161,232) (191,391,927) (18,161,232)Balance as at the end of the year 18,520,647 166,229,155 18,520,647 166,229,155
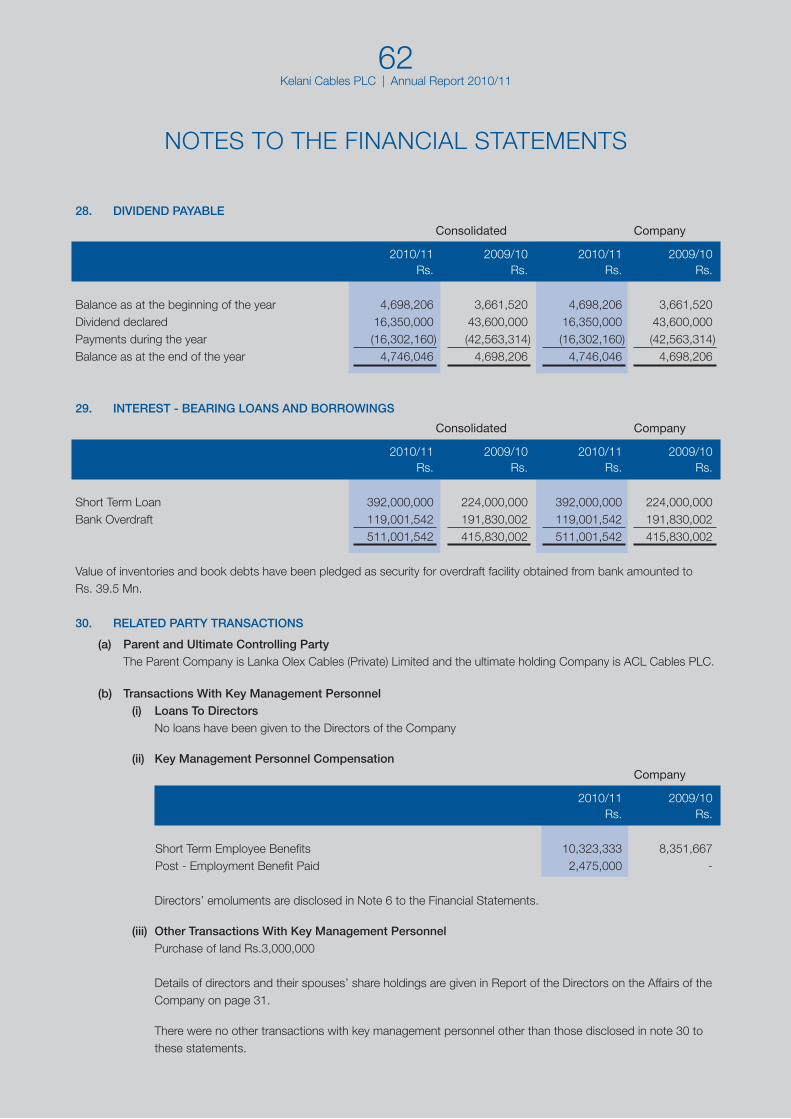
Kelani Cables PLC | Annual Report 2010/1162
28. DIVIDEND PAYABLE
Consolidated Company
2010/11 2009/10 2010/11 2009/10 Rs. Rs. Rs. Rs.
Balance as at the beginning of the year 4,698,206 3,661,520 4,698,206 3,661,520Dividend declared 16,350,000 43,600,000 16,350,000 43,600,000Payments during the year (16,302,160) (42,563,314) (16,302,160) (42,563,314)Balance as at the end of the year 4,746,046 4,698,206 4,746,046 4,698,206
29. INTEREST - BEARING LOANS AND BORROWINGS
Consolidated Company
2010/11 2009/10 2010/11 2009/10 Rs. Rs. Rs. Rs.
Short Term Loan 392,000,000 224,000,000 392,000,000 224,000,000Bank Overdraft 119,001,542 191,830,002 119,001,542 191,830,002 511,001,542 415,830,002 511,001,542 415,830,002
Value of inventories and book debts have been pledged as security for overdraft facility obtained from bank amounted to Rs. 39.5 Mn.
30. RELATED PARTY TRANSACTIONS
(a) Parent and Ultimate Controlling Party The Parent Company is Lanka Olex Cables (Private) Limited and the ultimate holding Company is ACL Cables PLC.
(b) Transactions With Key Management Personnel(i) Loans To Directors No loans have been given to the Directors of the Company
(ii) Key Management Personnel Compensation Company
2010/11 2009/10 Rs. Rs.
Short Term Employee Benefits 10,323,333 8,351,667 Post - Employment Benefit Paid 2,475,000 -
Directors’ emoluments are disclosed in Note 6 to the Financial Statements.
(iii) Other Transactions With Key Management Personnel Purchase of land Rs.3,000,000 Details of directors and their spouses’ share holdings are given in Report of the Directors on the Affairs of the
Company on page 31.
There were no other transactions with key management personnel other than those disclosed in note 30 to these statements.
NOTES TO THE FINANCIAL STATEMENTS
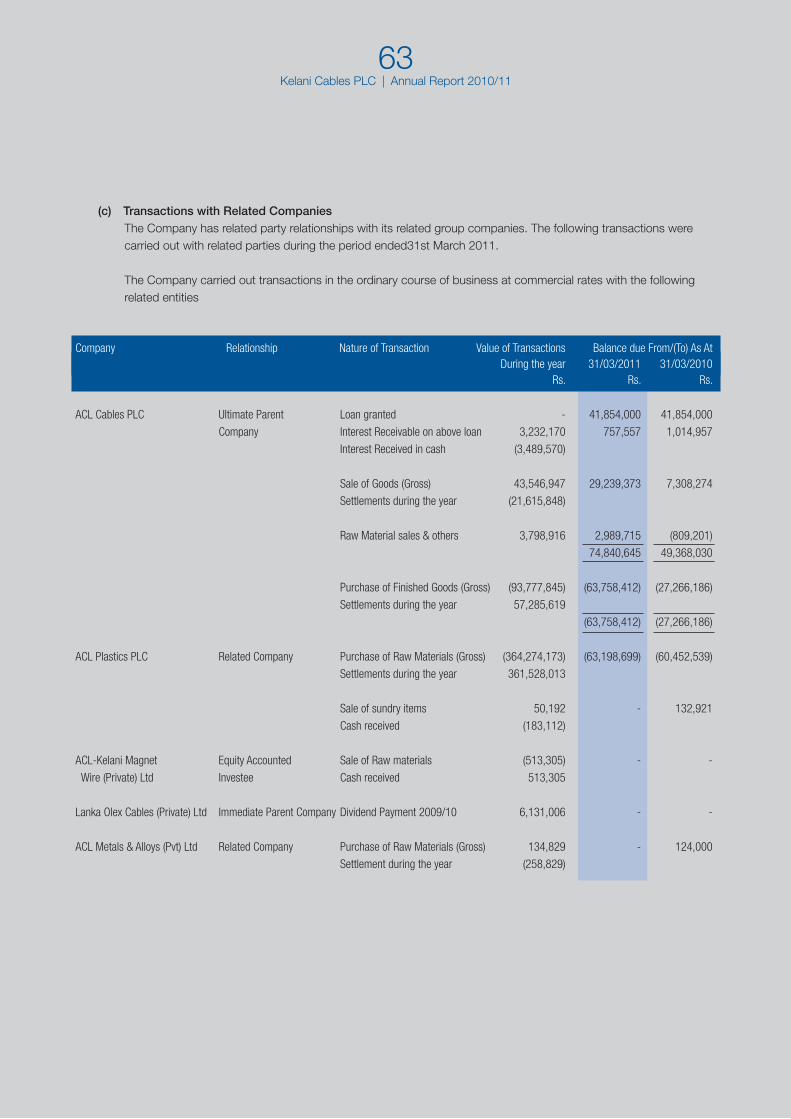
Kelani Cables PLC | Annual Report 2010/1163
(c) Transactions with Related Companies The Company has related party relationships with its related group companies. The following transactions were
carried out with related parties during the period ended31st March 2011.
The Company carried out transactions in the ordinary course of business at commercial rates with the following related entities
Company Relationship Nature of Transaction Value of Transactions Balance due From/(To) As At During the year 31/03/2011 31/03/2010 Rs. Rs. Rs.
ACL Cables PLC Ultimate Parent Loan granted - 41,854,000 41,854,000
Company Interest Receivable on above loan 3,232,170 757,557 1,014,957
Interest Received in cash (3,489,570)
Sale of Goods (Gross) 43,546,947 29,239,373 7,308,274
Settlements during the year (21,615,848)
Raw Material sales & others 3,798,916 2,989,715 (809,201)
74,840,645 49,368,030
Purchase of Finished Goods (Gross) (93,777,845) (63,758,412) (27,266,186)
Settlements during the year 57,285,619
(63,758,412) (27,266,186)
ACL Plastics PLC Related Company Purchase of Raw Materials (Gross) (364,274,173) (63,198,699) (60,452,539)
Settlements during the year 361,528,013
Sale of sundry items 50,192 - 132,921
Cash received (183,112)
ACL-Kelani Magnet Equity Accounted Sale of Raw materials (513,305) - -
Wire (Private) Ltd Investee Cash received 513,305
Lanka Olex Cables (Private) Ltd Immediate Parent Company Dividend Payment 2009/10 6,131,006 - -
ACL Metals & Alloys (Pvt) Ltd Related Company Purchase of Raw Materials (Gross) 134,829 - 124,000
Settlement during the year (258,829)

Kelani Cables PLC | Annual Report 2010/1164
31. CAPITAL COMMITMENTS
There were no material capital commitment as at 31st March 2011
32. CONTINGENT LIABILITY
The contingent liability as at 31st March 2011 on guarantees given to third parties amounted to Rs.106,531,681/-
33. EVENTS AFTER BALANCE SHEET DATE
There are no other events that have occurred after the Balance Sheet date other than those disclosed in note 09 to the Financial Statements which would require adjustments to, or disclosure in the Financial Statements.
NOTES TO THE FINANCIAL STATEMENTS
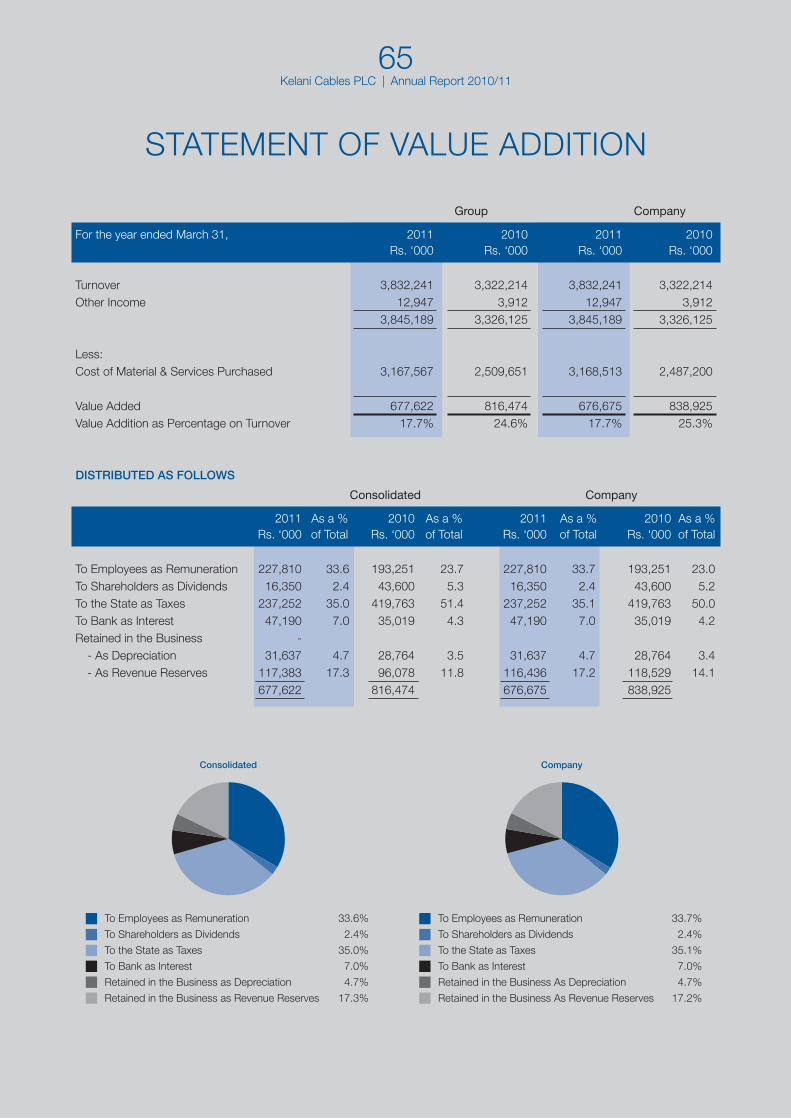
Kelani Cables PLC | Annual Report 2010/1165
Group Company
For the year ended March 31, 2011 2010 2011 2010 Rs. ‘000 Rs. ‘000 Rs. ‘000 Rs. ‘000
Turnover 3,832,241 3,322,214 3,832,241 3,322,214Other Income 12,947 3,912 12,947 3,912 3,845,189 3,326,125 3,845,189 3,326,125
Less:Cost of Material & Services Purchased 3,167,567 2,509,651 3,168,513 2,487,200
Value Added 677,622 816,474 676,675 838,925Value Addition as Percentage on Turnover 17.7% 24.6% 17.7% 25.3%
DISTRIBUTED AS FOLLOWS
Consolidated Company
2011 As a % 2010 As a % 2011 As a % 2010 As a % Rs. ‘000 of Total Rs. ‘000 of Total Rs. ‘000 of Total Rs. ‘000 of Total
To Employees as Remuneration 227,810 33.6 193,251 23.7 227,810 33.7 193,251 23.0To Shareholders as Dividends 16,350 2.4 43,600 5.3 16,350 2.4 43,600 5.2To the State as Taxes 237,252 35.0 419,763 51.4 237,252 35.1 419,763 50.0To Bank as Interest 47,190 7.0 35,019 4.3 47,190 7.0 35,019 4.2Retained in the Business - - As Depreciation 31,637 4.7 28,764 3.5 31,637 4.7 28,764 3.4 - As Revenue Reserves 117,383 17.3 96,078 11.8 116,436 17.2 118,529 14.1 677,622 816,474 676,675 838,925
STATEMENT OF VALUE ADDITION
Consolidated
To Employees as Remuneration 33.6%
To Shareholders as Dividends 2.4%
To the State as Taxes 35.0%
To Bank as Interest 7.0%
Retained in the Business as Depreciation 4.7%
Retained in the Business as Revenue Reserves 17.3%
Company
To Employees as Remuneration 33.7%
To Shareholders as Dividends 2.4%
To the State as Taxes 35.1%
To Bank as Interest 7.0%
Retained in the Business As Depreciation 4.7%
Retained in the Business As Revenue Reserves 17.2%

Kelani Cables PLC | Annual Report 2010/1166
DISTRIBUTION OF SHAREHOLDING - MARCH 31, 2011
Range No of Total % Holders Holding Holding
upto 1000 734 253,140 1.2 1,001 - 5,000 275 708,258 3.2 5,001 - 10,000 65 517,284 2.4 10,001 - 50,000 91 1,798,514 8.3 50,001 - 100,000 4 284,700 1.3 100,001 - 500,000 5 955,000 4.4 500,001 1,000,000 1 933,756 4.3 over 1,000,000 1 16,349,348 75.0 1176 21,800,000
TWENTY LARGEST SHAREHOLDERS AS AT 31ST MARCH
2011 2010 No. of Shares % Holding No. of Shares % Holding
1. Lanka Olex Cables (Private) Ltd 16,349,348 75.0 16,349,348 75.02. ACL Cables PLC 933,756 4.3 933,756 4.33. Employees Trust Fund Board 335,400 1.5 211,000 1.04. Bank of Ceylon-No 2 A/c 323,800 1.5 323,800 1.55. Imitiaz T. L. M. 131,500 0.6 - 0.06. Thaha I. M. 103,500 0.5 103,500 0.57. Aloysius K. 79,600 0.4 79,600 0.48. DPMC Financial Services (Pvt) Ltd.Account No.0 77,700 0.4 - 0.09. Waldock Mackenzie Ltd/Ceylinco Shriram Capital Management 76,600 0.4 127,800 0.610. DPMC Financial Services (Pvt) Ltd.Account No.01 68,700 0.3 14,200 0.111. Dalpethado D. F. G. 68,602 0.3 2 0.012. Goonesekera C. D. M. (Mrs) 62,500 0.3 62,500 0.313. Commercial Bank of Ceylon PLC/ D S L Investment 50,000 0.2 - 0.014. Waldock Mackenzie Ltd/ HI-Line Towers (Private) Ltd 44,900 0.2 - 0.015. Investment Link (Pvt) Ltd 42,600 0.2 42,600 0.216. Vignarajah K. C. 42,420 0.2 42,420 0.217. Al-Nakib M.T.T 40,000 0.2 - 0.018. Kannangara N. L. 40,000 0.2 40,000 0.219. Waas M. J. T. 36,700 0.2 36,700 0.220. Sumathipala U. W. J. P. A. 35,200 0.2 35,200 0.2
INVESTOR INFORMATION
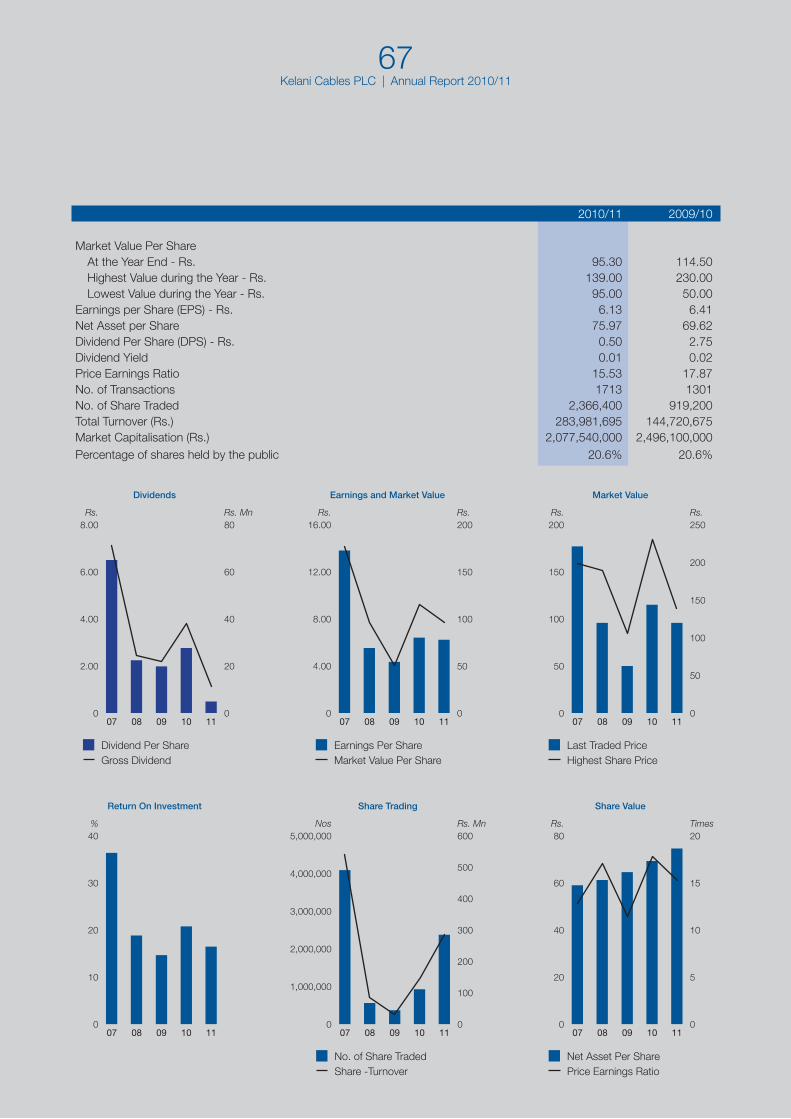
Kelani Cables PLC | Annual Report 2010/1167
2010/11 2009/10
Market Value Per Share At the Year End - Rs. 95.30 114.50 Highest Value during the Year - Rs. 139.00 230.00 Lowest Value during the Year - Rs. 95.00 50.00Earnings per Share (EPS) - Rs. 6.13 6.41Net Asset per Share 75.97 69.62Dividend Per Share (DPS) - Rs. 0.50 2.75Dividend Yield 0.01 0.02Price Earnings Ratio 15.53 17.87No. of Transactions 1713 1301No. of Share Traded 2,366,400 919,200Total Turnover (Rs.) 283,981,695 144,720,675Market Capitalisation (Rs.) 2,077,540,000 2,496,100,000Percentage of shares held by the public 20.6% 20.6%
Net Asset Per SharePrice Earnings Ratio
07 08 09 10 11
Rs. Times
0 0
20 5
40 10
60 15
80 20
Share Value
Earnings Per ShareMarket Value Per Share
07 08 09 10 11
Rs. Rs.
0 0
4.00 50
8.00 100
12.00 150
16.00 200
Earnings and Market Value
07 08 09 10 11
%
0
10
20
30
40
Return On Investment
No. of Share TradedShare -Turnover
Rs. Mn
0
100
200
300
400
500
600
07 08 09 10 11
Nos
0
1,000,000
2,000,000
3,000,000
4,000,000
5,000,000
Share Trading
Last Traded PriceHighest Share Price
Rs.
0
50
100
150
200
250
07 08 09 10 11
Rs.
0
50
100
150
200
Market Value
Dividend Per ShareGross Dividend
Rs. Mn
0
20
40
60
80
07 08 09 10 11
Rs.
0
2.00
4.00
6.00
8.00
Dividends

Kelani Cables PLC | Annual Report 2010/1168
TRADING RESULTS Rs.’000
Year ended 31st March 2011 2010 2009 2008 2007 2006 2005 2004 2003 2002
Turnover 3,832,241 3,322,214 2,829,832 3,126,017 2,833,139 1,756,089 1,179,997 738,078 535,744 524,289
Gross Profit 616,514 695,429 468,715 514,636 671,156 356,764 246,621 128,558 83,650 78,928
Earnings Before Interest & Tax 265,493 314,479 208,049 251,759 469,800 247,482 166,140 55,921 46,701 106,075
Finance Cost (47,190) (35,019) (72,988) (63,040) (14,944) (328) (2,357) (7,391) (11,170) (3,553)Profit before Tax 218,304 279,460 135,061 188,719 454,856 247,154 163,784 48,530 35,531 102,521Taxation (84,571) (139,783) (40,093) (68,034) (153,282) (67,570) (50,830) (12,693) (3,850) (22,302)Profit After Taxation 133,733 139,678 94,968 120,685 301,574 179,584 112,954 35,836 31,682 80,220
BALANCE SHEET
As at 31st March 2011 2010 2009 2008 2007 2006 2005 2004 2003 2002
Stated Capital 218,000 218,000 218,000 218,000 218,000 109,000 54,500 54,500 54,500 54,500Capital Reserves 143,063 121,977 114,013 114,013 114,013 138,952 193,452 193,452 193,452 193,452Revenue Reserves 431,136 431,136 431,136 431,136 432,000 432,000 332,000 282,008 247,008 212,008Retained Earnings 863,992 746,609 650,532 578,387 528,552 211,238 148,005 87,983 101,019 104,338 1,656,191 1,517,722 1,413,681 1,341,536 1,292,564 891,190 727,957 617,943 595,979 564,298
Property, Plant & Equipment 347,144 340,294 331,192 290,324 290,833 198,361 179,688 184,850 203,455 221,220Investments 29,906 9,512 31,963 30,081 39,674 50,108 41,150 35,875 42,500 2,500Investment property 125,000 120,000 120,000 104,000 104,000 - - - - -Current Assets 2,299,645 2,129,865 1,484,874 1,948,602 1,570,989 1,319,551 908,985 659,813 569,713 559,505Current Liabilities (1,087,770) (1,022,431) (506,700) (979,546) (658,359) (639,297) (359,894) (221,738) (180,267) (177,128)Long Term Provisions (57,734) (59,518) (47,648) (51,925) (54,573) (37,533) (41,972) (40,857) (39,422) (41,799) 1,656,191 1,517,722 1,413,681 1,341,536 1,292,564 891,190 727,957 617,943 595,979 564,298
RATIOS
Gross Margin 16.1% 20.9% 16.6% 16.5% 23.7% 20.3% 20.9% 17.4% 15.6% 15.1%Net Margin 3.5% 4.2% 3.4% 3.9% 10.6% 10.2% 9.6% 4.9% 5.9% 15.3%Return of Investment (ROI) 16.0% 20.7% 14.7% 18.8% 36.3% 27.8% 22.8% 9.0% 7.8% 18.8%Return of Average Equity 8.4% 9.5% 7.0% 9.2% 27.6% 22.2% 16.8% 5.9% 5.5% 15.1%Assets Turnover 2.3 2.2 2.0 2.3 2.2 2.0 1.6 1.2 0.9 0.9Working capital turnover 3.2 3.0 2.9 3.2 3.1 2.6 2.1 1.7 1.4 1.4Current Ratio 2.1 2.1 2.9 2.0 2.4 2.1 2.5 3.0 3.2 3.2Total Debts to Equity 0.31 0.27 0.14 0.32 0.16 0.03 0.01 0.13 0.17 0.14Net Asset Per Share (re stated) 75.97 69.62 64.85 61.54 59.29 40.88 33.39 28.35 27.34 25.89Dividend Per Share (DPS) - Rs. 0.50 2.75 2.00 2.25 6.50 3.00 3.00 3.00 2.50 2.50Earnings per Share (EPS) - Rs. 6.13 6.41 4.36 5.54 13.83 8.24 5.18 1.64 1.45 3.68Market Price per Share - End Rs. 95.30 114.50 49.75 95.25 177.00 80.00 129.00 36.00 38.50 40.00Dividend Yield (%) 0.01 0.02 0.04 0.02 0.04 3.75 2.33 8.33 6.49 6.25Price Earnings Ratio 15.53 17.87 11.42 17.21 12.79 9.71 24.90 21.90 26.49 10.87
DECADE AT A GLANCE
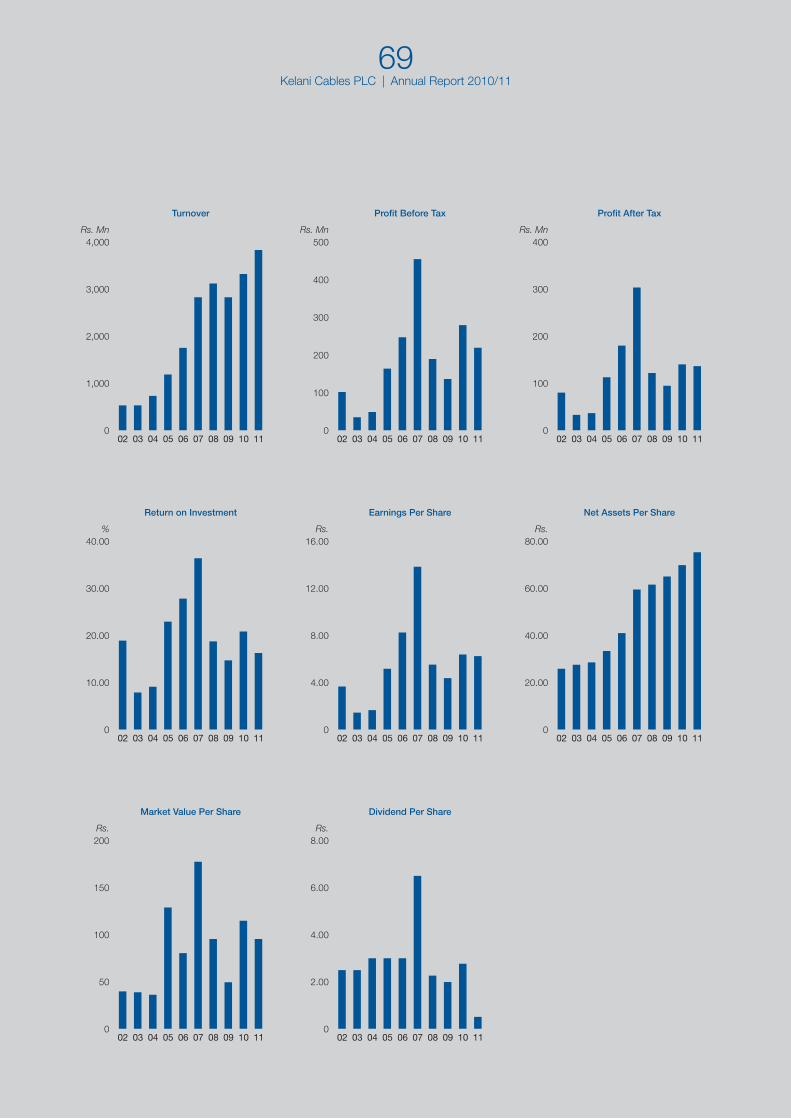
Kelani Cables PLC | Annual Report 2010/1169
Rs.
0
4.00
8.00
12.00
16.00
Earnings Per Share
02 03 04 05 06 07 08 09 10 11
Rs.
0
50
100
150
200
Market Value Per Share
02 03 04 05 06 07 08 09 10 11
Rs.
0
2.00
4.00
6.00
8.00
Dividend Per Share
02 03 04 05 06 07 08 09 10 11
Rs.
0
20.00
40.00
60.00
80.00
Net Assets Per Share
02 03 04 05 06 07 08 09 10 11
Rs. Mn
0
100
200
300
400
Profit After Tax
02 03 04 05 06 07 08 09 10 11
%
0
10.00
20.00
30.00
40.00
Return on Investment
02 03 04 05 06 07 08 09 10 11
Rs. Mn
0
100
200
300
400
500
Profit Before Tax
02 03 04 05 06 07 08 09 10 11
Rs. Mn
0
1,000
2,000
3,000
4,000
Turnover
02 03 04 05 06 07 08 09 10 11
Kelani Cables PLC | Annual Report 2010/1170
GLOSSARY OF FINANCIAL TERMS
Capital Employed
Shareholders' Funds plus Minority Interest and Debt.
Cash Equivalents
Liquid investments with original maturity periods of three months or less
Current Ratio
Current Assets divided by Current Liabilities.
Debts to Equity Ratio
Debts as a percentage of total equity less minority interest if any.
Deferred Taxation
The tax effect of timing differences deferred to/from other periods, which would only qualify for inclusion on a tax return at a future date.
Dividend Yield
Effective Dividend per share as percentage of the Share Price at the end of the period.
Dividend per Share
Gross dividend divided by the number of ordinary shares in issue at the year end.
Earnings per Share
Profit Attributeble to Shareholders divided by the weighted average number of ordinary shares in issue during the period.
EBIT
Earnings before Interest and Tax (Including Operating Income)
Equity Accounted Investee
A Company other than a subsidiary in which a holding company has a participating interest and exercises significant influence over its operating and financial policies.
Market Capitalisation
Number of shares in issue multiplied by the market value of a share at the reported date
Net Assets
Total Assets minus Current Liabilities minus Long Term Liabilities minus Minority Interests.
Net Assets per Share
Net Assets over number of Ordinary Shares in issue.
Net Margin
Profit after Tax divided by Turnover
Price Earnings Ratio
Market Price of a share divided by earnings per share as reported at that date
Quick Ratio
Cash plus Short Term Investments plus Receivables, divided by Current Liabilities.
Related Parties
Parties who could control or significantly influence the financial and operating policies of the business.
Return on Average Equity
Profit attributable to Shareholders as a percentage of Average Shareholders’ Funds.
Revenue Reserves
Reserves considered as being available for distributions and investment.
Value Addition
The quantum of wealth generated by the activities of the Group measured as the difference between net revenue (including other Income) and the cost of materials and services bought in.
Working Capital
Capital required to finance day-to-day operations computed as the excess of current assets over current liabilities
Kelani Cables PLC | Annual Report 2010/1171
NOTICE IS HEREBY GIVEN that the Forty Second Annual General Meeting of Kelani Cables PLC will be held at No 60, Rodney Street, Colombo - 08, on Monday the 12th of September 2011 at 10.00 a.m. for the following purposes.
1. To receive and adopt the Report of the Directors and the Statement of Accounts for the year ended 31st March 2011 with the Report of the Auditors thereon.
2. To re-elect as Director, Dr. Bandula Perera who retires by rotation in terms of Article 85 and being eligible for re-election in terms of Article 86, of the Articles of Association of the Company.
3. To reappoint Messrs KPMG Ford, Rhodes, Thornton & Co., as Auditors of the Company and to authorise the Directors to determine their remuneration.
4. To consider and if thought fit to pass the following Ordinary Resolution of which special notice has been given by a Shareholder of the Company.
“that Mr. U.G. Madanayake, who has passed the age of 70 years in May 2006 be and is hereby appointed a Director of the Company and that the age limit of 70 years referred to in Section 210 of the Companies Act No. 07 of 2007, shall not apply to him.”
5. To authorise the Directors to determine donations to charities.
By Order of the Board
(Sgd.)Corporate Affairs (Private) Limited Company Secretaries
5th August 2011
Note:(a) A Shareholder is entitled to appoint a Proxy to attend and vote in his stead and a Form of Proxy is attached to this
Report for that purpose. A Proxy need not be a Shareholder of the Company.
(b) Shareholders are kindly requested to bring duly perfected and signed Attendance Slip along with them when attending the Meeting and handover for registration.
NOTICE OF MEETING

Kelani Cables PLC | Annual Report 2010/1172
.... . . . . . . . . . . . . . . . . . . . . . . . . . . . . . . . . . . . . . . . . . . . . . . . . . . . . . . . . . . . . . . . . . . . . . . . . . . . . . . . . . . . . . . . . . . . . . . . . . . . . . . . . . . . . . . . . . . . . . . . . . . . . . . . . . . . . . . . . .
. . . . . . . . . . . . . . . . . . . . . . . . . . . . . . . . . . . . . . . . . . . . . . . . . . . . . . . . . . . . . . . . . . . . . . . . . . . . . . . . . . . . . . . . . . . . . . . . . . . . . . . . . . . . . . . . . . . . . . . . . . . . . . . . . . . . . . . . . . . . .
. . . . . . . . . . . . . . . . . . . . . . . . . . . . . . . . . . . . . . . . . . . . . . . . . . . . . . . . . . . . . . . . . . . . . . . . . . . . . . . . . . . . . . . . . . . . . . . . . . . . . . . . . . . . . . . . . . . . . . . . . . . . . . . . . . . . . . . . . . . . .
. . . . . . . . . . . . . . . . . . . . . . . . . . . . . . . . . . . . . . . . . . . . . . . . . . . . . . . . . . . . . . . . . . . . . . . . . . . . . . . . . . . . . . . . . . . . . . . . . . . . . . . . . . . . . . . . . . . . . . . . . . . . . . . . . . . . . . . . . . . . .
. . . . . . . . . . . . . . . . . . . . . . . . . . . . . . . . . . . . . . . . . . . . . . . . . . . . . . . . . . . . . . . . . . . . . . . . . . . . . . . . . . . . . . . . . . . . . . . . . . . . . . . . . . . . . . . . . . . . . . . . . . . . . . . . . . . . . . . . . . . . .
. . . . . . . . . . . . . . . . . . . . . . . . . . . . . . . . . . . . . . . . . . . . . . . . . . . . . . . . . . . . . . . . . . . . . . . . . . . . . . . . . . . . . . . . . . . . . . . . . . . . . . . . . . . . . . . . . . . . . . . . . . . . . . . . . . . . . . . . . . . . .
. . . . . . . . . . . . . . . . . . . . . . . . . . . . . . . . . . . . . . . . . . . . . . . . . . . . . . . . . . . . . . . . . . . . . . . . . . . . . . . . . . . . . . . . . . . . . . . . . . . . . . . . . . . . . . . . . . . . . . . . . . . . . . . . . . . . . . . . . . . . .
. . . . . . . . . . . . . . . . . . . . . . . . . . . . . . . . . . . . . . . . . . . . . . . . . . . . . . . . . . . . . . . . . . . . . . . . . . . . . . . . . . . . . . . . . . . . . . . . . . . . . . . . . . . . . . . . . . . . . . . . . . . . . . . . . . . . . . . . . . . . .
. . . . . . . . . . . . . . . . . . . . . . . . . . . . . . . . . . . . . . . . . . . . . . . . . . . . . . . . . . . . . . . . . . . . . . . . . . . . . . . . . . . . . . . . . . . . . . . . . . . . . . . . . . . . . . . . . . . . . . . . . . . . . . . . . . . . . . . . . . . . .
. . . . . . . . . . . . . . . . . . . . . . . . . . . . . . . . . . . . . . . . . . . . . . . . . . . . . . . . . . . . . . . . . . . . . . . . . . . . . . . . . . . . . . . . . . . . . . . . . . . . . . . . . . . . . . . . . . . . . . . . . . . . . . . . . . . . . . . . . . . . .
. . . . . . . . . . . . . . . . . . . . . . . . . . . . . . . . . . . . . . . . . . . . . . . . . . . . . . . . . . . . . . . . . . . . . . . . . . . . . . . . . . . . . . . . . . . . . . . . . . . . . . . . . . . . . . . . . . . . . . . . . . . . . . . . . . . . . . . . . . . . .
. . . . . . . . . . . . . . . . . . . . . . . . . . . . . . . . . . . . . . . . . . . . . . . . . . . . . . . . . . . . . . . . . . . . . . . . . . . . . . . . . . . . . . . . . . . . . . . . . . . . . . . . . . . . . . . . . . . . . . . . . . . . . . . . . . . . . . . . . . . . .
. . . . . . . . . . . . . . . . . . . . . . . . . . . . . . . . . . . . . . . . . . . . . . . . . . . . . . . . . . . . . . . . . . . . . . . . . . . . . . . . . . . . . . . . . . . . . . . . . . . . . . . . . . . . . . . . . . . . . . . . . . . . . . . . . . . . . . . . . . . . .
. . . . . . . . . . . . . . . . . . . . . . . . . . . . . . . . . . . . . . . . . . . . . . . . . . . . . . . . . . . . . . . . . . . . . . . . . . . . . . . . . . . . . . . . . . . . . . . . . . . . . . . . . . . . . . . . . . . . . . . . . . . . . . . . . . . . . . . . . . . . .
. . . . . . . . . . . . . . . . . . . . . . . . . . . . . . . . . . . . . . . . . . . . . . . . . . . . . . . . . . . . . . . . . . . . . . . . . . . . . . . . . . . . . . . . . . . . . . . . . . . . . . . . . . . . . . . . . . . . . . . . . . . . . . . . . . . . . . . . . . . . .
. . . . . . . . . . . . . . . . . . . . . . . . . . . . . . . . . . . . . . . . . . . . . . . . . . . . . . . . . . . . . . . . . . . . . . . . . . . . . . . . . . . . . . . . . . . . . . . . . . . . . . . . . . . . . . . . . . . . . . . . . . . . . . . . . . . . . . . . . . . . .
. . . . . . . . . . . . . . . . . . . . . . . . . . . . . . . . . . . . . . . . . . . . . . . . . . . . . . . . . . . . . . . . . . . . . . . . . . . . . . . . . . . . . . . . . . . . . . . . . . . . . . . . . . . . . . . . . . . . . . . . . . . . . . . . . . . . . . . . . . . . .
. . . . . . . . . . . . . . . . . . . . . . . . . . . . . . . . . . . . . . . . . . . . . . . . . . . . . . . . . . . . . . . . . . . . . . . . . . . . . . . . . . . . . . . . . . . . . . . . . . . . . . . . . . . . . . . . . . . . . . . . . . . . . . . . . . . . . . . . . . . . .
. . . . . . . . . . . . . . . . . . . . . . . . . . . . . . . . . . . . . . . . . . . . . . . . . . . . . . . . . . . . . . . . . . . . . . . . . . . . . . . . . . . . . . . . . . . . . . . . . . . . . . . . . . . . . . . . . . . . . . . . . . . . . . . . . . . . . . . . . . . . .
. . . . . . . . . . . . . . . . . . . . . . . . . . . . . . . . . . . . . . . . . . . . . . . . . . . . . . . . . . . . . . . . . . . . . . . . . . . . . . . . . . . . . . . . . . . . . . . . . . . . . . . . . . . . . . . . . . . . . . . . . . . . . . . . . . . . . . . . . . . . .
. . . . . . . . . . . . . . . . . . . . . . . . . . . . . . . . . . . . . . . . . . . . . . . . . . . . . . . . . . . . . . . . . . . . . . . . . . . . . . . . . . . . . . . . . . . . . . . . . . . . . . . . . . . . . . . . . . . . . . . . . . . . . . . . . . . . . . . . . . . . .
. . . . . . . . . . . . . . . . . . . . . . . . . . . . . . . . . . . . . . . . . . . . . . . . . . . . . . . . . . . . . . . . . . . . . . . . . . . . . . . . . . . . . . . . . . . . . . . . . . . . . . . . . . . . . . . . . . . . . . . . . . . . . . . . . . . . . . . . . . . . .
. . . . . . . . . . . . . . . . . . . . . . . . . . . . . . . . . . . . . . . . . . . . . . . . . . . . . . . . . . . . . . . . . . . . . . . . . . . . . . . . . . . . . . . . . . . . . . . . . . . . . . . . . . . . . . . . . . . . . . . . . . . . . . . . . . . . . . . . . . . . .
. . . . . . . . . . . . . . . . . . . . . . . . . . . . . . . . . . . . . . . . . . . . . . . . . . . . . . . . . . . . . . . . . . . . . . . . . . . . . . . . . . . . . . . . . . . . . . . . . . . . . . . . . . . . . . . . . . . . . . . . . . . . . . . . . . . . . . . . . . . . .
. . . . . . . . . . . . . . . . . . . . . . . . . . . . . . . . . . . . . . . . . . . . . . . . . . . . . . . . . . . . . . . . . . . . . . . . . . . . . . . . . . . . . . . . . . . . . . . . . . . . . . . . . . . . . . . . . . . . . . . . . . . . . . . . . . . . . . . . . . . . .
. . . . . . . . . . . . . . . . . . . . . . . . . . . . . . . . . . . . . . . . . . . . . . . . . . . . . . . . . . . . . . . . . . . . . . . . . . . . . . . . . . . . . . . . . . . . . . . . . . . . . . . . . . . . . . . . . . . . . . . . . . . . . . . . . . . . . . . . . . . . .
. . . . . . . . . . . . . . . . . . . . . . . . . . . . . . . . . . . . . . . . . . . . . . . . . . . . . . . . . . . . . . . . . . . . . . . . . . . . . . . . . . . . . . . . . . . . . . . . . . . . . . . . . . . . . . . . . . . . . . . . . . . . . . . . . . . . . . . . . . . . .
. . . . . . . . . . . . . . . . . . . . . . . . . . . . . . . . . . . . . . . . . . . . . . . . . . . . . . . . . . . . . . . . . . . . . . . . . . . . . . . . . . . . . . . . . . . . . . . . . . . . . . . . . . . . . . . . . . . . . . . . . . . . . . . . . . . . . . . . . . . . .
. . . . . . . . . . . . . . . . . . . . . . . . . . . . . . . . . . . . . . . . . . . . . . . . . . . . . . . . . . . . . . . . . . . . . . . . . . . . . . . . . . . . . . . . . . . . . . . . . . . . . . . . . . . . . . . . . . . . . . . . . . . . . . . . . . . . . . . . . . . . .
. . . . . . . . . . . . . . . . . . . . . . . . . . . . . . . . . . . . . . . . . . . . . . . . . . . . . . . . . . . . . . . . . . . . . . . . . . . . . . . . . . . . . . . . . . . . . . . . . . . . . . . . . . . . . . . . . . . . . . . . . . . . . . . . . . . . . . . . . . . . .
. . . . . . . . . . . . . . . . . . . . . . . . . . . . . . . . . . . . . . . . . . . . . . . . . . . . . . . . . . . . . . . . . . . . . . . . . . . . . . . . . . . . . . . . . . . . . . . . . . . . . . . . . . . . . . . . . . . . . . . . . . . . . . . . . . . . . . . . . . . . .
. . . . . . . . . . . . . . . . . . . . . . . . . . . . . . . . . . . . . . . . . . . . . . . . . . . . . . . . . . . . . . . . . . . . . . . . . . . . . . . . . . . . . . . . . . . . . . . . . . . . . . . . . . . . . . . . . . . . . . . . . . . . . . . . . . . . . . . . . . . . .
. . . . . . . . . . . . . . . . . . . . . . . . . . . . . . . . . . . . . . . . . . . . . . . . . . . . . . . . . . . . . . . . . . . . . . . . . . . . . . . . . . . . . . . . . . . . . . . . . . . . . . . . . . . . . . . . . . . . . . . . . . . . . . . . . . . . . . . . . . . . .
. . . . . . . . . . . . . . . . . . . . . . . . . . . . . . . . . . . . . . . . . . . . . . . . . . . . . . . . . . . . . . . . . . . . . . . . . . . . . . . . . . . . . . . . . . . . . . . . . . . . . . . . . . . . . . . . . . . . . . . . . . . . . . . . . . . . . . . . . . . . .
. . . . . . . . . . . . . . . . . . . . . . . . . . . . . . . . . . . . . . . . . . . . . . . . . . . . . . . . . . . . . . . . . . . . . . . . . . . . . . . . . . . . . . . . . . . . . . . . . . . . . . . . . . . . . . . . . . . . . . . . . . . . . . . . . . . . . . . . . . . . .
NOTES
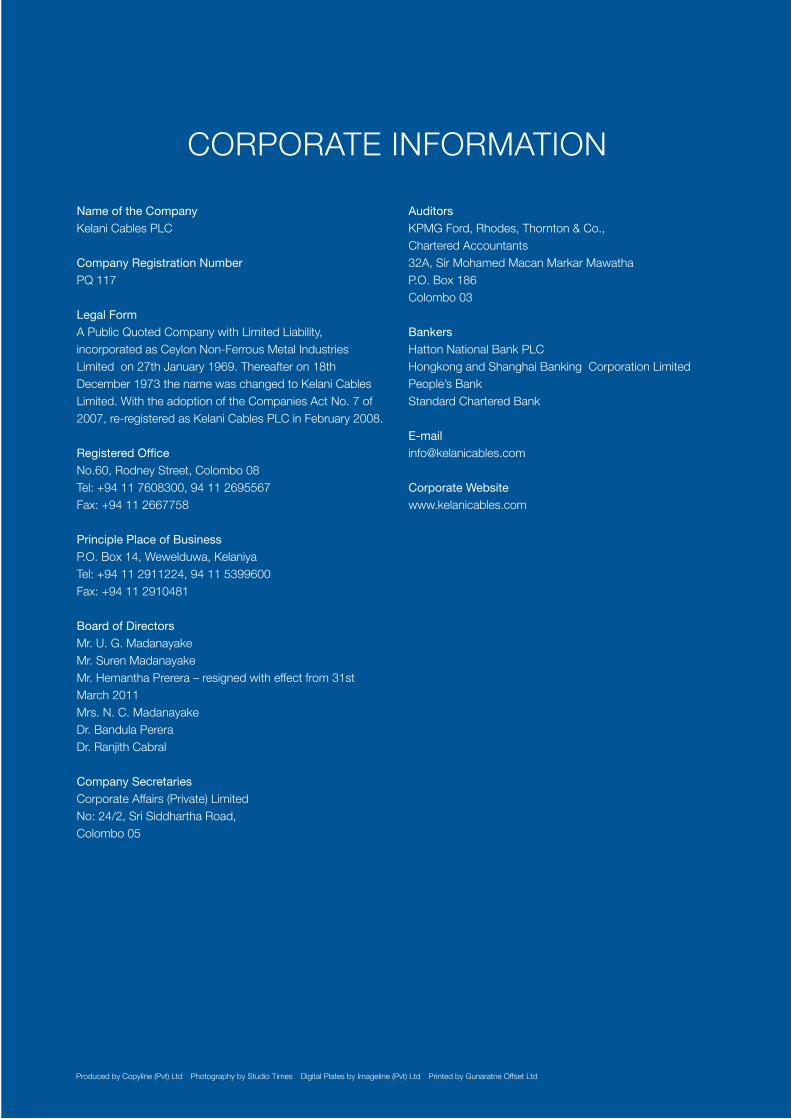
ContentsOur History 2
Financial Highlights 4
Chairman’s Review 6
Board of Directors 10
Senior and Middle Management Team 12
Operational Review 14
Product Portfolio 16
Corporate Social Responsibility 18
Human Resources 19
Risk Management 21
Corporate Governance 25
Audit Committee Report 29
Remuneration Committee Report 30
Report of The Directors 31
Directors’ Responsibility For Financial Reporting 33
Financial Information
Independent Auditors’ Report 37
Income Statement 38
Balance Sheet 39
Statement of Changes in Equity 40
Cash Flow Statement 41
Notes to the Financial Statements 42
Statement of Value Addition 65
Investor Information 66
Decade at a Glance 68
Glossary of Financial Terms 70
Notice of Meeting 71
Notes 72
Corporate Information Inner Back Cover
Name of the CompanyKelani Cables PLC
Company Registration NumberPQ 117
Legal FormA Public Quoted Company with Limited Liability, incorporated as Ceylon Non-Ferrous Metal Industries Limited on 27th January 1969. Thereafter on 18th December 1973 the name was changed to Kelani Cables Limited. With the adoption of the Companies Act No. 7 of 2007, re-registered as Kelani Cables PLC in February 2008.
Registered OfficeNo.60, Rodney Street, Colombo 08Tel: +94 11 7608300, 94 11 2695567Fax: +94 11 2667758
Principle Place of Business P.O. Box 14, Wewelduwa, KelaniyaTel: +94 11 2911224, 94 11 5399600Fax: +94 11 2910481
Board of DirectorsMr. U. G. MadanayakeMr. Suren MadanayakeMr. Hemantha Prerera – resigned with effect from 31st March 2011Mrs. N. C. MadanayakeDr. Bandula PereraDr. Ranjith Cabral
Company Secretaries Corporate Affairs (Private) LimitedNo: 24/2, Sri Siddhartha Road,Colombo 05
AuditorsKPMG Ford, Rhodes, Thornton & Co.,Chartered Accountants32A, Sir Mohamed Macan Markar MawathaP.O. Box 186Colombo 03
BankersHatton National Bank PLCHongkong and Shanghai Banking Corporation LimitedPeople’s BankStandard Chartered Bank
Corporate Websitewww.kelanicables.com
CORPORATE INFORMATION
Produced by Copyline (Pvt) Ltd Photography by Studio Times Digital Plates by Imageline (Pvt) Ltd Printed by Gunaratne Offset Ltd

www.kelanicables.com
Kelani C
ables PLC
| Annual R
eport 2010/11