Embed Size (px)
Citation preview

1
GOVERNMENT OF KERALA
KERALA
MARINE FISHERIES STATISTICS
2015
Published by
Director of Fisheries
Prepared by:
Statistical Cell, Directorate of Fisheries
Vikas Bhavan, Thiruvananthapuram

2

3
Preface
Kerala has a coastline of 590 Km. The Exclusive Economic Zone (EEZ) of the state is 2.18
lakh sq. Km. The state has the right for regulating fishing and related activities in the sea upto a
distance of 12 Nautical Mile. The state has territorial waters of about 13000 Sq. Km. Fishing activity
plays a prominent role in the economy of the state. State fisheries sector contribute 1.58% of the
state GDP. Fish products worth Rs. 5166 Crore exported from Kerala during 2014-15. This is 15%
of the all India export of marine products.
Considering basic demands, the Government of Kerala have taken various programmes to
strengthen marine fisheries sector of the state. The major thrust area of the Fisheries Depatment for
the last few years was to create basic infrastructure facilities like housing, sanitation and house
repair of the fishermen. The activities of the Fisheries Department include welfare schemes,
employment generation schemes, women empowerment schemes and infrastructure development
schemes.
I have great pleasure in presenting ‘Marine Fisheries Statistics of Kerala 2015’. The
publication is brought out with updated and new data. All the essential statistical data related to
marine fisheries sector of Kerala is incorporated in this book. I hope this publication is useful to
planners, administrators, entrepreneurs, researchers and other data users.
This publication is prepared by the officers in the Statistical Cell of the Directorate of
Fisheries Department. I express my sincere thanks to them for their valuable work.
Any suggestion towards the improvement of this book will be highly appreciated.
Thiruvananthapuram Mini Antony IAS
12 -02- 2016 Director of Fisheries

4

Kerala Marine Fisheries Statistics 2015
5
Index
Sl. No. Contents Page No.
An Introduction 9-18
Table No
1 District Wise Distribution of Coast Line of Kerala 19
2 District-wise distribution of Exclusive Economic Zone (EEZ) &Continental Shelf of Kerala
19
3 Details of Fisheries Schools under the Fisheries Department 20
4 Details of Dispensaries constructed by the Fisheries Department 21
5 Details of Fishermen Co-operative Societies in Kerala 22
6 Fishing Harbours in Kerala 23
7 Expenditure incurred for the Fishing Harbours (completed) by the Harbour Engineering Department
23
8 Existing rates of user charges/fees for various services/facilities rendered by Harbour Engineering Departments
24
9 Details of Revenue Collection in Various Fishing Harbours and Fish Landing Centres
26
10 Marine Fish Landing Centres in Kerala 27
11 Fish Landing Centres 30
12 District wise Fishermen Population 2014-15 (estimated) 32
13 District-wise Marine Fishermen Population in Kerala for 2012-13, 2013-14 & 2014-15 (estimated)
33
14 District-wise Number of Active Marine Fishermen & their families in Kerala for 2012-13, 2013-14 & 2014-15
34
15 % distribution of Active Marine Fishermen to the Marine Population in Kerala for 2012-13, 2013-14 & 2014-15
35
16 District-wise Number of Allied worker Fishermen in Kerala for 2012-13, 2013-14 & 2014-15
36
17 District-wise Number of Fish Vendors in Kerala during 2014-15 37
18 District-wise details of OBM verification held on 8-03-2015 38
19 District-wise details of Housing Scheme for 2012-13 to 2015-16 39
20 District-wise details of House Repair for 2013-14 & 2015-16 40

6
Sl. No. Contents Page No.
21 District-wise details of Sanitation scheme for 2012-13 to 2015-16 41
22 District-wise details of House Construction & House Repair in the scheme “Colony Revamping”
42
23 District-wise details of Education Concession for 2012-13, 2013-14 & 2014-15
43
24 Course-wise details of Education Concession during 2014-15 44
25 Gender-wise details of Education Concession during 2014-15 45
26 Fisheries stations and their operational Area 46
27 No. of sea patrollings, rescue operations & fishermen rescued during 2012-13, 2013-14 & 2014-15
46
28 The existing rates of fee for Registration and licensing of fishing vessels as per Kerala Marine Fishing Regulation Act
47
29 Details of fishing vessels registered in Kerala as on 11/11/2015 48
30 Annual Trawl Ban Periods in Kerala since inception 49
31 Details of Free Ration 50
32 No. of Marine fisherfolk under Savings cum Relief Scheme from 2010-11 to 2014-15
51
33 Year-wise details of the scheme 'Suitable components of fishing gear” 52
34 Year-wise details of the scheme 'Bankable Subsidy' 53
35 Year-wise details of 'Modernisation/ Motorisation of Country crafts' 54
36 Year-wise details of Term Loan through NBCFDC 56
37 Year-wise details of Term Loan through NMDFC 57
38 Year-wise details of Educational Loan through NBCFDC 58
39 Details Micro Finance (MF) schemes during 2014-15 58
40 Details Micro Finance (MF) schemes as on 31-03-2015 since inception 59
41 Details of ‘Interest Free Loan (IFL)’ during 2014-15 60
42 Details of ‘Interest Free Loan (IFL)’ as on 31-03-2015 since inception 60
43 Projects implemented with the assistance of NCDC fund through Matsyafed
62
44 Total Investment on Fishing Inputs and Number of Beneficiaries Assisted under the various NCDC Projects
63
45 IFDP 2013-14: Project Funding from NCDC to Govt. of Kerala (Rs. in lakh) 64

7
Sl. No. Contents Page No.
46 IFDP 2013-14: Project Funding from NCDC to Govt. of Kerala (Rs. in lakh) 64
47 IFDP 2013-14: Project Funding from Govt. of Kerala to MATSYAFED/Societies
65
48 IFDP 2014-15: Project Funding from Govt. of Kerala to MATSYAFED/Societies
65
49 Number of Pensioners under Fishermen Welfare Scheme during 2013-14 & 2014-15
66
50 Number of Allied Worker Pensioners during 2013-14 & 2014-15 67
51 District-wise details of fishermen brought under Group insurance Scheme during 2014-15
68
52 Details of Welfare Relief Schemes Implemented by Kerala Fishermen's Welfare Fund Board
69
53 District-wise details of Development of Microenterprises by SAF during 2014-15
72
54 District-wise details of Shift to Appropriate Business by SAF during 2014-15 73
55 District-wise details of Branding & Marketing by SAF during 2014-15 74
56 District-wise details of Capacity Building Programme by SAF during 2014-15
74
57 Details of Health camps / Checkups programme by SAF during 2014-15 75
58 Details of Finishing school programme for fisherwomen youths by SAF during 2014-15
76
59 Number of Fisherwomen benefitted by Working Capital Revolving Fund by SAF during 2014-15
76
60 Performance of the Commercial Units under Matsyafed for 2013-14 & 2014-15
78
61 Export of Fish products from Matsyafed Ice & Freezing plant, Cochin during 2013-14
79
62 Export of Fish products from Matsyafed Ice & Freezing plant, Cochin during 2013-14
79
63 Fish Auction (Traditional Craft) Details for 2013-14& 2014-15– MATSYAFED 80
64 Export of Marine Products from Kerala during 2012-13, 2013-14 & 2014-15 81
65 Export of Marine Products from India during 2012-13, 2013-14 & 2014-15 81

8
Sl. No. Contents Page No.
66 Details of Marine Fish Landings in Kerala and India from 2001-02 to 2014-15
82
67 Marine Fish Landings (in MT) in Kerala from 2010-11 to 2014-15 83
68 Species Wise Marine Fish Landings (in MT) in Kerala from 2010-11 to 2014-15
84
69 Species Wise Marine Fish Landings (in MT) in Kerala from 2009 to 2014 85
70 Species Wise & Quarter Wise Marine Fish Landings in Kerala during 2009 & 2011 (in MT)
87
71 Species Wise & Quarter Wise Marine Fish Landings in Kerala during 2012 & 2014 (in MT)
89
72 District Wise & Species Wise Marine Fish Landings (in MT) in Kerala during 2012-13
91
73 District Wise & Species Wise Marine Fish Landings (in MT) in Kerala during 2013-14
93
74 District Wise & Species Wise Marine Fish Landings (in MT) in Kerala during 2014-15
95
75 District Wise & Species Wise Value of Marine Fish Landings (in MT) in Kerala during 2012-13 (Rs in Lakh)
97
76 District Wise & Species Wise Value of Marine Fish Landings (in MT) in Kerala during 2013-14 (Rs in Lakh)
99
77 District Wise & Species Wise Value of Marine Fish Landings (in MT) in Kerala during 2014-15 (Rs in Lakh)
101
78 Gross Domestic Product Originating from Fishing (at factor cost)- at Current Prices & Constant Prices (Base Year 2004-05)
103
79 Group-wise list of marine fishes 104

Kerala Marine Fisheries Statistics 2015
9
An Introduction
Kerala State
1. Location of Kerala North Latitude between 80 18’ and 120 48’ East Longitude between 74072’ and 770 22’
2. Area : 38863 Sq.Km
3. Population (2011 Census) : 334.06 lakh
Male : 160.27 lakh
Female : 173.79 lakh
Sex Ratio : 1084
Density of population : 859 per Sq. Km.
4. No. of Districts : 14
5. No. of Revenue Divisions : 21
6. No. of Taluks : 75
7. No. of Municipal Corporations : 6
8. No. of Municipalities : 87
9 No. of Grama panchayats : 978
10 No. of CD Blocks : 152
Kerala Fisheries
The coast of Kerala constitutes approximately 10 percent of India’s total coastline. Here fisheries
sector is considered as one of the most important productive and development sector.
India Kerala
Coastline length 8129 Km. 590 Km.
Exclusive Economic Zone 20.2 lakh Sq.Km. 2.19 lakh Sq.Km
Continental Shelf area (approx) 5.3 lakh Sq. Km. 0.39 lakh Sq. Km.
With a coastline of over 590 Km., and an exclusive economic zone (EEZ) of 218536 Sq Km, Kerala
has a significant marine fisheries sector that has long been an important source of occupation and
livelihood for the coastal population of the state. It is estimated that about 8 lakh people earn their
livelihood from capture and allied works in marine fisheries in the 222 fishing villages situated along the

Kerala Marine Fisheries Statistics 2015
10
coastline of the state. The coastal line spread over nine districts of Kerala. The marine districts of Kerala
are: Thiruvananthapuram, Kollam, Alappuzha, Ernakulam, Trissur, Malappuram , Kozhikkode, Kannur ,
Kasaragod. In addition to this, the state is blessed with 44 rivers, 49 reservoirs, 9 fresh water lakes, more
than 65000 hectares of brackish water, more than 46000 hectares of backwaters and a number of
ponds, irrigation tanks, streams etc. which contribute a rich resource of inland production.
1. Fishermen Population for 2014-15 (estimated) : 10.18 lakh
Marine 7.84 lakh
Inland 2.34 lakh
2. Active fishermen population 2014-15 2.36 lakh
Marine 1.83 lakh
Inland 0.53 lakh
3. No. of fisheries allied workers 2014-15 79347
4. Number of fishing villages
Marine : 222
Inland : 113
5. Number of rivers : 44
6. Number of Fishing Harbours : 12
7. Number of registered vessels (as on 11-11-2015) :
Motorised non mechanical : 29035
Motorised mechanical : 3819
Non-motorised : 2281
Total : 35135
10. Fish landings during 2014-15 : 7.26 lakh MT
Marine : 5.24 lakh MT
Inland : 2.02 lakh MT
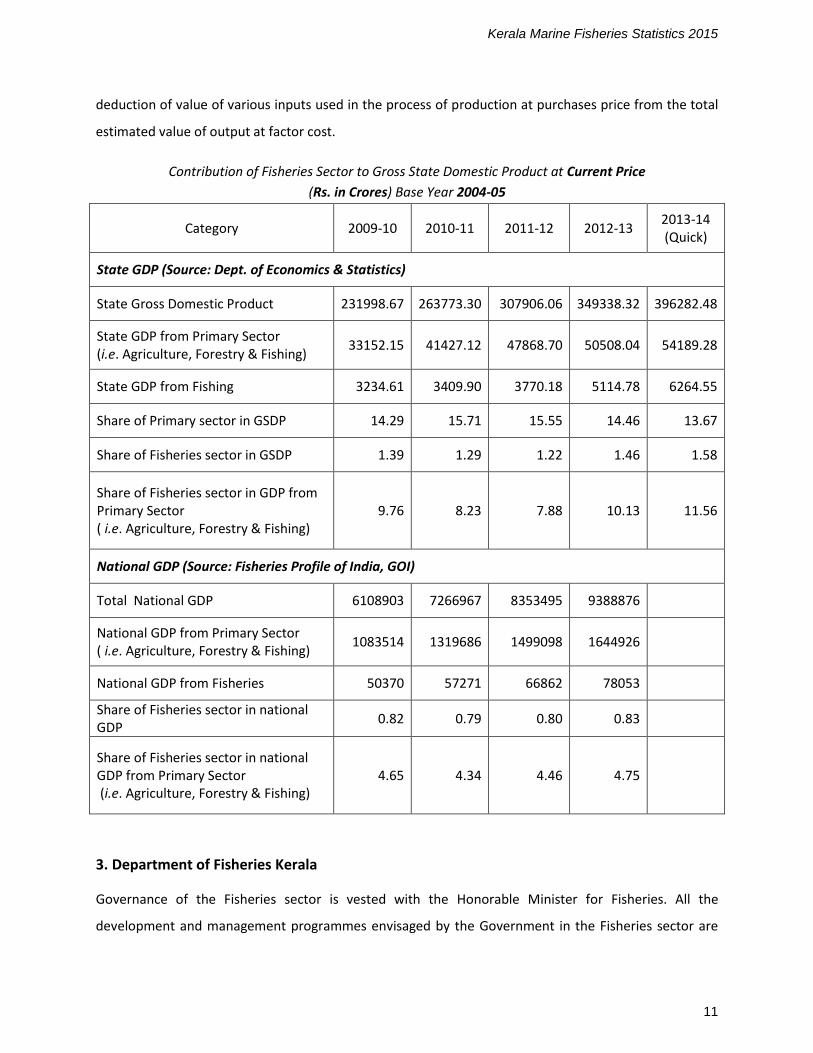
2. Gross Domestic Product (GDP)
In the state income accounts calculated by the Department of Economics & Statistics, the GVA
(Gross Value Added) from fisheries sector is estimated by the production approach method. It involves
Kerala Marine Fisheries Statistics 2015
11
deduction of value of various inputs used in the process of production at purchases price from the total
estimated value of output at factor cost.
Contribution of Fisheries Sector to Gross State Domestic Product at Current Price
(Rs. in Crores) Base Year 2004-05
Category 2009-10 2010-11 2011-12 2012-13 2013-14 (Quick)
State GDP (Source: Dept. of Economics & Statistics)
State Gross Domestic Product 231998.67 263773.30 307906.06 349338.32 396282.48
State GDP from Primary Sector (i.e. Agriculture, Forestry & Fishing)
33152.15 41427.12 47868.70 50508.04 54189.28
State GDP from Fishing 3234.61 3409.90 3770.18 5114.78 6264.55
Share of Primary sector in GSDP 14.29 15.71 15.55 14.46 13.67
Share of Fisheries sector in GSDP 1.39 1.29 1.22 1.46 1.58
Share of Fisheries sector in GDP from Primary Sector ( i.e. Agriculture, Forestry & Fishing)
9.76 8.23 7.88 10.13 11.56
National GDP (Source: Fisheries Profile of India, GOI)
Total National GDP 6108903 7266967 8353495 9388876
National GDP from Primary Sector ( i.e. Agriculture, Forestry & Fishing)
1083514 1319686 1499098 1644926
National GDP from Fisheries 50370 57271 66862 78053
Share of Fisheries sector in national GDP
0.82 0.79 0.80 0.83
Share of Fisheries sector in national GDP from Primary Sector (i.e. Agriculture, Forestry & Fishing)
4.65 4.34 4.46 4.75
3. Department of Fisheries Kerala
Governance of the Fisheries sector is vested with the Honorable Minister for Fisheries. All the
development and management programmes envisaged by the Government in the Fisheries sector are

Kerala Marine Fisheries Statistics 2015
12
being implemented by the State Department of Fisheries. The Department of Fisheries is headed by the
Director of Fisheries. The Department of Fisheries is functioning for the development of both inland &
marine fisheries sector by economic growth, food & nutritional security and socio-economic
development of fisher folk.
Some agencies are functioning under the department with different various objectives. They are:
1. Kerala Fishermen’s Welfare Fund Board (KFWFB)
2. Kerala State Cooperative Federation for Fisheries Development Limited (Matsyafed)
3. Agency for Development of Aquaculture, Kerala (ADAK)
4. Fisheries Resource Management Society (FIRMA)
5. National Institute of Fisheries Administration And Management (NIFAM)
6. Fish Farmers Development Agency (FFDA)
7. Kerala State Coastal Area Development Corporation (KSCADC)
8. Society for Assistance to Fisherwomen (SAF)
Under the Department of Fisheries there are five fisheries stations for conducting rescue operations
They are at
1. Vizhinjam, Thiruvananthapuram
2. Neendakara, Kollam
3. Vypin, Eranakulam
4. Beypore, Kozhikkode and
5. Kannur
Operational area for each station has been fixed. Department has implemented KMFR act to
govern marine fishing and conserve fishery resources. Penalty for fishing vessels violating rules imposed.
During 2014-15, 1140 sea patrollings were conducted. 270 rescue operations were conducted and 3113
fishermen rescued during 2014-15. For enhancing and protecting fisheries resources, 47 days trawl ban
imposed in the state from the midnight of June14th to midnight of July 31st, 2015.
There are 10 fisheries technical schools working under this department in the marine districts.
The Harbour Engineering Department (HED), Kerala was formed in 1982 as a service department
to Fisheries department. Prior to 1982 Coastal Engineering Works in the state were carried out by the
Marine Wing of Kerala Public Works Department. Harbour Engineering Department helps the Fisheries
Department by providing safe landing and berthing facilities for fishing vessels wherever possible as

Kerala Marine Fisheries Statistics 2015
13
fishing harbours / fish landing centres and similar infra structures in order to attain maximum catch in
the marine sector. In addition to this, HED carries out construction and repairs of Regional Fisheries
Technical Schools, hatcheries, fish farms, seed farms, aquarium etc.
Important welfare activities implementing through the state fisheries department in the marine sector are:
1. Housing scheme : provide assistance @ Rs. 2 lakh per unit for constructing new houses for the
fishermen
2. House repair : provide assistance @Rs. 0.50 lakh per unit for repairing the houses of fishermen
3. Sanitation : provide assistance @ Rs. 17500 per unit to construct toilets for the fishermen
4. Education concession scheme : provide educational concession to the children of registered
fishermen
5. Savings cum Relief scheme to promote thrift habit and to extend relief during lean period
6. Old age pension and widow pension to fishermen
7. Group insurance to fishermen to provide insurance coverage to active/allied fishermen who
registered at KFWFB for death while at fishing
8. Modernization of country crafts : provide assistance for changing OBM
9. Assistance to fisherwomen self help groups to develop their micro enterprises
10. Providing interest free loans to women fish vendors
4. Fishermen Population
The fishermen population of the state for 2014-15 is estimated as 10.18 lakh based on the
population of Kerala as on 1st Oct’ 14
Male Female Children Total
Marine 307717 274337 201846 783900
Inland 90919 87470 55762 234151
Total 398636 361807 257608 1018051
With the intention of an overall social empowerment of the fishermen of the state, who are
engaged in fishing for their livelihood, Kerala state enacted Kerala Fishermen Welfare Fund Act in
September, 1985 and the Kerala Fishermen Welfare Fund Board (KFWFB) came into existence in
January, 1986. The Kerala Fishermen’s Welfare Fund Act was amended in 1999, (Act 17 of 1999) for

Kerala Marine Fisheries Statistics 2015
14
incorporating the workers engaged in fishery related activities for his livelihood. Several welfare
schemes are implementing through this board for those who are registered as active or allied workers.
Number of Registered Marine Fishermen & Fishery Allied Workers
Marine Fishermen Fishery allied workers
Male Female Total Male Female Total
2012-13 175411 22510 197921 14947 59194 74141
2013-14 174406 21987 196393 16184 60326 76510
2014-15 165558 17252 182810 17089 62257 79346
Details of Fishery Allied Workers
Beach workers 4390
Small scale distributers 19398
Fish curers 15308
Peeling workers 36014
Processing workers 4236
Total 79346
5. Fish Production
In order to assess marine landings and to assess inland fish production in the state, sample surveys are
conducted by the department based on the methodology developed by CMFRI & CIFRI respectively. This
is a Central Sector Scheme in which multi stage random sampling methods are used.
Fish Production in lakh MT
Year Marine Inland Total
2010-11 5.60 1.21 6.81
2011-12 5.53 1.40 6.93
2012-13 5.31 1.49 6.80
2013-14 5.22 1.86 7.08
2014-15 5.24 2.02 7.26
6.4
6.6
6.8
7
7.2
7.4
2010-11 2011-12 2012-13 2013-14 2014-15
Qu
an
tuty
in M
T
Year
Total Fish Production

Kerala Marine Fisheries Statistics 2015
15
Analyzing the fish landings in Kerala, a decreasing trend is seen in the marine sector till 2013-14 and a
slight increase of 0.4% during 2014-15. Inland fish production shows an increasing trend during the
previous years and during 2014-15, an increase of 8.6% over 2013-14.
Marine Fish Production during 2014-15
Marine fish landings for 2014-15 is estimated as 524468 MT and that for 2013-14 was 522308
MT.
Contribution of various resources to the total landings during 2014-15 is as follows:
Pelagic fin fishes contributed 69% of the total fish landings. Major portion of this type includes
oil sardines, lesser sardines, mackerel, anchovilla, ribbon fish, tunnis etc. Major portion of Crustaceans
includes penaid prawn. Perches and Soles are the main items contained in demersal fin fish resources.
Resources Fish landings
(in MT) %
Pelagic fin fishes 361956 69.0
Demersal fin fishes 49416 9.4
Crustaceans 65955 12.6
Molluscs 34057 6.5
Miscellaneous 13084 2.5
Total 524468 100
Crustaceans
Demersal
Miscellaneous
Pelagic
Molluscs
% contribution of various resources to the total Marine fish landings during
2014-15
5
5.1
5.2
5.3
5.4
5.5
5.6
5.7
2010-11 2011-12 2012-13 2013-14 2014-15
Qu
an
tity
in M
T
Year
Marine Fish Production
0
0.5
1
1.5
2
2.5
2010-11 2011-12 2012-13 2013-14 2014-15
Qu
an
tity
in M
T
Year
Inland fish Production
Kerala Marine Fisheries Statistics 2015
16
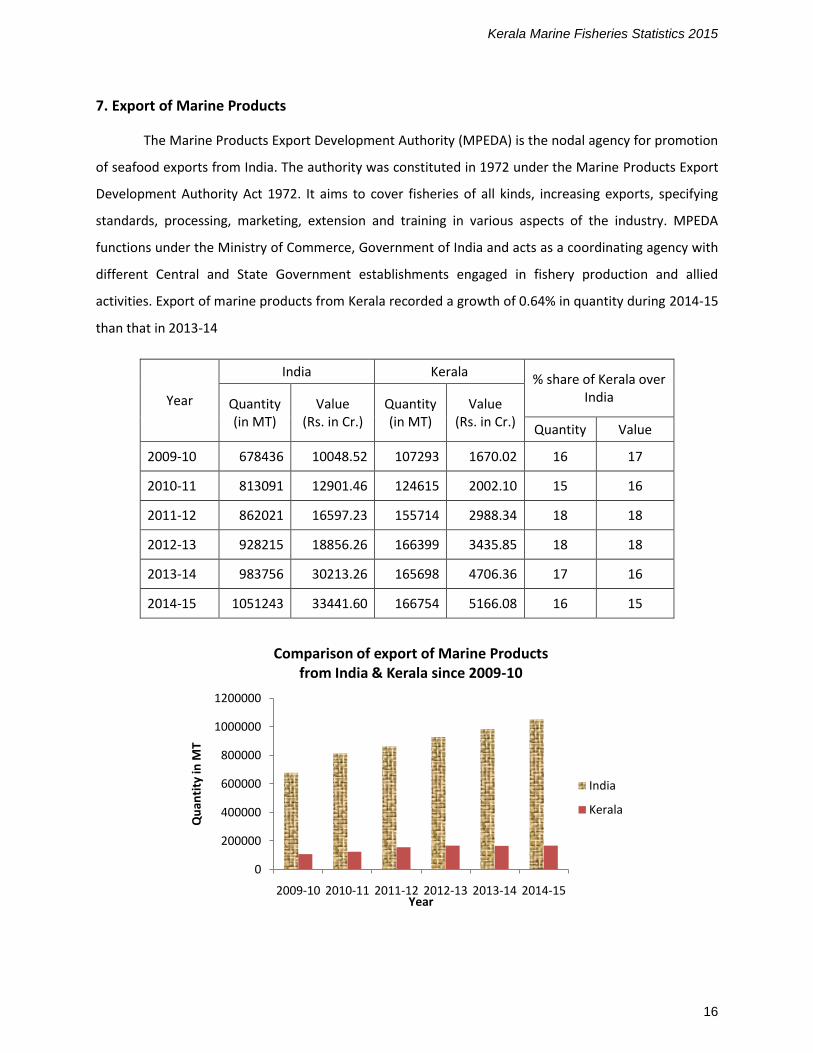
7. Export of Marine Products
The Marine Products Export Development Authority (MPEDA) is the nodal agency for promotion
of seafood exports from India. The authority was constituted in 1972 under the Marine Products Export
Development Authority Act 1972. It aims to cover fisheries of all kinds, increasing exports, specifying
standards, processing, marketing, extension and training in various aspects of the industry. MPEDA
functions under the Ministry of Commerce, Government of India and acts as a coordinating agency with
different Central and State Government establishments engaged in fishery production and allied
activities. Export of marine products from Kerala recorded a growth of 0.64% in quantity during 2014-15
than that in 2013-14
Year
India Kerala % share of Kerala over
India Quantity (in MT)
Value (Rs. in Cr.)
Quantity (in MT)
Value (Rs. in Cr.)
Quantity Value
2009-10 678436 10048.52 107293 1670.02 16 17
2010-11 813091 12901.46 124615 2002.10 15 16
2011-12 862021 16597.23 155714 2988.34 18 18
2012-13 928215 18856.26 166399 3435.85 18 18
2013-14 983756 30213.26 165698 4706.36 17 16
2014-15 1051243 33441.60 166754 5166.08 16 15
0
200000
400000
600000
800000
1000000
1200000
2009-10 2010-11 2011-12 2012-13 2013-14 2014-15
Qu
anti
ty in
MT
Year
Comparison of export of Marine Products from India & Kerala since 2009-10
India
Kerala

Kerala Marine Fisheries Statistics 2015
17
Item-wise export of Marine Products during 2014-15
Items
India Kerala
Quantity (in MT)
Value (Rs. in Cr.)
Quantity (in MT)
Value (Rs. in Cr.)
Frozen Shrimp 357505 22468.1 54438.36 2855.96
Frozen Squid 69569 1275.25 21273.46 472.4
Frozen Cuttle fish 82353 1833.21 31604.21 813.95
Frozen fish 309434 3778.5 36523.9 473.85
Dried items 70544 1010.16 2213.97 27.5
Live items 5488 301.51 463.51 50.35
Chilled items 31404 635.93 4717.74 169.32
Others 124947 2138.94 15518.44 302.74
1051244 33441.6 166753.63 5166.07
Frozen Shrimp
Frozen Squid
Frozen Cuttle fish
Frozen fish
Dried items
Live items
Chilled items
Others
Export of Marine Products from Kerala during 2014-15

Kerala Marine Fisheries Statistics 2015
18
8 Budget Outlay in Fisheries Sector
Year Outlay
(Rs.in Crore) Expenditure (Rs.
in Crore)
2003-04 33.50 30.81
2004-05 43.00 35.94
2005-06 52.78 42.47
2006-07 73.80 72.40
2007-08 107.25 87.25
2008-09 160.29 157.91
2009-10 118.32 114.92
2010-11 118.62 105.40
2011-12 199.81 188.91
2012-13 243.2 230.3
2013-14 279.45 242.7
2014-15 343.12 252.15
0
50
100
150
200
250
300
350
400
Outlay & expenditure in Fisheries Sector from 2003-04
Outlay(Rs.in Crore) Expenditure (Rs. in Crore)

Kerala Marine Fisheries Statistics 2015
19
Table 1
District-wise distribution of Coastline of Kerala
Sl. No
District Length of Coast Line
(in Km)
Percentage to Total
1 Thiruvananthapuram 78 13.2
2 Kollam 37 6.3
3 Alappuzha 82 13.9
4 Ernakulam 46 7.8
5 Thrissur 54 9.2
6 Malappuram 70 11.9
7 Kozhikode 71 12.0
8 Kannur 82 13.9
9 Kasargode 70 11.9
Total 590 100
Table 2
District-wise distribution of
Exclusive Economic Zone (EEZ) &Continental Shelf of Kerala
Sl. No
District EEZ (in Sq. Km) *Continental
shelf (in sq. Km.)
1 Thiruvananthapuram 28890 3939
2 Kollam 13702 2065
3 Alappuzha 30377 5043
4 Ernakulam 17046 2892
5 Thrissur 19996 3159
6 Malappuram 25940 5362
7 Kozhikode 26290 5503
8 Kannur 30377 6150
9 Kasargode 25918 5026
Total 218536 39139
*Distance from coast vary from 50 Km to 80 Km

Kerala Marine Fisheries Statistics 2015
20
Table 3
Details of Fisheries Schools under the Fisheries Department
Sl.No Address of School Year of Starting
Ongoing courses (For VHSC)
1
GRFTHS,
Valiyathura,Thiruvananthapuram,
Phone-0471-2502813
1965 1. Marine fisheries sea food processing
2
GRFTHS,
Karunagappally,Kollam,
Phone-0476-2620260
1984 1. Medical Lab Technology
2. Marine fisheries sea food processing
3
GRFTHS,
Arthunal, Alappuzha,
Phone-0478-2573357
1984 1. Aquaculture
4
GRFTHS,
Thevara,Cochin,
Ernakulam,
Phone-0484-2663048
1968 1. Aquaculture
5
GRFTHS,
Chavakkad,Thrissur,
Phone-0487-2501965
1981
6
GRFTHS,
Thanur,Malappuram,
Phone-0494-2443721
1981
1. Marine technology
2. Electrical and electronic technology
3. Marine fisheries sea food processing
7
GRFTHS,
Koyilandi, Kozhikode,
Phone-0496-2630956
1994-95
8
GRFTHS,
Beypore, Kozhikode,
Phone-0495-2415397
1981 1. Marine fisheries sea food processing
9
GRFTHS,
Azhecode, Kannur,
Phone-0497-2770474
1967
1. Aqua Culture
2. Marine technology
10
GRFTHS,
Kanhangad, Kasargode
Phone-0467-2286746
2002
Kerala Marine Fisheries Statistics 2015
21
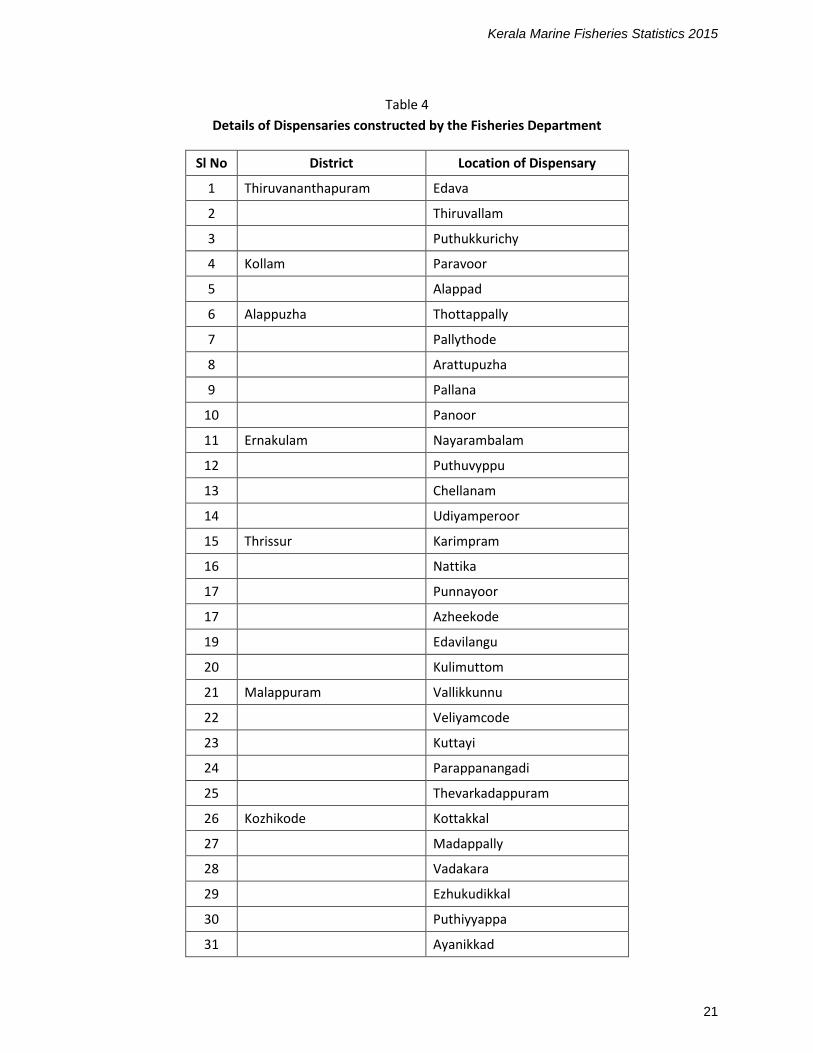
Table 4
Details of Dispensaries constructed by the Fisheries Department
Sl No District Location of Dispensary
1 Thiruvananthapuram Edava
2 Thiruvallam
3 Puthukkurichy
4 Kollam Paravoor
5 Alappad
6 Alappuzha Thottappally
7 Pallythode
8 Arattupuzha
9 Pallana
10 Panoor
11 Ernakulam Nayarambalam
12 Puthuvyppu
13 Chellanam
14 Udiyamperoor
15 Thrissur Karimpram
16 Nattika
17 Punnayoor
17 Azheekode
19 Edavilangu
20 Kulimuttom
21 Malappuram Vallikkunnu
22 Veliyamcode
23 Kuttayi
24 Parappanangadi
25 Thevarkadappuram
26 Kozhikode Kottakkal
27 Madappally
28 Vadakara
29 Ezhukudikkal
30 Puthiyyappa
31 Ayanikkad

Kerala Marine Fisheries Statistics 2015
22
32 Kannur Puthiyangadi
33 Muzhippilangadi
34 Anthur
35 Kasaragode Ajannur
36 Cheruvathur
37 Thikadappuram
38 Mavilakadappuram
39 Valiyaparamba
Mobile dispensaries
1 Thiruvananthapuram
2 Alappuzha
3 Ponnani
4 Pazhayangadi, Kannur
Table 5
Details of Fishermen Co-operative Societies in Kerala
Name of District
Affiliated to Matsyafed Others Grand Total
Marine Vanitha Inland Total
Trivandrum 68 18 1 87 7 94
Kollam 40 12 30 82 14 96
Pathanamthitta 0 0
Alappuzha 45 29 58 132 28 160
Kottayam 0 9 20 29 10 39
Idukki 0
Ernakulam 28 15 59 102 22 124
Thrissur 29 8 4 41 17 58
Palaghat 6 6
Malappuram 39 9 18 66 66
Kozhikode 58 5 9 72 5 77
Wayanad 0
Kannur 16 5 4 25 5 30
Kasargod 23 6 1 30 30
Total 346 116 204 666 114 780

Kerala Marine Fisheries Statistics 2015
23
Table 6
Fishing Harbours in Kerala
Sl. No
Completed Sl. No
Under construction Sl. No
Proposed to be constructed
1 Thankassery 1 Vizhinjam 1 Poonthura
2 Neendakara 2 Muthalappozhy 2 Valiyathura
3 Kayamkulam 3 Chethi 3 Varkala Chilakkoor
4 Thottappally 4 Arthunkal 4 South Paravoor
5 Munambam 5 Chellanam 5 Punnapra
6 Ponnani 6 Chettuva 6 Parappanangadi
7 Beypore 7 Koyilandi 7 Puthiyangadi
8 Puthiyappa 8 Thalai 8 Pathiyankara
9 Chombal 9 Kasargod 9 Ajanoor Kadappuram
10 Mopla Bay 10 Thanur 10 Kaipamangalam
11 Azheekal 11 Vellayil
12 Cheruvathoor 12 Manjeswaram
Source: Harbour Engineering Department
Table 7
Expenditure incurred for the Fishing Harbours (completed) by the Harbour Engineering Department
Sl. No
Name of Fishing Harbour
Expenditure incurred
(Rs. in Lakhs ) Remarks
1 Thankassery 41.30 Commissioned during 03/2001
2 Neendakara 8.54 Commissioned during 03/1998
3 Kayamkulam 25.27 Commissioned during 05/2008
4 Thottappally 17.50 Commissioned during 02/2011
5 Munambam 17.93 Commissioned during 08/2000
6 Ponnani 35.05 Commissioned during 02/2011
9 Beypore 7.32 Constructed by Kerala PWD-Exp. Incurred on
additional works by HED
7 Puthiyappa 11.62 Commissioned during 02/1996
8 Chompal 9.03 Commissioned during 05/1999
10 Maplabay 10.71 Commissioned during 05/1999
11 Azheeckal 3.54 Constructed by Kerala PWD-Exp. Incurred on
additional work by HED
12 Cheruvathur 28.41 Commissioned during 08/2015
Source: Harbour Engineering Department

Kerala Marine Fisheries Statistics 2015
24
Table 8
Existing rates of user charges/fees for various services/facilities rendered by Harbour Engineering Departments
(as per G.O. (Ms) No. 309/2012/F&PD dated 31.03.2012)
I ENTRY FEES Rs. Per entry
1 Lorry 75
2 Mini lorry 50
3 Car 30
4 Tempo (5T) 40
5 Tata Ace (1T to 2T) 20
6 Auto rickshaw 25
7 Auto Truck 20
8 Motorcycle/Scooter 10
9 Cycle 5
10 Persons : 3
11 Ice ( 50 Kg) 5
II LANDING CHARGES Rs. Per Each
1 Trawl Net Boat 50
2 Vallom (Big) 40
3 Vallom (Small) 20
4 Pursiene Boat 200
5 Gill Net Boat 50
III BERTHING CHARGES
a Boat 30 per day
IV WHARFAGE
1 Loaded Lorry (Fish) 200
Loaded Lorry (Prawn/ Crustaceous) 1000
2 Loaded Mini Lorry (Fish) 150
Loaded Mini Lorry (Prawn/ Crustaceous) 700
3 Loaded Tempo (Fish) 100
Loaded Tempo (Prawn/ Crustaceous) 350
4 Tata Ace (Fish) 100
Tata Ace (Prawn/ Crustaceous) 200
5 Loaded Auto Rickshaw (Fish) 40
Loaded Auto Rickshaw (Prawn/ Crustaceous) 150
6 Head Load (Fish) 5
Head Load (Prawn/ Crustaceous) 20
7 Auto Truck ( Fish) 75
Loaded Auto Truck 150

Kerala Marine Fisheries Statistics 2015
25
8 Two Wheeler ( Bike/ M 80/ Scooter) ( Upto Two Boxes) ( Fish)
25
Two Wheeler ( Bike/ M 80/ Scooter) ( Upto Two Boxes) (Prawn/ Crustaceous)
50
9 Two Wheeler ( Bike/ M 80/ Scooter) ( Above Two Boxes)(Fish)
40
Two Wheeler ( Bike/ M 80/ Scooter) ( Above Two Boxes)(Prawn/ Crustaceous)
75
10 Cycle upto two boxes ( Fish) 15
Cycle upto two boxes (Prawn/ Crustaceous) 30
11 Cycle above two boxes ( Fish) 25
Cycle above two boxes (Prawn/ Crustaceous 50
V RENEWAL OF LICENCES
a Auction Agent 200 per month
b Merchants 500 per month
c Petty Merchants 100 per month
d Ice Sellers
e Woman vendors 10 per month (100 per year)
f Harbour workers ( Labour pass ) 200 per year
VII GROUND RENT FOR REPAIR YARD
Open area 100 per day
Covered area 150 per day
VII NEW SOURCES OF REVENUE
Entry fee to breakwaters 10 per person
VIII INSPECTION BUNGALOW FEES
Thankassery Room Rent 500 per day
Hall Rent 1000 per day
Vizhinjam Room Rent 750 per day
Hall Rent 1500 per day
Kozhikode Room Rent 300 per day
Hall Rent 500 per day
IX OTHER ITEMS
Video Camera
for Preparation 1500 per day or part there of
for Actual Shooting 5000 per day or part there of
Movie Camera
for Preparation 1500 per day or part there of
for Actual Shooting 10,000 per day or part there of
Source: Harbour Engineering Department, Kerala
Kerala Marine Fisheries Statistics 2015
26
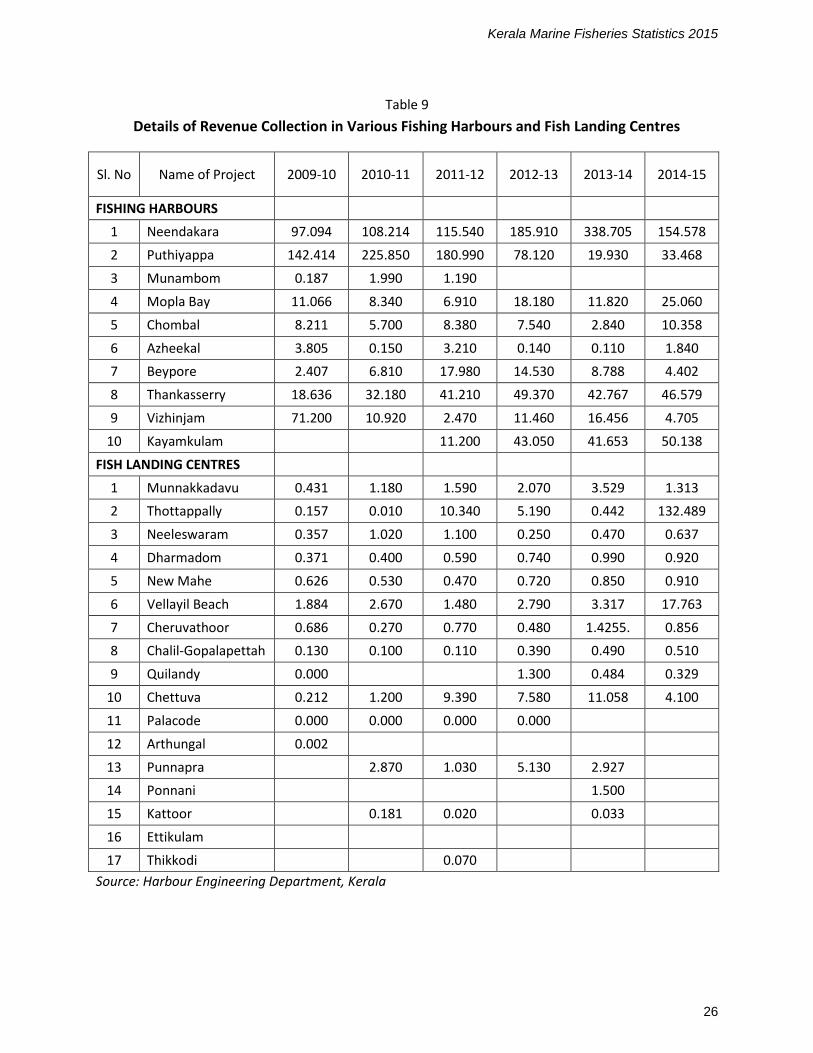
Table 9
Details of Revenue Collection in Various Fishing Harbours and Fish Landing Centres
Sl. No Name of Project 2009-10 2010-11 2011-12 2012-13 2013-14 2014-15
FISHING HARBOURS
1 Neendakara 97.094 108.214 115.540 185.910 338.705 154.578
2 Puthiyappa 142.414 225.850 180.990 78.120 19.930 33.468
3 Munambom 0.187 1.990 1.190
4 Mopla Bay 11.066 8.340 6.910 18.180 11.820 25.060
5 Chombal 8.211 5.700 8.380 7.540 2.840 10.358
6 Azheekal 3.805 0.150 3.210 0.140 0.110 1.840
7 Beypore 2.407 6.810 17.980 14.530 8.788 4.402
8 Thankasserry 18.636 32.180 41.210 49.370 42.767 46.579
9 Vizhinjam 71.200 10.920 2.470 11.460 16.456 4.705
10 Kayamkulam 11.200 43.050 41.653 50.138
FISH LANDING CENTRES
1 Munnakkadavu 0.431 1.180 1.590 2.070 3.529 1.313
2 Thottappally 0.157 0.010 10.340 5.190 0.442 132.489
3 Neeleswaram 0.357 1.020 1.100 0.250 0.470 0.637
4 Dharmadom 0.371 0.400 0.590 0.740 0.990 0.920
5 New Mahe 0.626 0.530 0.470 0.720 0.850 0.910
6 Vellayil Beach 1.884 2.670 1.480 2.790 3.317 17.763
7 Cheruvathoor 0.686 0.270 0.770 0.480 1.4255. 0.856
8 Chalil-Gopalapettah 0.130 0.100 0.110 0.390 0.490 0.510
9 Quilandy 0.000 1.300 0.484 0.329
10 Chettuva 0.212 1.200 9.390 7.580 11.058 4.100
11 Palacode 0.000 0.000 0.000 0.000
12 Arthungal 0.002
13 Punnapra 2.870 1.030 5.130 2.927
14 Ponnani 1.500
15 Kattoor 0.181 0.020 0.033
16 Ettikulam
17 Thikkodi 0.070
Source: Harbour Engineering Department, Kerala

Kerala Marine Fisheries Statistics 2015
27
Table 10
Marine Fish Landing Centres in Kerala
Sl.No. Landing Centre Sl.No. Landing Centre
Thiruvananthapuram 32 Puthukurichi
1 Kollamkode 33 Perumathura
2 Parithiyoor 34 Singarathoppu
3 Poovar 35 Thazhampally
4 Kochuthura 36 Anjengo South
5 Puthiyathura(Chinnamarthandanthura) 37 Anjengo North
6 Karimkulam 38 Mampally
7 Chempakaramanthura 39 Arivalam & Rathikkal
8 Pallam 40 Kayakara
9 Erayammanthura 41 Perumon
10 Adimalathura 42 Onnampalam
11 Vizhinjam(Kottapuram) 43 Vettoor
12 Vizhinjam(North) 44 Chilakkoor
13 Kovalam 45 Odayan
14 Panathura South 46 Edava
15 Poonthura 47 Kappil
16 Beemapally 48 Poothura
17 Cheriyathura Kollam
18 Valiuyathura/Valiyathura Pier 49 Cheriazheekal-2
19 Kochuthoppu 50 Puthenthura
20 Valiyathoppu 51 Neendakara
21 Kannanthura 52 Sakthikulangara
22 Vettukadu 53 Thankassery
23 Kochuveli 54 Wadi
24 Valiyaveli 55 Moothakara
25 Pallithura 56 Jonapuram
26 Thumpa 57 Quilon port
27 St Andrews 58 Pallithottam
28 Puthenthoppu 59 Eravipuram
29 Vettuthura 60 Koluthumpadam
30 Santhipuram 61 Chillickal
31 Mariyanadu coloney 62 Thottukuzhi

Kerala Marine Fisheries Statistics 2015
28
Sl.No. Landing Centre Sl.No. Landing Centre
63 Parakkada 93 Manassery
64 Marathadi 94 Puthenthodu(Kannamali)
65 Chanakazhiyam 95 Chellanam
66 Pozhikkara 96 Cherai
Allappuzha 97 Edavanakkad
67 Chethy 98 Beachroad
68 Punnappra 99 Fort cochi
69 Alleppy Beach 100 Nayarambalam
70 Pallithode 101 Narakal
71 Thykal 102 Saudi
72 Arthungal 103 Maruvakad
73 Chennavely Thrissur
74 Pollethai 104 Azheecode-2
75 Vadakkal 105 Munakkal
76 Paravoor 106 Eriyad(Chelarappa)
77 Thrikkunnappuzha 107 Kara
78 Valanjavazhy 108 Kathiyalam
79 Thottappally 109 Attupuram
80 Manakodam 110 Perinjanam Arattukadavu
81 Vadapozhi 111 Mathilakom
82 Thumboli 112 Kaipamangalam Vanchipura
83 Purakkad 113 Kaipamangalam Companykadavu
Eranakulam 114 Chamakkala
84 Murikumpadam 115 Palapetty
85 Kalamukku 116 Kazhimbram
86 Puthuvaipu 117 Nattika
87 Malipuram 118 Thalikulam
88 Kuzhippily 119 Vadanappally
89 Munambam FH 120 Chettuva Bangalamkadavu
90 Munambam Mini FH 121 Munakkakadavu
91 Thoppumpady 122 Blangad
92 Gondu parabu 123 Puthen kadappuram

Kerala Marine Fisheries Statistics 2015
29
Sl.No. Landing Centre Sl.No. Landing Centre
124 Edakazhiyur 156 Vellayil
125 Panchavadi Kannur
126 Mannalamkunnu 157 Edakkad
Malappuram 158 Thalayikunhi Kadappuram
127 Palappetty 159 New Mahe
128 Veliyancode 160 Thuruth
129 Ponnani 161 Ettikulam
130 Koottai 162 Azheekal jetty
131 Vakkad 163 Tellicherry
132 Puthengadi/Paravanna 164 Ayikkara FH
133 Thevarkadappuram 165 Azheecode South
134 Thanur 166 Muzhuppilangad
135 Parappnangadi 167 Palakode
136 Vadakke 168 Puthiyangadi
137 Kadalundinagaram Kasaragode
Kozhikode 169 Pallikere
138 Chaliyam 170 Kotikulam
139 Beypore FH 171 Bekal
140 Kozhicode South 172 Kizhur
141 Chombala FH 173 Thalangara jetty
142 Badagara Azhithala 174 Kasaba
143 Kolavi(Irinjal) 175 Adakathbail
144 Thikkodi(Kodikkal) 176 Mogral
145 Valavil kadappuram 177 Koipadi
146 Muthayakadappuram 178 Uppala
147 Moodady 179 Arikkadi
148 Koloth 180 Hosabettu-Udavar
149 Quilandy/Koloth 181 Kunhathur
150 Kovalad 182 Ajanoor-N-Bella
151 Polikavu 183 Chittari
152 Kappad 184 Hosdurga-S-Bella(Poonjavi)
153 Edakadavu 185 Thaikadappuram
154 Elathur 186 Poonchavikadapuram
155 Puthiyappa FH-2 187 Cheruvathur FH

Kerala Marine Fisheries Statistics 2015
30
Table 11
Fish Landing Centres in Marine sector by Harbour Engineering Department & KSCDC
Sl No
District
Name of Marine Fish landing Centre constructed by
Harbour Engineering Department Kerala State Coastal Area Development Corporation
(KSCDC)
Functioning Under Construction Functioning Under Construction
1 2 3 4 5 6
1 Thiruvananthapuram
Vizhijam south
Paruthiyoor Karamkulam
Poonthura Poovar Adimalathura
Mariyanadu Puthiyappa
Anchuthengu
2 Alappuzha
Arthunkal(Upgraded to fishing harbour)
Valiyazheeckal
Katrur Pollathai
Punnapra
Pathiyankara
3 Ernakulam Nayarambalam
Vipin
4 Thrissur
Puthenkadappuram, chavakkad
Kaippamangalam
Blangad, Chavakkad Nattika
Thalikkulam
5 Malappuram
Paravanna
Palappetti
Vallikkunnu (not functioning)
Kadalundinagaram

Kerala Marine Fisheries Statistics 2015
31
1 2 3 4 5 6
6 Kozhikkode
Vellayil (Upgraded to fishing harbour)
Thikkodi
Koyilandi (Upgraded to fishing harbour)
Kuriyadi
7 Kannur
Dharmadom
Muzhippilangad
New Mahe
Puthiyangadi
Chalil Gopalapettah
palacode
Ettikulam
8 Kasargode
Cheruvathur
Koyippady
Mozodi
Ajanoor
Punchavi
Padanna
Bakel
Kasargode
Source: Harbour Engineering Department, Kerala & Kerala State Coastal Area Development Corporation

Kerala Marine Fisheries Statistics 2015
32
Table 12
District wise Fishermen Population 2014-15 (estimated)
Sl. No.
District Marine Inland Grand
Total Male Female Children Total Male Female Children Total
1 Thiruvananthapuram 62857 55527 49370 167754 445 517 443 1405 169159
2 Kollam 39498 33393 19609 92500 13435 12649 8102 34186 126686
3 Pathanamthitta
927 805 375 2107 2107
4 Alappuzha 50472 46127 31177 127776 24879 23832 12871 61582 189358
5 Kottayam
9770 9274 5753 24797 24797
6 Idukki
266 267 169 702 702
7 Ernakulam 28559 26756 16804 72119 23605 23098 16752 63455 135574
8 Thrissur 21539 21706 12412 55657 7887 7219 4563 19669 75326
9 Palakkad
860 848 868 2576 2576
10 Malappuram 34942 28418 26005 89365 1800 1568 847 4215 93580
11 Kozhikode 38607 33610 25770 97987 4147 4374 3397 11918 109905
12 Wayanad
76 81 77 234 234
13 Kannur 13997 12718 10912 37627 2409 2548 1365 6322 43949
14 Kasaragod 17246 16082 9787 43115 413 390 180 983 44098
Total 307717 274337 201846 783900 90919 87470 55762 234151 1018051
Note: Population estimated based on 2011 Census figures

Kerala Marine Fisheries Statistics 2015
33
Table 13
District-wise Marine Fishermen Population in Kerala
for 2012-13, 2013-14 & 2014-15 (estimated)
Sl. No.
Name of District
Marine Fishermen Population
2012-13 2013-14 2014-15
Male Female Children Total Male Female Children Total Male Female Children Total
1 Thiruvananthapuram 61568 54397 48362 164327 62558 55262 49134 166954 62857 55527 49370 167754
2 Kollam 38402 32478 19035 89915 39308 33251 19499 92058 39498 33393 19609 92500
3 Alappuzha 42565 38853 26325 107743 50230 45856 31079 127165 50472 46127 31177 127776
4 Ernakulam 28267 26499 16546 71312 28444 26664 16666 71774 28559 26756 16804 72119
5 Thrissur 27628 27837 15848 71313 21458 21619 12314 55391 21539 21706 12412 55657
6 Malappuram 30625 24902 22761 78288 34784 28282 25872 88938 34942 28418 26005 89365
7 Kozhikode 37533 32739 25069 95341 38383 33479 25658 97520 38607 33610 25770 97987
8 Kannur 20205 18361 15693 54259 13942 12668 10837 37447 13997 12718 10912 37627
9 Kasargode 16865 15923 9844 42632 16971 16022 9916 42909 17246 16082 9787 43115
Total 303658 271989 199483 775130 306078 273103 200975 780156 307717 274337 201846 783900

Kerala Marine Fisheries Statistics 2015
34
Table 14
District-wise Number of Active Marine Fishermen & their families in Kerala
for 2012-13, 2013-14 & 2014-15
Sl. No
Name of District
2012-13 2013-14 2014-15
Active Fishermen (in Nos.) No. of Family
Active Fishermen (in Nos.) No. of Family
Active Fishermen (in Nos.) No. of Family
Male Female Total Male Female Total Male Female Total
1 Thiruvananthapuram 37584 14404 51988 34965 37279 13995 51274 43425 37499 13400 50899 43230
2 Kollam 17856 819 18675 18020 17914 740 18654 16526 17942 619 18561 16570
3 Alappuzha 35028 3767 38795 27295 35241 3996 39237 27446 25859 41 25900 20735
4 Ernakulam 14743 452 15195 12375 13181 216 13397 8995 13021 209 13230 10979
5 Thrissur 6088 9 6097 3620 6092 9 6101 4772 5794 9 5803 4822
6 Malappuram 30176 2 30178 25752 30948 0 30948 21791 31479 0 31479 22166
7 Kozhikode 21342 28 21370 16557 21681 26 21707 16728 21751 18 21769 14557
8 Kannur 5725 13 5738 4808 5162 10 5172 4189 5174 12 5186 4144
9 Kasargode 6869 3016 9885 5904 6908 2995 9903 5892 7039 2944 9983 6206
Total 175411 22510 197921 149296 174406 21987 196393 149764 165558 17252 182810 143409
Source: Kerala State Fishermen Welfare Fund Board
Kerala Marine Fisheries Statistics 2015
35
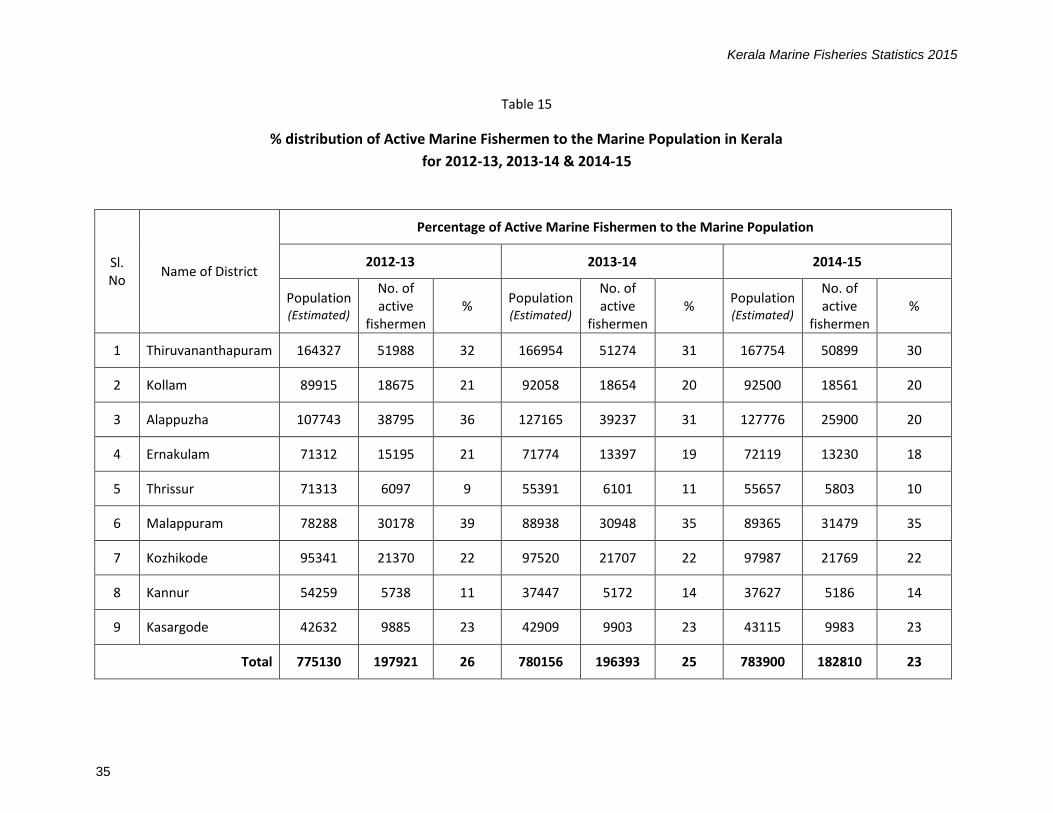
Table 15
% distribution of Active Marine Fishermen to the Marine Population in Kerala
for 2012-13, 2013-14 & 2014-15
Sl. No
Name of District
Percentage of Active Marine Fishermen to the Marine Population
2012-13 2013-14 2014-15
Population (Estimated)
No. of active
fishermen %
Population (Estimated)
No. of active
fishermen %
Population (Estimated)
No. of active
fishermen %
1 Thiruvananthapuram 164327 51988 32 166954 51274 31 167754 50899 30
2 Kollam 89915 18675 21 92058 18654 20 92500 18561 20
3 Alappuzha 107743 38795 36 127165 39237 31 127776 25900 20
4 Ernakulam 71312 15195 21 71774 13397 19 72119 13230 18
5 Thrissur 71313 6097 9 55391 6101 11 55657 5803 10
6 Malappuram 78288 30178 39 88938 30948 35 89365 31479 35
7 Kozhikode 95341 21370 22 97520 21707 22 97987 21769 22
8 Kannur 54259 5738 11 37447 5172 14 37627 5186 14
9 Kasargode 42632 9885 23 42909 9903 23 43115 9983 23
Total 775130 197921 26 780156 196393 25 783900 182810 23

Kerala Marine Fisheries Statistics 2015
36
Table 16
District-wise Number of Allied worker Fishermen in Kerala
for 2012-13, 2013-14 & 2014-15
Sl. No. Districts 2012-13 2013-14 2014-15
Male Female Total Male Female Total Male Female Total
1 Thiruvananthapuram 555 447 1002 531 590 1121 534 980 1514
2 Kollam 660 13793 14453 1312 13747 15059 1697 14395 16092
3 Pathanamthitta 486 75 561 422 140 562 512 77 589
4 Alappuzha 2516 19575 22091 2779 19889 22668 2646 21077 23723
5 Kottayam 547 360 907 253 459 712 656 137 793
6 Idukki 64 64 317 - 317 45 10 55
7 Ernakulam 2226 11490 13716 2260 11820 14080 2404 11942 14346
8 Thrissur 952 2110 3062 1328 1902 3230 1303 1770 3073
9 Palakkad 280 280 291 - 291 285 - 285
10 Malappuram 1006 3306 4312 1090 3326 4416 1215 3216 4431
11 Kozhikode 3964 7064 11028 3987 7425 11412 3902 7557 11459
12 Wayanad 354 354 420 - 420 505 - 505
13 Kannur 1161 376 1537 198 674 872 1157 419 1576
14 Kasargode 176 598 774 996 354 1350 228 678 906
Total 14947 59194 74141 16184 60326 76510 17089 62258 79347
Source: Kerala State Fishermen Welfare Fund Board
Kerala Marine Fisheries Statistics 2015
37
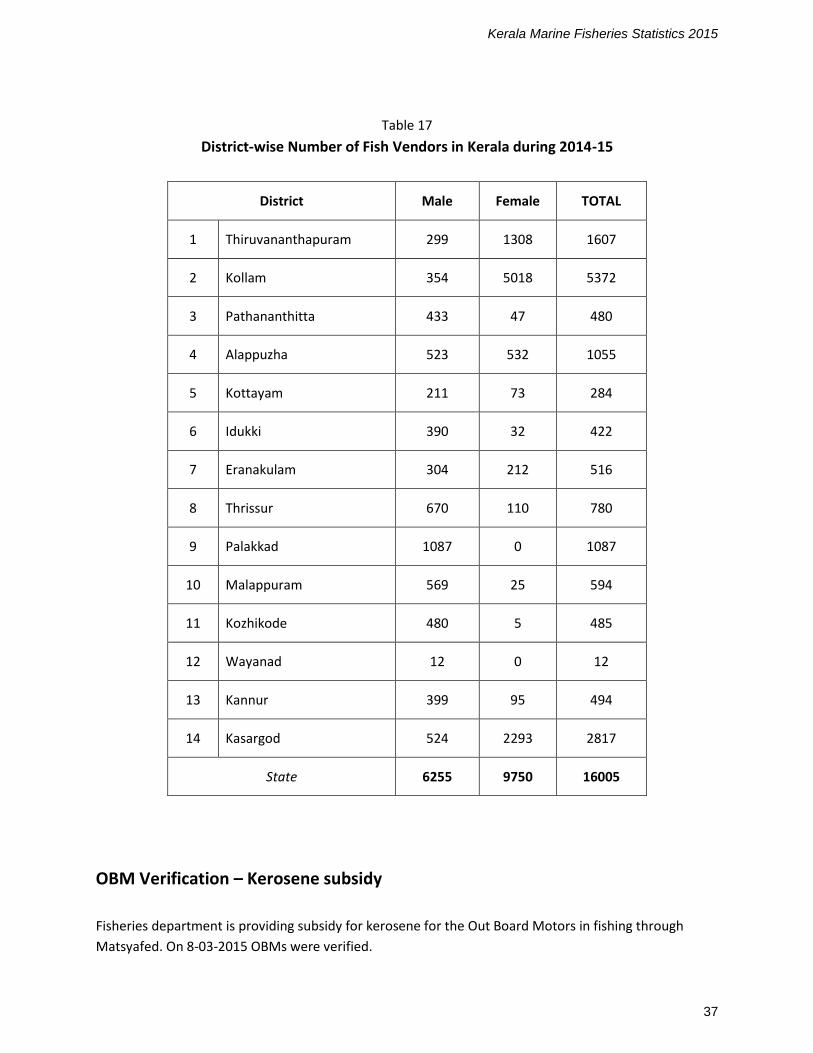
Table 17
District-wise Number of Fish Vendors in Kerala during 2014-15
District Male Female TOTAL
1 Thiruvananthapuram 299 1308 1607
2 Kollam 354 5018 5372
3 Pathananthitta 433 47 480
4 Alappuzha 523 532 1055
5 Kottayam 211 73 284
6 Idukki 390 32 422
7 Eranakulam 304 212 516
8 Thrissur 670 110 780
9 Palakkad 1087 0 1087
10 Malappuram 569 25 594
11 Kozhikode 480 5 485
12 Wayanad 12 0 12
13 Kannur 399 95 494
14 Kasargod 524 2293 2817
State 6255 9750 16005
OBM Verification – Kerosene subsidy
Fisheries department is providing subsidy for kerosene for the Out Board Motors in fishing through
Matsyafed. On 8-03-2015 OBMs were verified.
Kerala Marine Fisheries Statistics 2015
38
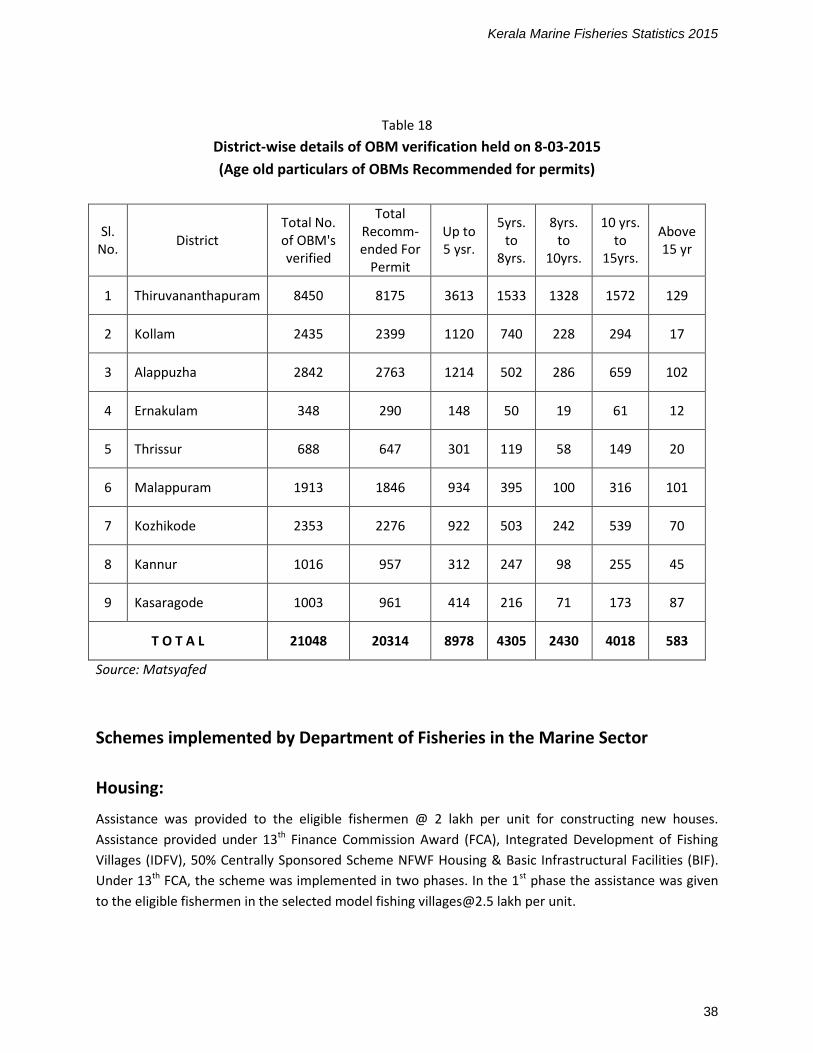
Table 18
District-wise details of OBM verification held on 8-03-2015
(Age old particulars of OBMs Recommended for permits)
Sl. No.
District Total No. of OBM's verified
Total Recomm- ended For
Permit
Up to 5 ysr.
5yrs. to
8yrs.
8yrs. to
10yrs.
10 yrs. to
15yrs.
Above 15 yr
1 Thiruvananthapuram 8450 8175 3613 1533 1328 1572 129
2 Kollam 2435 2399 1120 740 228 294 17
3 Alappuzha 2842 2763 1214 502 286 659 102
4 Ernakulam 348 290 148 50 19 61 12
5 Thrissur 688 647 301 119 58 149 20
6 Malappuram 1913 1846 934 395 100 316 101
7 Kozhikode 2353 2276 922 503 242 539 70
8 Kannur 1016 957 312 247 98 255 45
9 Kasaragode 1003 961 414 216 71 173 87
T O T A L 21048 20314 8978 4305 2430 4018 583
Source: Matsyafed
Schemes implemented by Department of Fisheries in the Marine Sector
Housing:
Assistance was provided to the eligible fishermen @ 2 lakh per unit for constructing new houses.
Assistance provided under 13th Finance Commission Award (FCA), Integrated Development of Fishing
Villages (IDFV), 50% Centrally Sponsored Scheme NFWF Housing & Basic Infrastructural Facilities (BIF).
Under 13th FCA, the scheme was implemented in two phases. In the 1st phase the assistance was given
to the eligible fishermen in the selected model fishing [email protected] lakh per unit.

Kerala Marine Fisheries Statistics 2015
39
Table 19
District-wise details of Housing Scheme for 2012-13 to 2015-16
Sl. No
Name of District
No. of Houses
Amount (Rs. In Lakh)
2012-13 2013-14 2014-15 2015-16
Total 13th FCA NFWF Housing
NFWF Housing
NFWF Housing
IDFV Housing
BIF Housing 1st Phase 2nd phase
1 Thiruvananthapuram 127 440 110 110 135 300 800 2022 4107.5
2 Kollam 284 320 110 113 90 250 700 1867 3876
3 Pathanamthitta 5 5 10 20
4 Alappuzha 568 800 110 110 150 300 800 2838 5960
5 Kottayam 20 20 25 4 10 62 141 282
6 Idukki 5 2 5 12 24
7 Ernakulam 284 440 100 100 140 300 800 2164 4470
8 Thrissur 123 72 50 40 12 40 182 519 1099.5
9 Palakkad 5 5 5 6 21 42
10 Malappuram 284 440 85 110 150 300 800 2169 4480
11 Kozhikkod 59 220 100 100 68 150 500 1197 2423.5
12 Wayanad 0 0
13 Kannur 65 50 55 40 20 75 146 451 934.5
14 Kasaragod 110 60 45 40 20 75 200 550 1155
TOTAL 1904 2867 800 800 800 1800 4990 13961 28874

Kerala Marine Fisheries Statistics 2015
40
House Repair:
During 2013-14, assistance was provided to the eligible fishermen @ Rs. 50000/ per unit for repairing
their houses. Assistance provided under 13th Finance Commission Award (FCA), Integrated
Development of Fishing Villages (IDFV) & Basic Infrastructural Facilities (BIF).
Table 20
District-wise details of House Repair for 2013-14 & 2015-16
Sl.No Name of District
No. of Houses alotted for Repair Amount (Rs. in Lakh)
2013-14 2015-16 TOTAL
13th FCA IDFV BIF
1 Thiruvananthapuram 140 250 820 1210 605
2 Kollam 141 220 700 1061 530.5
3 Pathanamthitta 5 2 12 19 9.5
4 Alappuzha 140 250 763 1153 576.5
5 Kottayam 25 8 24 57 28.5
6 Idukki 4 8 12 6
7 Ernakulam 130 96 600 826 413
8 Thrissur 50 16 50 116 58
9 Palakkad 5 9 23 37 18.5
10 Malappuram 140 78 400 618 309
11 Kozhikkod 120 16 150 286 143
12 Kannur 40 32 150 222 111
13 Kasaragod 60 23 100 183 91.5
TOTAL 1000 1000 3800 5800 2900
Sanitation: Assistance was provided to the eligible fishermen @ 17500/ per unit for constructing new
toilets. Assistance provided under the schemes: Integrated Coastal Area Development, 13th Finance
Commission Award (FCA), Integrated Development of Fishing Villages (IDFV) & Basic Infrastructural
Facilities (BIF).. Under 13th FCA, the scheme was implemented in two phases. In the 1st phase the
assistance was given to the eligible fishermen @ Rs. 20000/ per unit

Kerala Marine Fisheries Statistics 2015
41
Table 21
District-wise details of Sanitation scheme for 2012-13 to 2015-16
Sl. No.
Name of the district
No. of toilets Allotted
Amount (Rs. In Lakh)
2012-13 2013-14 2014-15 2015-16
TOTAL Integrated Dev. of coastal
areas
13th FCA-1st phase
13th FCA-2nd phase
IDFV IDFV BIF
1 Thiruvananthapuram 137 861 500 709 250 1768 4225 760.91
2 Kollam 114 247 669 300 325 600 2255 400.81
3 Pathanamthitta 40 25 8 73 12.78
4 Alappuzha 137 450 617 550 211 150 2115 381.39
5 Kottayam 52 47 100 12 211 36.93
6 Idukki 2 10 6 18 3.15
7 Ernakulam 114 729 250 450 150 583 2276 416.525
8 Thrissur 46 91 176 100 50 463 83.3
9 Palakkad 27 10 10 47 8.23
10 Malappuram 114 252 250 412 207 1235 222.425
11 Kozhikkod 114 15 290 300 300 150 1169 204.95
12 Kannur 91 186 50 6 333 58.28
13 Kasaragod 47 9 160 50 50 316 55.53
TOTAL 914 2654 3219 3013 1336 3600 14736 2645.21

Kerala Marine Fisheries Statistics 2015
42
Colony revamping:
Under 13th Finance Commission Award, during 2013-14, 65 colonies were renovated by giving financial
assistance to the eligible fishermen for constructing/repairing houses.
Table 22
District-wise details of House Construction & House Repair
in the scheme “Colony Revamping”
Sl.No Name of District
House construction House Repair
Number of Houses Allotted
Amount (Rs. In Lakh)
Number of Houses Allotted
Amount (Rs. In Lakh)
1 Thiruvananthapuram 87 174 301 150.5
2 Kollam 179 358 326 163
3 Pathanamthitta 1 2 0
4 Alappuzha 37 74 21 10.5
5 Kottayam 3 6 1 0.5
6 Idukki 0 0
7 Ernakulam 132 264 35 17.5
8 Thrissur 17 34 25 12.5
9 Palakkad 0 0
10 Malappuram 36 72 65 32.5
11 Kozhikkod 74 148 18 9
12 Kannur 1 2 53 26.5
13 Kasaragod 56 112 73 36.5
TOTAL 623 1246 918 459
Education concession:
Provide educational concession to the children of registered fishermen. The guideline for providing
educational concession to fishermen children is same as that of the Scheduled Caste children. Hence

Kerala Marine Fisheries Statistics 2015
43
fishermen children who got admission in the private professional colleges in government quota, those
who are studying in parallel colleges, those who are carrying distance education & research scholars are
eligible for educational concession.
Table 23
District-wise details of Education Concession for 2012-13, 2013-14 & 2014-15
Sl. No.
District
2012-13 2013-14 2014-15
No.of students
Amount utilized
Rs. in lakh
No.of students
Amount utilized
Rs. in lakh
No.of students
Amount utilized Rs. in lakh
1 Thiruvananthapuram 7241 215 9759 195 14636 650
2 Kollam 7145 150 2358 90 11662 390
3 Pathanamthitta 123 26.5 82 18 89 24
4 Alappuzha 12382 193 2869 130 19843 500
5 Kottayam 921 48 577 34 756 74
6 Idukki 18 4.5 3 2 12 5
7 Eranakulam 6797 210 3819 90 6125 232.5
8 Thrissur 919 25 760 25 807 38
9 Palakkad 95 10 74 7 87 19
10 Malappuram 9154 150 6721 83 28179 264
11 Kozhikkode 6603 85 3272 55 5616 113
12 Wayanad 9 3 6 1 13 2
13 Kannur 2076 55 1722 40 2348 64
14 Kasaragod 1855 25 1678 30 1466 24.5
TOTAL 55338 1200 33700 800 91639 2400

Kerala Marine Fisheries Statistics 2015
44
Table 24
Course-wise details of Education Concession during 2014-15
Sl. No. Name of Course Male Female TOTAL
1 up to +2/VHSE 35966 42568 78534
2 ITI 213 243 456
3 Polytechnic 284 174 458
4 Degree Fisheries 8 19 27
5 P .G Fisheries 9 8 17
6 Degree (Arts & Science) 4212 6240 10452
7 PG (Arts & Science) 355 620 975
8 M Phil. 2 2 4
9 Phd 2 4 6
10 B.Ed 8 86 94
11 Med 1 0 1
12 DCA 0 3 3
13 BCA 0 2 2
14 MCA 5 3 8
15 BBA 1 0 1
16 MBA 13 7 20
17 MBBS 14 8 22
18 BDS 8 8 16
19 B Tech 180 186 366
20 M Tech 4 4 8
21 LLB 7 6 13
22 BSW (Social Worker) 2 0 2
23 Paramedical 0 8 8
24 Physiotherapy 0 2 2
25 D pham. 0 1 1
26 B Pham. 1 5 6
27 Bsc Medical Lab Technician 0 2 2
28 General Nursing &Midwifery 0 11 11
29 BSc Nursing 3 105 108
30 BAMS 0 11 11
31 BHMS 0 2 2
32 Physical Education 3 0 3
TOTAL 41301 50338 91639

Kerala Marine Fisheries Statistics 2015
45
Table 25
Gender-wise details of Education Concession during 2014-15
Sl. No.
District Male Female Total Amount
utilized Rs. in lakh
1 Thiruvananthapuram 6335 8301 14636 650
2 Kollam 4033 7629 11662 390
3 Pathanamthitta 31 58 89 24
4 Alappuzha 8783 11060 19843 500
5 Kottayam 331 425 756 74
6 Idukki 9 3 12 5
7 Eranakulam 2780 3345 6125 232.5
8 Thrissur 405 402 807 38
9 Palakkad 43 44 87 19
10 Malappuram 13303 14876 28179 264
11 Kozhikkode 3369 2247 5616 113
12 Wayanad 7 6 13 2
13 Kannur 1131 1217 2348 64
14 Kasaragod 741 725 1466 24.5
TOTAL 41301 50338 91639 2400
Implementation of KMFR Act
Rescue Operations- Fisheries Stations
Over fishing in territorial waters lead the fishermen to the deep sea for their livelihood, and this
increases the causalities in the sea. The search and rescue operation in the entire territorial waters and
economic zone of India near Kerala cost is conducted by the Marine Enforcement Wing of Department
of Fisheries in coordination with Indian Coastal guard and Indian Navy. The bases of rescue operations
are five Fisheries Stations. The operational areas of these stations are the entire territorial waters and
economic zone adjoining to the respective coast line.

Kerala Marine Fisheries Statistics 2015
46
Table 26
Fisheries stations and their operational Area
Sl. No.
Fisheries Station
Operational Area
Coastal Length (Kms.)
Location
1 Vizhinjam, Thiruvananthapuram 80 Kollankode to Varkala
2 Neendakara, Kollam 130 Varkala to Anthakaran Azhi
3 Vypin, Eranakulam 100 Anthakaran Azhi to Chettuvai
4 Beypore, Kozhikkode 135 Chettuvai to Mahe
5 Kannur 145 Mahe to Manjeswaram
Total 590
Table 27
No. of sea patrollings, rescue operations & fishermen rescued
during 2012-13, 2013-14 & 2014-15
No. of sea patrollings conducted
No. of rescue operations conducted
No. of fishermen
rescued
2011-12 1243 340 4255
2012-13 1221 411 3163
2013-14 1271 403 4083
2014-15 1140 289 3230
Registration & Licensing of fishing vessels
Fishing vessels were registered and issue license for fishing

Kerala Marine Fisheries Statistics 2015
47
Table 28
The existing rates of fee for Registration and licensing of fishing vessels
as per Kerala Marine Fishing Regulation Act
[G.O (P) No. 14/2014/F&PD dated 03-02-2014) & (G.O (P) No. 384/15 / F&PD dated 22/5/2015]
Sl. No.
Class of fishing vessel Amount of fees (Rs.) Amount of security to be furnished (Rs.)
Licensing
1 Country fishing crafts fitted with mechanical means of propulsion
150 nil
2 Mechanised fishing boats upto 9 meter in length
750 1500
3 Mechanised fishing boats of more than 9 meter but less than 11.2 meter in length
1125 2000
4 Mechanised fishing boats of 11.2meter and above but less than 17meter in length
1500 3000
5 Mechanised fishing vessels above 17 meter up to 20 meter in length
2250 4500
6 Mechanised fishing vessels above 20 meter at 25 meter in length
5000 25000
7 Mechanised fishing vessels above 25 meter in length
10000 50000
Registration
1 Non-mechanised country crafts 75
2 Country -crafts fitted with Mechanical means of propulsion
up to 10 HP 150
above 10 HP 300
3 Mechanised fishing boats up to 36' in length
375
4 All other kinds of vessels 750
5 Hull length above 20 meter up to 25 meter
10000
6 Hull length above 25 meter 20000

Kerala Marine Fisheries Statistics 2015
48
Table 29
Details of fishing vessels registered in Kerala as on 11/11/2015
Sl. No.
Vessel Type Number of vessels registered as
on 11/11/2015
Motorised non Mechanical
1 Thanguvallom-OM 206
2 Kattamaram 52
3 Plywood Canoe-OM 4882
4 Fibre Craft-OM 2755
5 Fibre Craft 7477
6 Traditional Canoe-OM 5329
7 Fibre Canoe 2770
8 Plywood Canoe 5564
Motorised non Mechanical Total 29035
Motorised Mechanical
1 Gillnetter 279
2 Inboard engine fitted craft 240
3 Trawler 2644
4 Thanguvallom-IE 656
Motorised Mechanical Total 3819
Non Motorised
1 Fibre Craft-NM 545
2 Plywood Canoe-NM 349
3 Karamadi 53
4 Traditional Canoe-NM 755
5 Kattamaram 579
Non motorised Total 2281
GRAND TOTAL 35135
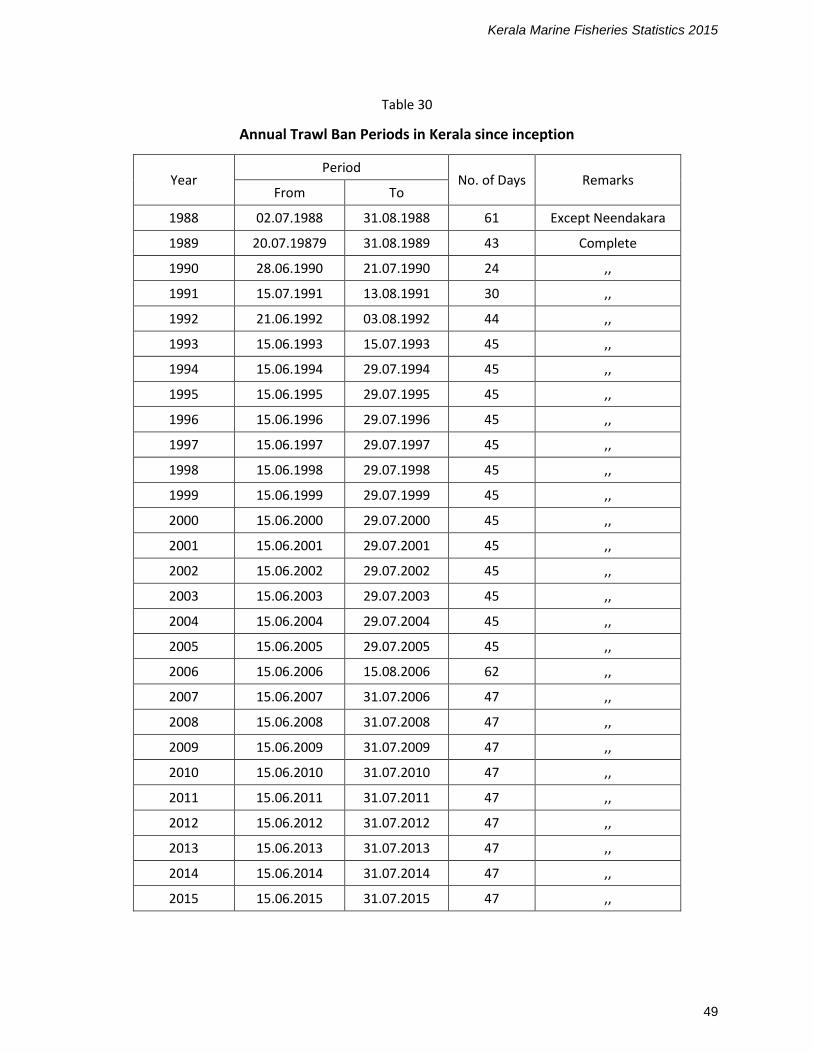
Trawl Ban
For enhancing and protecting fisheries resources 47 days trawl ban imposed during June- July. As a
fisheries management tool annual trawl ban was imposed in the state during the months of June –July
since 1988. Trawl Ban imposed in the state for 47 days from the midnight of 14th June to the midnight of
31st July
Kerala Marine Fisheries Statistics 2015
49
Table 30
Annual Trawl Ban Periods in Kerala since inception
Year Period
No. of Days Remarks From To
1988 02.07.1988 31.08.1988 61 Except Neendakara
1989 20.07.19879 31.08.1989 43 Complete
1990 28.06.1990 21.07.1990 24 ,,
1991 15.07.1991 13.08.1991 30 ,,
1992 21.06.1992 03.08.1992 44 ,,
1993 15.06.1993 15.07.1993 45 ,,
1994 15.06.1994 29.07.1994 45 ,,
1995 15.06.1995 29.07.1995 45 ,,
1996 15.06.1996 29.07.1996 45 ,,
1997 15.06.1997 29.07.1997 45 ,,
1998 15.06.1998 29.07.1998 45 ,,
1999 15.06.1999 29.07.1999 45 ,,
2000 15.06.2000 29.07.2000 45 ,,
2001 15.06.2001 29.07.2001 45 ,,
2002 15.06.2002 29.07.2002 45 ,,
2003 15.06.2003 29.07.2003 45 ,,
2004 15.06.2004 29.07.2004 45 ,,
2005 15.06.2005 29.07.2005 45 ,,
2006 15.06.2006 15.08.2006 62 ,,
2007 15.06.2007 31.07.2006 47 ,,
2008 15.06.2008 31.07.2008 47 ,,
2009 15.06.2009 31.07.2009 47 ,,
2010 15.06.2010 31.07.2010 47 ,,
2011 15.06.2011 31.07.2011 47 ,,
2012 15.06.2012 31.07.2012 47 ,,
2013 15.06.2013 31.07.2013 47 ,,
2014 15.06.2014 31.07.2014 47 ,,
2015 15.06.2015 31.07.2015 47 ,,

Kerala Marine Fisheries Statistics 2015
50
Free Ration
During trawl ban period, department is providing free ration to the traditional fishermen engaged in
trawling.
Table 31
Details of Free Ration
Districts
2011-12 2012-13 2013-14 2014-15
No. of families
Amount utilized Rs. in lakh
No. of families
Amount utilized Rs. in lakh
No. of families
Amount utilized Rs. in lakh
No. of families
Amount utilized Rs. in lakh
Kollam 6304 1.83 3974 1.09 3423 1.11 5076 0.75
Alappuzha 12107 6.01 8448 2.78 5708 1.45 5105 1.65
Eranakulam 6103 2.36 3571 1.09 3397 0.64 2364 0.55
Trissur 229 0.07 229 0.04 261 0.05 321 0.05
Malappuram 557 0.19 522 0.11 654 0.11 437 0.09
Kozhikkode 1883 0.76 1979 0.47 2591 0.52 1839 0.47
Kannur 138 0.08 187 0.05 168 0.05 226 0.06
Kasaragod 252 0.08
TOTAL 27573 11.38 18910 5.63 16202 3.92 15368 3.62
Savings-cum Relief scheme (off season relief to marine fishermen)
The scheme is intended to provide off season relief to fishermen both inland & marine. An amount of Rs
900/ collected in 9 installments from July to April from the marine fisherfolk and an amount of Rs. 2700/
released to them in 3 installments during lean season from May to July.

Kerala Marine Fisheries Statistics 2015
51
Table 32
No. of Marine fisherfolk under Savings cum Relief Scheme
from 2010-11 to 2014-15
Sl No Name of District
Number of beneficiaries
2010-11 2011-12 2012-13 2013-14 2014-15
1 Thiruvananthapuram 32962 30427 29137 31742 35551
2 Kollam 25420 28256 26944 27642 28982
3 Alappuzha 29993 34553 33253 33913 34556
4 Ernakulam 15267 16120 16248 16749 16705
5 Thrissur 5895 6109 6018 5778 5607
6 Malappuram 17505 18434 14948 14958 15627
7 Kozhikode 21150 21310 19470 20334 20710
8 Kannur 3666 2564 3336 3336 3823
9 Kasargode 7942 7611 7331 8089 8453
Total 159800 165384 156685 162541 170014
Suitable components of Fishing gear (Assistance for purchasing fishing gear)
The scheme envisages assisting the traditional fishermen for the purchase of fishing gear to be
used in their country crafts, by passing on subsidy limited to the cost or Rs. 6000 /- whichever is less.
Under the scheme fishermen who own crafts fitted with the Out Board Motors below 10HP only are
eligible for this subsidy. The assistance will be given only once to a fishermen.
The scheme is implementing through Matsyafed

Kerala Marine Fisheries Statistics 2015
52
Table 33
Year-wise details of the scheme 'Suitable components of fishing gear”
Year No. of beneficiary
groups assisted Subsidy released
(Rs. in Lakh)
1996-97 83 5.00
1997-98 165 10.00
1998-99 …. ….
1999-00 334 20.00
2000-01 255 15.00
2001-02 250 15.00
2002-03 116 7.00
2003-04 …. ….
2004-05 70 4.25
2005-06 50 3.00
2006-07 …. ….
2007-08 167 10.00
2008-09 333 20.00
2009-10 650 40.00
2010-11 667 40.00
2011-12 667 40.00
2012-13 833 50.00
2013-14 833 50.00
2014-15 333 20.00
Total 5806 349.25
Source – Matsyafed
Bankable scheme
The scheme envisages passing on subsidy for bank loans for fishing inputs purchased by
traditional fishermen. The scheme is implementing through Matsyafed since 1988-89. Matsyafed will
release to the banks subsidy @25% of the loan sanctioned by the banks.

Kerala Marine Fisheries Statistics 2015
53
Table 34
Year-wise details of the scheme 'Bankable Subsidy'
Year No. of beneficiary
groups assisted Subsidy released
(Rs. in Lakh)
1988-89 3 10.00
1989-90 …. ….
1990-91 2 ….
1991-92 3 10.00
1992-93 3 ….
1993-94 5 5.00
1994-95 1 5.00
1995-96 15 10.00
1996-97 78 20.00
1997-98 140 20.00
1998-99 132 20.00
1999-00 107 14.00
2000-01 78 10.00
2001-02 32 7.50
2002-03 8 2.80
2003-04 12 4.00
2004-05 49 ….
2005-06 …. ….
2006-07 40 5.00
2007-08 50 5.00
2008-09 28 25.00
2009-10 55 30.00
2010-11 268 30.00
2011-12 262 50.00
2012-13 262 50.00
2013-14 265 50.00
2014-15 266 50.00
Total 2164 433.3
Source – Matsyafed

Kerala Marine Fisheries Statistics 2015
54
Modernisation/ Motorisation of Country crafts (50% Centrally Sponsored scheme)
The scheme provides subsidy at the rate of Rs. 30000 per unit to replace outboard
motors below 10HP of already motorized crafts. The scheme is implemented through
Matsyafed.
Table 35
Year-wise details of 'Modernisation/ Motorisation of Country crafts'
Year No. of beneficiary
groups assisted Subsidy released
(Rs. in Lakh)
1988-89 581 16.875
1989-90 …. 57.623
1990-91 765 45.000
1991-92 451 30.000
1992-93 649 25.000
1993-94 626 60.000
1994-95 93 50.000
1995-96 947 50.000
1996-97 640 50.000
1997-98 161 60.000
1998-99 600 20.000
1999-00 191 20.000
2000-01 200 20.000
2001-02 200 30.000
2002-03 300 14.000
2003-04 154 ….
2004-05 42 4.250
2005-06 50 5.000
2006-07 …. ….
2007-08 50 5.000
2008-09 300 30.000
2009-10 150 15.000
2010-11 70 7.000
2011-12 400 40.000
2012-13 400 40.000
Total 8020 694.748
Source – Matsyafed

Kerala Marine Fisheries Statistics 2015
55
Self Employment Schemes for fisher folk with financial assistance of NBCFDC (National Backward Classes Finance Development Corporation) &
NMDFC (National Minorities Development & finance Corporation)
Self employment schemes for the members of fishermen families with the financial
assistance of NBCFDC (National Backward Classes Finance Development Corporation) & NMDFC
(National Minorities Development & finance Corporation) has been implementing in the state
since 1995-96 & 1997-98 respectively. The scheme is implementing through Matsyafed.
Funding Pattern
NBCFDC /NMDFC : 85%
Matsyafed : 10%
Beneficiary Contribution : 5%
The following schemes are implemented under the scheme
1. Term Loan Schemes
Self employment programmes under the following sectors are being assisted under the
scheme.
a) Agriculture &allied including fishing inputs b) Technical Trade c) Small Business d) Artisan & traditional occupation e) Transport & Service Sector
These loans are secured loans released to individuals. Maximum individual loan limit is
Rs. 2 lakh (for fishing inputs). NBCFDC /NMDFC releases 85% of the loan amount @ 3.5%
interest and Matsyafed distribute the loan with 10% contribution @ 6% interest to the
beneficiaries. The loan amount is repayable maximum in 5 years
2. Educational Loans
Educational loans are released to the children fro fishermen families for professional
courses. Maximum loan amount is Rs 2.50 lakh i.e Rs. 0.50 lakh per year. NBCFDC /NMDFC
releses the loan amount @ 1% interest and the loans distributed to the beneficiaries @ 3%
interest. The loan is repayable maximum in 5 years after completion of the course.
3. Micro Finance Scheme
The scheme is implementing among the fishermen Self Help Groups organised under Primary fishermen Co-operatives. A maximum loan limit to individual is Rs. 10,000 with a repayment period of maximum 2 years @6% interest.
These schemes are eligible for the fishermen families belonging to backward classes or
minority classes accordingly, whose family income is less than Rs. 55,000/- in urban areas and
below Rs. 40000/- in rural areas

Kerala Marine Fisheries Statistics 2015
56
Table 36
Year-wise details of Term Loan through
NBCFDC (National Backward Classes Finance Development Corporation)
Amount Received
(Rs. in lakh)
Details of amount distributed (Rs in lakh) No. of benef- iciaries
NBCFDC share
Matsyafed share
Beneficiary contribution
Total amount
1995-96 40.69 40.69 4.79 2.39 47.87 300
1996-97 34.68 34.68 4.08 2.04 40.8 290
1997-98 90.01 90.01 10.59 5.74 106.34 836
1998-99 190.00 190.00 19.00 9.50 218.5 1365
1999-00
2000-01 398.00 398.00 46.81 23.85 468.66 2035
2001-02 283.07 283.07 33.30 16.65 333.02 1192
2002-03 58.07 58.07 6.83 3.42 68.32 321
2003-04 31.38 31.38 3.69 1.85 36.92 75
2004-05
2005-06 13.11 13.11 1.54 0.77 15.42 36
2006-07 158.93 158.93 18.70 9.35 186.98 296
2007-08 200.00 200.00 23.58 11.79 235.37 347
2008-09 200.00 200.00 23.58 11.79 235.37 376
2009-10 600.00 600.00 70.74 35.37 706.11 3605
2010-11 600.00 600.00 70.60 35.30 705.9 1539
2011-12 300.00 300.00 35.30 17.65 352.95 343
2012-13 1000.00 1000.00 117.65 58.82 1176.47 632
2013-14 500.00 500.00 58.82 29.41 588.23 439
2014-15 500.00 500.00 58.82 29.41 588.23 420
5197.94 5197.94 608.42 305.1 6111.46 14447
Source – Matsyafed

Kerala Marine Fisheries Statistics 2015
57
Table 37
Year-wise details of Term Loan through
NMDFC (National Minority Development Finance Corporation)
Amount Received
(Rs. in lakh)
Details of amount distributed (Rs in lakh) No. of
beneficiaries NMDFC share
Matsyafed share
Beneficiary contribution
Total amount
1998-99 152.31 152.31 17.92 8.96 179.19 690
1999-00 78.50 78.50 9.24 4.62 92.36 471
2000-01 119.34 119.34 14.04 7.02 140.40 595
2001-02 200.00 200.00 23.53 11.76 235.29 705
2002-03 100.00 100.00 11.76 5.88 117.64 394
2003-04 150.00 150.00 17.65 8.82 176.47 365
2004-05 55.00 55.00 6.47 3.24 64.71 131
2005-06 0 0 0 0 0 0
2006-07 180.00 180.00 21.18 10.59 211.77 323
2007-08 300.00 300.00 35.29 17.65 352.94 537
2008-09 150.00 150.00 17.65 8.82 176.47 299
2009-10 250.00 250.00 29.41 14.71 294.12 369
2010-11 413.91 413.91 48.70 24.35 486.96 597
2011-12 350.00 350.00 41.18 20.58 411.76 426
2012-13 350.00 350.00 41.18 20.60 411.78 300
2013-14 100.00 100.00 11.76 5.88 117.64 103
2014-15 200.00 200.00 11.76 5.88 217.64 167
3149.06 3149.06 358.72 179.36 3687.14 6472
Source – Matsyafed

Kerala Marine Fisheries Statistics 2015
58
Table 38
Year-wise details of Educational Loan through
NBCFDC (National Backward Classes Finance Development Corporation)
Amount Received
(Rs. in lakh)
Details of amount distributed (Rs in lakh) No. of
beneficiaries NBCFDC
share Matsyafed
share Beneficiary
contribution Total
amount
2000-01 0.7 0.7 0.05 …. 0.75 1
2001-02 0.7 0.7 0.05 …. 0.75 1
2002-03 1.48 1.48 0.16 …. 1.64 4
2003-04 0.27 0.27 0.01 …. 0.28 1
No funds during 2004-05,2005-06, 2006-07, 2007-08
2008-09 0.95 0.95 0.05 …. 1.00 1
2009-10 1.03 1.03 0.15 …. 1.18 2
2010-11 4.92 4.92 0.26 …. 5.18 9
2011-12 2.65 2.65 0.15 …. 2.80 5
2012-13 2.75 2.75 0.15 …. 2.90 3
2013-14
2014-15 1.67 1.67 0.08 …. 1.75 2
Total 17.12 17.12 1.11 …. 18.23 29
Source – Matsyafed
Table 39
Details Micro Finance (MF) schemes during 2014-15
Sl.
No. District
No. of beneficiaries Amount utilized
Male Female Total Male Female Total
1 Thiruvananthapuram 800 5800 6600 120 872.07 992.07
2 Kollam 680 6140 6820 102 920.8 1022.8
3 Alappuzha 1000 8900 9900 150 1342.89 1492.89
4 Kottayam 75 685 760 11.5 104.25 115.75
5 Ernakulam 1015 10465 11480 152.2 1369.7 1521.9
6 Thrissur 265 2385 2650 40 357.7 397.7
7 Malappuram 80 720 800 12 108 120
8 Kozhikode 265 2460 2725 40 368.8 408.8
9 Kannur 90 810 900 13.5 121.5 135
10 Kasargod 168 1512 1680 25.2 226.8 252
Total 4438 39877 44315 666.4 5792.51 6458.91
Source – Matsyafed

Kerala Marine Fisheries Statistics 2015
59
Table 40
Details Micro Finance (MF) schemes as on 31-03-2015 since inception
District
No. of societies availed
MFs
No. of groups benefitted No. of members
benefitted Fund utilized
Male groups
Female groups
Total Male
groups Female groups
Total Male
groups Female groups
Total
Thiruvananthapuram 37 448 2281 2729 6339 35640 41979 580 8341.71 8921.71
Kollam 50 142 3476 3618 1412 26575 27987 133.15 3760.29 3893.44
Alappuzha 57 346 2104 2450 4155 26747 30902 565.67 4798.08 5363.75
Kottayam 23 20 263 283 1541 3399 4940 57.58 782.15 839.73
Ernakulam 58 379 2631 3010 4031 25752 29783 552.67 4434.09 4986.76
Thrissur 24 33 908 941 416 10338 10754 55.99 2275.72 2331.71
Malappuram 28 97 601 698 1036 6246 7282 105.4 885.25 990.65
Kozhikode 50 169 1416 1585 2171 14479 16650 246.8 3200.82 3447.62
Kannur 17 39 302 341 785 4051 4836 48.04 584.34 632.38
Kasargode 23 99 421 520 1107 4083 5190 257.47 714 971.47
Total 367 1772 14403 16175 22993 157310 180303 2602.77 29776.45 32379.22
Source – Matsyafed

Kerala Marine Fisheries Statistics 2015
60
‘Interest Free Loan (IFL)’ - Women Empowerment Programme
The scheme is implementing in the state since 2008-09 through Matsyafed. As per this scheme
interest free loan, initially @Rs. 5000/- and subsequently Rs.10000/-, Rs. 15000/- & Rs. 20000/- on
closure of each loan is provided to the fisherwomen for fish vending & fisheries allied works. The
period of loan is one year
The loan amount is mobilized from NBCFDC (National Backward Classes Finance Development
Corporation) & NMDFC (National Minorities Development & finance Corporation) at an interest of 6%.
The interest portion of the loan is provided by the state government.
Table 41
Details of ‘Interest Free Loan (IFL)’ during 2014-15
Sl. No.
District No. of
beneficiaries Fund utilized (Rs.
In lakh)
1 Thiruvananthapuram 5357 749.90
2 Kollam 603 84.60
3 Alappuzha 1399 175.95
4 Kottayam 3663 269.90
5 Ernakulam 10184 1028.10
6 Thrissur 2445 162.6
7 Kannur 75 10.90
8 Kasargod 1764 316.55
Total 25490 2798.5
Table 42
Details of ‘Interest Free Loan (IFL)’ as on 31-03-2015 since inception
Sl. No.
District
No. of societies availed
IFL’s
No. of groups
benefitted
No. of members benefitted
Fund utilized
1 Thiruvananthapuram 44 3800 22972 5850.65
2 Kollam 35 618 2745 617.00
3 Alappuzha 52 1174 5436 1154.70
4 Kottayam 21 1711 9659 1077.72
5 Ernakulam 60 4342 22086 4545.55
6 Thrissur 19 519 2660 284.55
7 Kozhikode 14 20 60 17.00
8 Kannur 14 216 1210 168.00
9 Kasargode 24 578 3139 1121.00
Total 283 12978 69967 14836.17
Source – Matsyafed

Kerala Marine Fisheries Statistics 2015
61
National Co Operative Development Corporation (NCDC) assisted
Integrated Fisheries Development Projects (IFDP)
The NCDC assisted Integrated Fisheries Development Projects (IFDP) are implemented as
90% Centrally Sponsored Scheme implemented for assisting fishermen of Kerala. The implementing
agency is Matsyafed and the assistance is provided as loan with subsidy. The loan is distributed to the
fishermen through the Primary Fishermen Development and Welfare Co-Operative societies affiliated to
Matsyafed. Loan is provided for procuring fishing implements such as Craft(Vallom), Out Board Engines
and Webbings in kind, infrastructure facilities for fish marketing & processing to the primaries for the
benefit of member fishermen and Working Capital for fish vending and Marketing.
Fifteen number of Integrated Fishery Development Projects (IFDP) has been implemented in the
state with the assistance of National Co-operative Development Corporation (NCDC) since its inception
in 1984.
The Objectives of the project are:
To provide a mix of service to member fishermen through the Primary societies for the
sustainable maintenance of fishing units.
Intervention in the secondary marketing chain and better realization for the produce of the
member fishermen.
To provide necessary infrastructure facilities to the primary co-operatives to support and tackle
the more organized market forces.
To develop the Primary Co operatives as self-reliant profit centers through service marketing.
To generate more employment opportunities for women in fishing communities.
To create awareness among members in social participation and Institutionalization
About 98000 fishermen were assisted so far under NCDC assisted IFDP schemes. The total dues
of the schemes implemented upto 2007 December were set off in the debt relief scheme of Govt. of
Kerala. Debt relief for a total amount of Rs.115 crores including interest and penal interest of 48355
fishermen was provided. The interest and penal interest were waived by Matsayfed and primary co-
operatives and Principal amount of Rs.54 crore was converted as share capital of Govt. of Kerala in
Matsyafed and primary societies. The loan repayment of schemes implemented after debt relief, to GOK
is 100%.
The NCDC assisted Integrated Fisheries Development Projects (IFDP) is implemented under State
plan as a 90% centrally Sponsored Scheme. The pattern of assistance from NCDC is 90% of Project cost
as Loan to Government. For the fishing inputs like Out Board Motor and for marketing Infrastructure
facilities GOI provided back ended subsidy to GOK. For IFDP 12-13 onwards 25% subsidy is available for
fishing inputs from the Department of Marketing and Infrastructure, GOI which will be passed on to GOK
through NCDC. GOK have to repay the loan less the subsidy to NCDC with interest at the prevailing rate
(12.5%) within a period of 5 years without any moratorium.

Kerala Marine Fisheries Statistics 2015
62
Table 43
Projects implemented with the assistance of NCDC fund through Matsyafed
Sl. No
Scheme Period of
implementation
Project Outlay
(Rs. in lakhs)
1 Integrated Fisheries Development Project - Phase I 1985-86 to 1990-91
555.84
2 ,, - Phase II 1987-88 to 1993-94
1034.28
3 ,, - Phase III 1991-92 to 1996-97
4228.68
4 ,, - Inland 1998-99 to 1999-00
636.37
5 Fish Marketing Centre 1998-99 to 2000-01
339.00
6 Integrated Fisheries Development Project - 1998-99 1998-99 to 1999-00
1989.75
7 ,, - 1999-00 1999-00 to 2000-01
1690.00
8 ,, - 2000-01 2000-01 to 2001-02
1634.85
9 ,, - 2001-02 2001-02 2702.50
10 IFDP Project Matsya - 2003-05 2003-05 2458.00
11 Integrated Fisheries Development Project - 2006-07 2006-08 1504.50
12 ,, - 2007-08 2009-11 3402.00
13 ,, - 2010-11 2010-11 3550.20
14 ,, - 2011-12 2012-13 3153.82
15 ,, - 2012-13 2013-14 3134.00
16 ,, - 2013-14 2014-15 3468.00
,, - 2014-15 2015-16 4242.66
Total 39724.45
Source – Matsyafed
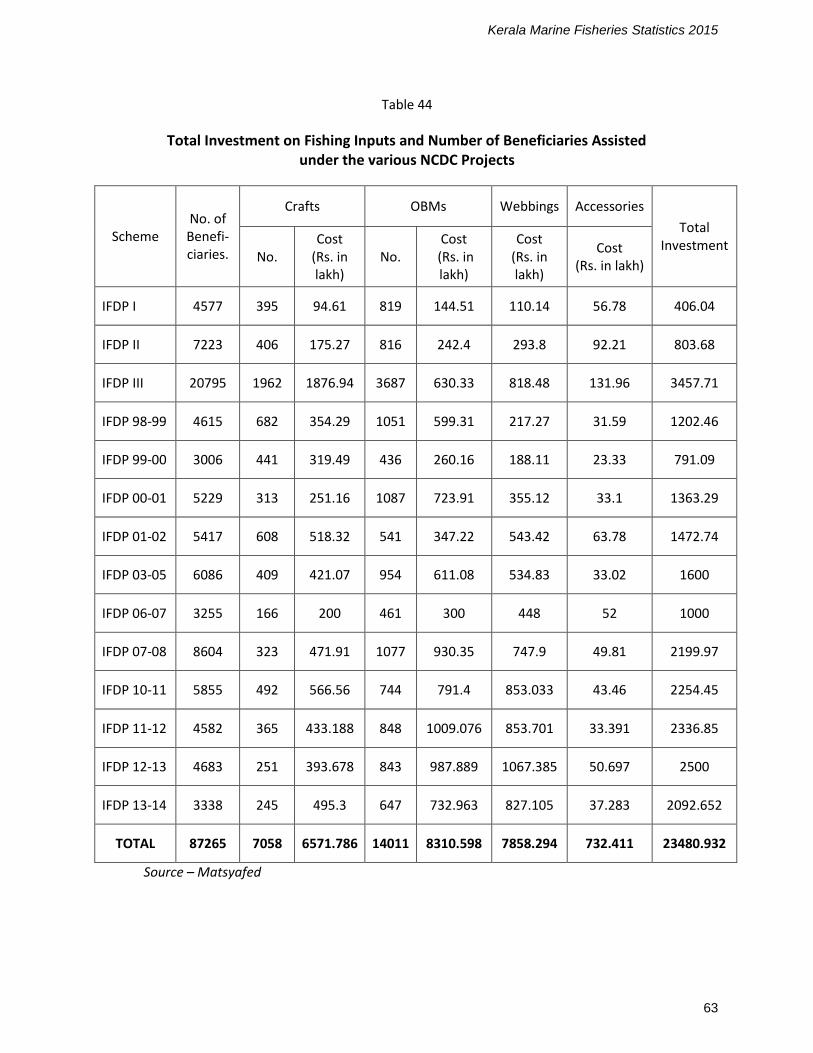
Kerala Marine Fisheries Statistics 2015
63
Table 44
Total Investment on Fishing Inputs and Number of Beneficiaries Assisted under the various NCDC Projects
Scheme No. of Benefi- ciaries.
Crafts OBMs Webbings Accessories
Total Investment
No. Cost
(Rs. in lakh)
No. Cost
(Rs. in lakh)
Cost (Rs. in lakh)
Cost (Rs. in lakh)
IFDP I 4577 395 94.61 819 144.51 110.14 56.78 406.04
IFDP II 7223 406 175.27 816 242.4 293.8 92.21 803.68
IFDP III 20795 1962 1876.94 3687 630.33 818.48 131.96 3457.71
IFDP 98-99 4615 682 354.29 1051 599.31 217.27 31.59 1202.46
IFDP 99-00 3006 441 319.49 436 260.16 188.11 23.33 791.09
IFDP 00-01 5229 313 251.16 1087 723.91 355.12 33.1 1363.29
IFDP 01-02 5417 608 518.32 541 347.22 543.42 63.78 1472.74
IFDP 03-05 6086 409 421.07 954 611.08 534.83 33.02 1600
IFDP 06-07 3255 166 200 461 300 448 52 1000
IFDP 07-08 8604 323 471.91 1077 930.35 747.9 49.81 2199.97
IFDP 10-11 5855 492 566.56 744 791.4 853.033 43.46 2254.45
IFDP 11-12 4582 365 433.188 848 1009.076 853.701 33.391 2336.85
IFDP 12-13 4683 251 393.678 843 987.889 1067.385 50.697 2500
IFDP 13-14 3338 245 495.3 647 732.963 827.105 37.283 2092.652
TOTAL 87265 7058 6571.786 14011 8310.598 7858.294 732.411 23480.932
Source – Matsyafed

Kerala Marine Fisheries Statistics 2015
64
Table 45
IFDP 2013-14: Project Funding from NCDC to Govt. of Kerala (Rs. in lakh)
Sl. No
Components Outlay Loan Subsidy Total
1 Supply/distribution of fishing inputs 2600 1690 650 2340
65% 25% 90%
2 Input Security 104 0 0 0
3 Working Capital Assistance for Fish Auction & Marketing
554 554 0 554
100% 100%
4 Office cum Godown facilities to MATSYAFED District offices and Primaries
90 81 0 81
90% 90%
5 Assistance to men vendors for marketing inputs
80 72 0 72
90 90%
6 Project Management 30 0 0 0
7 Extension and Training 10 0 0 0
TOTAL 3468 2397 650 3047
Source – Matsyafed
Table 46
IFDP 2013-14: Project Funding from NCDC to Govt. of Kerala (Rs. in lakh)
No Components Outlay Loan Subsidy Total
1 Supply/distribution of fishing inputs 3333.33 2500 500 3000
75% 15% 90%
2 Input Security 133.33 0 0 0
3 Working Capital Assistance for Fish Auction & Marketing
670 670 0 670
100% 100%
4 Office cum Godown facilities to MATSYAFED District offices and Primaries
51 45.9 0 45.9
90% 90%
5 Assistance to men vendors for marketing inputs
6 Project Management 40 0 0 0
7 Extension and Training 15 0 0 0
TOTAL 4242.66 3215.90 500 3715.90
Source – Matsyafed

Kerala Marine Fisheries Statistics 2015
65
Table 47
IFDP 2013-14: Project Funding from Govt. of Kerala to MATSYAFED/Societies (Rs. In Lakh)
Sl. No
Components Outlay Loan Subsidy DMI
Grant Share
Capital Total
Beneficiary Contribution
1 Supply/distribution of fishing inputs
2600 1365 0 650 325 2340 260
52.50% 25% 12.50% 90% 10%
2 Input Security 104 52 52 52
50% 50% 50%
3 Working Capital Assistance for Fish Auction & Marketing
554 277 277 554 0
50% 50% 100% 0%
4 Office cum Godown facilities to MATSYAFED District offices and Primaries
90 49.5 20.25 11.25 81 9
55% 22.50% 12.50% 90% 10%
5 Assistance to men vendors for marketing inputs
80 44 18 10 72 8
55% 22.50% 12.50% 90% 10%
6 Project Management 30 30 0 30 0
100% 100% 0%
7 Extension and Training 10 9 0 9 1
90% 90% 10%
TOTAL 3468 1735.5 129.25 650 623.25 3138 330
Source – Matsyafed
Table 48
IFDP 2014-15: Project Funding from Govt. of Kerala to MATSYAFED/Societies (Rs. In Lakh)
Sl. No
Components Outlay Loan Subsidy CSISAC Grant
Share Capital
Total Beneficiary
Contribution
1 Distribution of fishing inputs 3333.33 1750 333.33 500 416.67 3000 333.33
52.50% 10% 15% 12.50% 90% 10%
2 Input Security 133.33 66.67 66.67 66.66
50% 50% 50%
3 Working Capital Assistance for Fish Auction & Marketing
670 335 335 670 0
50% 50% 100% 0%
4 Office cum Godown facilities to MATSYAFED District offices and Primaries
51 28.05 11.48 6.375 45.91 5.1
55% 22.50% 12.50% 90% 10%
5 Project Management 40 40 0 40 0
100% 100% 0%
6 Extension and Training 15 13.5 13.5 1.5
90% 90% 10%
TOTAL 4242.66 2113.05 464.98 500 758.045 3836.08 406.59
Source – Matsyafed

Kerala Marine Fisheries Statistics 2015
66
Welfare Schemes by Kerala Fishermen Welfare Fund Board
Pension schemes
The scheme is implementing through Kerala Fishermen Welfare Fund Board. Supporting old age
fishermen , old age allied fishermen workers and the wives of deceased fishermen by providing pension
@Rs.600/month.
Table 49
Number of Pensioners under Fishermen Welfare Scheme during 2014-3-14 & 2014-15
Sl. No. District
Number of pensioners
2013-14 2014-15
Old age Widow Total Old age Widow Total
1 Thiruvananthapuram 6030 1218 7248 7993 1310 9303
2 Kollam 5031 1074 6105 7046 1528 8574
3 Pathanamthitta 117 7 124 182 20 202
4 Alappuzha 8699 1306 10005 9444 1448 10892
5 Kottayam 1907 129 2036 2331 241 2572
6 Idukki 34 2 36 158 5 163
7 Ernakulam 5347 628 5975 6280 967 7247
8 Thrissur 1916 442 2358 2272 541 2813
9 Palakkad 76 8 84 236 15 251
10 Malappuram 2398 642 3040 2827 852 3679
11 Kozhikode 2915 647 3562 2751 1178 3929
12 Wayanad 0 0
13 Kannur 1184 380 1564 1345 387 1732
14 Kasargode 1141 408 1549 1602 403 2005
Total 36795 6891 43686 44467 8895 53362
Source: Fishermen Welfare Fund Board, Kerala
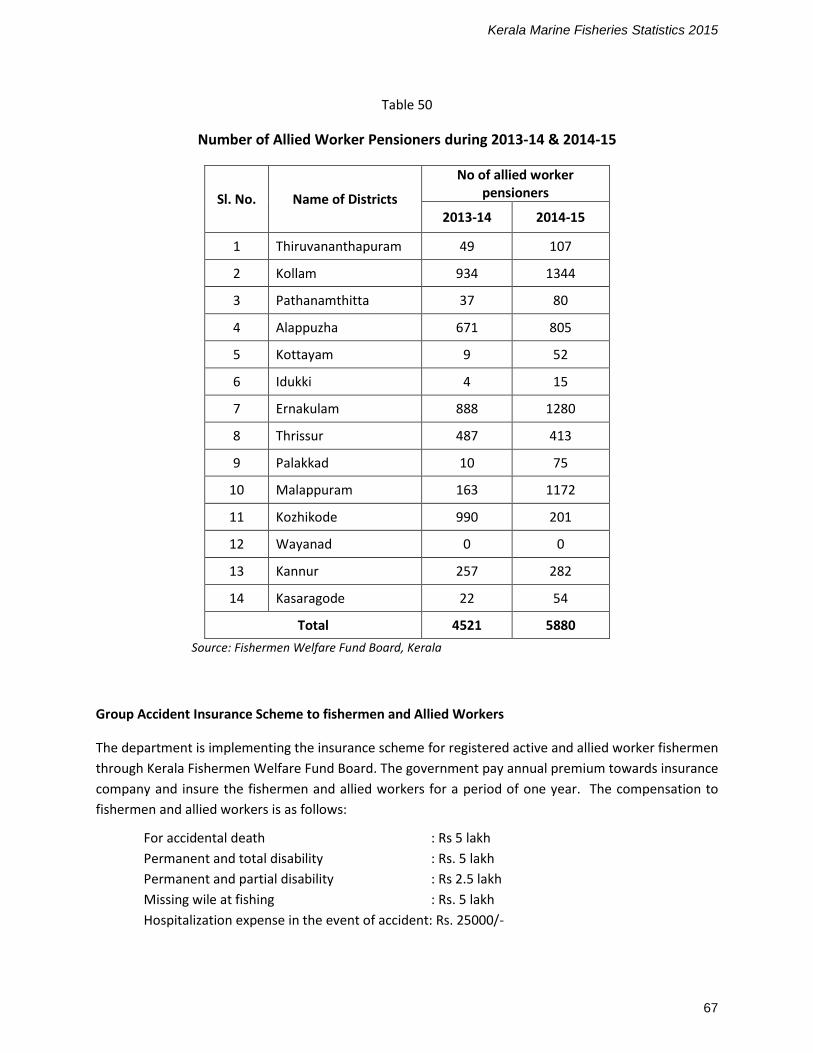
Kerala Marine Fisheries Statistics 2015
67
Table 50
Number of Allied Worker Pensioners during 2013-14 & 2014-15
Sl. No. Name of Districts
No of allied worker pensioners
2013-14 2014-15
1 Thiruvananthapuram 49 107
2 Kollam 934 1344
3 Pathanamthitta 37 80
4 Alappuzha 671 805
5 Kottayam 9 52
6 Idukki 4 15
7 Ernakulam 888 1280
8 Thrissur 487 413
9 Palakkad 10 75
10 Malappuram 163 1172
11 Kozhikode 990 201
12 Wayanad 0 0
13 Kannur 257 282
14 Kasaragode 22 54
Total 4521 5880
Source: Fishermen Welfare Fund Board, Kerala
Group Accident Insurance Scheme to fishermen and Allied Workers
The department is implementing the insurance scheme for registered active and allied worker fishermen
through Kerala Fishermen Welfare Fund Board. The government pay annual premium towards insurance
company and insure the fishermen and allied workers for a period of one year. The compensation to
fishermen and allied workers is as follows:
For accidental death : Rs 5 lakh
Permanent and total disability : Rs. 5 lakh
Permanent and partial disability : Rs 2.5 lakh
Missing wile at fishing : Rs. 5 lakh
Hospitalization expense in the event of accident: Rs. 25000/-

Kerala Marine Fisheries Statistics 2015
68
Table 51
District-wise details of fishermen brought under Group insurance Scheme
during 2014-15
Sl. No.
District
Acive fishermen Allied worker
fishermen Total
No Fishermen
Premium Amount (Rs.
In lakh)
No Fisherm
en
Premium Amount (Rs.
In lakh)
No Fishermen
Premium Amount (Rs.
In lakh)
1 Trivandrum 51812 83.25 1514 2.43 53326 85.68
2 Kollam 26129 41.98 16092 25.86 42221 67.84
3 Pathanamthitta 199 0.32 589 0.95 788 1.27
4 Alappuzha 43411 69.75 23723 38.12 67134 107.87
5 Kottayam 4722 7.59 793 1.27 5515 8.86
6 Idukki 158 0.25 55 0.09 213 0.34
7 Ernakulam 26182 42.07 14346 23.05 40528 65.12
8 Thrissur 6880 11.05 3073 4.94 9953 15.99
9 Palaghat 462 0.74 285 0.46 747 1.20
10 Malappuram 34089 54.77 4430 7.12 38519 61.89
11 Kozhikode 24455 39.29 11459 18.41 35914 57.71
12 Wayanad 0 0.00 505 0.81 505 0.81
13 Kannur 7297 11.72 1576 2.53 8873 14.26
14 Kasargod 10514 16.89 906 1.46 11420 18.35
TOTAL 236310 379.69 79346 127.49 315656 507.18
Thanal – Income Support Scheme to Fishermen
The department is implementing this income support scheme through Kerala Fishermen Welfare Fund
Board with funding support of Labour Department. The department is supporting the fishermen who
have Bio-metric ID card, with an amount of Rs. 1350 per year.
Death while fishing or immediately thereafter not due to accident:
The dependents of the fishermen who happen to die due to unexpected causes while fishing or
immediately thereafter not due to accident are eligible for the benefit under the scheme. The rate of
financial assistance is Rs.20, 000/-.

Kerala Marine Fisheries Statistics 2015
69
Financial assistance for the marriage of daughters of fishermen:
Financial Assistance @ Rs.1500/- is provided for the marriage of all daughters of fishermen.
Financial assistance for the death of dependants:
Provide financial assistance @Rs. 600/- to the fishermen to meet expenses in connection with the
death of their dependents.
Financial assistance to the dependents for the death of fishermen:
On the death of a fisherman by any reason, the dependents were paid an amount of Rs.5000/- for
meeting the funeral expenses. If there is no legal dependents the person who meets the funeral
expenses will be paid Rs.1000/-.
Financial Assistance for treatment of Fatal diseases:
Registered fishermen who are between the age of 23 years and 60 years are eligible for financial
assistance for treatment of fatal diseases. For treatment of cancer, heart diseases and kidney
problems the assistance is Rs. 50000/-, for paralysis Rs. 12000/- and for mental diseases Rs. 5000/-
Table 52
Details of Welfare Relief Schemes Implemented by Kerala Fishermen's Welfare Fund Board
Sl. No
Details of Scheme No. of beneficiaries
2013-14 2014-15
(1) (2) (3) (4)
FISHERMEN WELFARE SCHEME
1 Death of Fishermen 676 814
2 Fatal Disease 328 206
3 Old age Pension 36795 44467
4 Widow pension 6891 8895
5 Marriage assistance 1314 2850
6 Special Sanction 0 0
7 Death of dependents 257 853
8 Maternity assistance 73 140
9 Temporary disability 95 85
10 Sterilization Operation 61 26
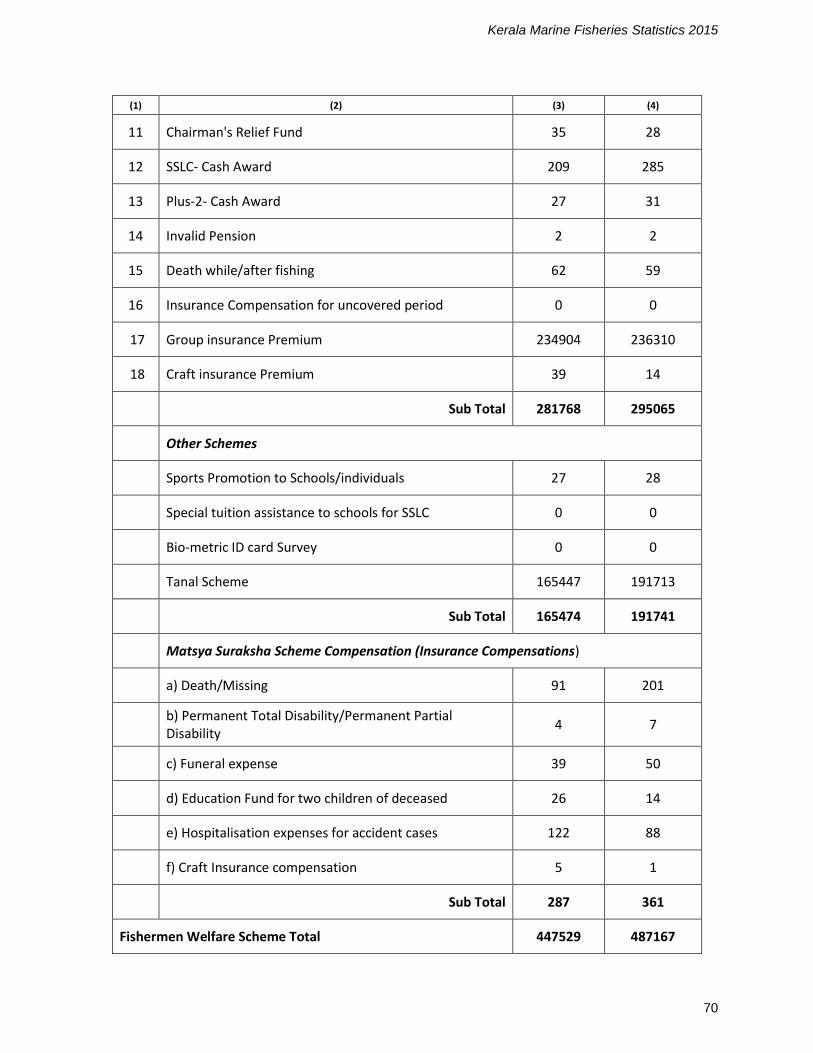
Kerala Marine Fisheries Statistics 2015
70
(1) (2) (3) (4)
11 Chairman's Relief Fund 35 28
12 SSLC- Cash Award 209 285
13 Plus-2- Cash Award 27 31
14 Invalid Pension 2 2
15 Death while/after fishing 62 59
16 Insurance Compensation for uncovered period 0 0
17 Group insurance Premium 234904 236310
18 Craft insurance Premium 39 14
Sub Total 281768 295065
Other Schemes
Sports Promotion to Schools/individuals 27 28
Special tuition assistance to schools for SSLC 0 0
Bio-metric ID card Survey 0 0
Tanal Scheme 165447 191713
Sub Total 165474 191741
Matsya Suraksha Scheme Compensation (Insurance Compensations)
a) Death/Missing 91 201
b) Permanent Total Disability/Permanent Partial Disability
4 7
c) Funeral expense 39 50
d) Education Fund for two children of deceased 26 14
e) Hospitalisation expenses for accident cases 122 88
f) Craft Insurance compensation 5 1
Sub Total 287 361
Fishermen Welfare Scheme Total 447529 487167

Kerala Marine Fisheries Statistics 2015
71
(1) (2) (3) (4)
ALLIED WORKERS WELFARE SCHEME
1 Death of Allied worker 91 114
2 Fatal diseases 57 44
3 Old age Pension 4521 5880
4 Marriage Assistance 177 311
5 Special sanction 0 0
6 Maternity Assistance 20 24
7 Sterilization Operation 5 18
8 SSLC- Cash Award 35 46
9 Plus-2- Cash Award 5 8
10 Group Insurance Premium (Matsya Suraksha Scheme) 76510 79346
Sub Total 81421 85791
Matsya Suraksha Scheme Compensation (Insurance Compensations)
1 Death/Missing 6 15
2 Funeral Expenses 3 3
3 Education Fund for two children of deceased 2 4
4 Hospitalization expenses for accident cases 16 18
Sub Total 27 40
Allied Workers Welfare Scheme Total 81448 85832
GRAND TOTAL 528977 572998
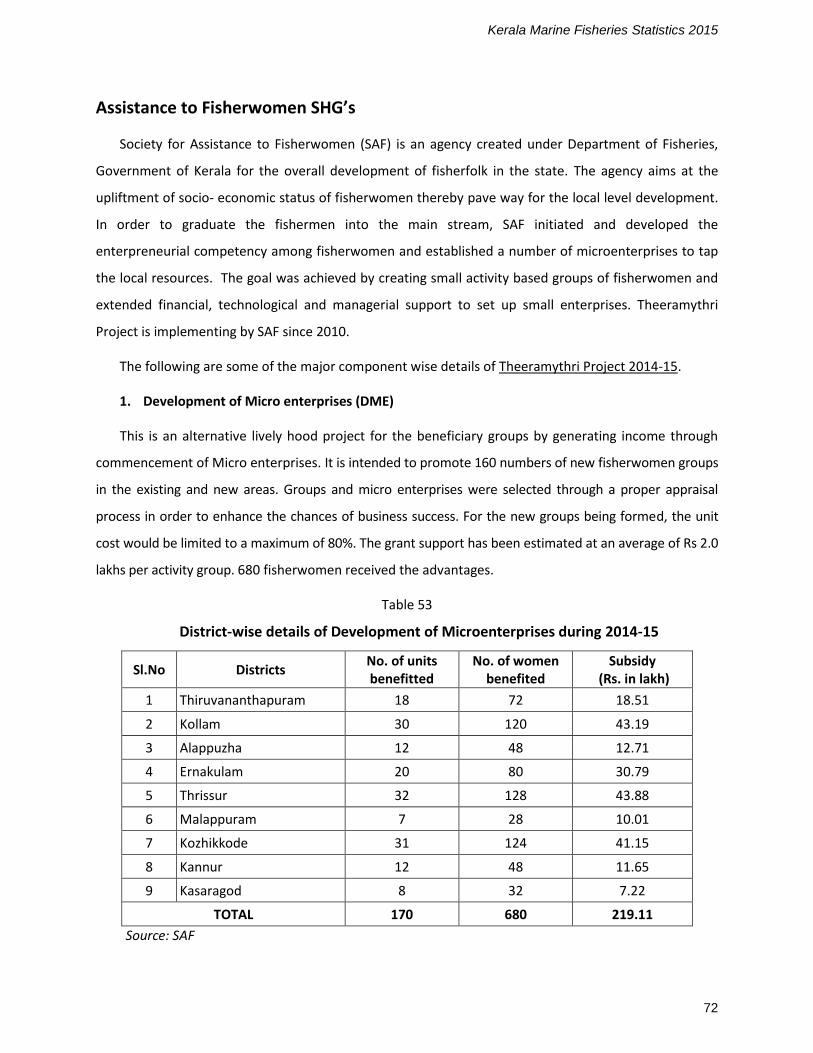
Kerala Marine Fisheries Statistics 2015
72
Assistance to Fisherwomen SHG’s
Society for Assistance to Fisherwomen (SAF) is an agency created under Department of Fisheries,
Government of Kerala for the overall development of fisherfolk in the state. The agency aims at the
upliftment of socio- economic status of fisherwomen thereby pave way for the local level development.
In order to graduate the fishermen into the main stream, SAF initiated and developed the
enterpreneurial competency among fisherwomen and established a number of microenterprises to tap
the local resources. The goal was achieved by creating small activity based groups of fisherwomen and
extended financial, technological and managerial support to set up small enterprises. Theeramythri
Project is implementing by SAF since 2010.
The following are some of the major component wise details of Theeramythri Project 2014-15.
1. Development of Micro enterprises (DME)
This is an alternative lively hood project for the beneficiary groups by generating income through
commencement of Micro enterprises. It is intended to promote 160 numbers of new fisherwomen groups
in the existing and new areas. Groups and micro enterprises were selected through a proper appraisal
process in order to enhance the chances of business success. For the new groups being formed, the unit
cost would be limited to a maximum of 80%. The grant support has been estimated at an average of Rs 2.0
lakhs per activity group. 680 fisherwomen received the advantages.
Table 53
District-wise details of Development of Microenterprises during 2014-15
Sl.No Districts No. of units benefitted
No. of women benefited
Subsidy (Rs. in lakh)
1 Thiruvananthapuram 18 72 18.51
2 Kollam 30 120 43.19
3 Alappuzha 12 48 12.71
4 Ernakulam 20 80 30.79
5 Thrissur 32 128 43.88
6 Malappuram 7 28 10.01
7 Kozhikkode 31 124 41.15
8 Kannur 12 48 11.65
9 Kasaragod 8 32 7.22
TOTAL 170 680 219.11
Source: SAF

Kerala Marine Fisheries Statistics 2015
73
2. Shift to Appropriate Business
Some units were started their livelihood activities without knowing the proper where-about of
their business activity. After commencement of the business they will fall units loss. Under the Shift
to Appropriate Business scheme, strategic and managerial support were given to such units for
starting a new business which is known to them and given an additional financial assistance of 50 %
of the total project cost with a maximum amount of Rs. 50,000/-.
Table 54
District-wise details of Shift to Appropriate Business during 2014-15
Sl. No. Name of Districts No. of units benefitted
No. of women benefited
Amount (Rs in lakh)
1 Thiruvananthapuram 2 8 0.89
2 Kollam 2 8 1.50
3 Alappuzha 4 16 2.00
4 Ernakulam 3 12 1.39
5 Thrissur 4 16 1.80
6 Malappuram 3 12 1.49
7 Kozhikkode 3 12 1.42
8 Kasaragod 2 8 1.04
TOTAL 23 92 11.54
Source: SAF
3 Branding & Marketing
The assistance is provided to market the products produced by the activity groups by helping them
in participating in melas, fares, exhibition, providing transport facility, marketing strategy
preparation etc. This would help strengthen the Theeramythri and related branding.

Kerala Marine Fisheries Statistics 2015
74
Table 55
District-wise details of Branding & Marketing during 2014-15
Sl. No.
Name of Districts No. of units benefitted
No. of fisherwomen
benefited
Amount (Rs in lakh)
1 Thiruvananthapuram 122 488 1.94
2 Kollam 123 492 3.68
3 Alappuzha 115 460 2.13
4 Ernakulam 134 536 3.68
5 Thrissur 108 432 3.29
6 Malappuram 55 220 0.77
7 Kozhikkode 113 452 0.97
8 Kannur 50 200 0.97
9 Kasaragod 35 140 0.58
TOTAL 855 3240 18.00
Source: SAF
4. Capacity Building Programme
The Activity Groups were given various trainings before commencement of the business.
Trainings such as Sensitization, Opportunity Guidance, Achievement Motivation Training, Management
Training, Skill Training, Trainings are Accounting & Book keeping are given to the activity groups so as to
perform well in the markets and other areas.
Table 56
District-wise details of Capacity Building Programme during 2014-15
Sl. No.
Name of Districts No. of units benefitted
No. of fisherwomen benefited
Amount (Rs in lakh)
1 Thiruvananthapuram 121 484 1.39
2 Kollam 95 380 3.46
3 Alappuzha 101 404 2.31
4 Ernakulam 98 392 2.31
5 Thrissur 55 220 1.15
6 Malappuram 25 100 0.46
7 Kozhikkode 10 40 0.46
8 Kannur 5 20 0.23
9 Kasaragod 5 20 0.23
TOTAL 515 2060 12.00
Source: SAF

Kerala Marine Fisheries Statistics 2015
75
4. Health camps / Checkups programme
This component aims to help the coastal poor fisherwomen to check their general health
problems by conducting medical camps in coastal areas. Medical camps are conducted by qualified
doctors and nurses from reputed hospitals. Free check up and free medicines were provided. It was
organized with the help of NRHM, Amritha Institute of Medical Science, etc. A total of 7401
fisherwomen received the advantages.
Table 57
Details of Health camps / Checkups programme during 2014-15
Sl.
No. Districts Date Venue of Camp Name of Depts.
No. of
participants
benefited
1 Trivandrum 16.05.15 Pulluvila Gynecology, General Physician,
Pediatrics, Skin 427
2 Kollam 12.03.15 Sakthikulangara
Gynecology, Ortho, Ophthalmology,
Dermatology, ENT, Dental, General
Medicine
1170
3 Alappuzha
21.02.15
&
29.03.15
Purakkadu ,
Arthugal
Gynecology, General Medicine, Skin,
Life style, Ophthalmology, Dental 1790
4 Kottayam 13.01.15 Thalayazham Gynecology, Orthopedic, Pediatrics,
ENT, General Medicine 303
5 Ernakulam 08.01.15 Kumbalam
Gynecology, Ophthalmology,
Dental, ENT, General Surgery,
General Medicine
1050
6 Thrissur 28.03.15 Kodungalloor
Gynecology, General Medicine,
Orthopedic, ENT, Ophthalmology,
Dental, Dermatology
672
7 Malappuram 26.02.15 Thanoor Gynecology, Orthopedic, Pediatrics, ENT, General Medicine
756
8 Kozhikode 28.03.15 Kuttichira Gynecology, Cardiology, ENT, Orthopedic, General Medicine
632
9 Kannur 07.05.15 Azheekal Gynecology, ENT, Ophthalmology, Skin, Ortho
447
10 Kasargod 07.04.15 Kanhangad Gynecology, General Medicine, ENT, Pediatrics, General Surgery
154
TOTAL 7401
Source: SAF

Kerala Marine Fisheries Statistics 2015
76
4. Finishing School
One month class room and one month on job training has given to the fisherwomen youths for
development of their soft skills, leadership skills, social capital image development, customer service
centre, communication skills etc. Under this scheme opportunities are also directed to the eligible
students for getting placement in their respective areas.
Table 58
Details of Finishing school programme for fisherwomen youths during 2014-15
Sl. No. District Students attended
1 Alapuzha 37
2 Ernakulam 32
3 Kottayam 33
Total 102
Source: SAF
5. Working Capital Revolving Fund
Working Capital revolving fund helps the activity groups for getting financial assistance from
SAF, without interest, for developing their business activities. A group will get a maximum amount of Rs.
60,000/- as revolving fund. The group will repay the amount in 20 equal installments. 1904 fisherwomen
benefited during 2014-15.
Table 59
Number of Fisherwomen benefitted by Working Capital Revolving Fund by SAF during 2014-15
Sl.No Districts No. of fisherwomen
benefited
1 Thiruvannathapuram 232
2 Kollam 288
3 Alappuzha 160
4 Ernakulam 356
5 Thrissur 256
6 Malappuram 168
7 Kozhikkode 360
8 Kannur 76
9 Kasargod 8
TOTAL 1904
Source: SAF

Kerala Marine Fisheries Statistics 2015
77
Commercial units under Matsyafed
The commercial units under Matsyafed assist fishermen to get best quality inputs at
lower cost in their fishing villages and support them in marketing their output.
Fish Net Factories: There are two fish net factories-one at Cochin and other at Kannur focusing on
traditional sector webbings. Other fishing accessories like ropes, floats, twine etc are being traded
through these units.
OBM Division: imports Out Board Motors from Japan (mainly Suzuki motors) and sells it directly to
fishermen through Vyasa stores. It has about 13 workshops in different parts of Kerala to take care of
the repair and service of the engines. It also deals with electronic items like Eco Sounder, VHF radios,
insulated boxes, crates etc.
Ice and Freezing Plant : It focuses on the processing of Tuna and exports different fish products to
different countries. The plant has a special facility called tuna terminal to export high value tuna
products to developed markets
Fish Manure Plants: There are two Fish Manure Plants-one at Azheekkode in Thrissur District and
other at Kozhikkode. The fish manure is well accepted among the farmers and is used widely under the
Peoples Plan Programme.
Chitosan Plant: produces different grades of chitin and chitosan from the prawn shell waste
Diesel Bunks: There are 6 diesel bunks under Matsyafed to provide quality diesel to the fishermen
They are
District
Location
Kollam 1 Sakthikulangara (IOC)
2 Neendakara (HPCL)
Eranakulam 3 Cochin (Along with Ice & Freezing Plant) (IOC)
Trissur 4 Azheekkode (BPCL)
Kozhikkode 5 Puthiyappa (IOC)
Kasaragod 6 Cheruvathur (HPCL)
Kerosene bunks: For distributing white kerosene at subsidised rate to fishermen for fishing purpose,
Matsyafed has set up kerosene bunks in coastal districts in collaboration with Government owned Oil
companies They are

Kerala Marine Fisheries Statistics 2015
78
District Location of Bunk Tank Capacity
Thiruvananthapuram 1 Vizhijam Harbour 40 KL
2 Marianad, Kadinamkulam 20 KL
Kollam 3 Neenadakara 20 KL
4 Vaddy, Thankassery (under construction) 20 KL
Alappuzha 5 Valanjavazhi, Ambalapuzha 20 KL
6 Arthunkal, Cherthala 20 KL
Ernakulam 7 Thoppumpadi, Kochi 20 KL
Thrissur 8 Azheekode, Thrissur 20 KL
Malappuram 9 Ponnani 20 KL
10 Unniyal, Thanur 20 KL
Kozhikode 11 Puthiappa Hr 20 KL
Kannur 12 MoplaBay Hr 20 KL
Kasaragode 13 Kasaba 20 KL
Table 60
Performance of the Commercial Units under Matsyafed
for 2013-14 & 2014-15
2013-14 2014-15
Production
Sl. No.
Unit Production
(in MT) Sale (Rs.in
lakh) Production
(in MT) Sale (Rs.in
lakh)
1 Matsyafed Net Factory, Cochin 466.3 4275.22 491.87 4142.89
2 Matsyafed Net Factory, Kannur 195.88 938.42 237.12 972.96
3 Matsyafed OBM Division, Cochin 2176.94 2117.29
4 Matsyafed Ice & Freezing Plant, Cochin 880.86 1714.65 781.16 1422.19
5 Fish Manure Plant, Azheekode 2620.82 237.16 3445 312.66
6 Fish Manure Plant, Kozhikkode 2799.5 297.54 2608.1 232.46
7 Matsyafed Chitosan Plant, Kollam - 91.9 - 33.894
Export
Unit Quantity (in MT)
Value (Rs.in lakh)
Quantity (in MT)
Value (Rs.in lakh)
1 Matsyafed Ice & Freezing Plant, Cochin 720.52 1054.4 615.931 604.61
Source: Matsyafed

Kerala Marine Fisheries Statistics 2015
79
Table 61
Export of Fish products from Matsyafed Ice & Freezing plant, Cochin during 2013-14
Destination Item Quantity (in MT)
Value (Rs. in lakh)
Srilanka 1 Skipjack Tuna 56 53.77
,, 2 Yellow Fin Tuna 183 230.67
,, 3 Trevally 6 6.16
Libya
Yellow Fin Tuna 102.5 317.74
Oman 1 Yellow Fin Tuna 56 67.35
,, 2 Skipjack Tuna 28 36.08
Tunisia
Skipjack Tuna 114 120.74
UAE 1 Skipjack Tuna 28 21.26
,, 2 Yellow Fin tuna 11.26 40.43
Singapur
Yellow Fin Tuna 52 81.52
Algeria
Skipjack Tuna 28 31.94
Thayland
Yellow Fin Tuna 27.74 34.79
Indonesia
Yellow Fin Tuna 28.02 12
TOTAL 720.52 1054.45
Source: Matsyafed
Table 62 Export of Fish products from Matsyafed Ice & Freezing plant, Cochin during 2013-14
Destination Item Quantity (in MT)
Value (Rs. in lakh)
Srilanka 1 Yellow Fin Tuna 257 271.17
,, 2 Skipjack Tuna 105 83.15
Tunisia Skipjack Tuna 202 178.09
Oman Yellow Fin Tuna 26 36.54
Thayland Yellow Fin Tuna 25 32.09
UAE Chilled Grouper Fish 0.838 3.06
Hong kong Chilled Grouper Fish & Lady Fish 0.093 0.52
TOTAL 615.931 604.62
Source: Matsyafed

Kerala Marine Fisheries Statistics 2015
80
Table 63
FISH AUCTION (TRADITIONAL CRAFT) DETAILS FOR 2013-14 & 2014-15– MATSYAFED
Sl No
District
No. of societies
in auction
No. of groups participating
in auction
No. of members
enrolled as per APR
Quantity of fish
auctioned (in Tonne)
Value of fish auctioned
(Rs. in Lakhs)
Federation commission (Rs. in lakhs)
Amount retained
from auction as savings
Per capita income
(Au.value/No.of Membs) Rs.
Per kg rate (Auction
value / Qty in kg) Rs.
2013-14 1 Thiruvananthapuram 35 1,876 14,764 13,842 6,921 69.21 138.42 46,879 50
2 Kollam 29 916 6,402 16,157 9,065 92.06 70.16 1,41,589 56.1
3 Alappuzha 42 740 4,611 4,902 2,760 32.15 39.04 59,857 56.3
4 Kottayam 4 77 154 71 132 1.33 2.66 85,578 186.62
5 Ernakulam 21 308 4,148 10,872 2,570 24.95 39.3 61,961 23.64
6 Thrissur 13 132 2,039 5,196 2,484 26.98 24.73 1,21,811 47.8
7 Malappuram 26 147 2,577 6,075 1,821 19.51 15.27 70,659 29.97
8 Kozhikode 44 601 5,667 23,264 4,869 49.6 28 85,916 20.93
9 Kannur 13 126 940 1,659 456 4.56 4.1 48,561 27.52
10 Kasaragod 21 156 2,029 2,738 1,064 15.01 6.43 52,417 38.84
TOTAL 248 5079 43331 84776 32142 335.36 368.11 74176 37.91
2014-15 1 Thiruvananthapuram 32 1,890 14,831 12,087 5,257 52.56 105.12 35,445 43.49
2 Kollam 27 943 6,522 9,984 6,709 67.8 63.46 1,02,874 67.2
3 Alappuzha 43 710 4,486 2,976 2,040 21.22 26.84 45,466 68.54
4 Kottayam 3 104 208 96 189 1.89 3.78 91,101 197.69
5 Ernakulam 21 157 1,806 8,499 2,688 27.83 41.12 1,48,838 31.63
6 Thrissur 13 131 1,897 7,181 2,525 26.7 26.03 1,33,105 35.16
7 Malappuram 25 135 2,095 4,585 1,712 16.18 14.65 81,711 37.34
8 Kozhikode 45 565 5,383 16,502 3,896 38.17 28.61 72,383 23.61
9 Kannur 12 121 985 2,295 675 6.7 2.7 68,541 29.42
10 Kasaagod 20 156 2,018 2,472 1,074 13.73 8.55 53,221 43.45
TOTAL 241 4,912 40,231 66,677 26,765.00 272.78 320.86 66,530 40.14 Source: Matsyafed

Kerala Marine Fisheries Statistics 2015
81
Export of Marine Products
The Marine Products Export Development Authority (MPEDA) is the nodal agency for promotion of
seafood exports from India. MPEDA functions under the Ministry of Commerce, Government of India
and acts as a coordinating agency with different Central and State Government establishments engaged
in fishery production and allied activities.
Table 64
Export of Marine Products from Kerala during 2012-13, 2013-14 & 2014-15
Sl. No
Items
2012-13 2013-14 2014-15
Quantity (in MT)
Value (Rs.in Cr.)
Quantity (in MT)
Value (Rs.in Cr.)
Quantity (in MT)
Value (Rs.in Cr.)
1 Frozen Shrimp 37213 1449.15 45082 2276.61 54438.36 2855.96
2 Frozen Fish 55563 484.98 43820 548.06 21273.46 472.40
3 Frozen Cuttle fish 19655 536.85 24972 604.80 31604.21 813.95
4 Frozen Squid 25919 548.95 36606 836.43 36523.90 473.85
5 Dried Items 11924 83.39 126 5.45 2213.97 27.50
0 Live items 372 43.02 391 52.49 463.51 50.35
7 Chilled items 4048 115.66 4839 165.98 4717.74 169.32
8 Others 11705 173.85 9863 216.54 15518.44 302.74
166399 3435.85 165699 4706.36 166754 5166.07
Source: MPEDA
Table 65
Export of Marine Products from India during 2012-13, 2013-14 & 2014-15
Sl. No.
Items
2012-13 2013-14 2014-15
Quantity (in MT)
Value (Rs. in
Cr.)
Quantity (in MT)
Value (Rs. in
Cr.)
Quantity (in MT)
Value (Rs. in
Cr.)
1 Frozen Shrimp 228620 9706.36 301435 19368.30 357505 22468.10
2 Frozen Fish 343876 3296.86 87437 1731.97 69569 1275.25
3 Frozen Cuttle fish 63296 1354.28 68577 1386.98 82353 1833.21
4 Frozen Squid 75387 1378.08 324359 4294.81 309434 3778.50
5 Dried Items 72953 819.90 67901 998.01 70544 1010.16
6 Live items 4373 197.89 5080 281.85 5488 301.51
7 Chilled items 26868 537.11 19755 527.84 31404 635.93
8 Others 112842 1565.78 109212 1623.50 124947 2138.94
Total 928215 18856.26 983756 30213.30 1051244 33441.60
Source: MPEDA

Kerala Marine Fisheries Statistics 2015
82
Marine Fish Landings
For assessing marine fish landings in the state, department is conducting a sample survey
‘Marine Catch Assessment Survey’. The survey is a part of Centrally Sponsored Scheme ‘Strengthening of
data base and Information Networking in Fisheries Sector’. The methodology adopted for collection and
estimation procedure is that developed by Central Marine Fisheries Research Institute (CMFRI). The
technique adopted is Stratified Multistage Random Sampling. For each calendar month, from each
marine district one major and two minor landing centres are selected. Thus 27 landing centres are
selected. The dates for observation and recording details are selected randomly according to the
methodology. For each district, 9 clusters of 2 consecutive dates are selected. The landings are collected
by observation from 12hrs. to 18 hrs. on the first day and from 6 hrs. to 12 hrs. on the second day and
night landing by enquiry. The data to be collected are
1. The total number of fishing units landed by actual count and their time of arrival
2. The detailed species-wise break-up of landings and other ancillary information with regard to a
selected number of fishing units
3. Data on night landings
Table 66
Details of Marine Fish Landings in Kerala and India from 2001-02 to 2014-15
Year Landings in lakh MT
Kerala India
2000-01 5.67 28.11
2001-02 5.94 28.30
2002-03 6.03 29.90
2003-04 6.09 29.41
2004-05 6.02 27.79
2005-06 5.59 28.16
2006-07 5.98 30.24
2007-08 5.86 29.20
2008-09 5.83 29.78
2009-10 5.70 31.04
2010-11 5.60 32.50
2011-12 5.53 33.72
2012-13 5.31 33.21
2013-14 5.22 34.43
2014-15 5.24 34.91

Kerala Marine Fisheries Statistics 2015
83
When analyzing the fish landings in Kerala, it shows a decreasing trend in the marine sector till 2013-14
and a slight increase of 2000 MT during 2014-15 from 2013-14.
Table 67
Marine Fish Landings (in MT) in Kerala from 2010-11 to 2014-15
Sl. No
Name of fish 2010-11 2011-12 2012-13 2013-14 2014-15
1 Elasmobranches 3001 2906 2884 2873 4888
2 Cat fish 167 181 179 168 1472
3 Sardine 218848 215433 202815 198364 196944
4 Anchovilla 31949 32011 31511 30857 25768
5 Saurida & saurus 5594 5483 5361 5337 3654
6 Perches 30468 29945 29358 29444 15857
7 Sciaenid 8805 8715 8613 8445 3508
8 Ribbon Fish 15196 15175 14776 14585 8465
9 Caranx 27166 26896 26595 26030 10346
10 Mackerel 44991 44485 42696 43916 74395
11 Seer fish 2537 2508 2469 2411 6575
12 Tunnis 12062 11910 10458 10562 17280
13 Prawn 49308 48623 46256 43642 57390
14 Other Crustaceous 402 394 385 387 251
15 Others 109904 108512 106282 105287 97675
Total 560398 553177 530638 522308 524468
During 2014-15, mackerel, seer fish, prawn etc. shows an increasing trend while ribbon fish,
anchovilla, perches etc. show a decreasing trend from the previous year. In the case of sardines, oil
sardines show an increasing trend and lesser sardines a decreasing trend from previous year.

Kerala Marine Fisheries Statistics 2015
84
Table 68
Species Wise Marine Fish Landings (in MT) in Kerala from 2010-11 to 2014-15
Sl. No. Name of fish 2010-11 2011-12 2012-13 2013-14 2014-15
(1) (2) (3) (4) (5) (6) (7)
1 Elasmobranches 3001 2906 2884 2873 4888
2 Eels 168 167 166 161 630
3 Cat Fish 167 181 179 168 1472
4 Chirocentrius 244 247 246 241 976
5(a) Oil Sardines 151839 151940 143585 140383 155684
5(b) Lesser Sardines 67009 63493 59230 57981 41260
5(c) Hilsa Hisha 0 0 0 0 0
5(d) Other Hilsa 0 0 0 0 0
5(e) Anchovilla 31949 32011 31511 30857 25768
5(f) Trisocles 3073 3054 3034 2972 2206
5(g) Other Clupeids 15305 14966 14481 14276 4046
6(a) Harpodon Nehereus 0 0 0 0 0
6(b) Saurida & Saurus 5594 5483 5361 5337 3654
7 Hemirhamphus & Belone 701 697 692 683 379
8 Flying Fish 0 0 0 0 45
9 Perches 30468 29945 29358 29444 15857
10 Red Mullets 1621 1615 1610 1478 1060
11 Polynemids 68 67 66 66 381
12 Sciaenids 8805 8715 8613 8445 3508
13 Ribbon Fish 15196 15175 14776 14585 8465
14(a) Caranx 27166 26896 26595 26030 10346
14(b) Chorinemus 967 960 951 908 39
14(c) Thachynotus 0 0 0 0 0
14(d) Other Carangids 20757 20371 19757 19616 13758
14(e) Coryphaena 0 0 0 0 0
14(f) Elacate 0 0 0 0 0
15(a) Leiognathus 5263 5205 5141 5016 3956
15(b) Gazza 0 0 0 0 0
16 Lactrious 3444 3412 3373 3259 647
17 Pomfrets 1543 1533 1522 1498 3069

Kerala Marine Fisheries Statistics 2015
85
(1) (2) (3) (4) (5) (6) (7)
18 Mackerel 44991 44485 42696 43916 74395
19 Seer Fish 2537 2508 2469 2411 6575
20 Tunnis 12062 11910 10458 10562 17280
21 Sphyraena 2085 2056 2025 2027 725
22 Mugil 858 856 852 849 9
23 Bregmaceros 0 0 0 0 0
24 Soles 13915 13789 13480 13405 10941
25(a) Penaid Prawn 47620 46949 44597 42126 50947
25(b) Non Penaid Prawn 1688 1674 1659 1516 6443
25(c) Lobsters 402 394 385 387 251
25(d) Crabs 4527 4513 4465 4457 8314
25(e) Stomatopodes 9447 9411 9381 9210 0
26 Cephalopodes 14262 14047 13607 13825 34057
27 Miscellaneous 11656 11546 11433 11340 12437
Total 560398 553177 530638 522308 524468
Table 69
Species Wise Marine Fish Landings (in MT) in Kerala from 2009 to 2014
Sl. No Name of species 2009 2010 2011 2012 2013 2014
(1) (2) (3) (4) (5) (6) (7) (8)
1 Elasmobranchs 3123 3003 2909 2886 2937 4875
2 Eels 169 168 167 166 166 173
3 Cat Fish 169 167 181 179 171 1149
4 Chirocentrius 264 244 247 246 246 1006
5(a) Oil Sardines 154247 151971 152071 149649 143459 163308
5(b) Lesser Sardines 68633 67072 63555 62106 59439 46539
5(c) Hilsa Ilisha 0 0 0 0 0 0
5(d) Other Hilsa 0 0 0 0 0 0
5(e) Anchovilla 32506 31972 32034 32333 31408 25626
5(f) Trisocles 3094 3074 3055 3035 3003 2446
5(g) Other Clupeids 15546 15314 14976 14490 14532 6519
6(a) Harpodon Nehereus 0 0 0 0 0 0
6(b) Saurida & Saurus 5732 5596 5486 5362 5397 2950

Kerala Marine Fisheries Statistics 2015
86
(1) (2) (3) (4) (5) (6) (7) (8)
7 Hemirhamphus & Belone 707 701 697 693 692 452
8 Flying Fish 0 0 0 0 0 0
9 Perches 31107 30483 29960 29374 29866 15732
10 Red Mullets 1636 1626 1620 1614 1603 2181
11 Polynemids 69 68 67 66 66 381
12 Sciaenids 9522 8811 8721 8620 8622 4278
13 Ribbon Fish 15911 15210 15189 15023 14953 10278
14(a) Caranx 27429 27185 26914 26614 26539 14018
14(b) Chorinemus 978 968 961 952 936 315
14(c) Thachynotus 0 0 0 0 0 0
14(d) Other Carangids 21410 20765 20379 19852 19826 14096
14(e) Coryphaena 0 0 0 0 0 0
14(f) Elacate 0 0 0 0 0 0
15(a) Leiognathus 5336 5266 5208 5144 5097 3016
15(b) Gazza 0 0 0 0 0 0
16 Lactrious 3544 3447 3416 3380 3347 1346
17 Pomfrets 1513 1544 1534 1523 1521 2283
18 Mackerel 45335 45017 44510 44237 44479 69252
19 Seer Fish 2517 2539 2510 2477 2473 5036
20 Tunnis 12183 12072 11920 11950 10699 14670
21 Sphyraena 2118 2085 2056 2025 2029 744
22 Mugil 862 858 856 852 850 18
23 Bregmaceros 0 0 0 0 0 0
24 Soles 14192 13918 13792 13646 13461 9716
25(a) Penaid Prawn 48456 47678 47007 45099 43683 53340
25(b) Non Penaid Prawn 1714 1693 1679 1664 1652 4561
25(c) Lobsters 412 402 394 385 387 145
25(d) Crabs 4628 4528 4514 4466 4489 7181
25(e) Stomatopodes 9470 9448 9411 9382 9230 198
26 Cephalopodes 14538 14269 14054 13814 13997 25643
27 Miscellaneous 11784 11660 11550 11436 11437 10197
Total 570854 560822 553600 544740 532692 523668

Kerala Marine Fisheries Statistics 2015
87
Table 70
Species Wise & Quarter Wise Marine Fish Landings in Kerala during 2009 & 2011 (in MT)
Sl.No Name of species 2009 2010 2011
Qtr I Qtr II Qtr III Qtr IV Qtr I Qtr II Qtr III Qtr IV Qtr I Qtr II Qtr III Qtr IV
1 Elasmobranchs 762 721 394 1246 705 684 373 1241 703 682 285 1239
2 Eels 54 63 25 27 54 63 24 27 54 63 23 27
3 Cat Fish 28 55 34 52 28 55 32 52 28 55 46 52
4 Chirocentrius 67 69 13 115 60 57 12 115 60 57 15 115
5(a) Oil Sardines 40056 20825 41513 51853 39945 20891 39335 51800 39813 20833 39729 51696
5(b) Lesser Sardines 18963 2636 30241 16793 18940 2655 28653 16824 18877 2648 25240 16790
5(c) Hilsa Ilisha 0 0 0 0 0 0 0 0 0 0 0 0
5(d) Other Hilsa 0 0 0 0 0 0 0 0 0 0 0 0
5(e) Anchovilla 6874 6669 12346 6617 6889 6685 11698 6700 6866 6666 11815 6687
5(f) Trisocles 341 1866 291 596 339 1865 276 594 338 1860 264 593
5(g) Other Clupeids 2756 5558 5602 1630 2828 5555 5308 1623 2819 5539 4998 1620
6(a) Harpodon Nehereus 0 0 0 0 0 0 0 0 0 0 0 0
6(b) Saurida & Saurus 667 1908 2434 723 663 1907 2306 720 661 1902 2204 719
7 Hemirhamphus& Belone 103 137 63 404 102 137 60 402 102 137 57 401
8 Flying Fish 0 0 0 0 0 0 0 0 0
9 Perches 4647 7671 11205 7584 4657 7806 10617 7403 4642 7784 10146 7388
10 Red Mullets 1392 103 26 115 1383 103 25 115 1378 103 24 115
11 Polynemids 0 22 17 30 0 22 16 30 0 22 15 30
12 Sciaenids 2263 2507 1721 3031 1956 2205 1631 3019 1950 2199 1559 3013
13 Ribbon Fish 4721 499 2504 8187 4297 487 2373 8053 4283 486 2383 8037
14(a) Caranx 5661 7290 5031 9447 5624 7386 4767 9408 5605 7365 4555 9389
14(b) Chorinemus 309 367 128 174 307 367 121 173 306 366 116 173

Kerala Marine Fisheries Statistics 2015
88
Sl.No Name of species 2009 2010 2011
Qtr I Qtr II Qtr III Qtr IV Qtr I Qtr II Qtr III Qtr IV Qtr I Qtr II Qtr III Qtr IV
14(c) Thachynotus 0 0 0 0 0 0 0 0 0 0 0 0
14(d) Other Carangids 2427 4610 8395 5978 2411 4607 7954 5793 2403 4594 7601 5781
14(e) Coryphaena 0 0 0 0 0 0 0 0 0 0 0 0
14(f) Elacate 0 0 0 0 0 0 0 0 0 0 0 0
15(a) Leiognathus 905 2094 1104 1233 899 2093 1046 1228 896 2087 999 1226
15(b) Gazza 0 0 0 0 0 0 0 0 0 0 0 0
16 Lactrious 980 797 575 1192 974 741 545 1187 971 739 521 1185
17 Pomfrets 216 274 146 877 259 274 138 873 258 273 132 871
18 Mackerel 7674 12661 9834 15166 7744 12701 9318 15254 7718 12665 8904 15223
19 Seer Fish 697 371 572 877 692 432 542 873 690 431 518 871
20 Tunnis 2944 3620 3025 2594 3005 3618 2866 2583 2995 3608 2739 2578
21 Sphyraena 26 1147 585 360 26 1146 554 359 26 1143 529 358
22 Mugil 10 25 7 820 10 25 6 817 10 25 6 815
23 Bregmaceros 0 0 0 0 0 0 0 0 0 0 0 0
24 Soles 787 2899 2362 8144 782 2897 2238 8001 779 2889 2139 7985
25(a) Penaid Prawn 17694 15318 13455 1989 17639 15309 12749 1981 17581 15266 12183 1977
25(b) Non Penaid Prawn 1511 0 203 0 1501 0 192 0 1496 0 183 0
25(c) Lobsters 0 144 184 84 0 144 174 84 0 144 166 84
25(d) Crabs 358 2946 802 522 356 2892 760 520 355 2884 756 519
25(e) Stomatopodes 221 8613 266 370 220 8608 252 368 219 8584 241 367
26 Cephalopodes 2112 3881 4490 4055 2098 3879 4254 4038 2091 3868 4065 4030
27 Miscellaneous 1082 6356 1919 2427 1074 6351 1818 2417 1070 6331 1737 2412
Total 129308 124722 161512 155312 128467 124647 153033 154675 128043 124298 146893 154366

Kerala Marine Fisheries Statistics 2015
89
Table 71
Species Wise & Quarter Wise Marine Fish Landings in Kerala during 2012 & 2014 (in MT)
Sl.No Name of species 2012 2013 2014
Qtr I Qtr II Qtr III Qtr IV Qr I Qr II Qr III Qr IV Qr I Qr II Qr III Qr IV
1 Elasmobranchs 700 681 270 1235 698 679 236 1324 634 378 2961 902
2 Eels 54 63 22 27 54 63 22 27 49 0 65 59
3 Cat Fish 28 55 44 52 28 46 45 52 25 390 346 388
4 Chirocentrius 60 57 14 115 60 57 14 115 55 62 7 882
5(a) Oil Sardines 39682 20798 37633 51536 33618 20824 37697 51320 30542 20253 55944 56569
5(b) Lesser Sardines 18815 2644 23909 16738 15939 2638 24168 16694 14481 15902 9983 6173
5(c) Hilsa Ilisha 0 0 0 0 0 0 0 0 0 0 0 0
5(d) Other Hilsa 0 0 0 0 0 0 0 0 0 0 55 0
5(e) Anchovilla 6843 6655 12169 6666 6021 6680 12069 6638 5470 4441 7208 8507
5(f) Trisocles 337 1857 250 591 336 1824 254 589 305 151 235 1755
5(g) Other Clupeids 2809 5530 4536 1615 2800 5517 4604 1611 2544 3564 197 214
6(a) Harpodon Nehereus 0 0 0 0 0 0 0 0 0 0 0 0
6(b) Saurida & Saurus 658 1899 2088 717 657 1895 2119 726 597 625 1256 472
7 Hemirhamphus& Belone
102 137 54 400 101 137 55 399 92 3 68 289
8 Flying Fish 0 0 0 0 0 0 0 0
9 Perches 4627 7771 9611 7365 4611 7704 10245 7306 4189 2011 5572 3960
10 Red Mullets 1373 103 23 115 1369 96 23 115 1244 46 94 797
11 Polynemids 22 14 30 0 22 14 30 0 0 74 307
12 Sciaenids 1944 2195 1477 3004 1937 2190 1499 2996 1760 347 623 1548
13 Ribbon Fish 4269 485 2257 8012 4022 484 2456 7991 3654 35 2758 3831
14(a) Caranx 5587 7352 4315 9360 5568 7335 4380 9256 5059 2355 1861 4743
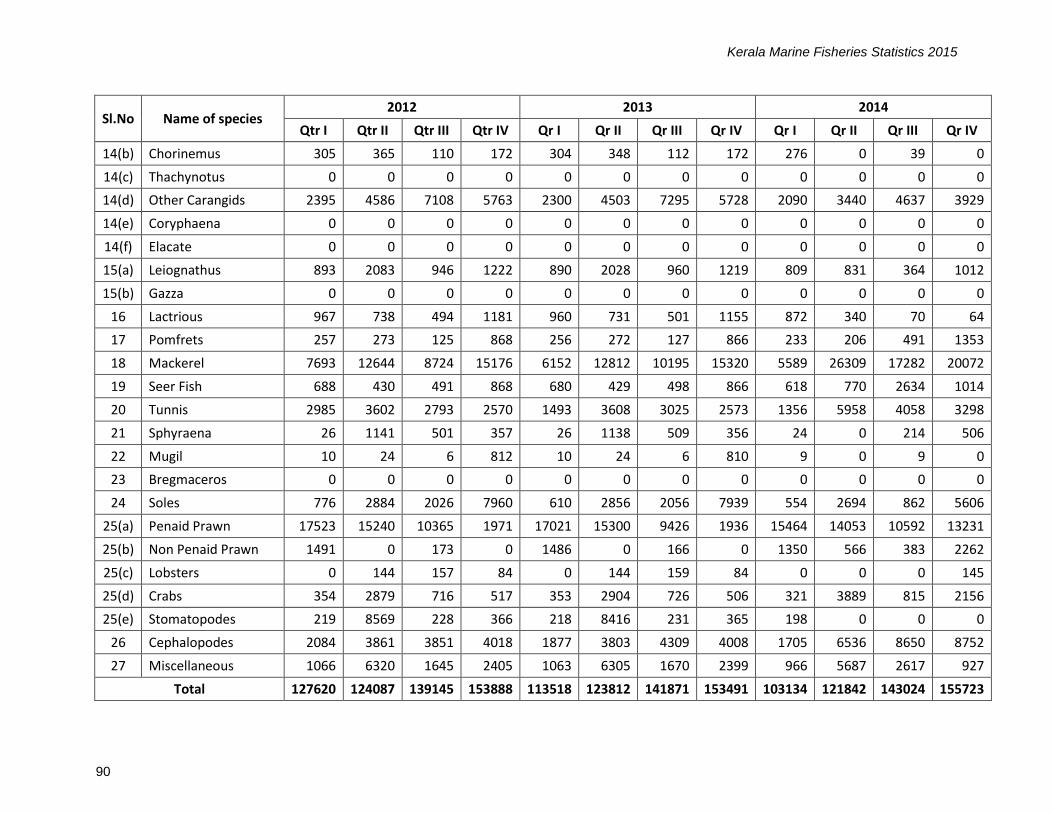
Kerala Marine Fisheries Statistics 2015
90
Sl.No Name of species 2012 2013 2014
Qtr I Qtr II Qtr III Qtr IV Qr I Qr II Qr III Qr IV Qr I Qr II Qr III Qr IV
14(b) Chorinemus 305 365 110 172 304 348 112 172 276 0 39 0
14(c) Thachynotus 0 0 0 0 0 0 0 0 0 0 0 0
14(d) Other Carangids 2395 4586 7108 5763 2300 4503 7295 5728 2090 3440 4637 3929
14(e) Coryphaena 0 0 0 0 0 0 0 0 0 0 0 0
14(f) Elacate 0 0 0 0 0 0 0 0 0 0 0 0
15(a) Leiognathus 893 2083 946 1222 890 2028 960 1219 809 831 364 1012
15(b) Gazza 0 0 0 0 0 0 0 0 0 0 0 0
16 Lactrious 967 738 494 1181 960 731 501 1155 872 340 70 64
17 Pomfrets 257 273 125 868 256 272 127 866 233 206 491 1353
18 Mackerel 7693 12644 8724 15176 6152 12812 10195 15320 5589 26309 17282 20072
19 Seer Fish 688 430 491 868 680 429 498 866 618 770 2634 1014
20 Tunnis 2985 3602 2793 2570 1493 3608 3025 2573 1356 5958 4058 3298
21 Sphyraena 26 1141 501 357 26 1138 509 356 24 0 214 506
22 Mugil 10 24 6 812 10 24 6 810 9 0 9 0
23 Bregmaceros 0 0 0 0 0 0 0 0 0 0 0 0
24 Soles 776 2884 2026 7960 610 2856 2056 7939 554 2694 862 5606
25(a) Penaid Prawn 17523 15240 10365 1971 17021 15300 9426 1936 15464 14053 10592 13231
25(b) Non Penaid Prawn 1491 0 173 0 1486 0 166 0 1350 566 383 2262
25(c) Lobsters 0 144 157 84 0 144 159 84 0 0 0 145
25(d) Crabs 354 2879 716 517 353 2904 726 506 321 3889 815 2156
25(e) Stomatopodes 219 8569 228 366 218 8416 231 365 198 0 0 0
26 Cephalopodes 2084 3861 3851 4018 1877 3803 4309 4008 1705 6536 8650 8752
27 Miscellaneous 1066 6320 1645 2405 1063 6305 1670 2399 966 5687 2617 927
Total 127620 124087 139145 153888 113518 123812 141871 153491 103134 121842 143024 155723

Kerala Marine Fisheries Statistics 2015
91
Table 72
District Wise & Species Wise Marine Fish Landings (in MT) in Kerala during 2012-13
Sl. No Name of fish TVPM KLM ALP EKM TCR MLPM KKD KNR KSD TOTAL
1 Elasmobranche 121 1408 105 195 167 32 621 105 130 2884
2 Eels 0 162 0 4 0 0 0 0 0 166
3 Cat Fish 4 16 61 36 22 2 3 35 0 179
4 Chirocentrius 45 48 29 12 7 52 48 3 2 246
5(a) Oil Sardines 988 19871 56886 10403 20983 12601 11746 4265 5842 143585
5(b) Lesser Sardines 6974 20830 26054 1262 3031 0 240 785 54 59230
5(c) Hilsa Hisha 0 0 0 0 0 0 0 0 0 0
5(d) Other Hilsa 0 0 0 0 0 0 0 0 0 0
5(e) Anchovilla 4703 7764 7662 3995 983 1178 4120 381 725 31511
5(f) Trisocles 40 239 280 387 762 99 780 357 90 3034
5(g) Other Clupeids 1897 2251 5672 1190 155 365 2067 408 476 14481
6(a) Harpodon Nehereus 0
6(b) Saurida & Saurus 56 2713 0 735 0 111 1685 61 0 5361
7 Hemirhamphus & Belone 95 333 11 79 4 0 144 10 16 692
8 Flying Fish 0 0 0 0 0 0 0 0 0 0
9 Perches 1295 5012 656 5487 3850 615 11413 988 42 29358
10 Red Mullets 482 952 0 72 78 0 0 26 0 1610
11 Polynemids 0 0 0 4 0 0 60 0 2 66
12 Sciaenids 312 1838 277 1102 1745 421 2200 480 238 8613
13 Ribbon Fish 1278 3417 0 3469 294 303 5270 620 125 14776
14(a) Caranx 4015 7667 230 3357 2988 38 5708 553 2039 26595
14(b) Chorinemus 76 80 717 18 0 0 59 0 1 951
14(c) Thachynotus 0 0 0 0 0 0 0 0 0 0

Kerala Marine Fisheries Statistics 2015
92
Sl. No Name of fish TVPM KLM ALP EKM TCR MLPM KKD KNR KSD TOTAL
14(d) Other Carangids 5194 731 2591 1442 917 288 7472 648 474 19757
14(e) Coryphaena 0 0 0 0 0 0 0 0 0 0
14(f) Elacate 0 0 0 0 0 0 0 0 0 0
15(a) Leiognathus 376 2791 93 84 329 34 673 414 347 5141
15(b) Gazza 0 0 0 0 0 0 0 0 0 0
16 Lactrious 38 2224 0 213 266 55 303 201 73 3373
17 Pomfrets 32 361 427 224 43 35 203 68 129 1522
18 Mackerel 3773 3369 9098 2207 8162 4146 6857 2754 2330 42696
19 Seer Fish 394 154 147 278 294 54 848 167 133 2469
20 Tunnis 6147 1150 370 1248 48 42 1328 102 23 10458
21 Sphyraena 438 489 0 255 198 184 439 16 6 2025
22 Mugil 91 181 81 155 59 72 103 54 56 852
23 Bregmaceros 0 0 0 0 0 0 0 0 0 0
24 Soles 184 802 2691 758 2598 462 3969 964 1052 13480
25(a) Penaid Prawn 503 8567 5753 7692 9095 3868 3823 3740 1556 44597
25(b) Non Penaid Prawn 1572 18 0 69 0 0 0 0 0 1659
25(c) Lobsters 30 84 23 77 34 39 51 24 23 385
25(d) Crabs 141 462 200 149 145 361 2343 400 264 4465
25(e) Stomatopodes 0 4014 480 1639 3248 0 0 0 0 9381
26 Cephalopodes 301 3012 142 3401 1597 532 4484 118 20 13607
27 Miscellaneous 646 4806 229 328 284 116 1315 3697 12 11433
Total 42241 107816 120965 52026 62386 26105 80375 22444 16280 530638
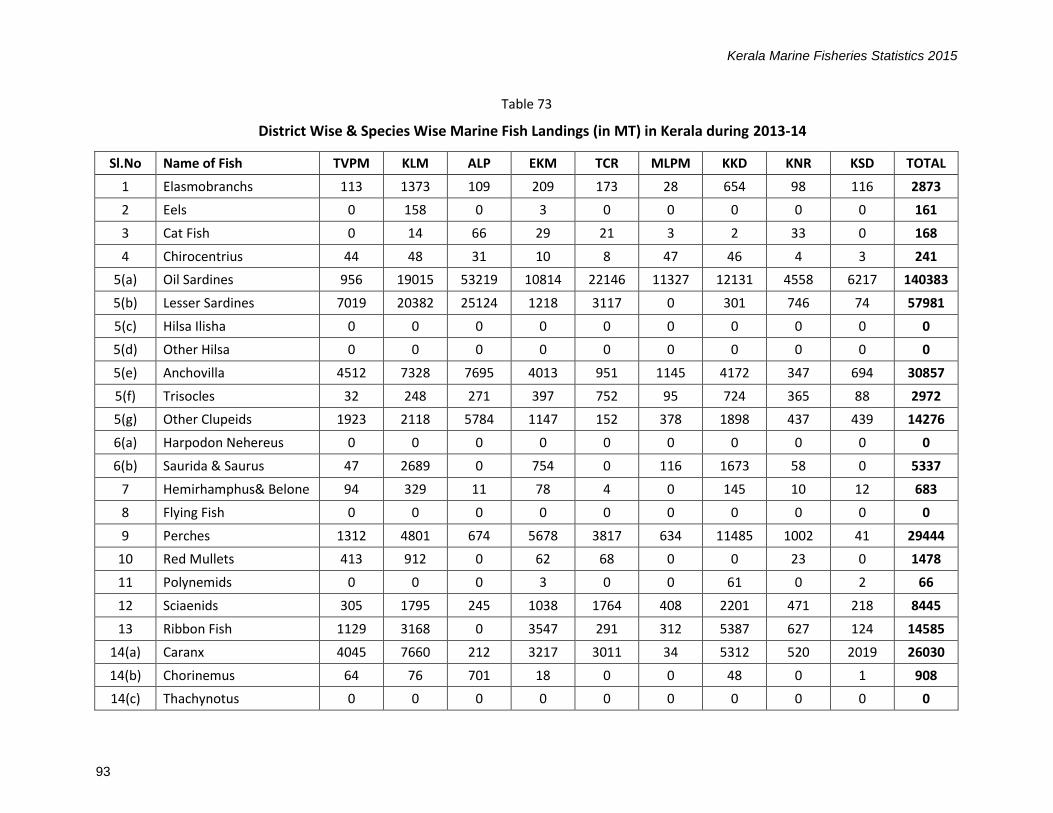
Kerala Marine Fisheries Statistics 2015
93
Table 73
District Wise & Species Wise Marine Fish Landings (in MT) in Kerala during 2013-14
Sl.No Name of Fish TVPM KLM ALP EKM TCR MLPM KKD KNR KSD TOTAL
1 Elasmobranchs 113 1373 109 209 173 28 654 98 116 2873
2 Eels 0 158 0 3 0 0 0 0 0 161
3 Cat Fish 0 14 66 29 21 3 2 33 0 168
4 Chirocentrius 44 48 31 10 8 47 46 4 3 241
5(a) Oil Sardines 956 19015 53219 10814 22146 11327 12131 4558 6217 140383
5(b) Lesser Sardines 7019 20382 25124 1218 3117 0 301 746 74 57981
5(c) Hilsa Ilisha 0 0 0 0 0 0 0 0 0 0
5(d) Other Hilsa 0 0 0 0 0 0 0 0 0 0
5(e) Anchovilla 4512 7328 7695 4013 951 1145 4172 347 694 30857
5(f) Trisocles 32 248 271 397 752 95 724 365 88 2972
5(g) Other Clupeids 1923 2118 5784 1147 152 378 1898 437 439 14276
6(a) Harpodon Nehereus 0 0 0 0 0 0 0 0 0 0
6(b) Saurida & Saurus 47 2689 0 754 0 116 1673 58 0 5337
7 Hemirhamphus& Belone 94 329 11 78 4 0 145 10 12 683
8 Flying Fish 0 0 0 0 0 0 0 0 0 0
9 Perches 1312 4801 674 5678 3817 634 11485 1002 41 29444
10 Red Mullets 413 912 0 62 68 0 0 23 0 1478
11 Polynemids 0 0 0 3 0 0 61 0 2 66
12 Sciaenids 305 1795 245 1038 1764 408 2201 471 218 8445
13 Ribbon Fish 1129 3168 0 3547 291 312 5387 627 124 14585
14(a) Caranx 4045 7660 212 3217 3011 34 5312 520 2019 26030
14(b) Chorinemus 64 76 701 18 0 0 48 0 1 908
14(c) Thachynotus 0 0 0 0 0 0 0 0 0 0

Kerala Marine Fisheries Statistics 2015
94
Sl.No Name of Fish TVPM KLM ALP EKM TCR MLPM KKD KNR KSD TOTAL
14(d) Other Carangids 5145 735 2692 1421 879 294 7409 613 428 19616
14(e) Coryphaena 0 0 0 0 0 0 0 0 0 0
14(f) Elacate 0 0 0 0 0 0 0 0 0 0
15(a) Leiognathus 335 2745 85 86 331 27 617 435 355 5016
15(b) Gazza 0 0 0 0 0 0 0 0 0 0
16 Lactrious 27 2183 0 196 253 49 291 192 68 3259
17 Pomfrets 27 347 433 224 41 35 197 63 131 1498
18 Mackerel 3917 3489 9318 2217 8492 4285 7104 2840 2254 43916
19 Seer Fish 392 134 142 281 292 52 846 153 119 2411
20 Tunnis 6284 1203 401 1214 52 48 1238 98 24 10562
21 Sphyraena 441 484 0 254 201 182 443 16 6 2027
22 Mugil 90 181 79 155 58 72 106 53 55 849
23 Bregmaceros 0 0 0 0 0 0 0 0 0 0
24 Soles 185 822 2671 730 2625 473 4012 942 945 13405
25(a) Penaid Prawn 428 8104 5216 7354 9164 4065 3247 3421 1127 42126
25(b) Non Penaid Prawn 1442 18 0 56 0 0 0 0 0 1516
25(c) Lobsters 31 86 21 79 34 38 51 24 23 387
25(d) Crabs 138 457 201 149 145 361 2343 402 261 4457
25(e) Stomatopodes 0 3997 412 1614 3187 0 0 0 0 9210
26 Cephalopodes 304 3058 121 3413 1604 531 4652 121 21 13825
27 Miscellaneous 642 4852 225 319 272 116 1254 3648 12 11340
Total 41836 105009 116159 51997 63905 25155 80050 22320 15877 522308

Kerala Marine Fisheries Statistics 2015
95
Table 74
District Wise & Species Wise Marine Fish Landings (in MT) in Kerala during 2014-15
Sl. No. Species TVPM KLM ALP EKM TCR MLPM KKD KNR KSD TOTAL
1 Elasmobranchs 32 297 0 4236 29 0 30 241 23 4888
2 Eels 0 608 0 14 0 0 0 0 8 630
3 Cat Fish 0 0 0 332 337 188 538 73 4 1472
4 Chirocentrius 46 3 15 35 3 6 863 3 2 976
5(a) Oil Sardines 5422 16945 37668 17395 17237 5853 23160 14738 17266 155684
5(b) Lesser Sardines 3181 7288 11795 4103 2439 2112 5311 2600 2431 41260
5(c) Hilsa Ilisha 0 0 0 0 0 0 0 0 0 0
5(d) Other Hilsa 0 0 0 0 0 0 0 0 0 0
5(e) Anchovilla 3490 1355 8915 1726 562 965 7864 684 207 25768
5(f) Trisocles 0 0 0 170 330 0 1411 288 7 2206
5(g) Other Clupeids 433 855 1028 561 105 259 403 257 145 4046
6(a) Harpodon Nehereus 0 0 0 0 0 0 0 0 0 0
6(b) Saurida & Saurus 45 556 168 2545 18 38 168 74 42 3654
7 Hemirhamphus& Belone 270 0 0 61 0 4 0 28 16 379
8 Flying Fish 45 0 0 0 0 0 0 0 0 45
9 Perches 72 2437 733 5885 785 445 3632 1862 6 15857
10 Red Mullets 0 0 0 140 4 0 860 24 32 1060
11 Polynemids 0 36 0 0 0 38 298 9 0 381
12 Sciaenids 200 743 0 1039 1047 110 0 301 68 3508
13 Ribbon Fish 1274 1240 388 2560 62 158 2665 102 16 8465
14(a) Caranx 464 605 2396 1659 380 988 2705 383 766 10346
14(b) Chorinemus 13 0 11 0 0 0 15 0 0 39
14(c) Thachynotus 0 0 0 0 0 0 0 0 0 0

Kerala Marine Fisheries Statistics 2015
96
Sl. No. Species TVPM KLM ALP EKM TCR MLPM KKD KNR KSD TOTAL
14(d) Other Carangids 2660 864 2664 4381 445 577 1583 437 147 13758
14(e) Coryphaena 0 0 0 0 0 0 0 0 0 0
14(f) Elacate 0 0 0 0 0 0 0 0 0 0
15(a) Leiognathus 645 201 0 1694 0 100 1164 88 64 3956
15(b) Gazza 0 0 0 0 0 0 0 0 0 0
16 Lactrious 224 245 0 168 0 0 0 10 0 647
17 Pomfrets 328 802 0 280 0 404 927 255 73 3069
18 Mackerel 3790 15207 18885 5034 5360 2279 13074 8219 2547 74395
19 Seer Fish 188 1336 247 2834 0 59 1014 570 327 6575
20 Tunnis 5089 3697 596 5022 213 609 1336 620 98 17280
21 Sphyraena 221 63 0 208 3 1 203 22 4 725
22 Mugil 0 0 0 9 0 0 0 0 0 9
23 Bregmaceros 0 0 0 0 0 0 0 0 0 0
24 Soles 216 48 680 471 330 1118 5827 1794 457 10941
25(a) Penaid Prawn 335 9192 15512 11825 190 1212 7018 4767 896 50947
25(b) Non Penaid Prawn 143 145 1483 3633 3 56 854 34 92 6443
25(c) Lobsters 0 247 0 4 0 0 0 0 0 251
25(d) Crabs 856 571 644 1262 271 858 3391 209 252 8314
25(e) Stomatopodes 0 0 0 0 0 0 0 0 0 0
26 Cephalopodes 3042 5884 1951 11108 191 1139 6177 4065 500 34057
27 Miscellaneous 584 800 2533 4629 820 428 2249 364 30 12437
Total 33308 72270 108312 95023 31164 20004 94740 43121 26526 524468
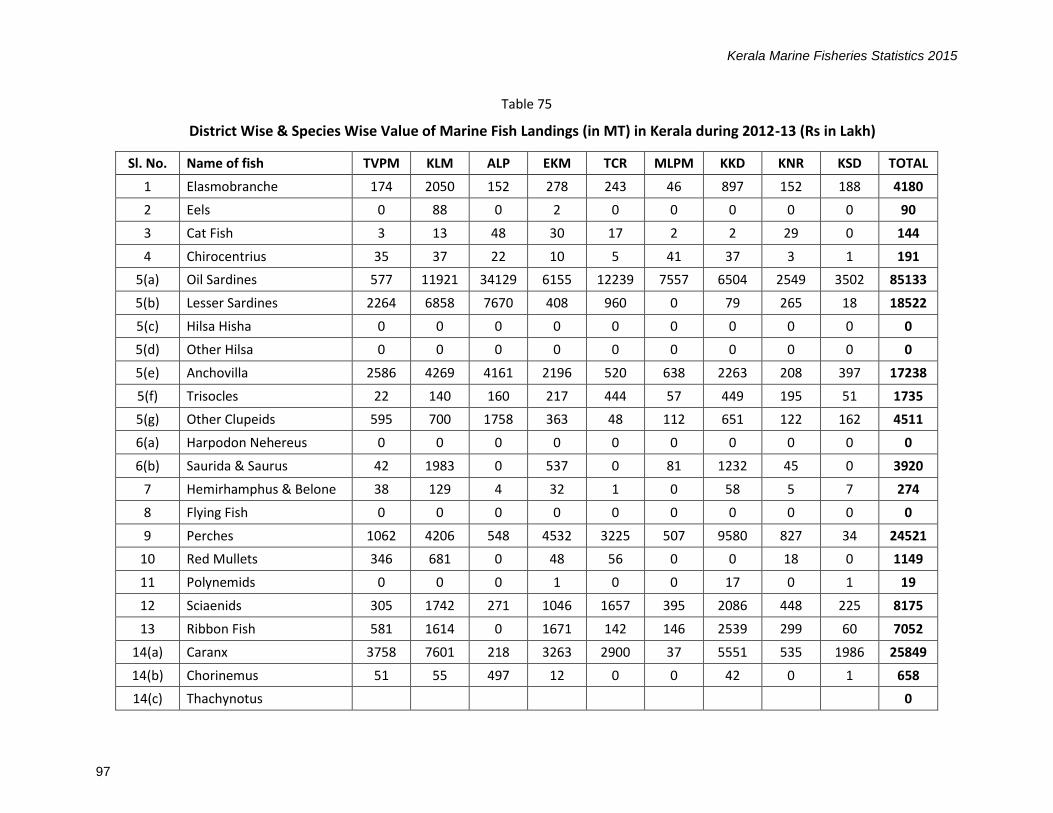
Kerala Marine Fisheries Statistics 2015
97
Table 75
District Wise & Species Wise Value of Marine Fish Landings (in MT) in Kerala during 2012-13 (Rs in Lakh)
Sl. No. Name of fish TVPM KLM ALP EKM TCR MLPM KKD KNR KSD TOTAL
1 Elasmobranche 174 2050 152 278 243 46 897 152 188 4180
2 Eels 0 88 0 2 0 0 0 0 0 90
3 Cat Fish 3 13 48 30 17 2 2 29 0 144
4 Chirocentrius 35 37 22 10 5 41 37 3 1 191
5(a) Oil Sardines 577 11921 34129 6155 12239 7557 6504 2549 3502 85133
5(b) Lesser Sardines 2264 6858 7670 408 960 0 79 265 18 18522
5(c) Hilsa Hisha 0 0 0 0 0 0 0 0 0 0
5(d) Other Hilsa 0 0 0 0 0 0 0 0 0 0
5(e) Anchovilla 2586 4269 4161 2196 520 638 2263 208 397 17238
5(f) Trisocles 22 140 160 217 444 57 449 195 51 1735
5(g) Other Clupeids 595 700 1758 363 48 112 651 122 162 4511
6(a) Harpodon Nehereus 0 0 0 0 0 0 0 0 0 0
6(b) Saurida & Saurus 42 1983 0 537 0 81 1232 45 0 3920
7 Hemirhamphus & Belone 38 129 4 32 1 0 58 5 7 274
8 Flying Fish 0 0 0 0 0 0 0 0 0 0
9 Perches 1062 4206 548 4532 3225 507 9580 827 34 24521
10 Red Mullets 346 681 0 48 56 0 0 18 0 1149
11 Polynemids 0 0 0 1 0 0 17 0 1 19
12 Sciaenids 305 1742 271 1046 1657 395 2086 448 225 8175
13 Ribbon Fish 581 1614 0 1671 142 146 2539 299 60 7052
14(a) Caranx 3758 7601 218 3263 2900 37 5551 535 1986 25849
14(b) Chorinemus 51 55 497 12 0 0 42 0 1 658
14(c) Thachynotus 0

Kerala Marine Fisheries Statistics 2015
98
Sl. No. Name of fish TVPM KLM ALP EKM TCR MLPM KKD KNR KSD TOTAL
14(d) Other Carangids 5170 698 2586 1377 888 275 7278 636 450 19358
14(e) Coryphaena 0
14(f) Elacate 0
15(a) Leiognathus 173 1283 47 39 151 16 310 190 160 2369
15(b) Gazza 0
16 Lactrious 40 2429 0 236 287 61 336 221 80 3690
17 Pomfrets 56 635 751 394 76 62 357 120 227 2678
18 Mackerel 3524 3141 8266 2005 7507 3907 6469 2502 2197 39518
19 Seer Fish 867 339 323 612 647 115 1866 369 289 5427
20 Tunnis 6081 1138 366 1235 48 42 1314 101 23 10348
21 Sphyraena 404 446 0 232 182 166 399 14 6 1849
22 Mugil 71 142 64 122 46 57 81 42 44 669
23 Bregmaceros 0 0 0 0 0 0 0 0 0 0
24 Soles 100 436 1462 452 1411 275 2156 523 571 7386
25(a) Penaid Prawn 1643 27988 18795 25130 29713 12637 12490 12219 5084 145699
25(b) Non Penaid Prawn 3299 36 0 94 0 0 0 0 0 3429
25(c) Lobsters 208 580 165 553 244 280 366 172 165 2733
25(d) Crabs 152 497 215 160 156 388 2521 430 284 4803
25(e) Stomatopodes 0 3252 388 1328 2754 0 0 0 0 7722
26 Cephalopodes 521 5709 261 6397 3020 997 8506 213 37 25661
27 Miscellaneous 365 2718 130 186 161 66 744 2091 7 6468
Total 35113 95554 83457 61353 69748 28963 77180 25543 16257 493168

Kerala Marine Fisheries Statistics 2015
99
Table 76
District Wise & Species Wise Value of Marine Fish Landings (in MT) in Kerala during 2013-14 (Rs in Lakh)
Sl.No Name of species TVPM KLM ALP EKM TCR MLPM KKD KNR KSD TOTAL
1 Elasmobranchs 292 3116 219 411 355 62 1502 228 259 6444
2 Eels 0 112 0 2 0 0 0 0 0 114
3 Cat Fish 4 16 53 32 14 2 4 30 0 155
4 Chirocentrius 24 24 15 6 5 24 25 2 0 125
5(a) Oil Sardines 848 15426 41796 7678 15779 8916 10018 3301 4211 107973
5(b) Lesser Sardines 1943 5207 6187 295 732 0 62 187 12 14625
5(c) Hilsa Ilisha 0 0 0 0 0 0 0 0 0 0
5(d) Other Hilsa 0 0 0 0 0 0 0 0 0 0
5(e) Anchovilla 3924 5918 5516 2879 718 802 3428 286 509 23980
5(f) Trisocles 33 173 187 273 548 63 628 264 58 2227
5(g) Other Clupeids 875 932 2217 468 49 129 932 164 178 5944
6(a) Harpodon Nehereus 0 0 0 0 0 0 0 0 0 0
6(b) Saurida & Saurus 40 1778 0 448 0 61 1208 32 0 3567
7 Hemirhamphus & Belone 54 156 5 35 2 0 73 3 8 336
8 Flying Fish 0 0 0 0 0 0 0 0 0 0
9 Perches 782 2716 328 2813 2009 299 6765 529 19 16260
10 Red Mullets 293 514 0 35 39 0 0 12 0 893
11 Polynemids 0 0 0 2 0 0 26 0 0 28
12 Sciaenids 255 1345 189 775 1246 278 1785 348 154 6375
13 Ribbon Fish 823 1969 0 1896 159 156 3328 352 62 8745
14(a) Caranx 5438 9271 247 3827 3425 36 7551 661 2278 32734
14(b) Chorinemus 42 39 358 8 0 0 32 0 0 479

Kerala Marine Fisheries Statistics 2015
100
Sl.No Name of species TVPM KLM ALP EKM TCR MLPM KKD KNR KSD TOTAL
14(c) Thachynotus 0 0 0 0 0 0 0 0 0 0
14(d) Other Carangids 5502 689 2314 1285 816 242 7749 607 419 19623
14(e) Coryphaena 0 0 0 0 0 0 0 0 0 0
14(f) Elacate 0 0 0 0 0 0 0 0 0 0
15(a) Leiognathus 196 1379 43 40 154 12 364 201 151 2540
15(b) Gazza 0 0 0 0 0 0 0 0 0 0
16 Lactrious 64 3558 0 321 406 80 531 315 107 5382
17 Pomfrets 73 768 856 452 82 65 471 136 251 3154
18 Mackerel 5314 4229 10824 2641 9941 4756 9465 3451 2714 53335
19 Seer Fish 1268 438 392 748 812 141 2668 472 347 7286
20 Tunnis 8395 1398 425 1442 53 45 1769 118 22 13667
21 Sphyraena 287 291 0 141 54 97 275 7 3 1155
22 Mugil 46 87 37 72 109 31 54 25 21 482
23 Bregmaceros 0 0 0 0 26 0 0 0 0 26
24 Soles 105 416 1329 372 0 217 2274 498 507 5718
25(a) Penaid Prawn 2301 34872 22097 29634 35762 14329 17038 15132 5849 177014
25(b) Non Penaid Prawn 3621 37 0 134 0 0 0 0 0 3792
25(c) Lobsters 52 133 33 108 51 54 86 32 33 582
25(d) Crabs 78 239 95 72 68 162 1316 201 124 2355
25(e) Stomatopodes 0 4016 451 1542 3138 0 0 0 0 9147
26 Cephalopodes 831 7424 326 7965 3789 1186 12118 284 42 33965
27 Miscellaneous 396 2689 118 173 152 58 802 2056 4 6448
Total 44199 111375 96657 69025 80493 32303 94347 29934 18342 576675

Kerala Marine Fisheries Statistics 2015
101
Table 77
District Wise & Species Wise Value of Marine Fish Landings (in MT) in Kerala during 2014-15 (Rs in Lakh)
Sl. No. Species TVPM KLM ALP EKM TCR MLPM KKD KNR KSD TOTAL
1 Elasmobranchs 87 650 0 7458 63 0 73 565 54 8950
2 Eels 0 487 0 10 0 0 0 0 0 497
3 Cat Fish 0 0 0 385 238 143 1141 75 0 1981
4 Chirocentrius 26 2 8 22 2 3 497 2 0 562
5(a) Oil Sardines 4251 13212 18256 8452 14251 9432 19230 10245 15362 112691
5(b) Lesser Sardines 925 2625 3021 789 607 634 1160 448 862 11070
5(c) Hilsa Ilisha 0 0 0 0 0 0 0 0 0 0
5(d) Other Hilsa 0 0 0 0 0 0 0 0 0 0
5(e) Anchovilla 2963 1325 3250 3450 450 1548 6849 296 161 20292
5(f) Trisocles 0 0 0 123 255 0 1297 258 5 1938
5(g) Other Clupeids 207 425 410 240 36 101 210 120 62 1810
6(a) Harpodon Nehereus 0 0 0 0 0 0 0 0 0 0
6(b) Saurida & Saurus 40 316 0 1688 0 23 129 51 0 2246
7 Hemirhamphus& Belone 163 0 0 29 0 3 0 10 11 216
8 Flying Fish 0 0 0 0 0 0 0 0 0 0
9 Perches 45 1881 371 3061 438 425 2268 674 3 9166
10 Red Mullets 0 0 0 83 2 0 0 16 0 101
11 Polynemids 0 30 0 0 0 31 135 5 0 201
12 Sciaenids 176 563 0 815 784 85 0 276 51 2749
13 Ribbon Fish 975 871 0 1437 36 90 1745 71 8 5233
14(a) Caranx 655 827 960 2072 458 2154 4076 604 916 12723
14(b) Chorinemus 9 0 6 0 0 0 11 0 0 25

Kerala Marine Fisheries Statistics 2015
102
Sl. No. Species TVPM KLM ALP EKM TCR MLPM KKD KNR KSD TOTAL
14(c) Thachynotus 0 0 0 0 0 0 0 0 0 0
14(d) Other Carangids 2987 1465 1025 4160 438 541 1755 184 153 12707
14(e) Coryphaena 0 0 0 0 0 0 0 0 0 0
14(f) Elacate 0 0 0 0 0 0 0 0 0 0
15(a) Leiognathus 396 114 0 827 0 107 736 50 23 2254
15(b) Gazza 0 0 0 0 0 0 0 0 0 0
16 Lactrious 558 451 0 289 0 0 0 20 0 1318
17 Pomfrets 931 1865 0 593 0 855 2349 745 142 7481
18 Mackerel 4244 13800 7256 3562 10245 5500 9521 8160 5530 67818
19 Seer Fish 639 3152 709 5109 0 181 4150 1514 1625 17079
20 Tunnis 9425 3126 656 2563 230 651 2024 926 95 19695
21 Sphyraena 151 43 0 121 1 1 134 22 2 474
22 Mugil 0 0 0 4 0 0 0 0 0 4
23 Bregmaceros 0 0 0 0 0 0 0 0 0 0
24 Soles 129 27 341 252 0 585 3705 952 259 6250
25(a) Penaid Prawn 1891 37407 54420 33525 786 4123 34204 20360 6723 193439
25(b) Non Penaid Prawn 377 245 0 2563 0 168 0 126 0 3479
25(c) Lobsters 0 432 0 6 0 0 0 0 0 437
25(d) Crabs 508 250 317 640 135 546 2019 100 127 4641
25(e) Stomatopodes 0 0 0 0 0 0 0 0 0 0
26 Cephalopodes 6532 9523 1865 21451 478 3210 16540 9075 1356 70030
27 Miscellaneous 378 423 963 2636 486 245 1525 425 11 7091
Total 39667 95537 93833 108415 30419 31385 117480 56374 33542 606652

Kerala Marine Fisheries Statistics-2015
103
Table 78
Gross Domestic Product Originating from Fishing (at factor cost)-
at Current Prices & Constant Prices (Base Year 2004-05)
Year
GSDP of Kerala (Rs. in
Cr.)
GDP of All India (Rs. in
Cr.)
% contribution of Kerala to
All India
Growth rate of
Kerala over previous
years
Growth rate of All India over previous
years
% contribution
of fishing sector of Kerala to GSDP of Kerala
% contribution
of fishing sector of
India to All India GDP
at Current Prices 2004-05 1814.22 27153 6.68 1.52 0.91
2005-06 2481.96 31699 7.83 36.81 16.74 1.81 0.93
2006-07 2644.09 35182 7.52 6.53 10.99 1.72 0.89
2007-08 2634.31 38931 6.77 -0.37 10.66 1.50 0.85
2008-09 2684.13 44073 6.09 1.89 13.21 1.32 0.83
2009-10 3234.61 50370 6.42 20.51 14.29 1.39 0.82
2010-11 3409.90 57271 5.95 5.42 13.70 1.29 0.79
2011-12 3774.43 66862 5.65 10.69 16.75 1.21 0.8
2012-13 (Provisional)
5152.39 78053 6.60 36.51 16.74 1.48 0.83
2013-14 (Quick)
6264.54 21.59 1.58
at Constant Prices
2004-05 1814.22 27153 6.68 1.52 0.91
2005-06 1704.80 28749 5.93 -6.03 5.88 1.30 0.88
2006-07 1800.24 30650 5.87 5.60 6.61 1.27 0.86
2007-08 1795.44 32427 5.54 -0.27 5.80 1.17 0.83
2008-09 1784.03 33315 5.36 -0.64 2.74 1.10 0.80
2009-10 1886.81 34395 5.49 5.76 3.24 1.06 0.76
2010-11 1794.13 36400 4.93 -4.91 5.83 0.95 0.74
2011-12 1843.08 38473 4.79 2.73 5.70 0.92 0.73
2012-13 (Provisional)
1827.55 41222 4.43 -0.84 7.15 0.86 0.75
2013-14 (Quick)
1926.85 5.43 0.85
Source: Department of Economics & Statistics

Kerala Marine Fisheries Statistics-2015
104
Table 79
Group-wise list of common marine fishes, crustaceans, mollusks, marine turtles, marine mammals and sea weeds
Sl. No.
Species group/family Genus/Species
1 ELASMOBRANCHS
a. Sharks
Alopias; Chiloscyllium; Eulamia (= Lamna); Galeocerdo; Ginglymostoma (= Scyllium); Hypoprion; Myrmillo (=Mustelus); Rhincodon; (=Rhiniodon); Scoliodon (=Carcharias, Carcharhinus); Sphyrna (=Zygaena, Eusphyra blochii); Stegostoma
b. Skates Pristis , Rhina; Rhinobatos; Rhynchobatus; Raja
c. Rays
Aetobatus; Aetomylaeus (=Myliobatis); Amphotistius (=Dasyatis, Trygon); Gymnura; Himantura; Mobula (= Dicerobatis); Narcine; Narke; Pastinachus; Rhinoptera; Urogymnus
2 EELS Anguilla; Congresox; Gymnothorax (=Muraena); Muraenesox; Thyrsoidea
3 CATFISHES Arius (=Tachysurus, Netuma); Batrachocephalus; Osteogeneiosus; Plotosus
4 CLUPEIDS
a. Wolf Herring Chirocentrus spp .
b. Oil sardine Sardinella longiceps
c. Other Sardines Other Sardinella spp S.fimbriata ; S. gibbosa; S. sirm ; S. albella
d. Hilsa Shad Hilsai ilisha
e. Other Shads Other Hilsa spp. (Tenualosa, Macrura)
f. Anchovies
Coilia
Setipinna
Stolephorus (=Anchoviella)
Thrissina
Thryssa (=Thrissocles, Engraulis)
g. Other Clupeids
Kowala coval (white sardine); Dorosoma; Chanos; Dussumieria; Elops; Escualosa (=Kowala); Herklotsichthys (=Harengula); Ilisha (=Euplatygaster); Megalops; Nematalosa (=Chaetossus); Opisthopterus; Pellona; Raconda; Spratelloide
5 BOMBAYDUCK Harpadon nehereus
6 LIZARDFISHES Saurida , Synodus; Trachinocephalus

Kerala Marine Fisheries Statistics-2015
105
7 HALF BEAKS & FULL BEAKS Ablennes; Hemirhamphus; Hyporhamphus; Tylosurus (=Strongylura, Belone); Rhynchorhamphus
8 FLYING FISHES Cypselurus; Exocoetus; Hirundichthys
9 PERCHES
a) Rock-Cods (Groupers) Cephalopholis (=Emeacentrus); Epinephelus (Serranus); Plectropomus; Promicrops; Variola
b) Snappers Aprion; Apsilus; Lutjanus (Lutianus); Pristipomoides
c) Pig-face Breams (Emperors) Lethrinus
d) Threadfin Breams Nemipterus (=Synagris)
e) Other Perches
Acanthurus; Ambassis; Apogon; Argyrops; Caesio; Calloyodon; Cheilinus; Chilodon; Chromis; Diploprion; Dipterygonotus; Drepane; Ephippus (=Chaetodon; Tripterodon); Gaterin; Gerres; Grammoplites; Gymnocranius; Holocentrus; Kurtis; Lates; Linophora; Lobotes; Mylio; (=Acanthopagrus); Pempheris; Pentaprion; Peristedion; Platycephalus; Plectorhyncus; Pomadasys (=Pristipoma); Priacanthus; Psammoperca (=Digrama); Rhabdosargus; Scatophagus; Scolopsis; Siganus; Sillago; Suggrundus; Silla gynopsis; Therapon; Thysanophrys
10 GOATFISHES Mulloidichthys; Parupeneus; Upeneus
11 THREADFINS Eleutheronema; Polynemus, Polydactylus
12 CROAKERS Dendrophysa; Johnieops; Johnius (=Sciaena); Kathala; Nibea; Otolithes; Pennahia; Protonibea diacanthus; Otolithoides biauritus
13 RIBBONFISHES (HAIRTAILS) Eupleurogrammus, Lepturacanthus; Trichiurus
14 CARANGIDS
a. Horse Mackerel Megalaspis cordyla
b. Scads Decapterus
c. Leather-Jackets (Queenfishes) Scomberoides (=Chorinemus)
d. Other Carangids
Alectis; Alepes; Atropus; Atule; Carangoides; Caranx; Coryphaena; Elagatis ;Gnathanodon; Mene; Naucrates; Platax; Rachycentron; Selar; Selaroides; Seriola; Trachinotus
15 SILVERBELLIES (PONYFISHES)
Gazza; Leiognathus; Secutor
16 BIG JAWED JUMPER (FALSE TREVALLY)
Lactarius lactarius
17 POMFRETS
a. Black Pomfret Formio niger (=Parastromateus niger)
b. Silver Pomfret Pampus argenteus (=Stromateus argenteus)

Kerala Marine Fisheries Statistics-2015
106
c. Chinese Pomfret Pampus chinensis (=Stromateus sinensis)
18 MACKERELS
a. Indian Mackerel Rastrelliger kanagurta
b. Other mackerel Other Rastrelliger spp.
19 SEERFISHES
a. Narrow-Barred Spanish Mackerel
Scomberomorus commerson (= Cybium commerson)
b. Indo-Pacific Spanish Mackerel Scomberomorus guttatus
c. Streaked Spanish Mackerel Scomberomorus lineolatus
d. Wahoo Acanthocybium solandri
20 TUNNIES
a. Little Tuna Euthynnus affinis
b. Frigate and Bullet Tuna Auxis spp.
c. Skipjack Tuna Katsuwonus pelamis
e. i. Longtail Tuna ii. Yellowfin Tuna
Thunnus tonggol T. albacares
f. Other Tunnies Other Thunnus spp.; Sarda
21 BILLFISHES Istiophorus; Makaira; Tetrapterus; Xiphias
22 BARRACUDAS Sphyraena spp.
23 MULLETS Liza ; Mugil ; Valamugil
24 UNICORN COD Bregmaceros
25 FLATFISHES
a. Halibut Psettodes erumei
b. Flounders Bothus; Chascanopsetta; Poecilopsetta; Pseudorhombus
c. Soles Cynoglossus ; Euryglossa; Heteromycteris; Solea; Synaptura; Zebrias
26 CRUSTACEANS
a. Penaeid Prawns
(i) Littoral species Aristaeomorpha; Atypopenaeus; Hymenopenaeus; Metapenaeus; Penaeus; Parapenaeopsis; Parapenaeus; Solenocera; Trachypenaeus
(ii) Deep sea species Aristeus; Metapenaeopsis; Penaeopsis
b. Non-Penaeid Prawns
(i) Littoral species Acetes; Exhippolysmata; Nematopalaemon
(i) Deep sea species Heterocarpus; Plesionika; Parapandalus
a. Lobsters
(i) Littoral species Panulirus; Thenus
(ii) Deep sea species Puerulus

Kerala Marine Fisheries Statistics-2015
107
d. Crabs Charybdis; Portunus ; Scylla
e. Stomatopods Oratosquilla
27 MOLLUSCS
a. Bivalves Crassostrea; Donax; Katelysia; Meretrix; Paphia; Perna viridis ; P. indica; Pinctada; Villorita
b. Gastropods Conus; Cypraea; Murex; Nautilus; Strombus; Trochus; Turbo; Xancus
c. Cephalopods Loligo; Octopus; Sepia; Sepiella; Sepioteuthis; Symplectoteuthis
28 MARINE TURTLES Chelonia; Lepidochelys Eretmochelys; Dermochelys; Caretta
29 MARINE MAMMALS
a. Dolphins and Porpoise Delphinus; Grampus; Sousa; Stenella; Tursiops; Neophocaena
b. Seacow Dugong
b. Whale
i. Baleen whale ii. Toothed whale
Balaenoptera; Globicephala; Megaptera; Pseudorca Kogia; Physeter; Ziphius
30 SEAWEEDS Gelidiella; Gracilaria; Sargassum
31 MISCELLANEOUS
Amphiprion; Anacanthus; Antennarius; Atherina; Batrachus; Blennius; Diodon; Echeneis; Fistularia; Odonus; Ostracion; Pomacanthus; Pomacentrus; Pterois; Sufflamen; Triacanthus; Trypauchen and other genera not listed
Source: Methodology for the estimation of Marine fish landings in India by CMFRI