Embed Size (px)
Citation preview

Edith Cowan University Edith Cowan University
Research Online Research Online
Theses: Doctorates and Masters Theses
2000
Key Decision-making Phases And Tasks For Outsourcing Key Decision-making Phases And Tasks For Outsourcing
Information Technology Information Technology
Ashraf Shoeib Edith Cowan University
Follow this and additional works at: https://ro.ecu.edu.au/theses
Part of the Management Information Systems Commons
Recommended Citation Recommended Citation Shoeib, A. (2000). Key Decision-making Phases And Tasks For Outsourcing Information Technology. https://ro.ecu.edu.au/theses/1537
This Thesis is posted at Research Online. https://ro.ecu.edu.au/theses/1537

Edith Cowan University
Copyright Warning
You may print or download ONE copy of this document for the purpose
of your own research or study.
The University does not authorize you to copy, communicate or
otherwise make available electronically to any other person any
copyright material contained on this site.
You are reminded of the following:
Copyright owners are entitled to take legal action against persons who infringe their copyright.
A reproduction of material that is protected by copyright may be a
copyright infringement. Where the reproduction of such material is
done without attribution of authorship, with false attribution of
authorship or the authorship is treated in a derogatory manner,
this may be a breach of the author’s moral rights contained in Part
IX of the Copyright Act 1968 (Cth).
Courts have the power to impose a wide range of civil and criminal
sanctions for infringement of copyright, infringement of moral
rights and other offences under the Copyright Act 1968 (Cth).
Higher penalties may apply, and higher damages may be awarded,
for offences and infringements involving the conversion of material
into digital or electronic form.

USE OF THESIS
The Use of Thesis statement is not included in this version of the thesis.

Key Decision-Making Phases and Tasks for Outsourcing Information Technology
by
Ashraf Shoeib
B.Bus. (HICMS), Grad. Dip. Bus. (Cowan)
A Thesis Submitted in Partial Fulfillment of the
Requirements for the Award of
Master of Business (Information Systems)
At the Faculty of Business, Edith Cowan University, Churchlands
Date of Submission: 5 / I ..2, / .2 GOO
11

ABSTRACT
Outsourcing has become an attractive option for today's organisation. Since
outsourcing Information Technology (IT) is a relatively new phenomenon in Australia,
little research has been conducted as to IT management strategies needed when
considering outsourcing.
To guide management in the decision whether or not to outsource IT, the
study developed and tested a decision-making model comprising the phases of
intelligence, analysis and planning, strategy selection, action, and evaluation and
monitoring. The significance of decision phases and tasks contained in the model was
established through a survey of major Australian organisations. The sample included
Australia's top 390 companies. Such organisations would be likely to have large IT
installation and therefore would have greater knowledge of IT outsourcing. The model
was also applied in four major case studies to contribute to the survey and to help in
interpreting the survey results. Respondent experiences in making IT outsourcing
decisions were discussed.
The study found that the 'action' phase of IT outsourcing is the most
important decision-making phase. It is largely determined by the track record and the
ability of the potential vendor to provide high service levels for the client. The need for
an acceptable level of service is also strongly apparent when management evaluates and
monitors the outcome of IT outsourcing.
lll

In recognition of the importance of the action phase the study presented an expanded
model. It shows an expanded representation of the activities, presented in life cycle
form, related to selecting a suitable vendor and entering into an outsourcing contract.
The study concluded that the proposed model was sufficiently comprehensive and
structured to be a useful guide for IS outsourcing decision making. It enabled decision
makers to consider complex, wide ranging and interrelated decision criteria concerning
IS outsourcing for their particular circumstances and needs.
Knowledge of the above findings should provide the following benefits:
• The identification and description of phases, tasks and subtasks provides a checklist
of what needs to be taken into account during IT outsourcing decision-making.
• The identification of key phases, tasks and subtasks will help management and
others to focus on critical areas that need to be managed well in order for IT
outsourcing to be successful.
• The identification of the action phase as the most important phase enables
management attention to be particularly focussed.
• The framework can be used on a 'as needed' basis thereby making it useful for
different outsourcing decision scenarios and situations.
The study concludes with the research limitations and suggestions for future research.
iv
DECLARATION
"I certify that this thesis does not incorporate, without acknowledgment, any
material previously submitted for a degree or diploma in my institution of higher
education and that, to the best of my knowledge and belief, it does not contain any
material previously published or written by another person except where due reference
is made in the text".
Signature f!# -5._ w.
Date . . . . :J./!� . . /�P(!.C? .. . . .
V
ACKNOWLEDGEMENTS
In the name of almighty god, the merciful, the compassionate
I thank Associate Professor Dieter Fink for his supervision of this research. His
guidance, encouragement and expertise were valued throughout this study. His support
gave me the strength to complete this thesis.
The study benefited from the Co-operation of the organisations that provided the
responses to the questionnaires and interviews. To them my heart felt thanks.
I would like to thank my instructors Dr William Hutchinson, Dr. Craig Standing
and Dr Peter Standen for their support and help.
To my parents Ebtisam and Ibrahim, my sister Abeer, and my wife Naglaa your
love and support have helped me during the difficult times.
vi

LIST OF TABLES
Table 1 Operalisation of Research Variables ............................................................................ 56 Table 2 Summary of The Data Collection Process ................................................................... 63 Table 3 Characteristics of The Participants ............................................................................... 68 Table 4 Organisations Types ..................................................................................................... 69 Table 5 Descriptive Statistics of The Intelligence Phase .......................................................... 71 Table 6 Descriptive Statistics of The Analysis and Planning Phase ......................................... 72 Table 7 Descriptive Statistics of The Strategy Phase ................................................................ 73 Table 8 Descriptive Statistics of The Responses of The Action Phase ..................................... 74 Table 9 Descriptive Statistics of The Evaluation and Monitoring Phase .................................. 75
Table 10 Significance of Decision-Making Phases and Tasks .................................................... 78 Table 11 The Association between The Decision-Making Phases ............................................. 82 Table 12 The Differences between The Decision-Making Phases .............................................. 83 Table 13 The Relationship between Tasks In The Intelligence Phase ........................................ 84 Table 14 Differences between Decision-Making Tasks In The Intelligence Phase .................... 85 Table 15 The Relationship between Tasks In The Analysis and Planning Phase ....................... 86 Table 16 Differences between The Tasks In The Analysis and Planning Phase ........................ 86 Table 17 The Relationship between Tasks In The Action Phase ................................................ 87 Table 18 Differences between The Tasks In The Action Phase .................................................. 87 Table 19 Background Data on Case Studies ............................................................................... 89 Table 20 Responses for Case Study 1 ......................................................................................... 90 Table 21 Responses for Case Study 2 ......................................................................................... 95 Table 22 Responses for Case Study 3 ....................................................................................... 100 Table 23 Responses for Case Study 4 ....................................................................................... 105 Table 24 Responses for The Intelligence Phase ........................................................................ 113 Table 25 Responses for The Analysis and Planning ................................................................. 116 Table 26 Responses for the Strategy Selection Phase .............................................................. 117 Table 27 Responses for The Action Phase ................................................................................ 119 • Table 28 Responses for The Evaluation and Monitoring Phase ............................................... 120
vu

LIST OF FIGURES
Figure 1 Simon's Decision-Making ModeL,..,..,,. .... ,.,. ...... ,. ..................... ,. ........ ,.,,. ... ,. ..... , ............... ,..,.. 37 Figure 2 The IT Outsourcing Decision-Making Research Model... ...... ,. .................... ,.,.,. ....... ,. .... ,. ........ 39 Figure 3 The Intelligence Phase ...... ,.,,. .. ,. .. ,. ... , ..... ,. ....................... ,. ..... ,,,,.,, ................................. ,. ......... 42 Figure 4 Analysis and Planning Phase,..,. ............... ,.,. .................. ,. ...................... ,..,. .............................. 44 Figure 5 The Action Phase .. ,, .. , ..... , .. , ............ , ................. , .......... , .... ,, ...... ,,,,., .. , ........... , ... ,., ...................... 46 Figure 6 The Research Design Model ................. ,., ..... ,.,,.,,. ............. ,. .............................. ,. ...................... 53 Figure 7 Dendrogram using Average Linkage ( between groups) ........................ ,. ................................. 81 Figure 8 Significant of Correlations between Decision-making Phases ....................... .,., ...... ,. .. ., ......... 122 Figure 9 Significant Differences between Decision-making Phases.. .................................. ,. ................ 123 Figure 10 The Accentuated Model ofIT Outsourcing Decision-making Phases ............... ,.,.,. ................ 125 Figure 11 The Expanded Action .................... ,., ..... ,, ........................................ , ... , ......................... , ......... 132
,;'
Vlll

TABLE OF CONTENTS
Use of Thesis ............................................................................................................................................ i
Abstract .................................................................................................................................................. iii
Declaration .............................................................................................................................................. v
Acknowledgment ................................................................................................................................... vi
List of Tables ......................................................................................................................................... vii
List of Figures ...................................................................................................................................... viii
Table of Contents .................................................................................................................................... 9
CHAPTER ONE ................................................................................................................................... 12
INTRODUCTION ................................................................................................................................ 12
Objectives OfThe Study .................................................................................................................... 13 Significance Of The Study ................................................................................................................. 13 Research Questions ............................................................................................................................ 14 Research Organisation ....................................................................................................................... 15
CHAPTER TW0 ....................................... � .......................................................................................... 17
THE IT OUTSOURCING PHENOMENON ..................................................................................... 17
Evaluation Of IT Outsourcing ............................................................................................................ 17 Definitions And Scope OfIT Outsourcing ........................................................................................ 19 Conditions For IT Outsourcing .......................................................................................................... 21 Types Of IT Outsourcing ................................................................................................................... 23 Advantages And Disadvantages ......................................................................................................... 24
The Advantages of IT Outsourcing ................................................................................................ 25 The Disadvantages of IT Outsourcing ........................................................................................... 25
Service Agreement ............................................................................................................................. 27 Summary For The Study .................................................................................................................... 30
CHAPTER THREE ............................................................................................................................. 31
IT OUTSOURCING DECISION-MAKING ..................................................................................... 31
The Nature Of IT Outsourcing Decision-Making .............................................................................. 31 Motivations For IT Outsourcing Decisions ........................................................................................ 32 The IT Outsourcing Decision-Making Processes ............................................................................... 34 The Research Model For IT Decision-Making Processes .................................................................. 37
Intelligence Phase .......................................................................................................................... 39 Analysis and Planning Phase ......................................................................................................... 43 Strategy Selection Phase ................................................................................................................ 45 Action Phase .................................................................................................................................. 45 Evaluation and Monitoring Phase .................................................................................................. 47
hnplication For The Study ................................................................................................................. 47
CHAPTERFOUR ................................................................................................................................ 49
RESEARCH DESIGN .......................................................................................................................... 49
9
Combination Of Qualitative And Quantitative Research Methods .................................................... 49 Questionnaire Design ......................................................................................................................... 54
Section 1 : Background Information About Organisations ............................................................ 54 Section 2: Factors Affecting The IT Outsourcing Decision ........................................................... 55 Section 3 : IT Outsourcing Experiences ........................................................................................ 59
Pilot Testing Of Questionnaire ........................................................................................................... 59 Conduct Of Survey ............................................................................................................................. 60 Conduct Of Case Studies ................................................................................................................... 64
CHAPTER FIVE .................................................................................................................................. 68
ANALYSIS OF THE SURVEY ........................................................................................................... 68
Characteristics Of Sample .................................................................................................................. 68 Descriptive Statistics .......................................................................................................................... 70
Intelligence Phase .......................................................................................................................... 70 Analysis and Planning Phase ......................................................................................................... 71 Strategy Phase ................................................................................................................................ 72 Action Phase .................................................................................................................................. 73 Evaluation and Monitoring Phase .................................................................................................. 74
Validity and Reliability of The Data .................................................................................................. 75 Validity .......................................................................................................................................... 76 Reliability ....................................................................................................................................... 77
Distribution Of Data ........................................................................................................................... 79 Homogeneity Of Cases and Responses .............................................................................................. 79 Analysis Of Decision-Making Phases ................................................................................................ 82 Analysis Of Decision-Making Tasks ................................................................................................. 84
Within Intelligence Phase .............................................................................................................. 84 Within Analysis and Planning Phase ............................................................................................. 85 Within Strategy Selection Phase .................................................................................................... 86 Within Action Phase ...................................................................................................................... 87 Within Evaluation and Monitoring Phase ...................................................................................... 87
CHAPTER SIX ..................................................................................................................................... 88
ANALYSIS OF CASE STUDIES ........................................................................................................ 88
Case Study 1 ...................................................................................................................................... 90 Intelligence Phases ......................................................................................................................... 91 Analysis and Planning Phase ......................................................................................................... 92 Strategy Selection Phase ................................................................................................................ 92 Action Phase .................................................................................................................................. 93 Evaluation and Monitoring Phase .................................................................................................. 94
Case Study 2 ...................................................................................................................................... 94 Intelligence Phase .......................................................................................................................... 96 Analysis and Planning Phase ......................................................................................................... 97 Strategy Selection Phase ................................................................................................................ 98 Action Phase .................................................................................................................................. 98 Evaluation and Monitoring Phase .................................................................................................. 99
Case Study 3 ...................................................................................................................................... 99 Intelligence Phase ........................................................................................................................ 101 Analysis and Planning Phase ....................................................................................................... 102 Strategy Selection Phase .............................................................................................................. 102 Action Phase ................................................................................................................................ 103 Evaluation and Monitoring Phase ................................................................................................ 104
Case Study 4 .................................................................................................................................... 104 Intelligence Phase ........................................................................................................................ 106 Analysis and Planning Phase ....................................................................................................... 107 Strategy Selection Phase .............................................................................................................. 109 Action Phase ................................................................................................................................ 109
10
---------
Evaluation and Monitoring Phase ................................................................................................ 110
CHAPTER SEVEN ............................................................................................................................ 111
DISCISSION OF FINDINGS ............................................................................................................ 111
Importance Of Phases And Tasks .................................................................................................... 111 Intelligence Phase ........................................................................................................................ 112 Analysis and Planning Phase ....................................................................................................... 115 Strategy Selection Phase .............................................................................................................. 117 Action Phase ................................................................................................................................ 118 Evaluation and Monitoring Phase ................................................................................................ 120
Relationships between And Within Phases ...................................................................................... 121 Development Of a Conceptual Model.. ............................................................................................ 124
CHAPTER EIGHT ............................................................................................................................ 127
CONCLUSIONS LIMITATIONS AND FUTURE RESEARCH .................................................. 127
Conceptual Model Of IT Decision-Making ..................................................................................... 127 Development of Model ................................................................................................................ 127 Usefulness of Model .................................................................................................................... 129
Action: The Most Critical Phase ...................................................................................................... 131 Evaluating Potential Vendors ....................................................................................................... 132 The Selection Process .................................................................................................................. 133 Negotiating Contract Conditions .................................................................................................. 133 Managing the Contract ................................................................................................................. 133 Post-Contract Management .......................................................................................................... 134
Study Limitations ............................................................................................................................. 134 Future Research ............................................................................................................................... 136
REFERENCES ................................................................................................................................... 138
APPENDIX A.:.: ................................................................................................................................. 143
The Questionnaire ............................................................................................................................ 143
APPENDIX B ...................................................................................................................................... 151
Distribution of Data ......................................................................................................................... 151
11

CHAPTER ONE
INTRODUCTION
The business world is increasingly adopting the practice of outsourcing various
organisational activities. In the Information Systems (IS) discipline, outsourcing has
become a viable, strategic alternative to acquiring and managing costly and complex
Information Technologies (IT) (Grover et al, 1995). According to the Time magazine in
1998 Eastman Kodak was the first organisation of its size to outsource its IT functions
(Outsourcing Academics.com, 2000). Since the move made by Eastman Kodak,
outsourcing has been growing. According to research done by Willcocks and Lacity
(referred to in Outsourcing Academics.com, 2000) the annual growth ofIT outsourcing
between 1992 and 1998 has been 15 to 20 percent. And Willcocks projects the global
market revenues for IT outsourcing will grow from $9 billion in 1990 to $121 billion by
th� year 2001. Another example, in the United Kingdom shows 800 million pounds was
spent on IT outsourcing in 1993 (Willcocks et al, 1995). IT outsourcing, nevertheless,
is a recent phenomenon and relatively little research has been carried out into the
management strategies required to ensure outsourcing success.
The outsourcing phenomenon is observable in West Australian Government
agencies and companies. For example, an early outsourcing situation was that of the
Health Department which has outsourced its mainframe operations in January 1993.
Outsourcing has also taken place in other West Australian organisations such as the
Challenge Bank and the Water Authority of Western Australia (P. Dobson, personal
12

communication, September 23, 1997). The general belief appears to be that outsourcing
reduces costs and improves services.
The decision to outsource IT functions is a strategic decision usually made by IT
executives and top management. Its aim is to identify the best and appropriate
technology while being cost effective, providing better services and achieving a
competitive advantage.
Objectives Of The Study
The objective of this research is to develop and evaluate a decision-making
model to guide organisations contemplating IT outsourcing. The study aims to establish
the key decision phases and tasks that organisations should focus on when considering
the desirability of outsourcing as an option to insourcing. The research outlines the
nature of t�e model, discusses the findings of an Australia wide survey that established
the significance of IT outsourcing, decision phases and tasks and how it was applied in
major case studies. Conclusions are drawn from the work carried out and presented at
the end of the research.
Significance Of The Study
Over the last decade, the increasing number of outsourcing deals has stimulated
research on the outsourcing phenomenon. Questions about the outsourcing phenomenon
13
have increasingly been followed by questions about making successful outsourcing
decisions and the processes that lead to these decisions. This in turn, has helped
executives and management in making important decisions and avoiding potential
failure involved in such strategic decisions.
The significance of this study lies in identifying the steps that should be
followed to make the strategic outsourcing decisions and to show that following these
steps may increase success of the likelyhood of the outsourcing decision-making
process.
The research will be useful to a wide spectrum of people involved in developing
IT strategies and business plans. This should includes IT/IS managers, Chief Executive
Officers, business planners and those who wish to expand their outsourcing knowledge.
In addition, academics and students will find useful information in this research for
many of their student-related study programs. Graduate students preparing for
outsourcing �ositions in large organisations, as well as researchers in such fields as
management of information systems, business, and computer science will increase their
knowledge of the outsourcing phenomenon.
Research Questions
IT outsourcing decision-making is a complex issue. Many questions regarding
the outsourcing decision arise, some of which are as follows. What should be done
when considering outsourcing? What is required to make the outsourcing decision?
14
What processes should be followed to reach the outsourcing decision? The research will
attempt to answer these questions with a view to developing a framework for successful
outsourcing decision-making processes. The research is exploratory in nature and
provides early outsourcing lessons for the Australian perspective.
Research Organisation
Chapter 2 provides the literature review, which is divided into three parts. The
first part discusses the evolution of IT outsourcing. The second part contains definitions
and scope of IT outsourcing. The third part presents themes within IT outsourcing. It
includes the advantages and the disadvantage of IT outsourcing, the relationship
between the organisation and the provider, and industries and applications/services
suited for IT outsourcing.
Chapter 3 introduces the reader to the IT outsourcing decision-making, which
represents the backbone of this study. It also represents the decision-making framework
on which this study is based.
Chapter 4 describes the research design including the research methodology,
sample and subjects of the study, data collection, questionnaire design, questionnaire
considerations, pilot testing of the questionnaire, and the interviews.
15
Chapter 5 presents the analysis of the survey, which includes the demographic
data of respondents, the characteristics of the surveyed organisations, descriptive
statistics and the validity and reliability of the data collected.
Chapter 6 presents analysis of the case studies. Four case studies were analysed.
Chapter 7 contains findings and discussions. The chapter has three sections:
importance of phases and tasks, relationship between and within phases and
development of a conceptual model.
The last chapter, chapter 8, presents the conclusions of the study, which include
the limitations of the study and suggestions for future research.
16
CHAPTER TWO
THE IT OUTSOURCING PHENOMENON
The literature review section comprises three parts. The first part demonstrates
the evolution of IT outsourcing. The second part includes definitions and scope of IT
outsourcing. The third part presents themes within IT outsourcing.
Evaluation Of IT Outsourcing
Is outsourcing new to the IT world? The answer is no. Although IT outsourcing
is the strategy, which has come to the fore in the nineties, its concept has been around
for many years. According to Grover et al (1994) the outsourcing phenomenon started
in late the 1950swhen computing processing services were bought by small companies
who could'not afford the cost of mainframe computers. In the 1960s when computers
became more co�ercially available and the cost of data processing was still high,
companies were buying time-share computing services from outside service bureaus
(Jathanna, 1991).
While the major concerns were the cost of mainframe computers in 1950s and
the cost of data processing in the 1960s, the 1970s had another problem. According to
Ketler and Walstrom (1993) the rapid increase in demand for IT applications and the
17
lack of IT personnel were the two main reasons for managers to consider contract
programming as a form of outsourcing.
Outsourcing in the 1980s was mainly for large organisations typically United
States banks and financial institutions (Tracey, 1994 cited in Halvey & Melby, 1996). It
was not uncommon to see IT outsourcing contracts worth $ US 500 Million in value and
more than 5 years in length. According to Halvey and Melby (1996) in the 1990s the IT
outsourcing phenomenon has spread globally and across a significantly wide range of
industry. Outsourcing in the 1990s includes a wider range of services, including systems
integration, application management and systems operation (Grover et al ,1994).
IT outsourcing has evolved over time in response to the continuously changing
IT environment. Organisational needs and circumstances have also played a big part in
the evolution of outsourcing and in the variety of shapes the phenomenon has taken
throughout the years. According to Jathanna (1991) outsourcing is an attractive option
to small organisations when firms can not afford the high cost required to operate,
maintain and implement computer services and it is a practical option in large
organisations in order to keep up with rapid technological change.
Today's IT outsourcing is seen as a business approach that is adopted to achieve
cost reductions and to keep up with the changing IT environment (Minoli, 1995). There
is however a number of features which distinguish today's outsourcing from that of
previous decade; this includes adopting outsourcing as part of a competitive strategy to
18
achieve competitive advantage by increasing the access to new technology, to meet the
business objectives and goals and focussing on core business functions. IT outsourcing
provides immediate access to otherwise unavailable state-of-the-art technology and
reduces the risk of technological obsolescence risk (Loh & Venkatraman, 1991 cited in
Grover et al, 1995)
Definitions And Scope Of IT Outsourcing
In recent years, IT outsourcing has become a popular strategy for both the
government and private sector entities. The survey of major contracts such as
McDonnell Douglas (James, 1993) and General Dynamics (Altinkemer et al, 1994) has
attracted much attention. The phenomenon is becoming more widespread, and more
business executives are looking to outsourcing as an opportunity for their organisations
to achieve competitive advantages or to reduce costs.
To help organisations in making the outsourcing decision, it is important to
understand the outsourcing phenomenon and what is meant by IT outsourcing.
Understanding IT outsourcing and learning about the phenomenon is one of the steps in
the outsourcing decision�making process. In an attempt to explain the outsourcing
phenomenon, some outsourcing definitions will be examined.
The simplest definition is given by Patane and Jurison (1994) who define
outsourcing as "the practice of subcontracting some or all of an organisation's
information systems services to another firm" (p.6). The definition is of a general nature
19
and does not specify which IT services can be outsourced. In an attempt to be more
specific Patane and Jurison (1994) added that the outsourced operations can include the
whole range of IT services such as data centre management, applications development,
network operations, system integration and user training.
Grover et al (1994) have a similar definition oflT outsourcing, describing
outsourcing as "the practice of turning over part or all of an organisations IT functions ',
to external service provider(s)" (p.34). The researchers indicated that the definition
includes services such as applications development and maintenance, systems operation,
networks/telecommunications management, system planning, end user computing and
applications software, but excludes business consulting services, after-sale vendor
services and the lease of telephone lines.
The two definitions were supported by Martinsons (1993), quoted by Fink
(1994) who defines IT outsourcing as "the act of subcontracting all or parts of the IS
function to an external vendor as an alternative to relying solely on inhouse resources
and capabilities" (p.3). This definition requires that outsourcing can be used as an
alternative to using internal resources for carrying out IT activities.
The above definitions give a broad picture of IT outsourcing. A better
understanding can be obtained by examining elements of these definitions. The word
'subcontracting' which is defined by The Penguin English Dictionary (1985) as "to
engage a third party to perform under a subcontract all or part of work included in an
original contract". The words 'turning over' indicate that the term outsourcing means
the acquisition of services. According to the Penguin English Dictionary (1985) the
20

word acquisition means acquiring and gaining. However, none .of these phrases indicate
the degree of control by the third party over the outsourced IT functions.
Jathanna (1991) provides an answer to this question. He descril?es outsourcing
as contracting out the non-strategic operations of an organisation to a third party. The
definition provides a better understanding and direction of the IT functions that can be
outsourced. It indicates that if IT operations are strategic and core to the business,
outsourcing should be avoided or eliminated.
A suitable definition can be derived from the above statements as follows:
outsourcing is the process of contracting some or all of the non-strategic information
systems operations � one organisation to another to primarily gain better services
and/or reduce costs, to gain competitive advantage and to focus on core business. This
definition will be used throughout the study.
Conditions For IT Outsourcing
According to Gupta and Gupta 1992 ( p.49) outsourcing is a feasible and attractive
alternative for IT departments confronted with one or more of the following situations:
• A dire and inup.ediate need to reduce or stabilise costs. According to Horwitt (1993)
this is regarded as one of the primary factors driving the move to outsourcing.
• The organisation is suffering from a critical shortage of IT talent which may lead to
delays in project completion, inability to respond to rapidly changing market needs
' "
21
and poor quality of service to users. An outsourcing vendor can provide employees
who have skills and experience in the job.
• A lack of strategic advantage in the given IT function, and where the contractor is
better suited to perform the task. According to James (1993) under IT outsourcing,
managers will be able to focus on business processes, customers, costs and quality,
while leaving the IT service delivery function to the vendor.
• Out-of-date technology and systems. This is often evident when talented and skilled
IT staff are spending most of their time maintaining old products rather than
developing new ones.
• More focus on strategic business functions by outsourcing the non-strategic ones. In
this case managers will be able to focus on and be responsible for strategic
activities. This provides opportunities to achieve maximum value of every business
activity rather than increasing the efficiency of the functional operation of the
business.
There are five questions that should be asked before deciding to outsource
(Manion,1993).
1. What are the proposed savings and how will they be measured? Manion explains
that most outsourcing contracts target a minimum of 15 percent savings, sometimes
between 20 to 25 percent. An organisation should have a measure to be able to
22
determine if outsourcing is achieving the expected savings.
2. Do the outsourcers have economies of scale not available to the organisation? If the
answer is 'no', why outsource?
3. Is the guaranteed price a good deal? With regard to the price, the current cost of IT
operations should be established and used as a measure to find out if the price is
reasonable.
4. Can the outsourcers buy hardware cheaper?
5. Should an organisation outsource its IT operation at any cost? The answer to this
question should be 'yes' if outsourcing is providing state of the art technology,
reducing costs and achieving competitive advantage.
Types Of IT Outsourcing
IT outsourcing can be divided into different types: complete and partial and a
mix of these. With complete outsourcing, an organisation outsources its entire or most
of its information systems operations to another organisation. Partial outsourcing is
when an organisation outsources only some of its information systems operations.
Grover et al, (1994) explains complete outsourcing as the transference of the
entire computer and communication centre, together with the related IT personnel from
one organisation to another. This means the entire IT infrastructure is handed out to a
service provider. Outsourcing is regarded as a suitable approach to help the organisation
to advance and compete in a business environment.
23
Partial outsourcing is contracting out part of the IT operations. This means the
transference of one or more functions of the information systems to a third party to
perform according to performance criteria. In this type of outsourcing the firm does not
outsource the entire IT functions. According to Ketler and Walstrom (1992) it is the
transference of at least one portion of an organisation's IT responsibility to a third party.
Contract programming is an example of partial outsourcing.
The decision as whether to fµlly outsource or partially outsource depends on the
strategic importance of IT. In other words if IT is a core business activity and
considered to be the major source in producing products or delivering services, by fully
outsourcing the organisation may lose .. control over its strategic IT operations. By
choosing to outsource the non-strategic functions and keep the strategic once in-house,
the risk of losing control over IT may be avoided. The mix of insourcirig and
outsourcing may become an attractive solution for an organisation experiencing the
outsourcing phenomenon for the first time.
Advantages And Disadvantages
The literature on IT outsourcing provides much information about the
advantages of IT outsourcing but less on the disadvantages. IT outsourcing is either
enthusiastically embraced or completely rejected. In other words, outsourcing
supporters stress its benefits while its opponents stress the drawbacks (Ketler &
Walstrom, 1993). The following are some of the major advantages and the
disadvantages of IT outsourcing.
24

The Advantages of IT Outsourcing
• Reduced costs. By going outside, companies can eliminate many hidden costs for
finding, interviewing, hiring, training and supervising IT personnel (Gupta & Gupta,
1992) and an outsourcing vendor can provide employees who have more experience
of the job than the organisation could hire.
• Focus on core business. Outsourcing allows IT managers to focus on the core - -······-
business instead of being distracted by the impediments associated with an
increasingly complex IT infrastructure. Outsourcing helps to improve the focus on
strategic use of IT by allowing the managers to focus available IT talent on IT
activities that promote competitiveness rather than routine activities (Grover, et al,
1994).
• IT outsourcing is a way to keep up with advancing technology. Outsourcing allows
the service receiver to gain immediate access to otherwise unavailable state of the
art technology provided that the vendor has an up-to-date IT platform. It provides ,,,
less risk of obsolescence due to accelerated changes in the nature of the IT
infrastructure. (Grover et al, 1994).
The Disadvantages of IT Outsourcing
• Loss of in house IT expertise. However, "executives must never forget that 'people'
are the ones who make IT work. Management must address the unique concerns of
25
all individuals affected by outsourcing to realise the potential rewards of this
approach." (Laribee & Michaels-Barr, 1994, p. 12). Once the possibility of
outsourcing is being discussed employees start to leave the organisation which make
the transition of outsourcing difficult and accelerates the loss of in-house expertise
(Ketler & Walstrom, 1992).
• Lack of control over a competitive resource. This can result in losing the control of
technology and timing of upgrades (Ambrosio, 1991) and loss of control over
quality of lT services and confidentiality (Ketler & Walstrom, 1993).
• Conflicting interest factors Grover et al (1994) suggests service providers are in the
business of maximising their profit at any cost and that might not be in the best
interests of the service receiver. Concern arises over data security knowing that the
service provider may offer similar services to competitors. Furthermore,
management should also be aware of higher than expected outsourcing bills due to
low vendor estimates or contract misunderstanding (Ketler & Walstrom. 1993).
• Disaster recovery facilities. These may be lost with outsourcing and companies
undertaking outsourcing do not tend to pay a lot of attention to disaster recovery
provisions once vendors have taken over (Duffy, 1991).
While IT outsourcing has potential advantages and disadvantages, it may not be the
answer for all applications or services. For example McDonnell Douglas Corp (MDC)
outsourced all of its IT function except applications development, the reason being that
26

the organisation was unlikely to gain enough benefit from outsourcing that function
(James, 1993). On the other hand Armco Steel outsourced its entire IT function to ISSC
(an IBM subsidiary), as did Continental Airlines and Del Monte Foods EDS and
California Republic Bank to Unisys (Altinkemer et al, 1994).
Service Agreement
Different IT outsourcing has different natures. For example complete
outsourcing involves the transference of the entire computer and communication centre,
together with the related IT personnel to the service provider, whereas partial
outsourcing means the transference of one or more functions of the information systems
to a third party.
Given the different types of outsourcing, a legal document is needed to define
the relationship between the client and the vendor. This legal document is called the
outsourcing contract. It contains details of the instructions and the rules that should be
followed by the parties involved. The contract should be carefully drafted and
understood by the contracting parties to avoid ambiguity. Lacity and Hirschheim (1993)
recommended that customer negotiate an "air-tight contract" stating that the contract is
the only instrument that establishes a balance of power in the outsourcing relationship
(Douglas, 1993).
Two main views exist on the nature of the relationship between the organisation
and the service provider. One perceives the arrangement as a partnership or marriage
27
because the organisations enter into a long-term association. The alternative view is that
the relationship is a purely business one as profit motives of the vendor and client are
not shared (Douglas, 1993).
The changing nature of technology and business economic conditions makes
changes to the outsourcing contract over time inevitable. For example, Eastman Kodak
have put in place twelve amendments to deal with the inclusion of additional business
unit computer leveraged opportunities (McFarlan & Nolan, 1995). Outsourcing contracts
should be flexible in nature to give the opportunity to the vendor to use the state-of-the
art technology to meet the demand of the competitive business environment and the
chance for the client to change outsourcing services according to the organisation's
changing business requirements.
According to the Department of State Services State IT (1993) the contract
should include detailed specification, duration, price, performance standards and
warranties. The contract should include the details of the job to be done or the services
to be provided so that each party has a complete knowledge of what has to be delivered
and received. The vendor should be responsible for delivering what is stated
and specified in the contract, stating clearly in the outsourcing contract about exactly
who is responsible for what, is a 'smart way' of managing the vendor (Evans, 1994).
Confusion can arise in respect of what was delivered by the internal IT
department. A comprehensive list of the services and the service levels provided by the
IT department should be included in the contract (Halvey & Melby 1996). The client
should make sure that the organisation is going to receive at least the service that was
28

provided by the internal information system with the same performance standard if it is
not a better performance standard. If IT outsourcing was adopted to achieve competitive
advantage, it may be worthwhile to add services that were not provided by the internal
IT department.
To reach a desired agreement with the vendor, IT executives need to be good
contract managers. Skills needed to do the job effectively include: negotiation,
communication, business, people, planning, financial, organisational, technical and
administration (Corbett, 1994). Formal bargaining to win some benefits for the
organisation is required. In all cases outsourcing is being adopted to gain not to lose.
Communication skills are needed to be able to negotiate efficiently, the ability to
communicate, translate, and express facts and feelings through different forms of means
is an important skill for a good negotiator.
IT outsourcing will incur hidden costs as a result of poor contract negotiation or
weak contracting practice. Issues such as failure to define present and future IT
requirements, not allowing the vendor a reasonable profit and ambiguities in the
contract are seen to be the causes of such hidden costs (Willcocks et al 1995). IT
requirements should be fully and clearly defined yet the contract should be flexible
enough to accommodate future changes in technology and business requirements.
Vendors should be allowed to make reasonable profits otherwise they may try to gain
more profits from any future changes in technology or provide lower service levels.
The outsourcing vendor should meet the contract conditions and try to create
new ways to provide better services with lower costs to the client. Both parties should
try to build a winning relationship where the client, will experience cost-savings and
29

better services and the vendor will have the contract renewed. In the ideal world, IT
outsourcing should be a win-win situation.
Summary For The Study
To make the strategic decision for IT outsourcing a great deal of information is
required. This chapter provides the essential background for IT outsourcing. Definitions
and scope of IT outsourcing were discussed to provide an understanding of the
outsourcing phenomenon. The types of outsourcing were identified to indicate various
options. Advantages and disadvantages were examined as well as foundations for
outsourcing agreements.
30
CHAPTER THREE
IT OUTSOURCING DECISION-MAKING
As discussed in the previous chapter, successful outsourcing may enable
businesses to reduce costs, focus on core business functions, provide better services and
consequently achieve competitive advantage.
To arrive at a successful outsourcing decision requires analysis of the
organisation's needs and circumstances. Fundamental issues need to be addressed,
including why the organisation is outsourcing? Has the IT department the capability of
achieving the desired outcome of outsourcing without having to outsource and which
functions should be outsourced? These and other questions will have to be addressed in
the outsourcing decision-making.
The Nature Of IT Outsourcing Decision-Making
Decision-making for IT outsourcing is behavioural in nature because it is a
highly complex and cognitive demanding task. The decision-maker has to consider and
trade-off a variety of information and criteria. Furthermore, the decisions are difficult to
evaluate because adequate outcome feedback only takes place once outsourcing has
been implemented and been operational for a period of time.
3 1
: 1 1
Behavioural decision-making "focuses on quasi-resolution of conflict, avoidance
of uncertainty, problemistic search, organisational learning, and incremental decision-
making." (Davis & Olson, 1985, p. 191 ). It is descriptive by nature, explaining actual
human decision-making behaviour. By contrast a prescriptive approach assumes
complete information about alternatives, rationality of the decision maker and optimum
results.
Motivations For IT Outsourcing Decisions
Research has shown that the IT outsourcing decisions are made for a variety of
reasons which may not necessarily be rational in nature. Lacity and Hirschheim (1993)
conducted in depth interviews with participants in thirteen companies who had gone
through formal IT outsourcing and found that management made outsourcing decisions
for reasons other than the rational nature of cost efficiency. Participants identified a
variety of motives for making outsourcing decisions. From a rational perspective
management responded to the efficiency imperative. From a political perspective,
members made the decision to outsource to promote their self-interests at the expense of
others. From a garbage-can perspective members were making the outsourcing decision
for the first time and were reacting to a new trend in IT. From a bureaucratic
perspective, members wished to avoid decision-making.
32

For management to make the correct outsourcing decision many factors must be
examined including the effects on the organisation, the IT department and the business
goals and objectives that might be affected if something goes wrong with outsourcing.
Gupta and Gupta (1992) found that "IT executives are now compelled to seriously
consider the option of outsourcing their organisations' information systems instead of
blindly assigning projects to their IT departments" (p.44). IT outsourcing therefore not
only affects the IT department but also impacts on the daily operations of all
information systems users in the organisation.
The steps and methods of making a decision are extremely important to the
outcome of the situation. It is not unusual to avoid making such difficult decisions
especially if it is hard to determine feasibility or if there are no guides or instructions to
help the decision-making process. The stage has even been recalled where managers in
large companies are avoiding the responsibility of making the outsourcing decision by
outsourcing the thinking of the decision or the decision-making process to consultants
to avoid getting into trouble should outsourcing decisions go wrong (Seglin, 1996).
Poor judgement or decision-making can lead to disaster. An example of not
achieving the desired outcome is illustrated by the Commonwealth Scientific and
Industrial Research Organisation (CSIRO) experience. According to Ranald (1992)
CSIRO made the decision to outsource management computing services and research
computing services to Fujitsu, a decision which seemed to be motivated by cost
effectiveness. CSIRO's management was not satisfied because of the problems that
occurred with the quality of the work, delivery times and with capacity availability
33
when it was needed. The lessons learned were care in selecting the service provider,
vendor stability in the market, and the risk with outsourcing due to the experience that
"all eggs are in the same basket".
The IT Outsourcing Decision-Making Processes
The experience of CSIRO shows the importance of the outsourcing decision-making
process. According to The Penguin Dictionary (1985) a process is "a series of actions
or operations design to achieve an end". According to the definition a series of actions
or steps should be followed to achieve the desired outcome of the outsourcing decision.
There is therefore a need to develop a framework or a methodology to be followed to
achieve a successful outsourcing decision-making.
A number of writers, attempted to provide direction to IT managers on how to
make successful outsourcing decisions by indicating what to monitor and what choices
to make in the outsourcing decision-making process. One of the early attempts to
identify decision-making processes to be followed to achieve successful outsourcing
decisions was by Due (1992). Managers should initiate the following steps:
• Establish a strategy to balance the activities of IT management, contracting, and
consulting. The probability of turning some of the IT employees into contractors or
consultants should be investigated.
34
r
• Establish a strategy to deal with 'burned-out' or redundant staff. Retraining or
career counselling may be one solution.
• Get to know potential outsourcing vendors by giving them small but difficult jobs to
prove themselves and asking them what activities they have outsourced in their own
organisation.
• Keep IT staff informed by letting them participate in developing the IT outsourcing
strategy.
Leinfuss (1991) added some steps to the decision-making process to help managers
cope with the impact of the outsourcing decision on their careers. They complement the
above outsourcing decision-making processes rather than being processes of their own.
Leinfuss (1991) recommended that IT executives should:
• Take on the responsibility of monitoring the outsource vendor's work to make sure
that the service provider delivers on promises made about response times, timely
completion of work and rapid response to systems problems.
• Learn new skills to become a Gontract manager instead of being a manager of
people. They need to develop the ability of monitoring the provider.
• Must be freed from the responsibility of hardware procurement and given more
general management responsibilities.
35

These steps concentrate on the relationship between the organisation and the service
provider, which is important for achieving successful outsourcing decisions. Under
another approach to IT outsourcing the Department of State Services State IT (1993) in
W estem Australia suggests managers should evaluate current IT operations to obtain a
clear picture of the effectiveness of in-house IT. It was recommended that IT managers
should:
• Review the objectives and the goals of lT
• Quantify all IT costs
• Assess the effectiveness and efficiency of IT operations
• Identify any problems being experienced
• Consider a range of alternatives for improving service levels
• Determine the correct mix of insourcing and outsourcing arrangements
• Define the specification for the service required in each area
• Plan the acquisition process
Judenberg (1994) recommended a stages approach to making an IT outsorcing
decision-making consisting of the following:
• Identify a pilot system. This minimises risk and determines the necessary resources
for success.
• Identify potential suppliers. By soliciting several suppliers the organisation will
ensure competitive bidding.
36
• Conduct an assessment. The assessment should include the scope and size of the
systems, quality (stability, maintainability) of the systems, backlog history and
trends, presence and quality of procedures, and current level of user satisfaction.
The Research Model For IT Decision-Making Processes
A framework for evaluating IT outsourcing decision-making processes needs to
be built on a sound theoretical foundation.
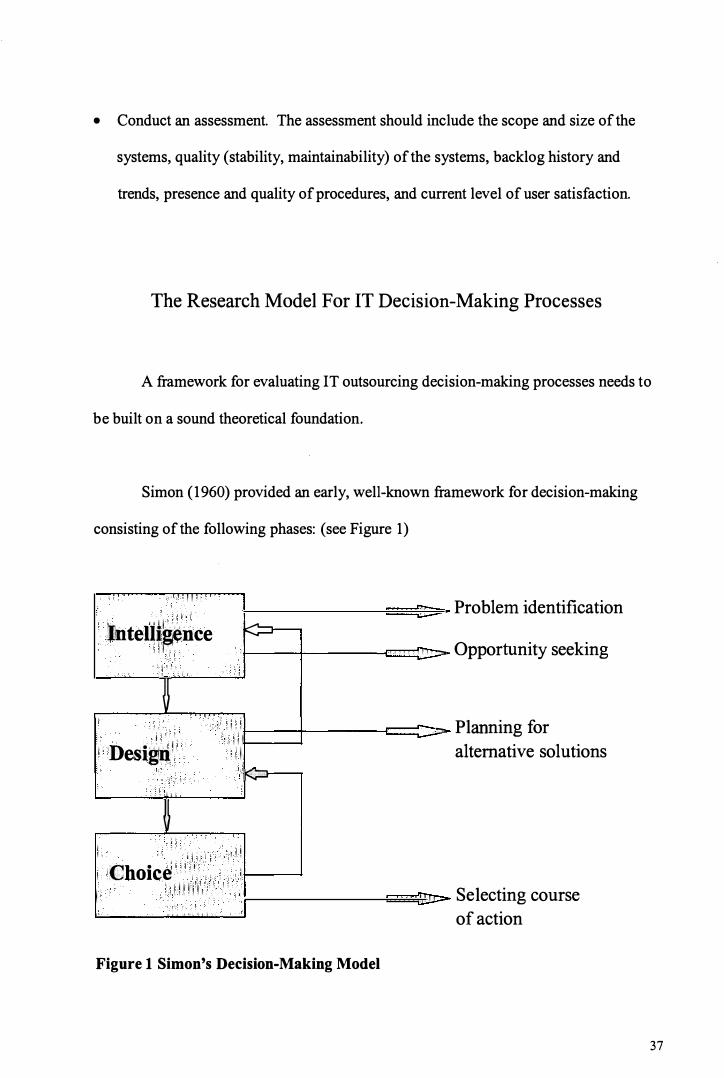
Simon (1960) provided an early, well-known framework for decision-making
consisting of the following phases: (see Figure 1)
Intelligence k:=i
l
Design K;:J
ij
Choice
Figure 1 Simon's Decision-Making Model
..,,,
..,,
Problem identification
Opportunity seeking
Planning for
alternative solutions
Selecting course
of action
37
• Intelligence phase for problem identification or opportunity seeking. In this stage,
the environment is searched for clues that may identify problems or opportunities.
• Design phase for the planning of alternative solutions. This involves processes to
understand the problem, to generate solutions, and to test solutions for feasibility.
• Choice phase for selecting an alternative course of action from those available. A
choice is made and implemented.
The above decision-making model does not provide a formal feedback mechanism
that allows experience to be incorporated into subsequent decision-making processes.
For IT outsourcing this is important because not all systems or operations are
outsourced at once. The processes of evaluation, learning and strategy reformulation are
continual and lessons learned should be applied to new areas of IT being outsourced.
Simon's model therefore can be improved by the addition of an evaluation and
monitoring phase.
For this research, Simon's (1960) design and choice phases have been renamed
as three phases, namely analysis and planning, strategy selection, and action. The design
phase in Simon's model involved the activity of generating solutions for the problems
and analysing their feasibility. Simon's design phase was renamed and spilt into the two
phases namely analysis and planning and strategy selection. Simon's choice phase was
renamed as action. The IT outsourcing decision-making research model (see Figure 2)
38
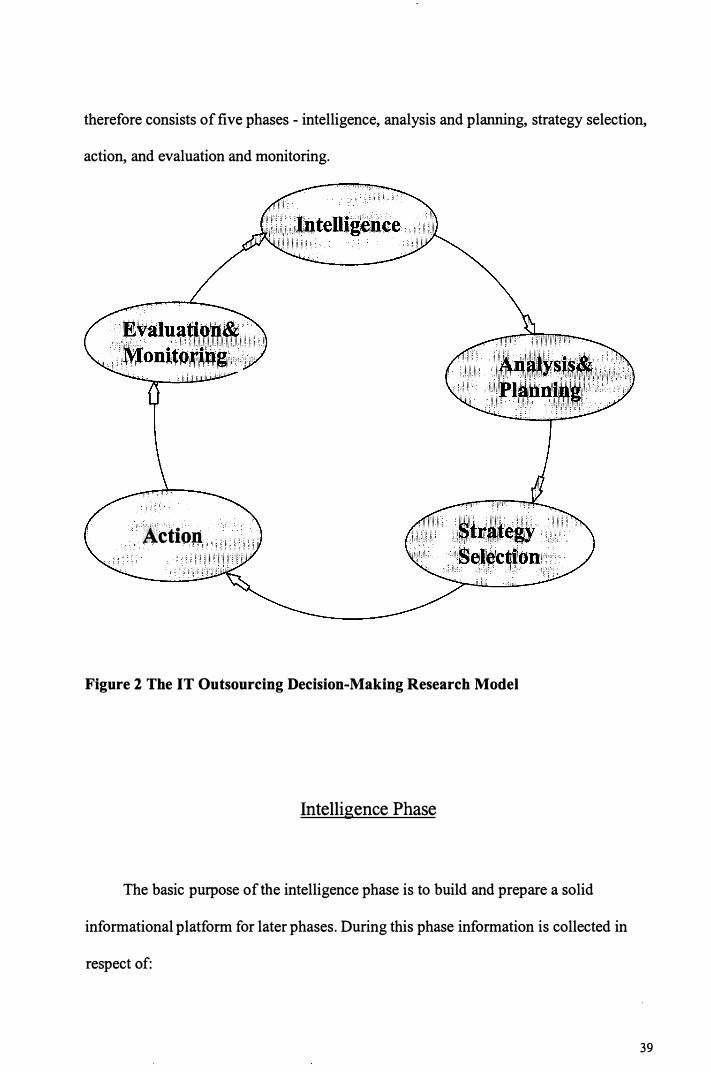
therefore consists of five phases - intelligence, analysis and planning, strategy selection,
action, and evaluation and monitoring.
Action
Figure 2 The IT Outsourcing Decision-Making Research Model
Intelligence Phase
The basic purpose of the intelligence phase is to build and prepare a solid
informational platform for later phases. During this phase information is collected in
respect of:
39
• The Organisation's Needs and Circumstances For IT Outsourcing.
In the information age the dominance of an organisation in a market will depend on
the understanding of its future business and its IT requirements. IT infrastructure
and the business are two entities that complement each other whether it is an
internal IT department or an external entity based on an outsourcing contract. The
recognition and highlighting of the organisation's needs and objectives can be
achieved by defining the IT strategy, the business strategy and the strategic
alignment between them. Issues and objectives such as the use of IT to improve
productivity, quality of services/products and to develop competitive advantages
(Boar, 1994) should be included in the strategic plan of the business and highlighted
during the intelligence phase. Requirements such as the need to reduce IT costs, to
keep up with emerging technologies and to create an IT architecture (Boar, 1994)
should be taken into account during this phase.
• The Status of The IT Function.
Information is collected on IT resources currently used to support the organization
in achieving its goals and objectives. Definition of the IT organization such as
staffing, functional responsibilities, services provided and control services
(Minoli, 1995) should be identified.
Considerations should be given to functional issues such as processing of
requests for changes to systems, lead times required for implementing new
systems, IT's responsiveness to changing user needs, support for users in
preparing system proposals and flexibility of data and reports from systems
40
(Miller & Doyle, 1987 cited in Grover et al, 1995). The nature of IS/IT cost
structure, including current and historical profit and loss statements (Minoli,
1995) should be recognised.
• The IT Staff Quality
With regards to IT staffing some key issues such as responsiveness of IT personnel
to user needs, quality and technical competence of the IT personnel and relationship
of IT personnel with users (Miller & Doyle, 1987 cited in Grover et al, 1995) should
be highlighted.
• The IT Outsourcing Phenomenon
An intensive research should be conducted to learn about the outsourcing
phenomenon by reading material available on the subject, learning from other
organisation's outsourcing experiences, and obtaining knowledge and advice from
the outsourcing consultants. The discussion contained in the previous chapter of the
thesis provides an overview of the IT outsourcing phenomenon.
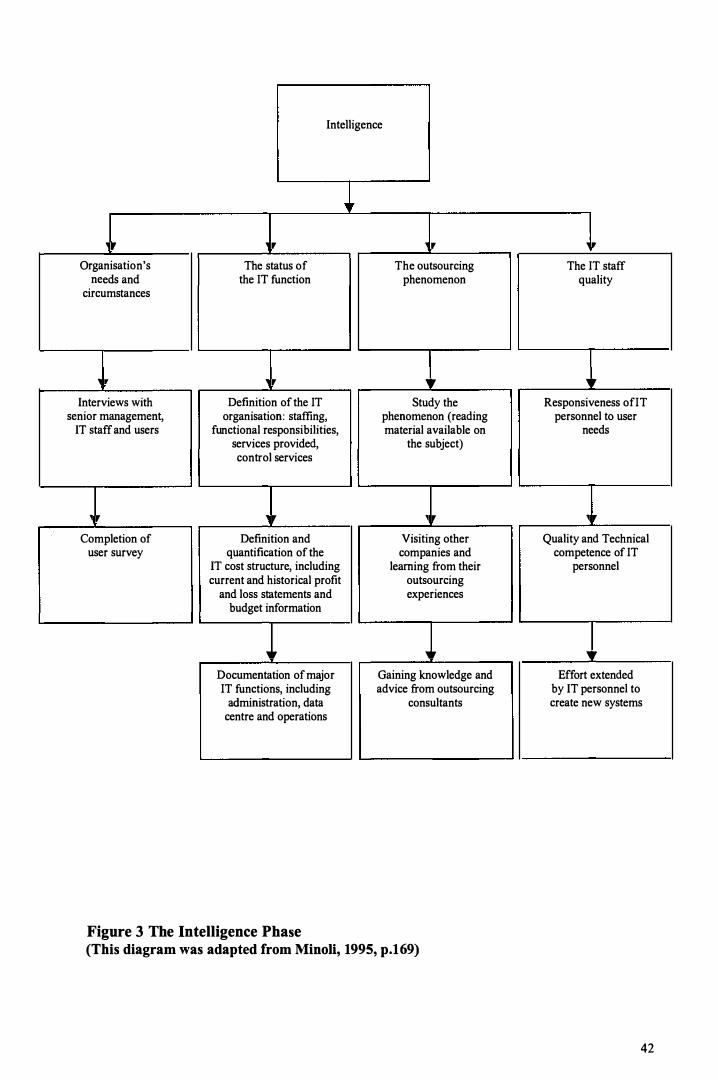
The following diagram (see Figure 3) explains in more detail the Intelligence
phase. It is a revised version ofMinoli's diagram (Minoli, 1995). Five steps from
Minoli were divided into four groups. The first group covers fact finding techniques to
provide information regarding organisation's needs and circumstances for IT
outsourcing. The second group provides information about the current IT resources to
support the organization. A third group was added regarding the IT outsourcing
phenomenon to provide sufficient information about the phenomenon, (this was largely
based on James, 1993). The fourth group highlights the IT staff quality.
41
Intelligence
,, , ' , ' �r
Organisation's The status of The outsourcing The IT staff needs and the IT function phenomenon quality
circumstances
, r , ' V V Interviews with Definition of the IT Study the Responsiveness ofIT
senior management, organisation: staffing, phenomenon (reading personnel to user IT staff and users functional responsibilities, material available on needs
services provided, the subject) control services
1 , 1 , 1 , 1 ,
Completion of Definition and Visiting other Quality and Technical user survey quantification of the companies and competence of IT
IT cost structure, including learning from their personnel current and historical profit outsourcing
and loss statements and experiences budget information
,, ,, V
Documentation of major Gaining knowledge and Effort extended IT functions, including advice from outsourcing by IT personnel to
administration, data consultants create new systems centre and operations
Figure 3 The Intelligence Phase (This diagram was adapted from Minon, 1995, p.169)
42
Analysis and Planning Phase
During this phase, the current IT is analysed and the feasibility of outsourcing
established. The following decision-making activities occur.
• The effectiveness and the efficiency of the IT department should be evaluated on
technical, operational, and economic criteria (Davis & Olson, 1985). The analysis
should reveal whether or not the IT align with the objectives of the organisation, are
operating effectively and efficiently, and are experiencing problems. If not,
outsourcing may be an attractive option.
• The IT outsourcing option itself should be evaluated against a range of factors such
as identified by Minoli (1995). Factors supporting IT outsourcing include cost
savings in IT personnel, service improvements, IT skills not currently available, and
freeing up staff for more strategic functions. Factors against IT outsourcing include
the IT function being too critical or strategic, costs savings are difficult to
demonstrate, the vendor may be difficult to manage or is unable to meet service and
contractual goals.
43
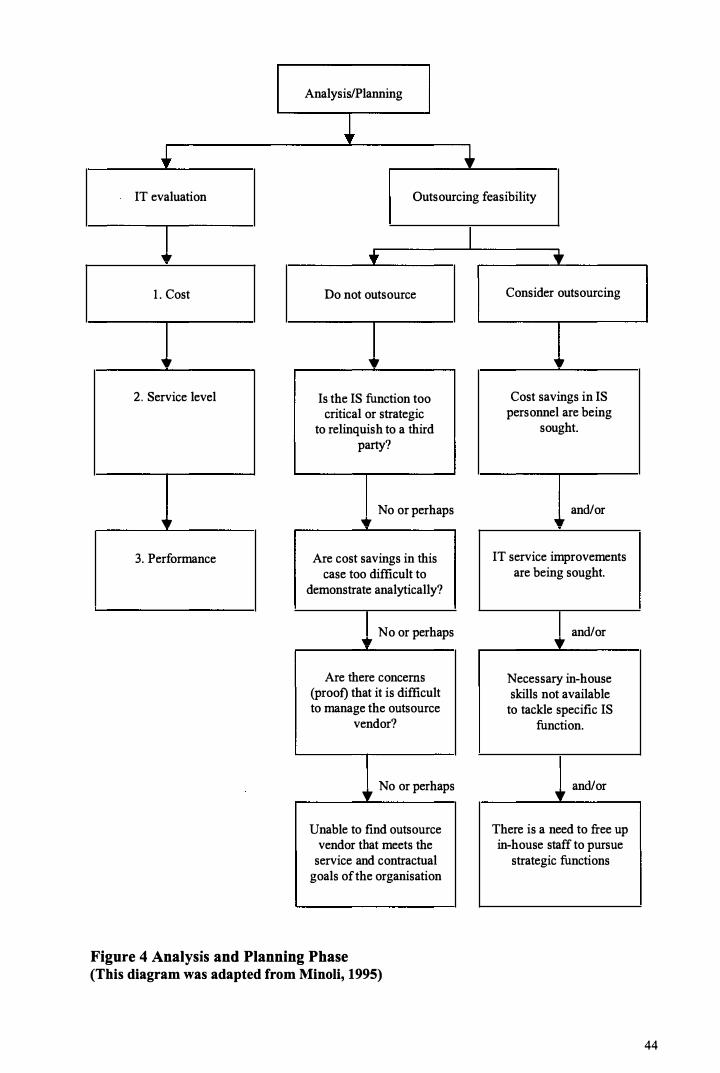
Analysis/Planning
+ IT evaluation Outsourcing feasibility
.. 1. Cost
.. 2. Service level
.. 3. Performance
Do not outsource
.. Is the IS function too critical or strategic
to relinquish to a third party?
No or perhaps ....
Are cost savings in this case too difficult to
demonstrate analytically?
No or perhaps.. Are there concerns
(proof) that it is difficult to manage the outsource
vendor?
• No or perhaps
Unable to find outsource vendor that meets the
service and contractual goals of the organisation
Figure 4 Analysis and Planning Phase (This diagram was adapted from Minoli, 1995)
_y_ Consider outsourcing
.. Cost savings in IS
personnel are being sought.
and/or.. IT service improvements
are being sought.
• and/or
Necessary in-house skills not available to tackle specific IS
function.
• and/or
There is a need to free up in-house staff to pursue
strategic functions
44

Strategy Selection Phase
In this phase, the decision should be made whether to outsource totally, to
outsource partially, or to insource. When determining which strategy to adopt, the
decision maker has to consider whether or not IT is core to business success, control can
be maintained over IT under outsourcing, levels of service can be improved, service can
be delivered more flexibly, and new risks can be managed.
Action Phase
Once the IT outsourcing strategy has been selected, the organisation should take action
in respect of:
• Selecting the outsourcing vendor
According to Minoli (1995), there are a number of decision criteria by which
potential vendors should be evaluated. They include track record, support talent,
reasonableness of pricing, financial stability, negotiated performance measurements,
and ability to meet organisation specific criteria.
• Managing the outsourcing contract
To arrive at a suitable agreement, it is important that an appropriate price be
negotiated and that business requirements are determined and communicated to the
vendor (Crone, 1992). Furthermore, service levels should be negotiated, the contract
period be determined, and provisions be made for withdrawing from the contract or
having it extended.
45
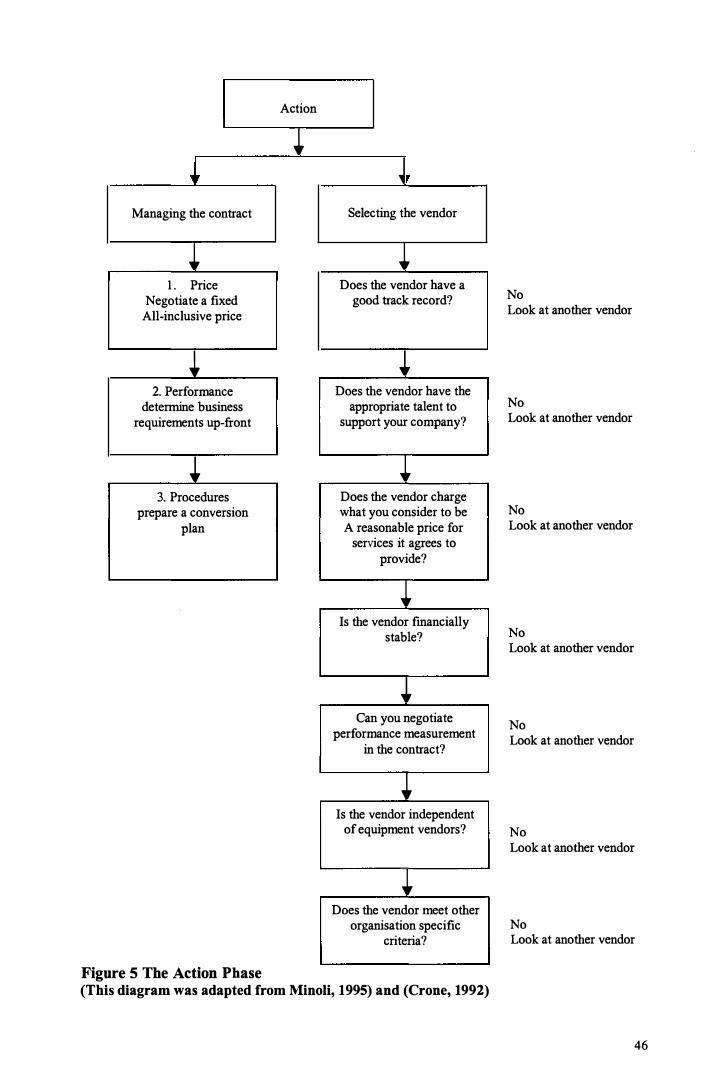
Action
+ �
Managing the contract Selecting the vendor
i i 1 . Price Does the vendor have a
Negotiate a fixed good track record? All-inclusive price
No Look at another vendor
+ i 2. Performance Does the vendor have the
determine business appropriate talent to requirements up-front support your company?
No Look at another vendor
i i 3. Procedures Does the vendor charge
prepare a conversion what you consider to be plan A reasonable price for
No Look at another vendor
services it agrees to provide?
i Is the vendor financially
stable? No Look at another vendor
i Can you negotiate
performance measurement in the contract?
No Look at another vendor
+ Is the vendor independent
of equipment vendors? No Look at another vendor
+ Does the vendor meet other
organisation specific No criteria? Look at another vendor
Figure S The Action Phase (This diagram was adapted from Minoli, 1995) and (Crone, 1992)
46

Evaluation and Monitoring Phase
According to Callaghan (1993, p. 125), " Without a framework that allows for
regular reviews, a feedback mechanism and monitoring of progress, you are not
destined for a smooth journey." The evaluation of IT outsourcing should focus on its
outcomes such as improvement in service levels and quality of products and services,
and cost reductions. An assessment should also be made whether or not the outsourced
IT function meets organisational and management objectives and whether the question
of redundant staff has been satisfactorily resolved. The evaluation and monitoring of the
IT outsourcing project should be carried out by management since they are the ones
with the necessary authority to enter into and vary outsourcing arrangements.
Implication For The Study
The information technology outsourcing phenomenon continues to grow with an
estimated market size of over $70 billion in 1998 (Kem & Willcocks, 1999). Many
researches were conducted and many papers were written about the IT outsourcing
phenomenon in an attempt to provide a clear picture about different aspects of the fast
growing and adopting phenomenon. What do the researches and papers have to say
about the IT outsourcing that can inform businesses and improve the decision-making
process? While a number of responses to this question, some rather narrowly focussed,
are possible, this section discusses the comprehensive ones.
47

Three major issues were raised namely the nature of IT outsourcing decision
making, motivations for outsourcing decisions and the outsourcing decision-
making process. It was suggested that the IT outsourcing decision-making is
behavioural in nature as opposed to prescriptive because it is a highly cognitive
demanding task.
The research conducted by Lacity and Hirschheim (1993) has shown that
motivations for outsourcing decisions other than the cost efficiency are the following:
management responding to the efficiency imperative, members promoting their self
interests at the expense of others, members reacting to new trend in IT and members
wishing to avoid decision-making.
While one of the prominent findings of the literature review is that many
attempts were made to provide series of steps for making a successful outsourcing
decision, the IT outsourcing decision-making process needed more in depth analysis
and examination which was not found in many researches. This research attempts to
provide a decision-making process for making successful outsourcing decisions.
48

CHAPTER FOUR
RESEARCH DESIGN
As the IT outsourcing decision-making research domain is relatively new, the
research will be exploratory in nature. It aims to provide a greater understanding of the
outsourcing decision-making process by examining how management in different
organisations made IT outsourcing decisions. The research is based on a model (see
previous chapters) to discover decision-making processes in a variety of different
industries.
This research adopted an inductive approach. According to Dane (1990)
inductive reasoning is a process of generalisation; it involves applying specific
information to a general situation or future events. In this study various organisations
were studied to determine their IT outsourcing decision-making processes. Based on the
findings, conclusions will be drawn about the important processes in decision-making.
Combination Of Qualitative And Quantitative Research Methods
The research approach used in this study follows the suggestions of Gable
(1994), namely the use of the qualitative case study method complemented by
quantitative survey research.
49

The study' s findings should make a contribution to field and discipline. The
traditional methods qualitative and quantitative approaches have their advantages and
disadvantages. For example, it is difficult to achieve generalisation from one or even
few case studies. With regard to questionnaires, it is not guaranteed to receive accurate
answers back or to achieve a high response rate especially if the area of research is
sensitive. To avoid the disadvantages of each method a combination of the two methods
is used in this research. According to Babbie (1979) "In the best of all possible worlds,
your own research design should bring more than one research method to bear on the
topic" (p.110. cited in Brewer and Hunter, 1989, p.28).
Bryman (1988) argued that both research methods may be relevant at different
stages in the research process stating that quantitative research can establish regularities
and patterns while qualitative research can provide details on processes which link the
variables. According to Brannen (1992) "If the purpose of the qualitative fieldwork is to
clarify or extend a survey finding, then it must be conducted after the survey" (p.23). In
this research the interviews were conducted after the survey in order to help interpreting
the statistical findings.
Obtaining the same results using different sources of data and methods will help
to prove the validity and the reliability of the outcome. Webb et al (cited in Bryman,
1988, p.131) suggested that a greater confidence could be placed in the findings if more
than one method of investigation was used. Using more than one research instrument is
referred to as triangulation of measurement (Bryman, 1988).
50

The research methodology used in this study employs a combination of
qualitative and quantitative methods with an emphasis on triangulation through the use
of questionnaires and interview.
Triangulation was achieved by collecting the data from multiple sources. The
first source was the questionnaire, which was sent out to Australian organisations. The
second source was the personal interviews in which the same questions were asked of
each respondent in the same way and order as the questionnaire was designed.
The interviews were more flexible which allowed the interviewees to explain
their answers and provide elaboration by giving examples from their organisations and
experiences. This resulted in maximising the data and helped to adequately answer the
research question.
Gable (1994) pointed out that the integration of case studies and the survey can
be useful in a larger, and more complex research design. The research involving the IT
outsourcing decision-making processes is a relatively new phenomenon. It is a
significantly complex issue to justify the use of multi-methdological approach. With an
integrated methodology, the case studies would act as a source of rich detail to help in
interpreting the quantitative findings from the survey.
5 1
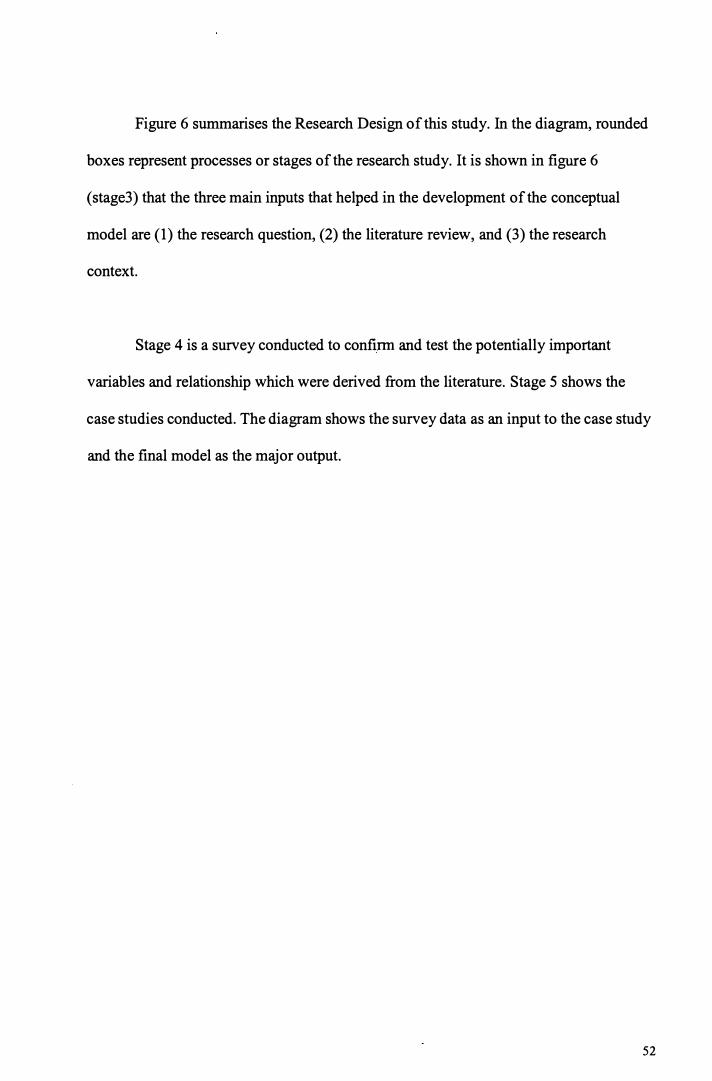
Figure 6 summarises the Research Design of this study. In the diagram, rounded
boxes represent processes or stages of the research study. It is shown in figure 6
( stage3) that the three main inputs that helped in the development of the conceptual
model are (1) the research question, (2) the literature review, and (3) the research
context.
Stage 4 is a survey conducted to confirm and test the potentially important
variables and relationship which were derived from the literature. Stage 5 shows the
case studies conducted. The diagram shows the survey data as an input to the case study
and the final model as the major output.
52

Research question
1) Definestrategycontext
2) Review literature
3) Develop
Research context
Potentially important variable/
relationship
. . . conceptualmodel
1) Establishextent ofoutsourcing
2} Confirmvariables
4) Conductsurvey
Figure 6 The Research Design Model (This diagram was adapted from Gable, 1994)
S) .Conduct casestudy
6) Tile finalmodel
Survey data
Tentative pattern of variables
53
Questionnaire Design
Data was collected through the use of a questionnaire. To ensure accurate and
standardised responses, the questionnaire had instructions specifying how it should be
completed. Opinions were sought on the research variables, which were presented as decision
making phases, tasks and subtasks. Participants were requested to express their opinions on a
7-item scale. The questionnaire is organised into three major sections as discussed below.
':£'he questions were placed in a logical order following the phases in the IT
outsourcing decision-making model. This was intended to help the respondent complete
the questionnaire more quickly by reducing the number and degree of topic changes,
making one question lead into another smoothly (Blank, 1984). Questions were varied
by length and type to avoid repetition, which can make a respondent grow restless and
lose interest in participating in a process that can begin to "seem like work". (Blank,
1984).
Section 1 : Background Information About Organisations
This section of the questionnaire provided the researcher with general
background information about the organisation. The section contains four questions
related to the demographic characteristics of the organisation such as number of
employees within the organisation, number of IT employees within the organisation
54

and the number of years the organisation had been considering or had managed IT
outsourcing. A list of industry categories was provided to describe the activities of the
organisation. If the list did not accurately reflect the activities performed by the
organisation, the respondent was asked to specify the organisation category or type.
These questions were asked at the beginning of the questionnaire because they
are simple, easy and would draw the respondent's attention. According to Blank (1984)
these types of questions "should not be a threat to the respondent and should be clear.
These questions will help accustom the respondent to participation in the study and will
develop interest" (p. 139). This part of the questionnaire assists the researcher in
interpreting the data collected in the following sections.
Section 2: Factors Affecting The IT Outsourcing Decision
This section consisted of the five major phases of the IT outsourcing decision
making processes, namely intelligence, analysis and planning, strategy selection, action,
and evaluation and monitoring. Each phase was broken down into tasks and subtasks
which had been drawn from relevant literature (see Table 1 ). For discussion refer to
chapter 3.
55
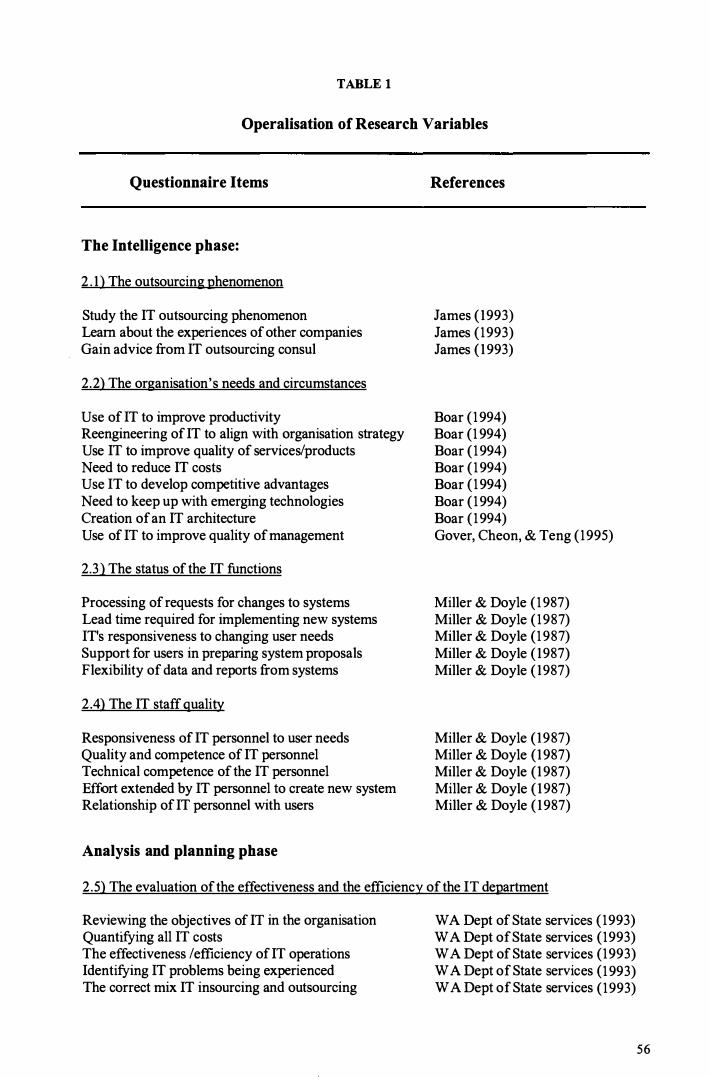
TABLE 1
Operalisation of Research Variables
Questionnaire Items
The Intelligence phase:
2 . 1) The outsourcing phenomenon
Study the IT outsourcing phenomenon Learn about the experiences of other companies Gain advice from IT outsourcing consul
2.2) The organisation's needs and circumstances
Use of IT to improve productivity Reengineering of IT to align with organisation strategy Use IT to improve quality of services/products Need to reduce IT costs Use IT to develop competitive advantages Need to keep up with emerging technologies Creation of an IT architecture Use of IT to improve quality of management
2.3) The status of the IT functions
Processing of requests for changes to systems Lead time required for implementing new systems IT's responsiveness to changing user needs Support for users in preparing system proposals Flexibility of data and reports from systems
2.4) The IT staff quality
Responsiveness of IT personnel to user needs Quality and competence of IT personnel Technical competence of the IT personnel Effort extended by IT personnel to create new system Relationship of IT personnel with users
Analysis and planning phase
References
James (1993) James (1993) James (1993)
Boar ( 1994) Boar (1 994) Boar ( 1994) Boar ( 1994) Boar ( 1994) Boar ( 1994) Boar ( 1994) Gover, Cheon, & Teng (1995)
Miller & Doyle ( 1987) Miller & Doyle ( 1987) Miller & Doyle (1987) Miller & Doyle ( 1987) Miller & Doyle ( 1987)
Miller & Doyle (1987) Miller & Doyle (1987) Miller & Doyle (1987) Miller & Doyle ( 1987) Miller & Doyle ( 1987)
2.5) The evaluation of the effectiveness and the efficiency of the IT department
Reviewing the objectives of IT in the organisation Quantifying all IT costs The effectiveness /efficiency ofIT operations Identifying IT problems being experienced The correct mix IT insourcing and outsourcing
WA Dept of State services ( 1993) WA Dept of State services (1993) WA Dept of State services ( 1993) WA Dept of State services ( 1993) WA Dept of State services (1993)
56

Table 1 (CONT'D)
Origin of Questionnaire items
Questionnaire Items References
2.6) The feasibility of outsourcing and its effect on the organisation
IT function too critical to relinquish to a third party Cost savings difficult to demonstrate Concerns about managing the outsourcing vendor Outsourcing vendor able to meet service goals Cost savings in IT personnel being sought IT service improvements being sought In-house skills to tackle a specific IT function Freeing up in-house staff for strategic functions
Strategy selection phase
2.7) Outsourced functions
Data processing functions Telecommunication and LAN functions Software development Technical support/help desk Disaster Recovery
2.8) Decision type
Fully outsourced Partial outsourced Fully insourcing
2.9) Strategy type
The IT function is a core business The IT function requires expertise The level of IT service provided Better management of IT risk Perceived flexibility in providing IT services Reduced cost of IT function
Minoli ( 1995) Minoli ( 1995) Minoli ( 1995) Minoli ( 1995) Minoli ( 1995) Minoli ( 1995) Minoli (1 995) Minoli ( 1995)
Minoli ( 1995) Minoli ( 1995) Minoli ( 1995) Minoli ( 1 995) Minoli ( 1 995)
Minoli ( 1995) Minoli ( 1995) Minoli ( 1995)
The researcher The researcher The researcher The researcher The researcher The researcher
57

Table 1 (CONT' D)
Origin of Questionnaire items
Questionnaire Items
Action phase
2.10) Selecting the outsourcing vendor
A good track record by the vendor Appropriate talent to support your organisation Reasonable price for the service agreed Financial stability of the vendor Ability to negotiate performance measurements Satisfying organisation specific criteria
2.11) Managing the outsourcing process and contract
Ability to negotiate the price Determining business requirements up front Determining services to be provide Negotiating service levels Ability to withdraw from the contract Determining the duration of the contract Possibility of extending the contract
2.12 Evaluation/Monitoring phase
Provides an acceptable level of service Delivers cost savings Results in improved quality of services/products Objectives are consistent with organisational objectives Objectives meet senior management's needs Will be able to deal with redundant staff Turn IT employees into internal or external contractors
References
Minoli (1995) Minoli (1995) Minoli (1995) Minoli (1995) Minoli (1995) Minoli (1995)
Crone (1992) Crone (1992) Crone (1992) Crone (1992) Crone (1992) Crone (1992) Crone ( 1992)
WA Dept of State services (1993) WA Dept of State services (1993) WA Dept of State services (1993) Minoli (1995) Minoli (1995 Minoli (1995) Minoli (1995)
58

Section 3 : IT Outsourcing Experiences
This section establishes the outsourcing experience of participants. Data was
gathered on the number of years of experience in IT the organisation had and the
number of years experience with IT outsourcing. Also the level of involvement in the
outsourcing decision, and the reliance on the decision-making model when considering
outsourcing. The section provides information about the satisfaction with the final
results of the outsourcing decision and the rate of knowledge and experience with
outsourcing. The section captured the level of involvement in the outsourcing decision,
and the satisfaction with the final results of the outsourcing decision.
Pilot Testing Of Questionnaire
To ensure the validity of the questionnaire, a pilot test was carried out. The
testing involved an information systems academic with extensive industry and
outsourcing experience, and a Ph.D. student who was studying in the area of IT
outsourcing. They were asked to complete the questionnaire and to comment on the
wording of the questions, the scales used, and the general appearance of the
questionnaire. They were also required to record the time taken to complete the
questionnaire.
59
I I
\ : .I

With regard to the wording of the questionnaire, the researcher was looking
particularly for clarity and non-ambiguity. To improve the wording of the questions
some changes were made by adding and deleting some of the words, which were
thought to be unclear during the testing to improve the communications with the
respondents.
The use of jargon was avoided by eliminating the mentioning of 'phases of the
decision-making processes' because it was thought that they made the questionnaire too
academic. A comment was made by one of the testers that too many positive aspects of
IT outsourcing were shown. However, the questionnaire (question 2.6) does address and
capture data associated with the feasibility of outsourcing.
Conduct Of Survey
The survey was the first phase of the study. It was designed to produce data on IT
outsourcing decision-making processes within Australian firms. The sample was initially
selected from the "DataDisk" (Australian Stock Exchange, 1996) distributed to Edith Cowan
library on 30 October 1996. DataDisk is a collection of organisation reviews compiled by the
Australian Stock Exchange.
The sample included large Australian organisations. The top 200 companies by
market capitalisation were selected. The addresses of these companies were obtained
from the database. It was argued that such companies would be likely to have large IT
60
department which had attempted Business Process Re-engineering (BPR) or
outsourcing in an attempt to reduce costs and to improve services.
The questionnaires were sent out and seven days later 115 questionnaires were
returned mainly because of incorrect addresses. This resulted in an examination of the
database again and having the library staff conduct further examination on the database,
which was found to be faulty. A small number of questionnaires were completed and
returned.
As a result of the faulty DataDisk another round of questionnaires had to be sent.
In this round, the sample was selected from "Kompass" (Australian Stock Exchange,
1996). The disk was used successfully in a number of previous studies conducted by
School of Management in the Business Faculty at Edith Cowan University. Kompass is
a database providing detailed information on thousands of Australian companies, their
products and executives.
Kompass enabled the selection oflarge Australian companies by number of
employees. Such organisations are likely to have large IT departments which are likely
to join the current trend of outsourcing. The top 200 companies by number of
employees were selected for this round. It was noted that some of these companies were
found in both databases. For that reason the organisation names were cross-checked
with the first database (DataDisk) to eliminate sending more than one questionnaire to
each organisation. Sixty companies were crossed out because they were repeated in the
second database, which resulted in sending out 140 questionnaires. Also 50 government
61
agencies were selected randomly from the government business directory. The total
number of questionnaires that were sent out in the second round was 190. The subjects
of the study were the IT managers in these organisations.
In the first round, 200 questionnaires were mailed out. Out of these, 105
questionnaires were returned due to incorrect addresses, 5 organisations formally
declined to participate to the study due to organisation policies and 2 because they had a
small IT infrastructure. Three companies were no longer in business.
In the second round 190 questionnaires were mailed out. Twenty questionnaires
were returned due to incorrect addresses. Two government agencies refused to
participate and 4 incomplete responses were received. Of the total 390 questionnaires
which were sent out, 48 responses were received of which 4 were inadequately
completed. This left 44 useable responses (17.4% response rate) for data analysis (see
Table 2).
62
agencies were selected randomly from the government business directory. The total
number of questionnaires that were sent out in the second round was 1 90. The subjects
of the study were the IT managers in these organisations.
In the first round, 200 questionnaires were mailed out. Out of these, 1 05
questionnaires were returned due to incorrect addresses, 5 organisations formally
declined to participate to the study due to organisation policies and 2 because they had a
small IT infrastructure. Three companies were no longer in business.
In the second round 190 questionnaires were mailed out. Twenty questionnaires
were returned due to incorrect addresses. Two government agencies refused to
participate and 4 incomplete responses were received. Of the total 390 questionnaires
which were sent out, 48 responses were received of which 4 were inadequately
completed. This left 44 useable responses (1 7.4% response rate) for data analysis (see
Table 2).
62

Table 2
Summary Of The Data Collection Process
Questionnaires mailed
Returned
Incorrect addresses Decline to participate No longer in business Do not have large IT department
Total Responses Received Incomplete responses Total responses used
First Round
200
105
5
3
2
Response rate = total responses used/total sample
Second Round Total
1 90
20
2
390
125
3
2
137
253
48 04
44
17.4%
63

Conduct Of Case Studies
The case study design was the second phase of the study. Case study research is
the most common qualitative method used in information systems (Orlikowski &
Baroudi, 1991, Alavi & Carlson, 1992). It is beneficial to be able to understand and
analyse a diverse, multi-disciplinary field and this helps the researcher to build a rich
picture about the phenomenon being studied and to answer the research question.
Personal interviews with IT managers who were involved in IT outsoucing
processes were conducted to obtain information about the outsourcing decision-making
phenomenon. Knowing how busy IT managers are each interview lasted between 60 to
90 minutes.
"Interviews can be highly structured or completely open-ended, depending of
the purpose of the interview, the researcher's familiarity with and knowledge about the
setting, and the exploratory or confirmatory nature of the study"(Drew et al, 1996,
p. 173).
Because of the exploratory nature of the research, the interviews were structured
to semi-structured. The interviews were structured because the same questionnaire, as
the one used in the mail survey, was used during the interview. In other words the same
questions were asked of each respondent in the same way and in the same order.
According to Blank (1984) the structured interview is restricted to follow the question
wording and instructions in a questionnaire. Interview bias tends to be at a minimum.
They were semi-structured because the respondents were able to elaborate and explain
64

some of the IT outsourcing decision-making to help answering the questions or to show
their ideas about outsourcing.
"There are many tasks that must be performed when conducting an interview. The
validity and reliability of the data collected depend on the interview's ability to
accomplish each of these tasks without introducing any bias into the information
gathered" (Blank 1984, p. 173). According to Blank these tasks include:
• The interviewer should introduce himself/herself
• The study should be explained to the respondent
• The sampling process should be briefly described
• The interview should use a positive approach
The first aim was to establish a rapport with the interviewees to ensure their full
participation in the study. To create a friendly environment, the interview started by a
brief introductory explanation about the identity of the researcher, the study and the
sampling process used. The introductory explanation included a summary of the study
objectives and the interview objectives.
A positive approach was used by informing the interviewees of the importance of
their response and how highly it is valued. The respondents were assured that
confidentiality would be maintained throughout the study. Prior to the commencement
of the interview participants were asked if the interview could be recorded. A tape-
65

recorder was used to tape all the answers to the questions and the participants were
happy to do so.
According to Benbasat, et al (1987) case studies have key characteristics, which
apply to this research,
• Phenomenon are examined in a natural setting: the IT outsourcing phenomenon was
examined in organisations which had outsourced all or parts of their IT operations to
service providers.
• Data are collected by multiple means: the participants were interviewed and a
questionnaire completed at the same time was used as well.
• The complexity of the unit is studied intensively: in depth details were provided
about the IT outsourcing decision-making processes in the organisations studied
during the interview.
• One or few entities (person, group, organisation) are examined: in this study, four
organisations were interviewed.
• The focus is on contemporary events: it is known that IT outsourcing is one of the
most important topics of the nineties.
66

• No experimental controls or manipulations are involved: the case study research was
conducted in a natural setting namely the offices of the interviewees.
• The research is directed at the exploration and classification: as discussed the
newness of the IT outsourcing decision-making research makes this study
exploratory in nature.
The research is addressing ''why" and "how" questions rather than frequency or
incidence: the researcher made sure to understand the nature and the complexity of the
outsourcing decision-making process and how the decision was made.
67

CHAPTER FIVE
ANALYSIS OF THE SURVEY
As indicated earlier in the thesis, the research was conducted through a survey
and case studies. The data obtained through these two approaches will be analysed
separately before being integrated in the discussion chapter, which is presented later.
This chapter presents, summarises and organises the data which was collected
during the survey. It begins by examining the sample through which the data was
collected.
Characteristics Of Sample
The survey questionnaire captured background data for study participants and
the organisation they were working for. Table 3 summarises their characteristics.
Table 3 Characteristics of The Participants
Characteristics Min Max Mean
Participating persons Years experience in IT 1 35 18.39 Years experience with IT outsourcing 0 15 4.19
Participating organisations Number of employees 55 41,000 5 ,490 Number of IT employees 0 1,100 189 Years considering IT outsourcing 0 15 3.37
68
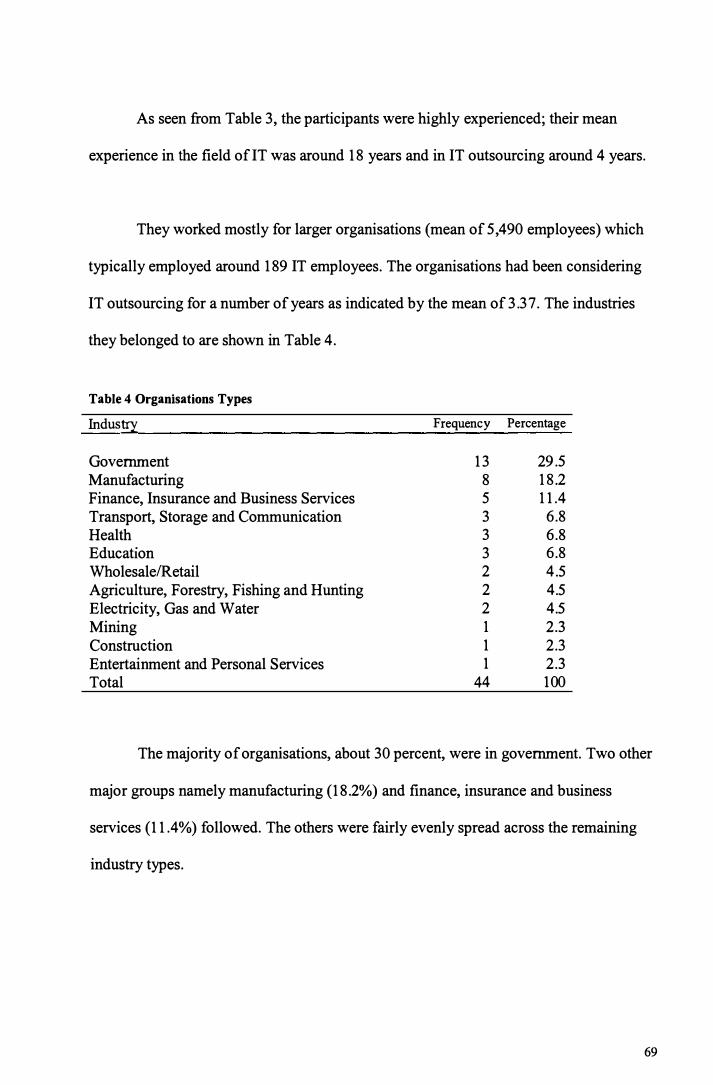
As seen from Table 3, the participants were highly experienced; their mean
experience in the field of IT was around 18 years and in IT outsourcing around 4 years.
They worked mostly for larger organisations (mean of 5,490 employees) which
typically employed around 189 IT employees. The organisations had been considering
IT outsourcing for a number of years as indicated by the mean of 3 .3 7. The industries
they belonged to are shown in Table 4.
Table 4 Organisations Types
Indus!!1_ Frequency Percentage
Government 13 29.5 Manufacturing 8 18.2 Finance, Insurance and Business Services 5 11.4 Transport, Storage and Communication 3 6.8 Health 3 6.8 Education 3 6.8 Wholesale/Retail 2 4.5 Agriculture, Forestry, Fishing and Hunting 2 4.5 Electricity, Gas and Water 2 4.5 Mining 1 2.3 Construction 1 2.3 Entertainment and Personal Services 1 2.3 Total 44 100
The majority of organisations, about 30 percent, were in government. Two other
major groups namely manufacturing (18.2%) and finance, insurance and business
services (11.4%) followed. The others were fairly evenly spread across the remaining
industry types.
69
I. '

Descriptive Statistics
This section provides descriptive statistics of the data for the phases and tasks in
the decision-making model. It uses two statistics, namely the mean and the population
standard deviation to describe the data collected during the survey phase the scale used
to record responses was 1 to 7 where 1 indicated 'not at all' and 7 indicated 'extreme'
agreement with the question.
Intelligence Phase
Table 5 shows descriptive statistics for the first phase in the decision-making
model, the intelligence phase. Questions in this phase were grouped into four main
tasks. Each task contains a number of subtasks. The overall mean for this phase was
5. 14. The responses at the task level were as follows: gathering information on IT
outsourcing (5. 15), organisational needs and circumstances (4.96), IT support issues
(5.26) and IT staff issues with the highest mean (5.47).
At the subtask level, learning about the experiences of other companies has the
highest mean (5.86) and a low standard deviation within the first task. Re-engineering
ofIT to align with organisation strategy (5.44) was the highest in the second task. IT's
responsiveness to changing user needs (5.67) and quality and competence of personnel
(5.77) were the highest within the third and fourth tasks respectively.
70
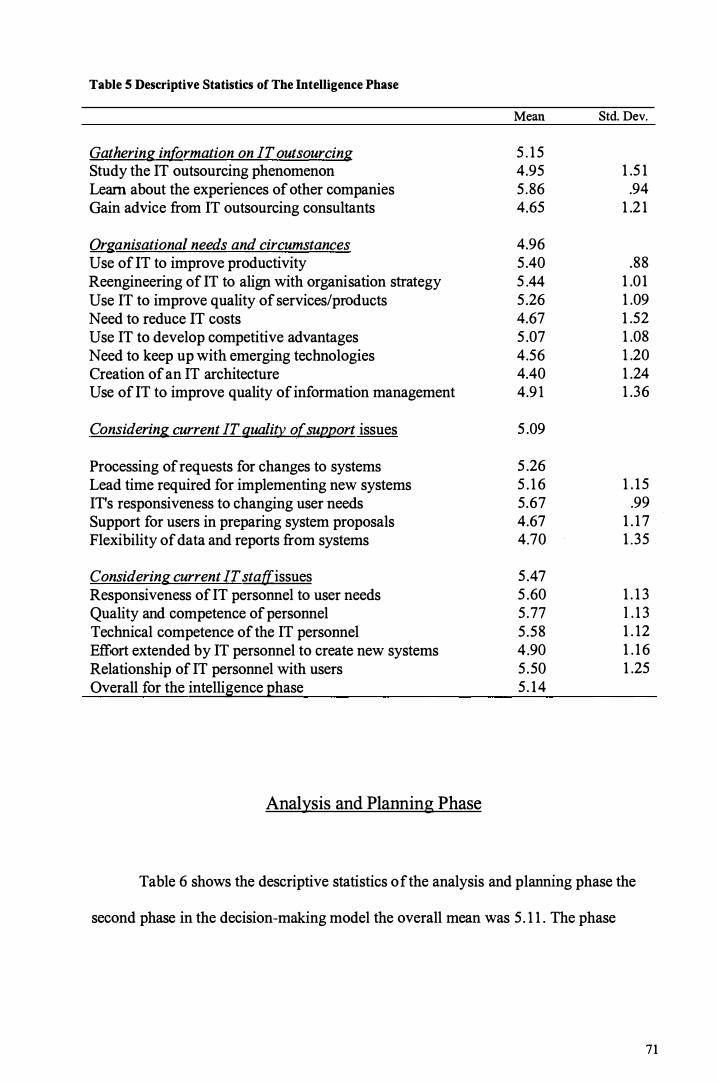
Table 5 Descriptive Statistics of The Intelligence Phase
Gathering in(grmation on IT outsourcing Study the IT outsourcing phenomenon Learn about the experiences of other companies Gain advice from IT outsourcing consultants
Organisational needs and circumstances Use oflT to improve productivity Reengineering of IT to align with organisation strategy Use IT to improve quality of services/products Need to reduce IT costs Use IT to develop competitive advantages Need to keep up with emerging technologies Creation of an IT architecture Use oflT to improve quality of information management
Considering current IT quality of support issues
Processing of requests for changes to systems Lead time required for implementing new systems IT's responsiveness to changing user needs Support for users in preparing system proposals Flexibility of data and reports from systems
Considering current IT stat[issues Responsiveness of IT personnel to user needs Quality and competence of personnel Technical competence of the IT personnel Effort extended by IT personnel to create new systems Relationship of IT personnel with users Overall for the intelligence phase
Analysis and Planning Phase
Mean Std. Dev.
5 . 1 5 4.95 1 .5 1 5 .86 .94 4.65 1 .2 1
4.96 5 .40 .88 5 .44 1 .01 5 .26 1 .09 4.67 1 .52 5 .07 1 .08 4.56 1 .20 4.40 1 .24 4.9 1 1 .36
5 .09
5 .26 5 . 1 6 1 . 1 5 5.67 .99 4.67 1 . 1 7 4.70 1 .35
5 .47 5 .60 1 . 1 3 5 .77 1 . 1 3 5 .58 1 . 12 4.90 1 . 16 5 .50 1 .25 5 . 14
Table 6 shows the descriptive statistics of the analysis and planning phase the
second phase in the decision-making model the overall mean was 5 . 1 1 . The phase
71

consists of two tasks: the evaluation of current IT mean of (5.65) and determining IT
outsourcing feasibility mean of ( 4. 76). The effectiveness/efficiency of IT operations
mean of (5.86) and outsourcing vendor able to meet service goals mean of (5.88) were
the highest responses within the two tasks at the subtask level.
Table 6 Descriptive Statistics of The Analysis and Planning Phase
Evaluation o(current IT Reviewing the objectives of lT in the organisation Quantifying all IT costs The effectiveness /efficiency of IT operations Identifying IT problems being experienced The correct mix IT insourcing and outsourcing
Determining IT outsourcing feasibility IT function too critical to relinquish to a third party Cost savings difficult to demonstrate Concerns about managing the outsourcing vendor Outsourcing vendor able to meet service goals Cost savings in IT personnel being sought IT service improvements being sought In-house skills to tackle a specific IT function Freeing up in-house staff for strategic functions Overall for the analysis and planning phase
Strategy Phase
Mean
5.65 5.70 5.8 1 5.86 5.51 5.40
4.76 4.26 4. 19 5.02 5.88 4.33 5.05 4.79 4.58 5. 11
Std. Dev.
1.06 1.07 .89
1. 14 1.62
1.68 1.54 1.37 1.03 1.52 1.34 1.34 1.56
Table 7 shows the descriptive statistics of the strategy phase. The overall mean
was 4.82. The highest subtask was the level of IT provided (5.40) followed by the IT
function requires expertise (5.09) and perceived flexibility in providing IT services
(5.09).
72
· ,

Table 7 Descriptive Statistics of The Strategy Phase
The IT function is a core business The IT function requires expertise Potential loss of control over the IT function The level of IT service provided Better management of IT risk Perceived flexibility in providing IT services Reduced cost of IT function Overall for the Stratefil'....P.hase
Action Phase
Mean
4.34 5.09 4.43 5.40 4.86 5.09 4.56 4.82
Std. Dev.
1.67 1.19 1.74 1.04 1.13 1.19 1.43
Table 8 describes the response of the action phase which has an overall mean of
5.40. The action phase has two tasks, the first task is selection of IT outsourcing vendor
mean of (5.69). The highest variable within this task is a good track record by the
vendor mean of (5.69). The second task is determining IT outsourcing contract mean of
(5.14) and the highest variable within this task is determining services to be provided
with a mean of 5.71.
73

Table 8 Descriptive Statistics of The Responses of The Action Phase
Selection of IT outsourcing vendor A good track record by the vendor Appropriate talent to support the organisation Reasonable price for the service agreed Financial stability of the vendor Ability to negotiate performance measurements Satisfying organisation specific criteria
Determining IT outsourcing contract Ability to negotiate the price Determining business requirements up front Determining services to be provided Negotiating service levels Ability to withdraw from the contract Determining the duration of the contract Possibility of extending the contract Overall for the Action p_hase
Mean Std Dev
5.69 5.92 5.76 5.42 5.66 5.69 5.66
5.14 5.11 5.35 5.71 5.61 4.80 4.71 4.73 5.40
.67
.87 1.03 .92
1.19 .72
1.32 1.14 .99 .98
1.50 1.23 1.25
Evaluation and Monitoring Phase
Table 9 shows the descriptive statistics of the evaluation and monitoring phase.
The phase has an overall mean of 5.22. The highest response is the provision of an
acceptable level of service with a mean of 6.18.
74
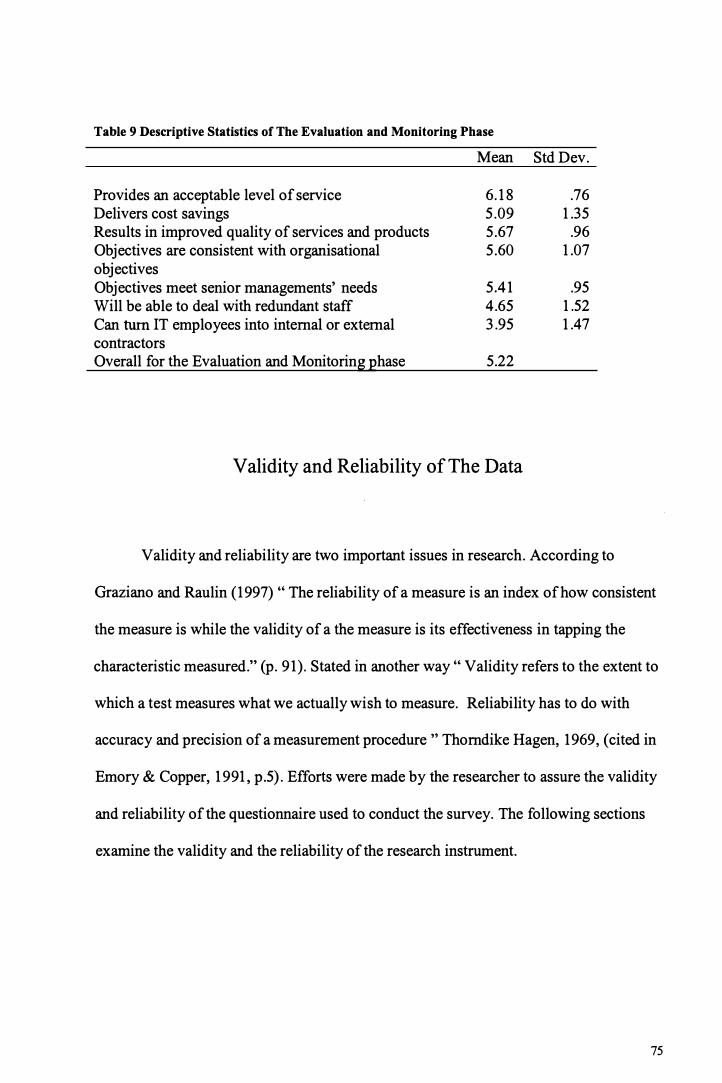
Table 9 Descriptive Statistics of The Evaluation and Monitoring Phase
Provides an acceptable level of service Delivers cost savings Results in improved quality of services and products Objectives are consistent with organisational objectives Objectives meet senior managements' needs Will be able to deal with redundant staff Can turn IT employees into internal or external contractors Overall for the Evaluation and Monitoring_p_hase
Mean
6. 18 5.09 5.67 5.60
5.41 4.65 3.95
5.22
Validity and Reliability of The Data
Std Dev.
.76 1.35 .96
1.07
.95 1.52 1.47
Validity and reliability are two important issues in research. According to
Graziano and Raulin (1997) " The reliability of a measure is an index of how consistent
the measure is while the validity of a the measure is its effectiveness in tapping the
characteristic measured." (p. 91). Stated in another way " Validity refers to the extent to
which a test measures what we actually wish to measure. Reliability has to do with
accuracy and precision of a measurement procedure " Thorndike Hagen, 1969, ( cited in
Emory & Copper, 1991, p.5). Efforts were made by the researcher to assure the validity
and reliability of the questionnaire used to conduct the survey. The following sections
examine the validity and the reliability of the research instrument.
75

Validity
Validity can be established in terms of content and construct. The following
section will discuss the content and construct validity of the questionnaire.
Content validity concerns "the degree to which the scale items represent the
domain of the concept under study" (Davis & Consenza, 1988, p.150). According to
them, content validity can be ensured by: conducting a comprehensive examination of
the literature for all possible items to be included in the scale.
Content validity of the questionnaire was established by reviewing existing
literature to ensure that major aspects of the study were adequately covered by items in
the survey. For details of the literature used to operationalise the research variables refer
to table 1 in chapter 4.
Construct validity was achieved by soliciting the experts' opinions on the
research topic. According to Davis and Consenza (1988) the questionnaire should be
pre-tested by respondents similar to the population being studied and modified as
necessary. In this study pre-testing was carried out by an information systems academic
with extensive industry and outsourcing experience, and a Ph.D. student who was
studying in the area of IT outsourcing. Changes were made as follows: the wording of
the questions was improved by adding and deleting some words and the use of jargon
was avoided. (Refer to chapter 4).
76
\
Reliability
According to Emory and Copper, (1991) the concept of reliability means many
things to many people, but to most it means consistency. A measure is reliable is the
degree to which the questionnaire supplies consistent results. Reliability is a contributor
to validity and it is a necessary but not sufficient condition for validity. Cronbach
Alpha values were computed in order to establish the internal reliability of the
questionnaire responses, i.e. the extent to which all of the subparts of an instrument or
scale measure the same characteristics. The values are shown in Table (10).
77
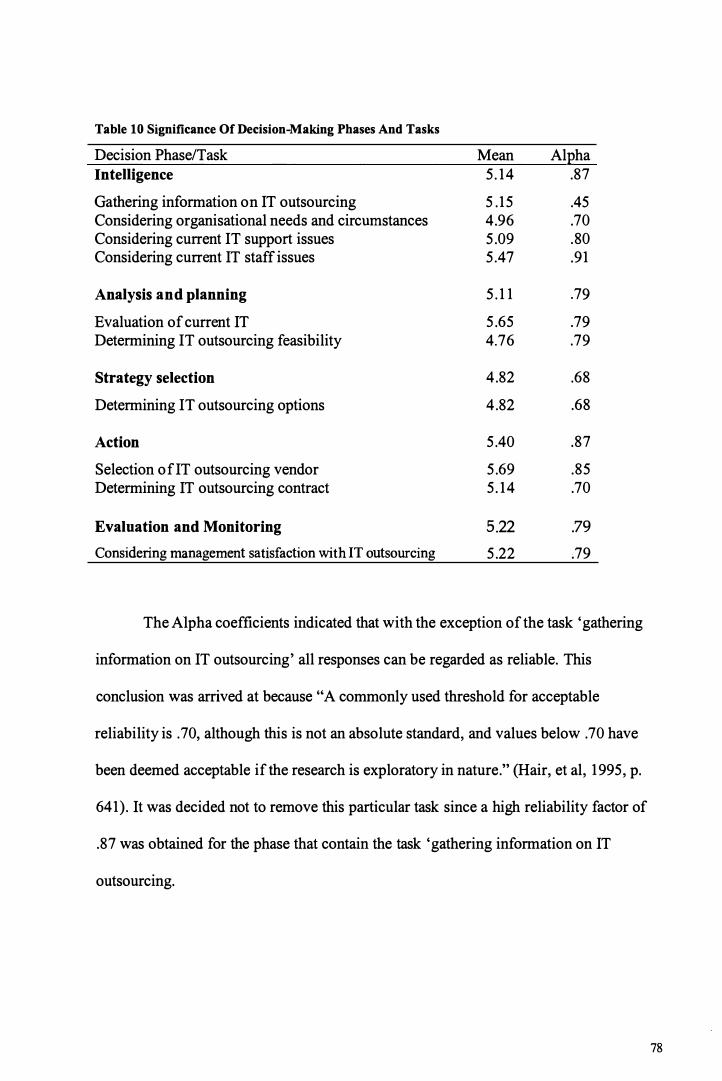
Table 10 Significance Of Decision-Making Phases And Tasks
Decision Phase/Task Mean Al�ha Intelligence 5. 14 .87
Gathering information on IT outsourcing 5 .15 .45 Considering organisational needs and circumstances 4.96 .70 Considering current IT support issues 5.09 .80 Considering current IT staff issues 5.47 .91
Analysis and planning 5. 1 1 .79 Evaluation of current IT 5.65 .79 Determining IT outsourcing feasibility 4.76 .79
Strategy selection 4.82 .68
Determining IT outsourcing options 4.82 .68
Action 5.40 .87
Selection of IT outsourcing vendor 5.69 .85 Determining IT outsourcing contract 5. 14 .70
Evaluation and Monitoring 5.22 .79 Considering management satisfaction with IT outsourcing 5.22 .79
The Alpha coefficients indicated that with the exception of the task 'gathering
information on IT outsourcing' all responses can be regarded as reliable. This
conclusion was arrived at because "A commonly used threshold for acceptable
reliability is .70, although this is not an absolute standard, and values below .70 have
been deemed acceptable if the research is exploratory in nature." (Hair, et al, 1995, p.
641). It was decided not to remove this particular task since a high reliability factor of
.87 was obtained for the phase that contain the task 'gathering information on IT
outsourcing.
78

Distribution Of Data
Most of distributions of data are normal therefore parametric techniques such as
t-test were used to analyse the data. Appendix B shows the distributions of data. The
assumption that the variables being tested are normally distributed, in my case, is not a
problem in this research because the sample size is sufficiently large.
Homogeneity Of Cases and Responses
As an additional measure, cluster analysis was used to classify respondents so
that each respondent is very similar to others in the cluster with respect to the
significance they place on IT outsourcing decision-making tasks Cluster analysis "is an
objective methodology for quantifying the structural characteristics of a set of
observations." (Hair, et al., 1995, p. 435). Figure 7 is the dendrogram (tree graph)
produced as an outcome of a hierarchical cluster analysis using the agglomerative
method (each object starts out as its own cluster) and squared Euclidean distances which
is a popular measure of the similarity (straight line) between two objects.
79

By drawing a vertical line at 7.5 and 17.5 on the axis of Figure 7, one can
establish the membership of the 4 clusters. This shows that 39 cases belong to 1 cluster,
3 cases (cases 12, 34, 21) to another cluster and 1 case each (15 and 44 respectively) to
the other 2 clusters. The cluster analysis therefore indicates that the study sample is
fairly homogenous with most cases belonging to 1 cluster.
80
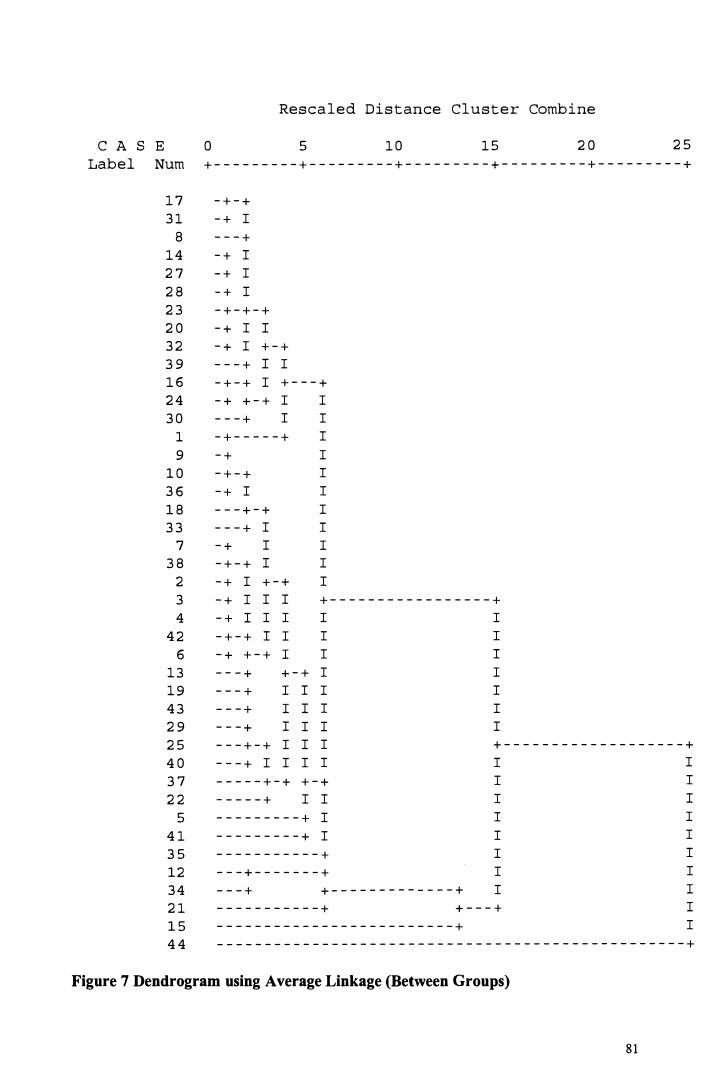
C A S E
Label Num
1 7
3 1
8
14
2 7
2 8
2 3
2 0
3 2
3 9
1 6
2 4
3 0
1
9
1 0
3 6
1 8
3 3
7
3 8
2
3
4
4 2
6
1 3
1 9
4 3
2 9
2 5
4 0
3 7
2 2
5
4 1
3 5
1 2
3 4
2 1
1 5
4 4
Rescaled Distance Cluster Combine
0 5 1 0 1 5 2 0 2 5
+ - - - - - - - - - + - - - - - - - - - + - - - - - - - - - + - - - - - - - - - + - - - - - - - - - +
- + - +
- + I - - - + - + I - + I - + I - + - + - +
- + I I
- + I + - +
- - - + I I
- + - + I + - - - +
- + + - + I
- - - + I
- + - - - - - +
- +
- + - +
- + I
- - - + - +
- - - + I
- + I
- + - + I
- + I + - +
- + I I I
- + I I I
- + - + I I
- + + - + I
- - - + + - +
- - - + I I
- - - + I I
- - - + I I
I
I
I
I
I
I
I
I
I
I
I
+ - - - - - - - - - - - - - - - - - +
I
I
I
I
I
I
I
- - - + - + I I
I
I
I
I
I
I
I
I
I
+ - - - - - - - - - - - - - - - - - - - +
- - - + I I I
- - - - - + - + + - +
- - - - - + I I
- - - - - - - - - + I - - - - - - - - - + I - - - - - - - - - - - + - - - + - - - - - - - +
- - - + + - - - - - - - - - - - - - +
I
I
I
I
I
I
I
I
- - - - - - - - - - - + + - - - +
- - - - - - - - - - - - - - - - - - - - - - - - - +
I
I
I
I
I
I
I
I
I
I
- - - - - - - - - - - - - - - - - - - - - - - - - - - - - - - - - - - - - - - - - - - - - - - - - +
Figure 7 Dendrogram using Average Linkage (Between Groups)
81

Analysis Of Decision-Making Phases
A statistical analysis of the questionnaire responses was conducted to determine
statistically significant relationships and differences between the means of the decision
making phases.
To test the strength of the association between decision-making phases, Pearson
correlation coefficients were computed. They are shown together with their significance
in Table 11.
Table 11 The Association between The Decision-Making Phases
Intelligence Analysis & Strategy Action Evaluation Planning Selection &
Monitoring Intelligence
Analysis & .546*** Planning (.000)
Strategy .571 *** .380** Selection (.000) (.012)
Action .520*** .678*** .261 * (.000) (.000) (.091)
Evaluation & .611 *** .540*** .568*** .584*** Monitoring {.000) {.000) {.000) {.000) *** p < .01 ** p < .05 * p < . 10 () Significance
Table 11 indicates that all decision-making phases vary with each other to a
significant extent. The table shows significant correlation between all the decision
making phases.
82
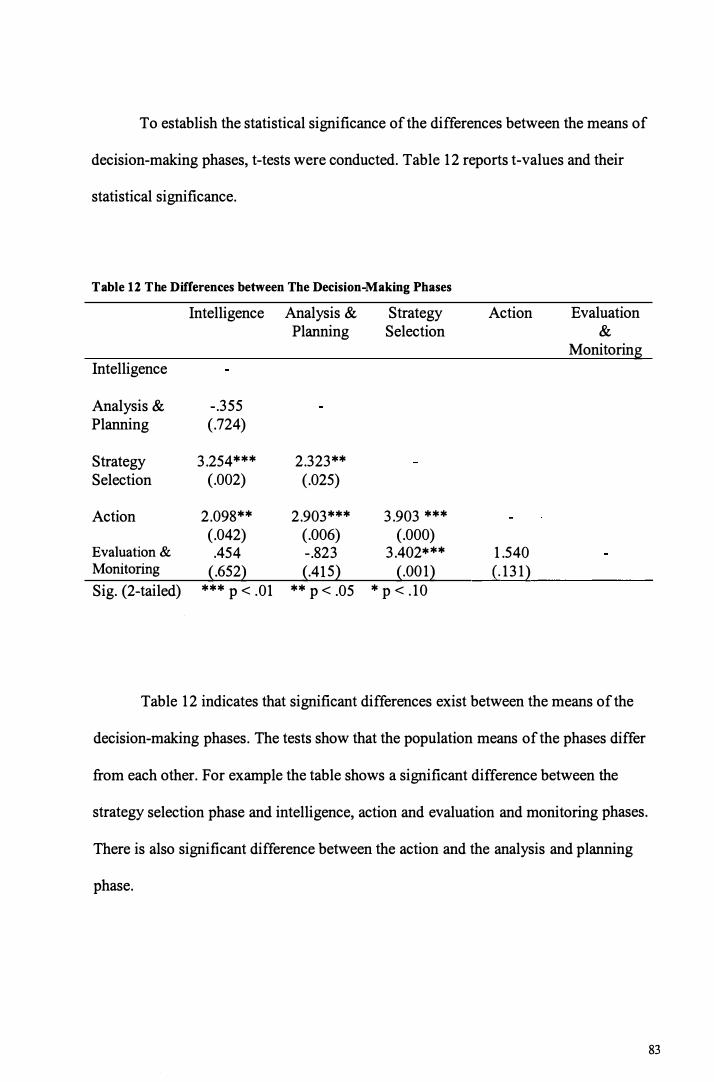
To establish the statistical significance of the differences between the means of
decision-making phases, t-tests were conducted. Table 12 reports t-values and their
statistical significance.
Table 12 The Differences between The Decision-Making Phases
Intelligence Analysis & Strategy Action Evaluation Planning Selection &
Monitoring Intelligence
Analysis & -.355 Planning (.724)
Strategy 3.254*** 2.323** Selection (.002) (.025)
Action 2.098** 2.903*** 3.903 *** (.042) (.006) (.000)
Evaluation & .454 -.823 3.402*** 1.540 Monitoring {.652} {.415} {.001} {.131} Sig. (2-tailed) *** p < .01 ** p < .05 * p < . 10
Table 12 indicates that significant differences exist between the means of the
decision-making phases. The tests show that the population means of the phases differ
from each other. For example the table shows a significant difference between the
strategy selection phase and intelligence, action and evaluation and monitoring phases.
There is also significant difference between the action and the analysis and planning
phase.
83
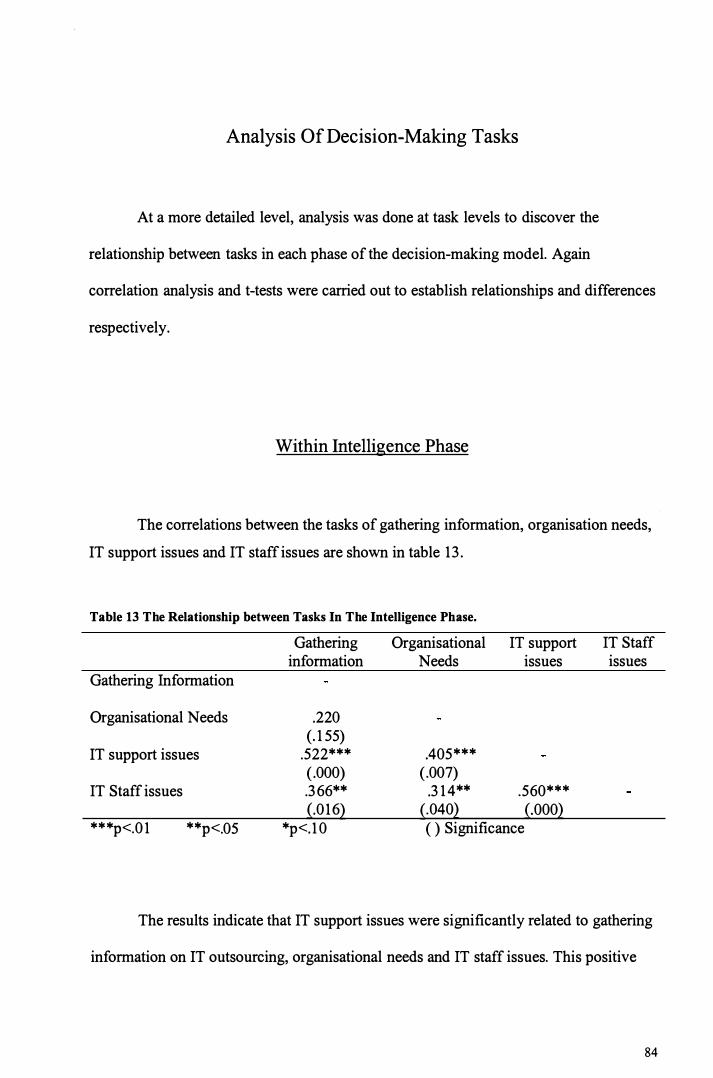
Analysis Of Decision-Making Tasks
At a more detailed level, analysis was done at task levels to discover the
relationship between tasks in each phase of the decision-making model. Again
correlation analysis and t-tests were carried out to establish relationships and differences
respectively.
Within Intelligence Phase
The correlations between the tasks of gathering information, organisation needs, IT support issues and IT staff issues are shown in table 13.
Table 13 The Relationship between Tasks In The Intelligence Phase.
Gathering Information
Organisational Needs
IT support issues
IT Staff issues
***p<.01 **p<.05
Gathering information
.220 (.155)
.522*** (.000) .366** (.016)
*p<.10
Organisational IT support Needs issues
.405*** (.007) .314** .560***
(.040) (.000) ( ) Significance
IT Staff issues
The results indicate that IT support issues were significantly related to gathering
information on IT outsourcing, organisational needs and IT staff issues. This positive
84
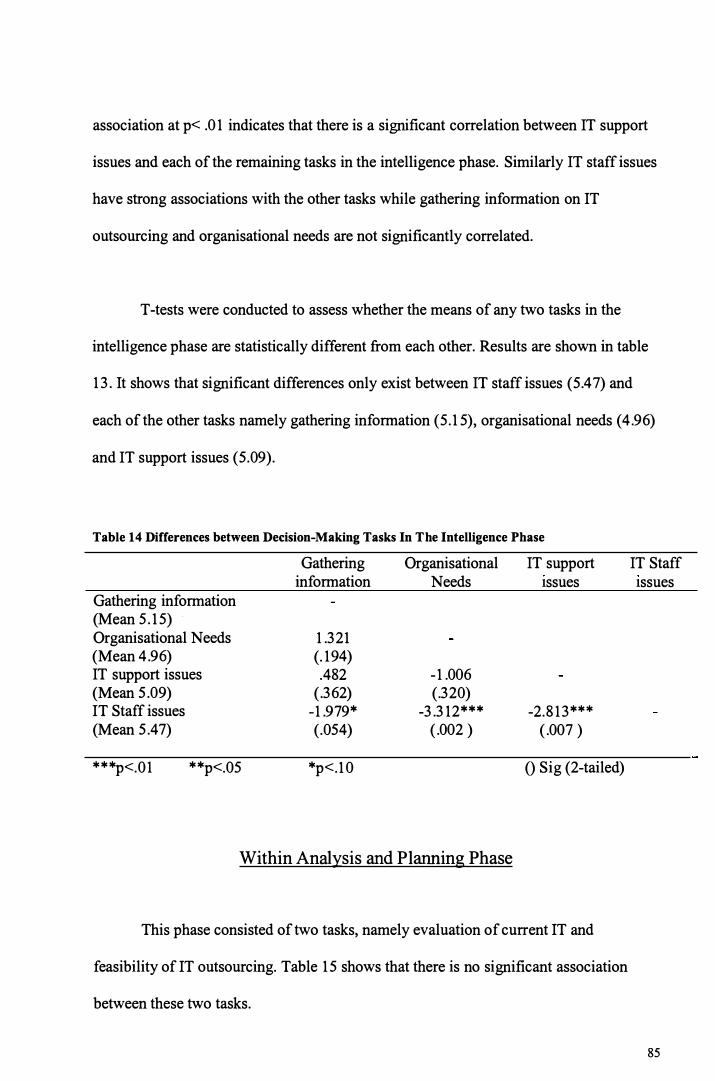
association at p< .01 indicates that there is a significant correlation between IT support
issues and each of the remaining tasks in the intelligence phase. Similarly IT staff issues
have strong associations with the other tasks while gathering information on IT
outsourcing and organisational needs are not significantly correlated.
T-tests were conducted to assess whether the means of any two tasks in the
intelligence phase are statistically different from each other. Results are shown in table
13. It shows that significant differences only exist between IT staff issues (5.47) and
each of the other tasks namely gathering information (5.15), organisational needs (4.96)
and IT support issues (5.09).
Table 14 Differences between Decision-Making Tasks In The Intelligence Phase
Gathering Organisational IT support information Needs Issues
Gathering information (Mean 5.15) Organisational Needs 1.321 (Mean 4.96) (.194) IT support issues .482 -1.006(Mean 5.09) (.362) (.320)IT Staff issues -1.979* -3.312*** -2.813***(Mean 5.47) (.054) (.002 ) (.007 )
***p<.01 **p<.05 *p<.10 () Sig (2-tailed)
Within Analysis and Planning Phase
This phase consisted of two tasks, namely evaluation of current IT and
feasibility of IT outsourcing. Table 15 shows that there is no significant association
between these two tasks.
IT Staff Issues
85

Table 15 The Relationship between Tasks In The Analysis and Planning Phase
Evaluation of current IT Feasibility of Outsourcing Evaluation of Current IT
Feasibility of Outsourcing
***p<.01 **p<.05
.230
.138 *p<. 10 ( ) Significance
A t-test was conducted to assess whether the two tasks were statistically
different from each other. Table 16 shows significant difference between evaluation of
current IT (5.65) and feasibility of outsourcing (4.76).
Table 16 Differences between The Tasks In The Analysis and Planning Phase
Evaluation of current IT Feasibility of Outsourcing Evaluation of Current IT (Mean 5.65)
Feasibility of Outsourcing (Mean 4.76) ***p<.01 **p<.05
5.349*** (.000)
*p<. 10
Within Strategy Selection Phase
() Sig (2-tailed)
The strategy selection phase contains one task and no analysis was conducted.
86

Within Action Phase
To establish the relationship between selecting the outsourcing vendor, and
determining the contract correlation was conducted. In table 17 the strong correlations
suggest that managing the contract is associated with selecting the vendor.
Table 17 The Relationship between Tasks In The Action Phase
Selection of The Vendor Determining The Contract Selection of the Vendor
Determining The Contract
***p<.01 **p<.05 *p<. 10
.700*** .000
( ) Significance
A t-test was conducted to assess whether the means of the two tasks in the action
phase are statistically different from each other. Table 18 shows significant difference
between selection of the vendor (5.69) and determining the contract (5. 14).
Table 18 Differences between The Tasks In The Action Phase
Selection of The Vendor Determining The Contract Selection of the vendor (Mean 5.69) Determining The Contract (Mean 5. 14) ***p<.01 **p<.05 *p<. 10
5.969*** (.000)
( ) Sig (2-tailed)
Within Evaluation and Monitoring Phase
The evaluation and monitoring phase contains one task and no analysis was
conducted.
87

C HAPTER SIX
ANALYSIS OF CASE STUDIES
To complement the empirical survey, outlined in the previous chapter, the
research used a multiple case study approach which, though exploratory, had the
objective of testing the decision-making model derived from the literature. Four cases
were analysed.
The cases were obtained from a list showing outsourcing projects in government
which was provided by a major outsourcing vendor in Perth. Cases were randomly
selected from the list and then approached for permission to interview. Those that
agreed to be interviewed are included in this thesis. The outsourcing vendors regarded
the cases as major IT/IS outsourcing activities in Perth, Western Australia. Information
was gathered through the process of interviews in which respondents were asked to rate
and discuss variables of the decision-making model using the questionnaire as outlined
in earlier chapters.
88
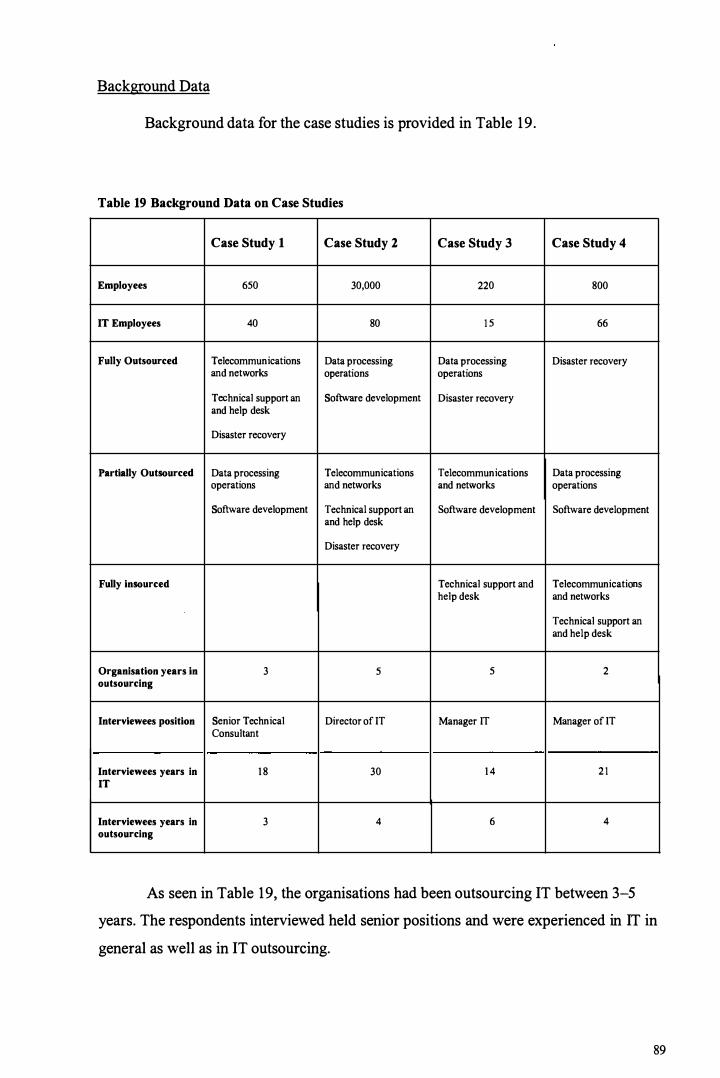
Background Data
Background data for the case studies is provided in Table 19.
Table 19 Background Data on Case Studies
Case Study 1 Case Study 2 Case Study 3 Case Study 4
Employees 650 30,000 220 800
IT Employees 40 80 1 5 66
Fully Outsourced Telecommunications Data processing Data processing Disaster recovery and networks operations operations
Technical support an Software development Disaster recovery and help desk
Disaster recovery
Partially Outsourced Data processing Telecommunications Telecommunications Data processing operations and networks and networks operations
Software development Technical support an Software development Software development and help desk
Disaster recovery
Fully insourced Technical support and Telecommunications help desk and networks
Technical support an and help desk
Organisation years in 3 5 5 2
outsourcing
Interviewees position Senior Technical Director of IT Manager IT Manager of IT Consultant
Interviewees years in 18 30 14 2 1
IT
Interviewees years in 3 4 6 4
outsourcing
As seen in Table 19, the organisations had been outsourcing IT between 3-5 years. The respondents interviewed held senior positions and were experienced in IT in general as well as in IT outsourcing.
89

Case Study 1
This organisation was of medium size and had either fully or partially
outsourced its IT/IS activities. Their responses are summarised in table 20.
Table 20 Responses for Case Study 1
Decision Phase Rated High ( 617) Rated Medium (3/4/5) Rated Low ( 1/2)
Intelligence
Gather Information Experience bv others Study phenomenon Advice from consultants
Organisational Needs IT costs Productivity; Competitive Re-engineering; Quality advantage of service; Emerging
techno-logies; IT architec-ture; Managernent information
IT Support Processing changes; Lead Responsiveness; User Times support; Flexibility of
data and reports
IT Staffing Quality; Competence; Responsiveness Effort; Relationship with users
Analysis and Planning
Current IT Objectives; Costs; Effectiveness and efficiency; Problems; Mix of in/ outsourcing
Outsourcing Feasibility Managing vendor; Meet IT too critical; Cost IT service improvements; service goals; IT cost savings difficult to Freeing up staff savings demonstrate
Strategy Selection
Loss of control; IT expertise; IT risk IT as core business; Level Flexibility; Reduce IT management of IT service costs
Action
Select Vendor Track record; Support talent; Reasonable price; Financial stability; Negotiate performance; Meetin_g specific criteria
Manage Contract Business require-ments; Determine services; Negotiate price Service levels; Ability to Duration of contract; with-draw from contract Contract extension
Evaluation and Monitoring
Acceptable level of Deliver cost savings; Turn IT employees into service; Meet organi- Improved services consultants sational objectives; Deal /products; Meet senior with redundant staff managements' obiectives
90
Intelligence Phase
Intelligence on IT outsourcing is best obtained by learning from the experience
of other organisations, followed closely by a formal study of the phenomenon itself.
Advice from IT consultants was not highly valued. The greatest organisational need was
to reduce IT costs; outsourcing was expected to save 25% but doubt was expressed
whether this was actually achieved.
Speedy processing of requests for changes was seen as extremely important
when considering IT outsourcing. The view was held that outsourcing companies would
introduce more stringent change procedures thereby reducing risks and costs. Higher
standards would enable the organisation to better match planned with actual
expenditure. However the flexibility in responding to system change requests would
reduce under outsourcing.
IT staffing was considered a complex issue. On outsourcing, IT staff are either
transferred to the vendor or are retrenched. This has resulted in the current situation
where an outsourcing contract was about four weeks away and already staff were
leaving for other jobs. The interviewee commented that it was not within his authority
to pay big incentives to keep staff for the remaining short period, "it is much more a
management challenge to keep people."
91
Analysis and Planning Phase
It was suggested that an independent assessment be made of the level of service
the current IT is providing so that this level can be maintained and improved through
outsourcing, where possible service levels should be benchmarked and/or
independently assessed. The focus should be on outcome and not so much on process.
The organisation was not interested in how the vendor provides the service but in the
service that is delivered.
The organisation did not have a great say in determining the feasibility of
outsourcing since it was part of a consortium of four large organisations that had
outsourced IT. However, they were able to modify the contract to suit their
requirements and placed particular emphasis on the need to maintain service levels and
achieve IT cost savings. Interestingly, their experience was that they had to maintain
their own IT staff for about a year while the outsourcing organisation "got its act
together."
Strategy Selection Phase
Three issues had a strong impact on whether or not the outsourcing strategy
should be selected. First was the potential loss of control over IT functions in future.
"That's a really big issue. I don't think that anyone has really resolved that. It's almost
92
like you will know in hindsight whether you have been right or wrong." Second, IT
outsourcing promises greater flexibility in providing IT services but this was difficult to
achieve or establish. For the above reasons, in-house IT staff are kept at a level of
around 65% of requirements and 35% are kept on contract.
The third issue was one of cost saving which is acknowledged to be complex
and not well understood by many in the public service. Management appears to be
easily lured into outsourcing with the promise of substantial cost savings, but in some
cases this appears not to have been achieved. Nevertheless, while some members may
end up paying more for their IT functions, the objective was to achieve an overall
saving for the consortium.
Action Phase
When deciding on an outsourcing vendor, a comprehensive set of factors was
taken into account. These included track record, contract price, financial stability,
flexibility in negotiation, and the ability to take on critical systems. It was observed that
vendors don't necessarily have a sound organisation since they often have a new
management structure, take on a lot of new staff, and don't necessarily have a great
depth of talent.
The ability to withdraw from the contract was deemed very important. This may
be due to a number of reasons. The agency makes a great effort to determine its
93

business requirements prior to outsourcing and to include these in the tender document.
Vendors are given the opportunity to discuss these requirements and provided ample
time and opportunity to respond to the tender. However, disappointment was expressed
with the lack of responses shown by potential outsourcing vendors.
The organisation used a five year contract which they regarded as a fair
compromise between the three years wanted by the vendor and the seven years they
sought. A shorter contract is more expensive because of the greater risk to the vendor.
Once the contract expires, it is virtually impossible to get an automatic contract
extension because of the existing policy to go to tender for all businesses.
Evaluation and Monitoring Phase
An acceptable level of service was regarded as the most important factor for
evaluating the successful outcome of IT outsourcing. This was followed by aligning IT
objectives with organisational ones and dealing with redundant staff. However, as far as
the latter was concerned, little value was placed on establishing new career
opportunities for IT staff by turning them into internal or external contractors.
Case Study 2
This was the largest of the case studies in terms of number of employees. They
also had much experience with outsourcing. For example, the organization had been
outsourcing for 5 years and the IT director had 30 years experience in IT and 4 years
experience with IT outsourcing. Responses are summarised in table 21
94

Table 21 Responses for Case Study 2
Decision Phase Rated High ( 6/7) Rated Medium (3/4/5) Rated Low (1 /2) Intelligence
Gather Information Advice from Study phenomenon; consultants Experience by others
Organisational Needs Emerging technologies; Productivity; Compe-IT architecture titive advantage; Re-
engineering; Quality of service; Manage-ment information; IT costs
IT Support Processing changes; Lead times; Flexibility Responsiveness; User of data and reports sunnort;
IT Staffing Responsiveness; Responsiveness; Effort Quality; Competence; Relationship with users
Analysis and Planning
Current IT Costs; Problems; Mix Objectives; of in/outsourcing Effectiveness and
efficiency Outsourcing Feasibility Costs savings difficult IT too critical; Cost IT service improve-
to demonstrate; savings difficult to ments; Freeing up Managing vendor; demonstrate inhouse staff Meet service goals; IT cost savings
Strategy Selection
Loss of control; IT expertise; IT risk IT as core business; Flexibility; Reduce IT management Level of IT service costs
Action
Select vendor Track record; Sup-port talent; Rea-sonable price; Financial stability; Negotiate perfor-mance; Meeting specific criteria
Manage contract Negotiate price; Ability to withdraw Business require- from contract; Duration ments; Determine of contract; Contract services; Service extension levels
Evaluation and Monitoring
Acceptable level of Deliver cost savings; service; Improved Meet organisational service /products; Meet objectives; Deal with senior managements' redundant staff; Turn objectives IT employees into
consultants
95

Intelligence Phase
Information about IT outsourcing provided by consultants was regarded as most
relevant in this phase for the reason that "they come and market their services to you."
Leaming from other companies and using information sources were also judged as
highly important.
The organisation believed its IT needs to be largely in two areas - keeping up
with emerging technologies and the creation of an IT architecture. The process of
outsourcing helped the organisation to make some hard decisions as far as its future IT
facilities were concerned and provided them with sources of expertise not available
internally. Furthermore, the outsourcing of operational services freed-up management
and IT staff to think about issues such as re-engineering business processes and aligning
IT and organisational objectives.
Initially cost savings were regarded as important but this became a difficult area
to monitor. First, the organisation did not know their IT costs very well and found
hidden costs. This made the case for cost reduction very difficult if not impossible to
prepare. Second, and more important than reducing costs, was getting better quality
services and improving productivity.
IT support issues were regarded as important when considering outsourcing but
perceived to be of an operational rather than a strategic nature. To provide good support
requires excellence in IT personnel. Characteristics such as responsiveness, quality and
96

competence, and the user relationship needed to "be right" to ensure high levels of IT
support.
Analysis and Planning Phase
While it was acknowledged that current IT costs should be quantified prior to
outsourcing, this may not always be achieved as explained above. An alternative view
was offered, namely that "the core thing is not where you are but where you want to
be". Therefore, not much time should be spent on identifying current IT problems and
establishing current IT effectiveness and efficiency. A more important expectation was
that IT outsourcing should lead to improved services.
Many factors were recognised as determining the feasibility of IT outsourcing.
Among those highlighted were cost savings, outsourcing vendors meeting service goals,
improvements in IT services, and IT skills. The organisation had experienced difficulty
in retaining IT skills and believed that employees should be utilised to improve business
processes rather than to maintain operational systems. The latter should therefore
become a prime candidate for outsourcing.
97

Strategy Selection Phase
The factors that determined the IT outsourcing strategy (full, partial, in-house)
were varied and included IT expertise, potential loss of control, IT service levels, IT risk
management, and flexibility in providing IT services. No firm opinion was held on
whether or not IT was a core business function. A reduction in costs for IT was not
considered very relevant to the decision whether to outsource or insource.
Action Phase
When selecting the outsourcing vendor all criteria presented were regarded as
important. These included the vendor's track record, support talent, contract price,
financial stability, ability to negotiate performance levels, and meeting specific
performance criteria. With respect to the contract to be managed, the negotiation of a
reasonable price was seen as important since ''we are talking about big contracts here."
Determining business requirements and having them met by the outsourcing vendor was
vital including the ability to renegotiate the requirements during the period of the
contract. The period for IT outsourcing contracts was usually 3 - 5 years with the
possibility of an extension. The philosophy appeared to be one of entering into a
contract that suited both the client and the vendor.
98
Evaluation and Monitoring Phase
Emphasis was placed on having management evaluate and monitor the outcomes
of IT outsourcing because it was management that interacted with the service providers.
Even if the underlings were committed to outsourcing it would not work without
management's commitment. Staffing issues associated with IT outsourcing required
particular attention in order to maintain morale and productivity. To avoid the problem
of redundant staff it was suggested that they be turned into contractors.
Case Study 3
This case was the smallest of the organisations and had outsourced fully or
partially its IT/IS activities except technical support and the help desk. The organisation
and interviewee had extensive experience with IT/IS outsourcing. Responses are
summarised in table 22.
99

Table 22 Responses for Case Study 3
Decision Phase Rated Hi�h (6/7) Rated Medium (3/4/5) Rated Low (1/2)
Intelligence
Gather Information Study phenomenon; Advice from consultants Experience by others
Organisational Needs Reengineering; Quality Productivity; IT costs; of service; Competitive Emerging technologies; advantage IT architecture;
Management information
IT Support Responsiveness Processing changes; Lead Times; User support; Flexibility of data and reports
IT Staffing Responsiveness; Quality; Competence; Effort; Relationship with users
Analysis and Planning
Current IT Objectives; Costs; Effectiveness and efficiency; Problems; Mix of in/outsourcing
Outsourcing Feasibility Managing vendor; Meet Cost savings difficult to IT too critical service goals; Free up demonstrate; IT cost staff savings; IT service
improvements; In-house Skills
Strategy Selection
IT as core business; IT Loss of control; Level of expertise; IT risk IT service; Reduce IT management; Flexibility costs
Action
Select Vendor Track record; Sup-port Reasonable price; talent; Financial Meeting specific criteria stability; Negotiate performance
Manage Contract Business requirements; Negotiate price; Ability Determine services; to withdraw from Service levels; Duration contract of contract; Contract extension
Evaluation and Monitoring
Acceptable level of Deliver cost savings; service; Meet organi- Improved services/ sational objectives; Meet products; senior managements' objectives; Deal with redundant staff; Tum IT employees into consultants
100

Intelligence Phase
It was believed that familiarity about the IT outsourcing phenomenon is best
obtained through a study of experiences gained by other organisations. Those firms that
have been successful in IT outsourcing should provide role models for the organisation
to follow. Outsourcing contractors were perceived to have a limited view of
outsourcing, which needed verification.
Organisational needs and circumstances for this organisation were alignment of
IT with organisation strategy, improvement in services and products, and developing
competitive advantages. The strategy of using outsourcing for cost reduction was not
extensively considered; by using IT to become more competitive and achieving
organisational objectives, other benefits, such as cost savings and productivity
improvements, would be gained automatically.
The item rated highest in importance for IT support issues was responsiveness to
user needs. The view was held that IT had not been good in this area in the past. It was
suggested that IT outsourcing could yield significant improvements in respect of IT
staffing. Benefits would arise in the form of greater choice, better trained and more
technically up-to-date people, and reduced costs of training and turnover.
101

Analysis and Planning Phase
The strong opinion was held that current IT should be thoroughly evaluated as
part of the decision to outsource. To look at outsourcing to solve a problem was rejected
because "You can't outsource a problem." Furthermore, it was necessary to understand
current IT fully to be able to measure returns that may arise from outsourcing and to
prevent unnecessary infighting with the vendor if expectations were at unreasonable
levels.
Three issues influenced IT outsourcing feasibility. They were managing the
vendor, meeting service goals, and freeing-up internal staff. The organisation should
aim to have a good relationship with the vendor, keep service levels at least the same,
and use staff in strategic roles rather than for "mundane support operations." Cost
savings were not much relevant in considering the outsourcing option.
Strategy Selection Phase
The extent of outsourcing was largely influenced by the belief that IT is a core
business. Since "our life blood is information" the service provided by IT was an
important consideration and the organisation should not lose control over the IT
function even when it was outsourced. IT outsourcing was seen as reducing risk in
respect of people expertise when this is absent or expensive to acquire and retain
102
In-house. Rather than reducing costs, IT outsourcing was seen as providing flexibility in
the provision of IT services.
Action Phase
The financial stability of the vendor was considered as the most important
decision criteria. IT outsourcing was perceived to be of high cost and assurance was
needed that the vendor remain in business for some time. Other important criteria
included the ability to negotiate performance measurements ("you need to be able to
measure what they are trying to deliver"), and the vendor's ability to meet organisation
specific requirements.
For the outsourcing contract three key elements had to be considered. They were
the ability to determine business requirements, types of services, and service levels.
Without clear specifications in these areas, disputes would inevitably arise over time.
Price considerations and the ability to withdraw from the contract were of lesser
concern. However, the contract should not be open-ended and preferably have the
option of extension should the outsourcing arrangement have worked well.
103
Evaluation and Monitoring Phase
The overriding measure of IT outsourcing success was the provision of an
acceptable level of service. In addition, meeting organisational objectives and
management needs provided assurance that the organisation was heading in the right
direction. As far as IT staff were concerned, this issue should be handled very delicately
and carefully. Staff should be kept informed of developments and decision made
should be in their best interest.
Case Study 4
This organisation was of a medium size and had either fully or partially
outsourced its IT/IS activities except telecommunications, networks, technical support
and the help desk. Experience with outsourcing for the organisation was a moderate two
years but longer for the person interviewed.
104
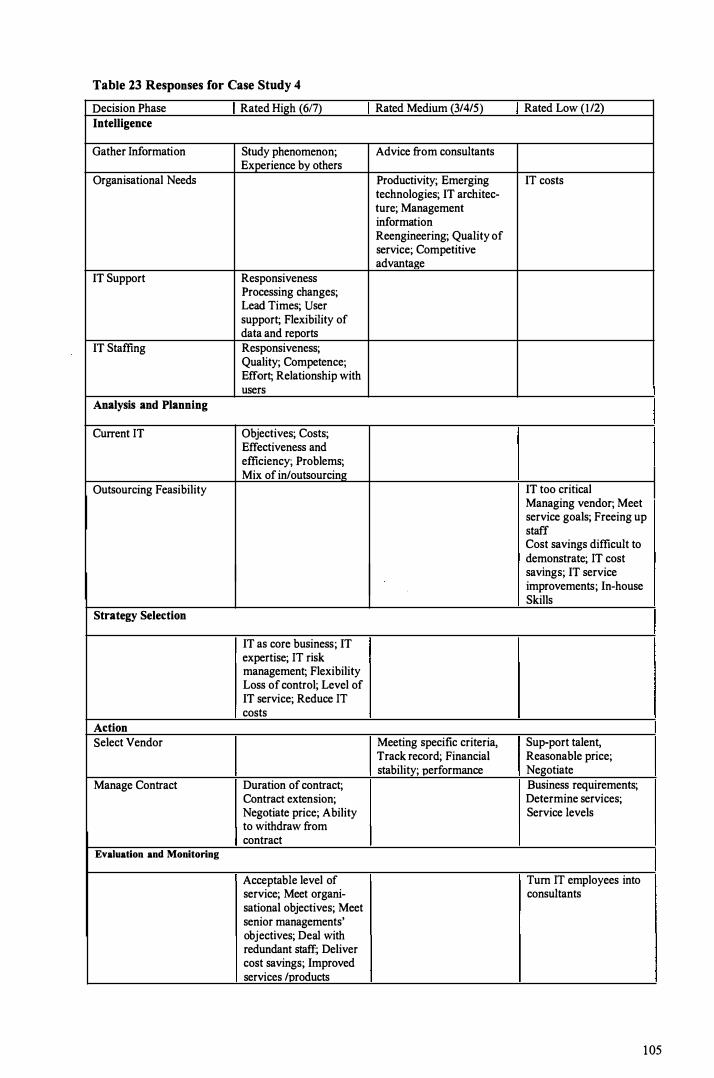
Table 23 Responses for Case Study 4
Decision Phase Rated High (617) Rated Medium (3/4/5) Rated Low (1/2)
Intelligence
Gather Information Study phenomenon; Advice from consultants Experience bv others
Organisational Needs Productivity; Emerging IT costs technologies; IT architec-ture; Management information Reengineering; Quality of service; Competitive advantage
IT Support Responsiveness Processing changes; Lead Times; User support; Flexibility of data and reports
IT Staffing Responsiveness; Quality; Competence; Effort; Relationship with users
Analysis and Planning
Current IT Objectives; Costs; Effectiveness and efficiency; Problems; Mix of in/outsourcing
Outsourcing Feasibility IT too critical Managing vendor; Meet service goals; Freeing up staff Cost savings difficult to demonstrate; IT cost savings; IT service improvements; In-house Skills
Strategy Selection
IT as core business; IT expertise; IT risk management; Flexibility Loss of control; Level of IT service; Reduce IT costs
ActionSelect Vendor Meeting specific criteria, Sup-port talent,
Track record; Financial Reasonable price; stability; performance Negotiate
Manage Contract Duration of contract; Business requirements; Contract extension; Determine services; Negotiate price; Ability Service levels to withdraw from contract
Evaluation and Monitoring
Acceptable level of Turn IT employees into service; Meet organi- consultants sational objectives; Meet senior managements' objectives; Deal with redundant staff; Deliver cost savings; Improved services /products
105

Intelligence Phase
Knowledge about the IT outsourcing is best gained from the study of the IT
outsourcing phenomenon and learning from the experiences of other companies. Advice
from IT outsourcing consultants was regarded as important.
Organisational needs for this organisation were seen in the alignment of IT with
organisation strategy, the use of IT to improve quality of services and quality of
management information, keeping up with emerging technologies and developing
competitive advantages.
The use of IT to improve productivity was not rated as highly important.
Reducing IT cost was rated the lowest believing that outsourcing does not reduce IT
costs. The organisation believed that reducing costs can be achieved through clear
understanding of its IT strategy and being �lear about what you do and what you do not
do.
One clear point was made that if the IT department can achieve its goals and
objectives, outsourcing should not take place.
Processing of requests for changes to systems, IT's responsiveness to changing
user needs and flexibility of data and reports from systems were rated of highest
importance for IT support issues. These issues are followed by lead-time required for
implementing new systems, and support for users in preparing system proposals.
106

It was indicated that outsourcing could add value to IT staff issues. For instance,
it would improve the responsiveness oflT personnel to user needs and the relationship
between them. It would also keep IT personnel up to date.
Analysis and Planning Phase
It was strongly recommended that the objectives oflT in the organisation should
be reviewed and all the costs quantified. Also IT problems being experienced should be
identified. The correct mix oflT insourcing and outsourcing should be achieved
according to the organisation needs.
The IT outsourcing was not influenced by outsourcing a critical IT function to a
third party, believing that in general in outsourcing companies that executives tend not
to have awareness of how reliant they are on IT. Management also is not aware or do
not think that the IT function is critical. Therefore, they are satisfied.
Cost saving difficult to demonstrate, was not an important issue to the
organisation because a lot of the justifications were emotional except where a political
decision to outsource had been made. In this case the decisions were interesting and
very creative.
Managing the outsourcing vendor was another unimportant issue, because
management go into outsourcing without really thinking what they are going to do.
107
With regard to outsourcing vendors being able to meet service goals, cost saving
in IT personnel and IT service improvements, these issues also did not have an impact
on or influence the feasibility oflT outsourcing.
In this particular organisation, it was indicated that executives do not think that
IT staff are particularly skilled therefore there is no point in freeing up IT staff for
strategic functions.
On one hand the IT manager of the organisation is against fully outsourcing or
fully insourcing, but supports partial outsourcing, believing that what is economical for
the organisation should be done in-house and what is not economical should be
outsourced.
It was indicated during the interview that recent research showed that five to six
years ago it was the fashion to outsource everything and it did not work in a lot of cases
culminating in bad experiences. Now that people have more experience in outsourcing it
seems a conventional wisdom to outsource particular parts oflT and it is seen as such
an obvious way to go.
108

Strategy Selection Phase
Seven factors determined the extent of the IT outsourcing strategy chosen.
Firstly was the belief that no one thinks that IT is a core part of the business in the
organisation therefore there is a tendency to outsource fully. Secondly people who
made the decision are those who refused to have a PC on their desk. So they do not have
any idea what services are expected.
Thirdly executives think that outsourcing provides a better management of IT
risks and do not realise the real risk of having a third party managing IT. The IT
manager believed that there is a risk involved in getting a third party to manage the IT
department. One of the risks is that the vendor does not worry much about what the
organisation goes through. In the meantime management think that IT is much better
managed.
The remaining factors that determined the extent of IT outsourcing strategy were
that the IT functions requires expertise, potential loss of control over the IT function,
perceived flexibility in providing IT services and reduced cost of lT function.
Action Phase
The factors of greatest importance when selecting the IT outsourcing vendor
were a good track record by the vendor, financial stability of the vendor and the ability
109
to satisfy organisation specific criteria. With regard to reasonable price for the service
agreed, it was indicated that the organisation does not know what it cost to do the job
therefore it is difficult to know what is a reasonable price.
With regard to negotiating performance measurements, it is believed that there
are no performance measurements and no one in the organisation mentioned this need
until something goes wrong.
The ability to negotiate the price was deemed as very important. A lack of
ability to determine business requirements up front was expressed. Management did
understand or know the service that should be provided by the vendor. Another
drawback was service level. It was indicated that the contract was signed before
negotiating service levels, a process that should be reversed. The ability to withdraw
from the contract, determine its duration and to extend it issues were important. It
sounded like having the last three issues would make management feel secure with not
having to continue the contract period if what is agreed upon was not delivered.
Evaluation and Monitoring Phase
Five factors were considered extremely important in evaluating the successful
outcome oflT outsourcing. First an acceptable level of service and cost saving being
met, results in improved quality of services/products, the ability to deal with redundant
staff, objectives meeting senior management's need and objectives being consistent
with organisational objectives. Outsourcing can not turn IT employees into internal or
external contractors.
1 10

CHAPTER SEVEN
DISCUSSION OF FINDINGS
The cluster analysis (Figure 7 in chapter 5) carried out showed that participants
in the survey were a fairly homogenous group when expressing their opinions on the
importance of phases and tasks that should be carried out during the outsourcing of lT.
This provided an indication of agreement among the respondents for the data they
provided. In this chapter their responses will be discussed further. The chapter is
structured as follows. First, the importance of decision-making phases and tasks are
outlined. The relationships between and within phases and tasks are discussed. Finally,
arising from the key findings of the study, a conceptual model of IT outsourcing
decision-making that accentuates the key decision-making phases and tasks will be
provided.
Importance Of Phases And Tasks
Data to establish the importance of decision-making phases and tasks was
-obtained through the conduct of a survey (Chapter 5) and case studies (Chapter 6). The
participants in the survey (which included the case studies) represent a wide variety of
industries. The majority of organisations, about 30 percent, were in government. This
was followed by two other major groups namely manufacturing (18.27) and finance,
insurance and business services (11.47). Organisations were large in terms of number of
employees (mean of 5,490 employees) and employed around 189 IT employees. The
111
organisations had been outsourcing IT between less than one year and fifteen years with
average of 3.37 years. Participants were highly experienced in IT in general as well as
in IT outsourcing and held senior positions.
While statistical analysis was applied to the survey data, more interpretative
approaches were applied against the case material collected. These included the
following techniques (see Miles & Huberman 1994 in Fisher & Amott, 1998):
• Patterns and themes: these terms are self-explanatory and are discovered by the
researcher through interpretation of the data collected.
• Clustering: this is described as grouping of ideas or comments that are similar.
• Plausibility: looking at the data from different angles so that the researcher may see
patterns that suggest the conclusions are plausible, make sense or "fit" the study.
• Counting: when identifying a theme or a pattern, things that happen a number of
times and things that consistently happen in a specific way.
Intelligence Phase
During this first phase of decision-making, the organisation attempts to prepare
and build an information platform for the evaluation of later phases. Information is
112

essentially collected for four major tasks within which a number of subtasks are
contained. The tasks are establishing the organisation's needs and circumstances for IT
outsourcing, the current status of the IT function and IT staffing, and gathering
information about the IT outsourcing phenomenon. The responses as to the importance
of these activities are summarised in Table 24 below. It shows the means obtained in the
survey (see Chapter 5) and the types of responses provided in the case studies (see
Chapter 6).
Table 24 Responses for The Intelligence Phase
Mean Casel Case2 Case3 The outsourcing phenomenon 5 . 15 Study the IT outsourcing phenomenon 4.95 Medium Medium High Learn about the experiences of other companies 5 .86 High Medium High Gain advice from IT outsourcing consultant 4.65 Low Medium Medium
The organisation's needs and circumstances 4.96 Use of IT to improve productivity 5 .40 Medium Medium Medium Reengineering ofIT to align with organisation 5 .44 High High Medium Strategy Low Medium High Use IT to improve quality of services/products 5 .26 Low Medium High Need to reduce IT costs 4.67 High Medium Low Use IT to develop competitive advantages 5 .07 Medium Medium High Need to keep up with emerging technologies 4.56 Low Medium Medium Creation of an IT architecture 4.40 Low High Low Use of IT to improve quality of management 4.91 Low High Medium
The status of the IT functions 5.09 Processing of requests for changes to systems 5 .26 High High Medium Lead time required for implementing new systems 5 .16 High High Medium IT's responsiveness to changing user needs 5 .67 Medium High High Support for users in preparing system proposals 4.67 Medium High Low Flexibility of data and reports from systems 4.70 Medium Medium Low
The IT staff quality 5 .47 Responsiveness of IT personnel to user needs 5 .60 High High High Quality and competence of IT personnel 5 .77 High High High Technical competence of the IT personnel 5.58 High High High Effort extended by IT personnel to create new systems 4.90 High Medium High Relationship of IT personnel with users 5.50 High High High
The first task is gathering information on IT outsourcing. The mean rating of
one of its subtasks, namely learning about the experiences of other companies, was a
1 13
Case4
High High Medium
Low Medium Medium Medium Low Medium Medium Medium Medium
High High High High High
High High High High High

high 5.86 and was regarded as highly important by three cases and of medium
importance by one case. Positive comments were made by the cases, for instance case 3
regarded the task of studying other organisations and their experiences with outsourcing
whether it had been successful or not as mandatory.
For the second task, organisational needs and circumstances, ratings varied from
high to low. An important underlying pattern was re-engineering of IT to align with
organisation strategy (5.44), regarded as important by all cases except case 1. With
regard to case 1, management believed that the organisation is quite advanced in the use
of technologies, and IT strategy is already aligned with the organisation strategy. A
positive comment was made by case 3 that this variable is very important and if
outsourcing does not allow it, then outsourcing will fail. The use of IT to improve
productivity (5.40) was regarded as important in all cases except case 4. This was
followed by the use of IT to improve the quality of services and products (5.26). The
importance of this variable was particularly emphasised by case 3.
The third task is the status of the IT function in terms of support. The subtasks
that stood out were and IT's responsiveness to user needs (5.67) and processing requests
for changes to systems ( 5.26). The comment was made by case 3 that one of the areas
that IT has not done very well over the years is to be responsive to user needs. It was
indicated that IT has a problem in dealing with changing user needs and developing
flexible systems. Outsourcing, from the users' perspectives, can make systems appear
more flexible and responsive to their needs.
1 14

The fourth task in the intelligence phase is considering current IT staff quality. It
was ranked highest (5.47) among all four and was followed by gathering information on
IT outsourcing ( 5 . 15), status of IT functions ( 5 .09) and considering the organisation's
needs and circumstances (4.96). All variables in this task were regarded as highly
important by the case studies, thereby indicating an agreement on the importance of this
task. Quality of IT staff issues was largely determined by the quality and competence of
personnel (5.77), particularly their technical competence (5.58). Case 3 commented that
it is just a fact of life that it is hard to keep people in a permanent employment situation
where the core business is not IT or where IT is not up-to-date. Outsourcing firms may
have better strategies in place to keep their people up-to-date in IT.
Analysis and Planning Phase
In this decision-making phase, the current IT activities are analysed in such terms as
efficiency and effectiveness and the feasiblity of the outsourcing option is determined. The
responses obtained in the study are shown in Table 25.
115
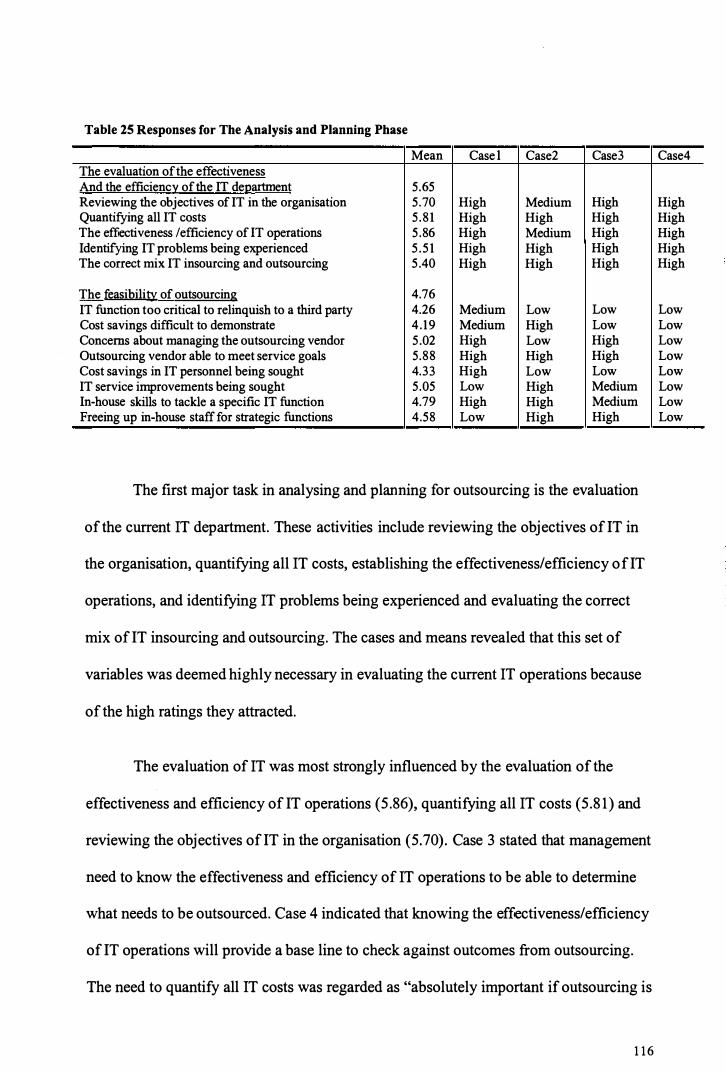
Table 25 Responses for The Analysis and Planning Phase
Mean Case l Case2 Case3 The evaluation of the effectiveness And the efficiency of the IT de12artment 5.65 Reviewing the objectives of IT in the organisation 5.70 High Medium High Quantifying all IT costs 5 .81 High High High The effectiveness /efficiency of lT operations 5 .86 High Medium High Identifying IT problems being experienced 5 .5 1 High High High The correct mix IT insourcing and outsourcing 5 .40 High High High
The feasibility of outsourcing 4.76 IT function too critical to relinquish to a third party 4.26 Medium Low Low Cost savings difficult to demonstrate 4 .19 Medium High Low Concerns about managing the outsourcing vendor 5 .02 High Low High Outsourcing vendor able to meet service goals 5.88 High High High Cost savings in IT personnel being sought 4.33 High Low Low IT service improvements being sought 5.05 Low High Medium In-house skills to tackle a specific IT function 4.79 High High Medium Freeing up in-house staff for strategic functions 4.58 Low High High
The first major task in analysing and planning for outsourcing is the evaluation
of the current IT department. These activities include reviewing the objectives oflT in
the organisation, quantifying all IT costs, establishing the effectiveness/efficiency oflT
operations, and identifying IT problems being experienced and evaluating the correct
mix oflT insourcing and outsourcing. The cases and means revealed that this set of
variables was deemed highly necessary in evaluating the current IT operations because
of the high ratings they attracted.
The evaluation of IT was most strongly influenced by the evaluation of the
effectiveness and efficiency of lT operations (5.86), quantifying all IT costs (5.81) and
reviewing the objectives oflT in the organisation (5.70). Case 3 stated that management
need to know the effectiveness and efficiency of IT operations to be able to determine
what needs to be outsourced. Case 4 indicated that knowing the effectiveness/efficiency
oflT operations will provide a base line to check against outcomes from outsourcing.
The need to quantify all IT costs was regarded as "absolutely important if outsourcing is
116
Case4
High High High High High
Low Low Low Low Low Low Low Low
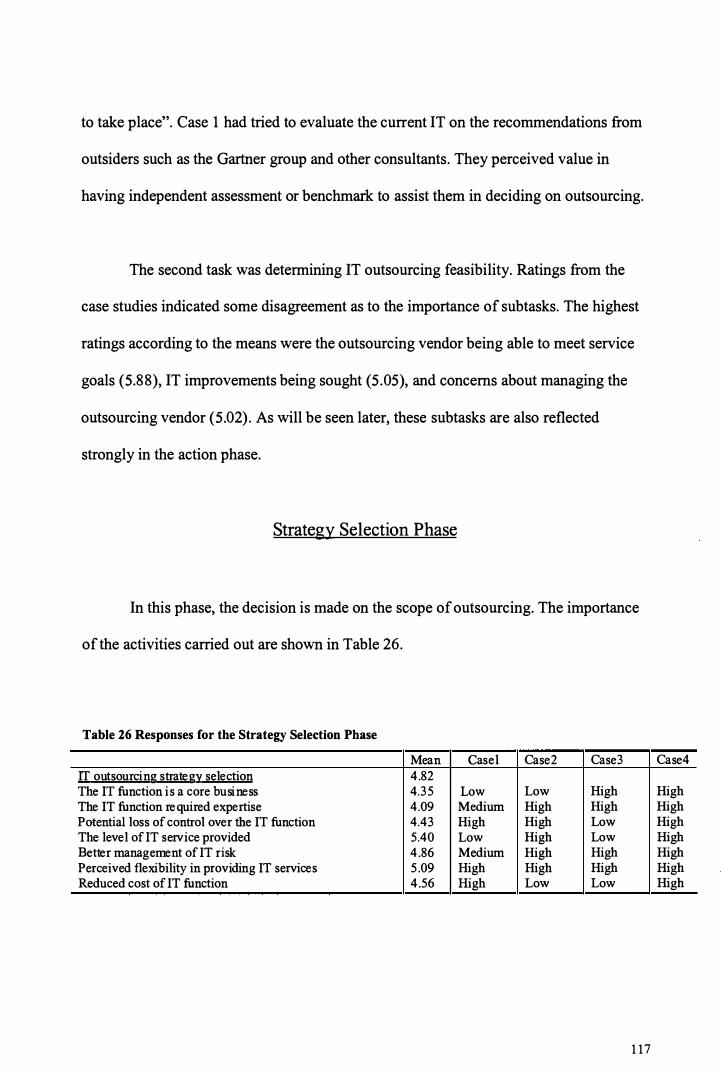
to take place". Case 1 had tried to evaluate the current IT on the recommendations from
outsiders such as the Gartner group and other consultants. They perceived value in
having independent assessment or benchmark to assist them in deciding on outsourcing.
The second task was determining IT outsourcing feasibility. Ratings from the
case studies indicated some disagreement as to the importance of subtasks. The highest
ratings according to the means were the outsourcing vendor being able to meet service
goals (5.88), IT improvements being sought (5.05), and concerns about managing the
outsourcing vendor (5.02). As will be seen later, these subtasks are also reflected
strongly in the action phase.
Strategy Selection Phase
In this phase, the decision is made on the scope of outsourcing. The importance
of the activities carried out are shown in Table 26.
Table 26 Responses for the Strategy Selection Phase
Mean easel Case2 Case3 IT outsourcing strategy selection 4.82 The IT function is a core business 4.35 Low Low High The IT function required exper tise 4.09 Medium High High Potential loss of control over the IT function 4.43 High High Low The level of IT s ervice provided 5.40 Low High Low Better management of IT risk 4.86 Medium High High Perceived flexibility in providing IT services 5.09 High High High Reduced cos t of IT function 4.56 High Low Low
1 17
Case4
High High High High High High High

In all the cases the preferred strategy was partial outsourcing. With regard to the
factors that determine the IT outsourcing strategy, cases 2, 3 and 4 showed that three
factors, namely the IT function requires expertise, better management of IT risks and
perceived flexibility in providing IT services, have a strong impact on the IT
outsourcing strategy selected. Cases 1 and 4 indicated a relationship between reduced
cost of IT function and the type of strategy selected. It was surprising that the
perception that the IT function is a core business factor had the lowest impact in
determining the IT outsourcing strategy for cases 1 and 2. However the potential loss of
control over the IT function was regarded as a highly important factor in determining
the strategy selection in cases 1, 2 and 4.
Action Phase
Once it has been decided to outsource the IT function, the organisation takes
action in two major ways, namely selecting the outsourcing vendor and negotiating the
outsourcing contract. Responses as to the importance of these tasks are shown in Table
27.
1 1 8

Table 27 Responses for The Action Phase
Mean easel Case2 Case3 Selection of IT outsourcing vendor 5.69 A good track record by the vendor 5 .92 High High High Appropriate talent to support the organisation 5 .76 High High High Reasonable price for the service agreed 5 .42 High High High Financial stability of the vendor 5 .66 High High Medium Ability to negotiate performance measurements 5 .69 High High High Satisfying organisation specific criteria 5 .66 High High Medium
Determining IT outsourcing contract 5 . 14 Ability to negotiate the price 5 . 1 1 Low High Low Determining business requirements up front 5 .35 High High High Determining services to be provided 5 .71 Medium High High Negotiating service levels 5.61 High High High Ability to withdraw from the contract 4.80 High High Low Determining the duration of the contract 4.7 1 Medium High Medium Possibility of extending the contract 4.73 Low Medium High
The criteria for selecting the outsourcing vendor were all highly rated with
mean responses ranging from 5.42 to 5.92 and a high level of agreement among the case
study subjects. The requirement for a good track record by the vendor was rated the
highest (5.92). A comment was made by case 1 that "good track record provides the
most appropriate support for the organisation" followed closely by appropriate vendor
talent to support the organisation (5.76). This was supported by case 3 stating that it is
very important to have the skills in the area where outsourcing is taking place.
For the task of determining the outsourcing contract, the responses to the
decision criteria showed a greater variation and ranged from 4.71 to 5.71. Responses
indicated that determining services to be provided (5.71) and negotiating service levels
(5.61) and determining business requirements up front were regarded most important.
Case 3 considered the last three elements as the key to any contract concerning
outsourcing. If services to be the delivered can not be determined it will be very hard to
1 19
Case4
Medium Low Low Medium Low Medium
High Low Low Low High High High

manage the outsourcing contract. They also attracted a generally high level of
agreement among the case study participants.
Less important was the contract period, i.e. ability to withdraw from the contract
(4.80) which was not considered as an overriding factor in the negotiations. Similarly,
of less importance was determining the duration of the contract (4.71) and the
possibility of extending the contract (4.73). An appropriate timeframe should apply to
outsourcing service and if the contract is going well it should be easy for the
organisation to extend the contract. Case 2 considered these factors as not significantly
important because they should represent a standard item in the contract.
Evaluation and Monitoring Phase
In the last phase, the IT outsourcing experiences are evaluated and monitored.
Essentially this consists of establishing management's satisfaction with the result of
outsourcing. Table 28 presents the importance of the subtasks involved.
Table 28 Responses for The Evaluation and Monitoring Phase
Mean easel Case2 Case3 Considering management satisfaction with IT outsourcing 5.55 Provides an acceptable level of service 6. 1 8 High High High Delivers cost savings 5.09 Medium Low Low Resul ts in improved quality of services and products 5.67 Medium High Medium Objectives are consistent with organisational obj ectives 5.60 High Medium High Obj ectives meet senior managements' needs 5.41 Medium Medium High Will be able to deal with redundant staff 4.65 High Medium High Can turn IT emolovees into internal or external contractors 3.95 Low Medium High
120
Case4
High High High High High High Low
Decision criteria responses for the evaluation and monitoring phase ranged from 3.95 to
6. 18. The need to provide an acceptable level of service had the highest mean response
(6. 18) and was regarded highly in all four case studies. Other IT outsourcing monitoring
activities rated highly were improved quality of services and products (5.67) and the
need that outsourcing objectives are consistent with organisational objectives (5.60).
Case 3 emphasised the importance of making an outsourcing decision consistent with
the organisation's strategy since outsourcing would be "a pointless exercise" otherwise.
Relationships Between And Within Phases
Statistical analysis consisting of correlations and t-tests were conducted (see
Chapter 5) to establish the relationships between and within decision-making phases.
Responses for the importance of decision-making phases (Table 11) indicated that all
phases were correlated significantly, i.e. they varied with each other to a consistent
extent and in the same direction. Figure 8 provides a diagrammatic representation of
this.
121
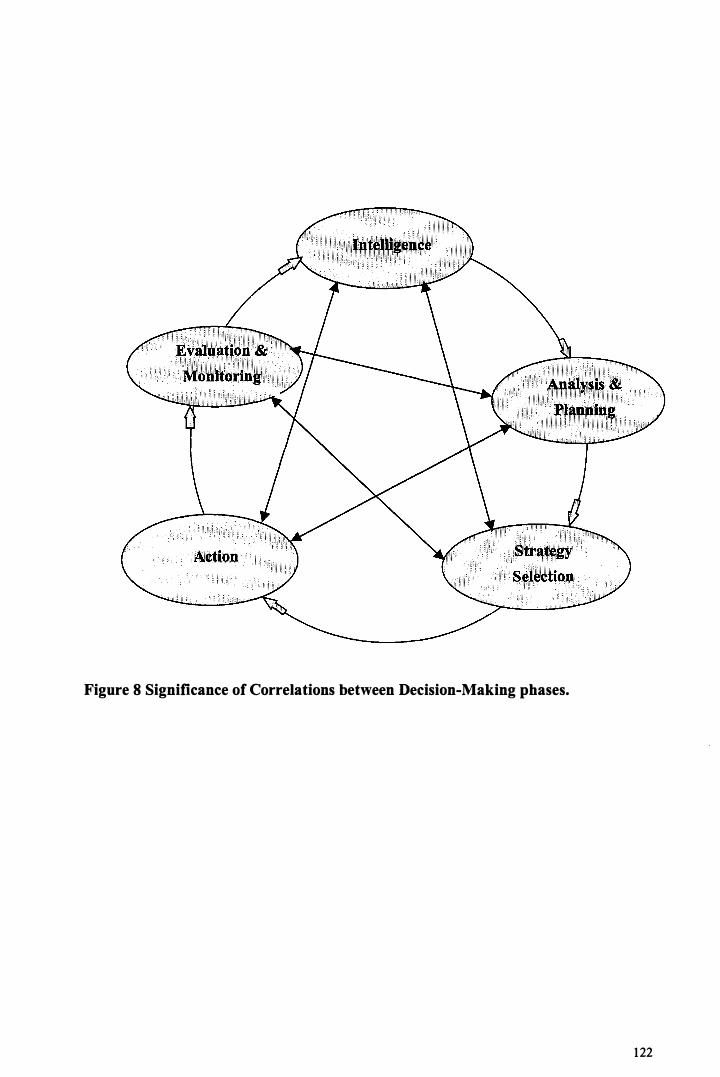
Figure 8 Significance of Correlations between Decision-Making phases.
122

The study, however, established statistically significant differences in the
importance of decision-making phases. A diagrammatic view of the significant
differences is provided in Figure 9.
( ) = mean [ ] = significance of t-test
[.042]
Action (5.40)
[.000]
Strategy Selection
(4.82)
Figure 9 Significant Differences between Decision-making Phases
[.025]
As seen from Figure 9, the action phase appears to 'dominate' other phases in
that it has a mean of 5.40 which is statistically significantly higher than the means for
the phases of intelligence (5. 14), analysis and planning (5. 11), and strategy selection
(4.82). It is, however, not significantly higher than the mean of the evaluation and
monitoring phase (5.22). The above findings seem to indicate that even though phases
are in a strong and positive linear relationship level, the action phase was regarded as
more important than three of the four other phases.
1 23
Within the intelligence phase, various statistically significant correlations and
differences were observed at the task level. Table 12 shows that all four tasks
(information gathering, organisational needs, IT support and IT staffing) were
significantly correlated. T-test results (Table 13) showed that significant differences
only existed between the IT staffing task and each of the other tasks. IT staffing was
rated the most important decision-making task in the intelligence phase.
Within the analysis and planning phase, while statistical analysis (Table 14)
showed that there was no significant association between the two tasks ( evaluation of
current IT, feasibility of outsourcing), significant differences were found between the
two tasks (Table 15). The task of evaluating current IT was rated as significantly more
important than the task of determining the feasibility of outsourcing.
In the action phase (Table 16), the strong correlation between the two tasks
(selection of vendor, determining the contract) suggest that they are strongly associated.
The t-test (Table 17), however, showed that the selection of the vendor was significantly
more important than determining the contract.
Development Of a Conceptual Model
The above discussions enabled the original outsourcing decision-making model
to be revised so that important phases and tasks and relationships between them are
accentuated. Figure 10 presents this new model.
124

Figure 10 The Accentuated Model of IT Outsourcing Decision-Making
Acceptable level
of service
Improved quality of services and products
Action
Vendor track record Vendor
support
--
Strategy Selection
Service provided
� ...
0 Significant correlation between phases/tasks
Phases and tasks
I I Important subtasks
C) Most important phases and tasks
Quality of staff
Technical competence
of staff
and efficiency of
IT operations
IT costs
services
125
In the following chapter the conclusions that can be drawn from the model are
presented. They relate to the purpose of the model to provide answers to the research
questions contained in Chapter 1 and its usefulness management and others responsible
for IT outsourcing decision-making. The next chapter will also highlight the model's
limitations as well as identifying further research that can be conducted.
126

CHAPTER EIGHT
CONCLUSIONS, LIMITATIONS AND FUTURE
RESEARCH
This chapter is divided into three major sections. First, conclusions are
developed which relate to the conceptual model showing accentuated key decision
making phases and tasks developed in the preceding chapter. Two major conclusions
are drawn. One is in respect of the conceptual model as a whole, viz. its development
and usefulness. The other concerns the nature of the action phase and its tasks because it
was found to be most critical to the success of IT outsourcing. Second, the chapter will
identify and evaluate the limitations of the study. Finally, opportunities for further
research arising from the work completed will be presented.
Conceptual Model Of IT Decision-Making
Development of Model
During the study an initial framework (model) was developed from a number of
sources. They included a literature survey from which IT outsourcing decision-making
processes were identified. The framework was based on Simon's decision-making
model, which was modified for this research. The conceptual framework was presented
127
in both graphical and narrative form in earlier chapters. It highlighted the variables, in
the form of decision-making phases, tasks and subtasks, that were studied and
measured.
Data related to the importance of the research variables was collected in two
ways. First, a survey was conducted and the data obtained was analysed using
quantitative analysis techniques. The analysis provided findings on levels of importance
of variables and relationships between them. Second, interviews were conducted from
which qualitative data was obtained. Results obtained from the two research approaches
were integrated and discussed in Chapter 7.
The study findings enabled a model to be derived that accentuated the
relationships between decision-making phases and tasks and their respective
importance. This model in essence highlights those phases and tasks that the study
participants identified as important during the outsourcing oflT. It can be concluded
that the design of the original model as well as its accentuated form provides answers to
the research questions that were raised in Chapter 1 of the thesis. In other words, the
research provided insight into the decision-making activities undertaken when
considering IT outsourcing and identified those regarded as important to the successful
outcome of IT outsourcing.
128I' If !j

Usefulness of Model
The main objective of the accentuated model (see Chapter 7) is to identify the
key decision-making phases and tasks in order to help management and others to make
effective IT outsourcing decisions. The model indicated that all phases (intelligence,
analysis and planning, strategy selection, action and evaluation and monitoring) were
significantly correlated so that their importance varied in a linear manner with each
other. The importance of phases and tasks vis-a-vis each other was also established.
This showed that the action phase appeared to be more significant than the other phases
with the exception of the evaluation and monitoring phase.
At the task level, it was found that all tasks within the intelligence phase were
strongly correlated. The tasks comprised information gathering, determining
organisational needs, IT support and IT staffing. The last mentioned was the most
significant task and contained two important subtasks, namely assessing the quality of
IT staff and their competence. Within the analysis and planning phase, the most
important task was evaluating current IT for which the subtasks of establishing the
efficiency and effectiveness of IT operations and quantifying IT costs were most
significant. The strategy selection phase has one task which contains seven subtasks.
Three of the tasks namely the IT function requires expertise, better management of IT
risks, and perceived flexibility in providing IT services, were regarded as highly
important in determining the outsourcing strategy. For the action phase, the tasks of
vendor selection and contract determination were strongly correlated. The former was
considered more important and contained two important subtasks, namely establishing
129
vendor track record and vendor support. In the evaluation and monitoring phase, the
subtasks of achieving an acceptable level of service and an improved level of service
were most important.
Knowledge of the above findings should provide the following benefits:
• The identification and description of phases, tasks and subtasks provides a checklist
of what needs to be taken into account during IT outsourcing decision-making. They
provide, for example, guidelines on gathering necessary information about the
outsourcing phenomenon, determining needs and circumstances, determining the
feasibility of outsourcing, deciding between different strategies of outsourcing, and
so on.
• The identification of key phases, tasks and subtasks will help management and
others to focus on critical areas that need to be managed well in order for IT
outsourcing to be successful. They have been identified earlier and include, for
example, the action phase, the task of determining existing IT staffing and the
subtasks of establishing the quality and competence of IT staffing.
• The identification of the action phase as the most important phase enables
management attention to be particularly focussed. The two tasks within the phase,
namely vendor selection and contract determination, are strongly correlated and
should be managed well. Because of their importance, an in-depth discussion will be
provided on the action phase in the next section.
130
• The framework can be used on a 'as needed' basis thereby making it useful for
different outsourcing decision scenarios and situations. For instance, if an
organisation doesn't have enough information about outsourcing, the intelligence
phase would provide useful hints on how to gain information about the outsourcing
phenomenon.
Action: The Most Critical Phase
The study found the action phase the most important decision-making phase and
therefore is in agreement with Kether and Walstrom (1993) who commented "the
difference between successful outsourcing and a disaster may simply be determined by
the selection of the vendor and the terms of the contract" (p.456). In recognition of the
importance of this phase the following model is presented. It shows an expanded
representation of the activities, presented in life cycle form, related to selecting a
suitable vendor and entering into an outsourcing contract. Elements of the evaluation
and monitoring phase have been included as part of post-contract management activities
since this phase was not significantly less important to the action phase. As indicated
previously (see Figure 8) the action phase was statistically more significant than all
other phases with the exception of the evaluation and monitoring phase.
13 1
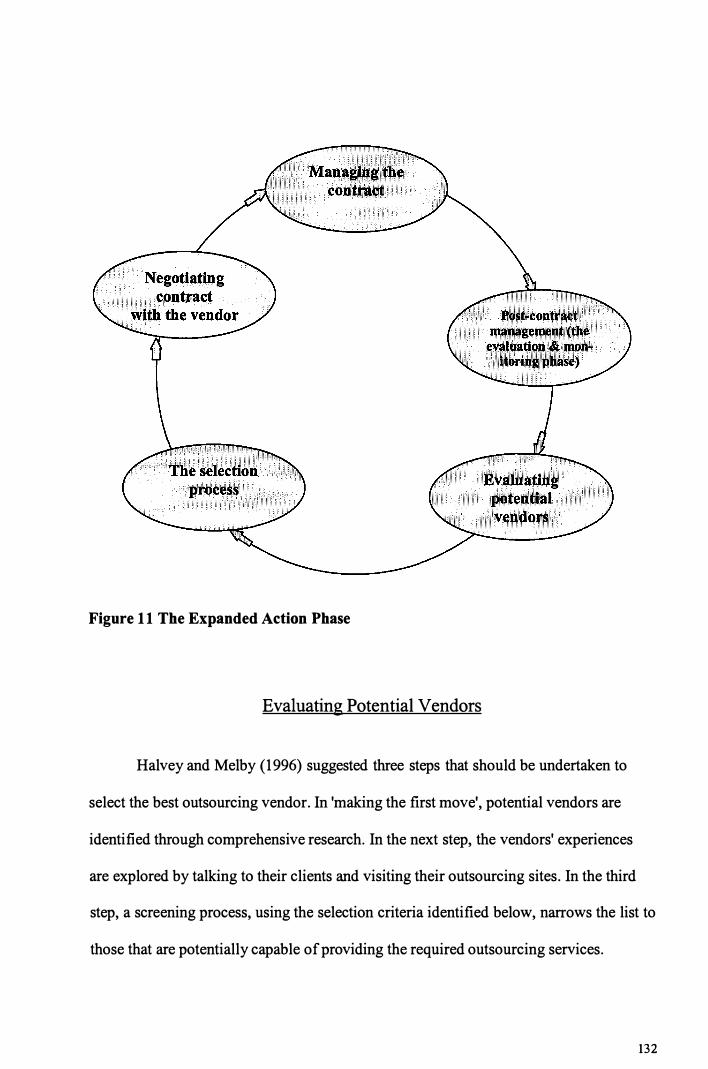
Figure 1 1 The Expanded Action Phase
Evaluating Potential Vendors
Halvey and Melby (1996) suggested three steps that should be undertaken to
select the best outsourcing vendor. In 'making the first move', potential vendors are
identified through comprehensive research. In the next step, the vendors' experiences
are explored by talking to their clients and visiting their outsourcing sites. In the third
step, a screening process, using the selection criteria identified below, narrows the list to
those that are potentially capable of providing the required outsourcing services.
132
The Selection Process
Many criteria have been identified over time ( e.g. Halvey & Melby, 1996);
Minoli, 1995) and generally seem to focus on the following: track record, knowledge of
industry, technical and industry experience, financial stability, willingness to negotiate,
and ability to set up measurement systems. In this stage, vendors should be evaluated
against the selection criteria.
Negotiating Contract Conditions
Before entering into a contract, various conditions should be negotiated. They
include the following: the ability to break the contract because of poor performance,
commitment by the vendor to support the business objectives, pricing mechanisms for
the addition or deletion of base services, scope and levels of services to be performed,
performance standards for each of the services including response times, processing
priorities and systems availability. Negotiation is not an easy task and requires a great
deal of insight into current and future IT and business activities.
Managing the Contract
The outsourcing contract determines the relationships between the outsourcing
organisation and the vendor. The relationship should be a win-win relationship and
133

should be fair to both parties. According to Kem and Willcocks (1999) contracts are
best managed when they explicitly detail service levels and establish performance
measures on cost reductions, service delivery, service improvement, user satisfaction
and others.
Post-Contract Management
This phase coincides with the evaluation and monitoring phase of the decision
making model discussed in previous sections of the thesis. The purpose of the post
contract management is to ensure, on a regular basis, that the vendor is complying with
the contract terms and achieving the agreement's goals and objectives. It also provides
the opportunity to review and revise the contract if circumstances require this.
Study Limitations
While the research was meticulously designed and the data collected indicated a
high degree of reliability, a potential criticism can be levied against the number of forty
four useable responses obtained during the survey. This sample size was largely due to
the high number of uncompleted questionnaires returned because of incorrect addresses
on the database and lack of information about organisational IT outsourcing. No data
currently exists in Australia on the extent of IT outsourcing, viz. number and type of
organisations, scope of IT outsourcing, etc. This study is among the first to provide
134

empirical evidence on how the important activity of decision-making for outsourcing IT
is currently managed.
The study obtained its data from a sample of medium/large, mostly government,
organisations and its findings therefore are useful to management and others responsible
for them. The study's outcomes are unlikely to be of great value to smaller firms since
their characteristics are quite different. For example, they do not generally have an
internal IT function or employ IT staff. They may also rely on the advice of their
consultants (e.g. accountants) when negotiating and selecting an outsourcing vendor.
The decision-making framework used in the study provided a static
representation of decision-making phases and tasks. While the model reflected the
decision-making life cycle, no data was collected on the sequence in which phases and
task are best to be performed. This may be a problem when the model is applied in real
life since decision-making activities do not take place at the same time. For example,
where phases and tasks are strongly correlated, uncertainty exists as to which activities
should be commenced first.
135

Future Research
The research has shown that the action phase is the dominant phase in the
outsourcing decision-making model. Future research should investigate the action phase
in more detail. In particular research should focus on the two tasks of the action phase
namely selecting an IT outsourcing vendor and determining the IT oursourcing contract
which were found to be important issues. Gaining knowledge in drafting a good
contract with a well-selected outsourcing vendor may be the key to successful
outsourcing.
Research should be conducted on the sequence of the action phase tasks,
participants and risks. For example, having established the importance of the action
phase leads to the question of who should negotiate the contract? Should it be a contract
manager or an experienced outsourcing IT professional. According to Howarth (1999)
many of the relationships being formed today contain an element of risk for the IT
supplier that goes far beyond financial penalties in traditional service level agreements
(SLAs). More research is required into contract core issues for example, how can the
best service be provided, and acceptable service levels.
Further research is needed to examine the evaluation and monitoring phase to
ensure that the vendor is complying with the contract terms and the client is obtaining
the best possible benefits of the outsourcing deal. One strategy that could be evaluated
is a benchmarking against which vendor performance and service levels can be
evaluated and monitored. Research could establish whether benchmarking in an
136

outsourcing contact will provide the benefit of reducing the risk and incidence of future
disputes between both parties and establishing an effective compliance program to be
followed by the vendor. Research is needed to establish successful benchmarking i.e.
services to be provided and the service levels to be measured.
Establishing methods for measuring performance in competitive benchmarking
will help in achieving the goal of a win-win relationship between the two parties.
137
II !I
REFERENC E S
Alavi, M. and Carlson, P. (1992) A review of MIS research and disciplinary development, Journal of Management Information Systems (8 :4),p. 45-62.
Altinkemer, K., Chaturvedi, A., & Gulati, R. (1994). Information Systems Outsourcing: Issues and Evidence, International Journal of Information management,14(4), 252-268
Ambrosio, J. (1991) Outsourcing at Southland: best of times, worst of times, Computerworld, 25 (12), 61.
Benbasat, I., Goldstein, D. and Mead, M.(1987) The case research Strategy in Studies of Information Systems. MIS Quarterly 11(3), 369 - 386
Blank, S. (1984). Practical Business Research Methods. USA: The AVI, Inc.
Boar, B. (1994). Practical Steps for Aligning Information Technology with Business Strategies, How to Achieve a Competitive Advantage. USA: John Wilew & Sons, Inc.
Brewer, J. & Hunter, A. (1989). Multimethod research: A synthesis. Newbury Park, California: Sage
Brannen, J. (1992). Mixing Methods: Qualitative and Quantitative Research. England: Avebury.
Bryman, A. (1988). Quantity and Quality in Social Research. London, UK: Unwin Hyman Ltd.
Callaghan, J. (1993) Quality Management and Performance Measurement in Outsourcing Arrangements, Proceedings of " Effective Outsourcing" BLEC Conference, South Melbourne: Business Law Education Centre.
138

Corbett, M. (1994) Outsourcing and the new IT Executive: A Trend Report, Information Systems Management. 11(4), 19-22.
Crone, R. (1992) Negotiating an Outsourcing Agreement. Journal of Bank Management. 68 (3), 59-62.
Dane, F. ( 1 990). Research Methods. California, USA: Wadsworth.
Davis, G.B. and Olson, M.H. (1985) Management Information Systems: Conceptual Foundations, Structure and Development, McGraw-Hill Book Organisation, New York.
Davis, D. and Consenza, R.M. (1988) Business Research for Decision-Making, PWSKent. Boston
Department of state Services (1993, August), The West Australian Information Paper on outsourcing Information Technology Services in the West Australian Public Sector.
Douglas, D. (1993) New Wrinkles in IS Outsourcing, IS Analyzer, 31 (9), 1-16.
Duffy, C. (1991) Hidden costs can undermine savings from outsourcing. Journal of Computerworld 25(46), 109.
Drew, C., Hardman, M. & Hart, A. (1996) Designing and Conducting Research, Inquiry in Education and Social Science. USA: Allyn & Bacon.
Due, RT. (1992). The real cost of outsourcing. Journal of Information Systems Management (JIF), 9 ( 1 ), 78-81
Emory, C. and Cooper, D. (1991) Business Research Methods, Irwin, Inc, USA
Evans, D. (1994) Smart new ways to manage subcontractors. Money, 23, 42-46
139
'I' L 11 fl l / l f i-�
J I
j .., 1
Fink, D. (1994). A Security Framework for Information Systems Outsourcing. Journal of Information Management & Computer Security. 2(4), 3-8
Fisher, J. and Arnott, D. (1998) An Example of Analysis of Qualitative case Study Data in Information System research, Proceedings of ''Ninth Australasian Conference Information Systems" The University of New South Wales
Gable, G. (1994). Integrating case study and survey research methods: An example in information systems. European Journal of Information Systems. 3(2) , 112-126
Graziano, A. and Raulin, M. (1997) Research Methods: A Process of Inquiry, AddisonWesley Educational Publishers, Inc,
Grover, V. , Cheon, M. & Teng, J. (1994). A descriptive study on the outsourcing of information systems functions. Journal of Information & Management, 27(1), 33-44
Grover, V., Cheon, M. and Teng, J. (1995) Decisions to Outsource Information Systems Functions: Testing a Strategy- Theoretic Discrepancy Model, Decision Sciences, 26(1) 75-103.
Gupta U.G. and Gupta, A (1992) Outsourcing the IS function: Is it necessary for your organisation? Journal of Information Systems Management. 9 (3), 44-50.
Hair, J.F., Anderson, R.E., Tatham, R.L. and Black, W. C. (1995) Multivariate Data Analysis with Readings, Fourth Edition, Prentice-Hall International, Inc., Sydney.
Halvey, K. and Melby, B. (1996). Information Technology Outsourcing Transactions: Process, Strategies, and Contracts. New York, USA: John Wiley & Sons.
Howarth, B. (1999, October 29) IT Outsourcing the next generation, BRW Magazine, 72-78.
Horwitt, E. (1993) Syncordia wins mega outsourcing pact, Computerworld, 27 (14), 4.
James, P. (1993) Wendell Jones On Outsourcing, Journal of Information Systems Management, 10 ( 4 ), 72-77.
140
j,, l•, 1• l !1 ' i•
[i

Jathanna, V. (1991, December). Outsourcing. CMA Magazine (RIA), P: 25-27
Judenberg, J. (1994) "Applications Maintenance Outsourcing, An Alternative to total Outsourcing. Information Systems Management, 11(1), 34-38.
Kem, T. & Willcocks, L. (1999). Contracts, Control and 'Presentiation' In IT Outsourcing: Research In Thirteen UK Organisations, Proceedings of 7th
European Conference on Information Systems,1999, Copenhagen.
Ketler, K. and Walstrom, J. (1992) The Outsourcing of Information systems, Proceedings of " Emerging Information Technologies for Competitive Advantage and Economic Development" IRMAI Conference, Charleston, SC, USA : Information Resources Management Association.
Ketler, K. and Walstrom, J. (1993) The Outsourcing Decision, International Journal of Information Management, 13(6), 449-459.
Lacity, M. & Hirschheim, R. (1 993). Information Systems Outsourcing, Wiley & Sons Ltd. England.
Laribee, J.F. and Michaels-Barr, L. (1994) Dealing with Personnel Concerns m Outsourcing, Journal of Systems Management, 45 (1), 6-12.
Leinfuss, E. (1991) How outsourcing Impacts IS managers, Computerworld, 25 (37), 113.
Manion, R. (1993) Why it makes sense to break the IS shackles; and five reasons why it may not. I. T. Magazine (CAD), p:14-19.
Martinsons, M.G. (1993) Outsourcing Information Systems: A Strategic Partnership, Long Range Planning, 26(3), 18-25.
McFarlan, F., Nolan, R. (1995). How to Manage an IT Outsourcing Alliance. Sloan Management Review, 73(3), 7-18.
Miller, J., & Doyle, B.A. (1987). Measuring the effectiveness of computer-based information systems in the financial services sectors. MIS Quarterly, 11(1), 107-124.
141

Minoli, D. (1995) Analyzing Outsourcing: Reengineering Information and Communication Systems, McGraw-Hill, Inc., New York.
Orlikowski, W.J. & Baroudi, J.J. (1991) Studying Information Technology in Organizations: Research Approaches and Assumptions, Information Systems Research (2)p. 1-28.
Outsourcing Academics.com/html (2000). Information Technology: The Lifeblood of an Organization [on-line] . Available WWW: http://WWW.OTSOURCINGACADEMICS.COM/htmVacad9.html.
Patane, J. & Jurison, J. (1994). IS Global outsourcing diminishing the prospects for American programmers?. Journal of Systems Management, 45(6), 6-10
Ranald, P.(1992) Outsourcing Information Technology in The Australian Public Service: A one way street. Australia. The Public Sector Research Centre. University of NSW
Seglin, J. (1996) You can lead a manager to order, but you can't make him think. Inc [INO], 18(18), 30
Simon, H.A. (1960) The New Science of Management Decisions, Harper and Brothers, New York.
The Penguin English Dictionary, 1st edition, Merriam-Webster Inc. and Longman Group Limited, 1985 England
Willcocks, L., Lacity, M. and Fitzgerald G. (1995 ) Information Technology Outsourcing in Europe and the USA: Assessment Issues, International journal of Information Management, 15(5), 333-351.
142
IL
E D I T H C OWAN U N IVE RS I T Y PERTH WESTERN AUSTRALIA
APPENDIX A
The Questionnaire
Information Technology Outsourcing Decision-Making
Information Technology (IT) Outsourcing is one of the most important business trends of the 1990s. Little research has so far been conducted in Australia as to the IT management strategies needed when considering outsourcing. The purpose of this study is to obtain feedback from senior management regarding the decision-making processes prior to IT outsourcing.
The study outcomes will enable the researchers to compile guidelines to assist management with future outsourcing decisions. Your participation in the research is therefore highly valued. It requires you to complete the attached questionnaire which, compared to other research questionnaires, is relatively short and should take about 20 minutes to complete.
Your opinions are highly valued and as a member of the sample chosen for the study we would very much appreciate receiving your reply to our questionnaire. Your response also ensures that the validity and reliability of the studies findings are maintained. Confidentiality will be maintained throughout the study and only aggregate data will be disclosed in reports that may arise.
Please return the completed questionnaire through your mailing system in the attachedenvelope within the next few days. If you have any queries, please contact the researcher or the researcher's academic supervisor on the following telephone numbers:
Ashraf Shoeib phone (08) 9244-7616 Master of Business (Information Systems) student
or
Dr Dieter Fink Associate Professor
143
,; ' '. t1
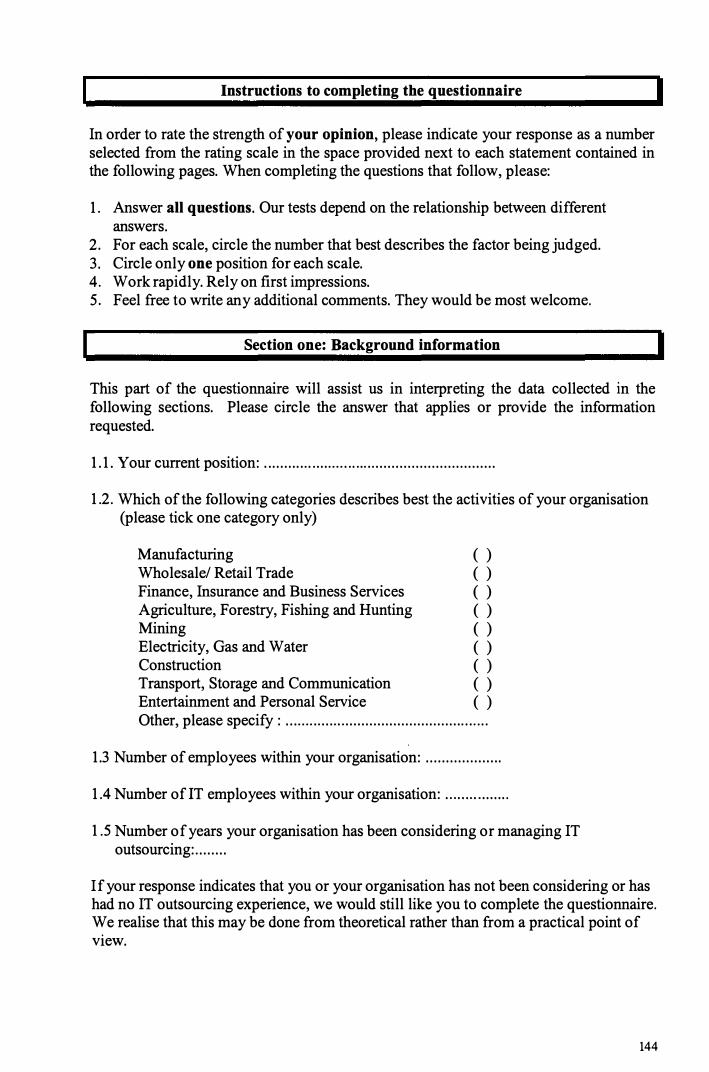
Instructions to completing the questionnaire
In order to rate the strength of your opinion, please indicate your response as a number selected from the rating scale in the space provided next to each statement contained in the following pages. When completing the questions that follow, please:
1. Answer all questions. Our tests depend on the relationship between different answers.
2. For each scale, circle the number that best describes the factor being judged. 3. Circle only one position for each scale. 4. Work rapidly. Rely on first impressions. 5. Feel free to write any additional comments. They would be most welcome.
Section one: Background information
This part of the questionnaire will assist us in interpreting the data collected in the following sections. Please circle the answer that applies or provide the information requested.
1. 1. Your current position: . . . . . . . . . .. . . . . ..... . . . . .. .. . . . . . . . . . . . . . . . . . . . . . . . . . . . . . .
1.2. Which of the following categories describes best the activities of your organisation (please tick one category only)
Manufacturing Wholesale/ Retail Trade Finance, Insurance and Business Services Agriculture, Forestry, Fishing and Hunting Mining Electricity, Gas and Water Construction Transport, Storage and Communication
( ) ( ) ( ) ( ) ( ) ( ) ( ) ( )
Entertainment and Personal Service ( ) Other, please specify : . . ..... .. . . .. .. . . . . . . . . . . . . . . . . . . . . . . . . . . . . .. . ... . .
1.3 Number of employees within your organisation: . . . . . . . . . . . . . . . . . . .
1.4 Number of lT employees within your organisation: ... . . .. . . . . . . . ..
1.5 Number of years your organisation has been considering or managing IT outsourcing: . . . . . . . .
If your response indicates that you or your organisation has not been considering or has had no IT outsourcing experience, we would still like you to complete the questionnaire. We realise that this may be done from theoretical rather than from a practical point of view.
144

Section two: Factors affecting the IT outsourcing decision
This part of the questionnaire addresses the decision-making phases of IT outsourcing.
Please circle the number that applies or provide the information requested.
j 2. 1 When considering IT outsourcing, to what extent should the decision maker
Not at all Extreme
Study the IT outsourcing phenomenon
Learn about the experiences of other companies Gain advice from IT outsourcing consultants
1 2 3 4 5 6 7
1 2 3 4 5 6 7
1 2 3 4 5 6 7
2.2 When considering IT outsourcing, to what extent should the following organisational needs and circumstances be taken into account
Not at all Extreme
Use of lT to improve productivity 1 2 3 4 5 6 7
Reengineering of IT to align with organisation strategy 1 2 3 4 5 6 7
Use IT to improve quality of services/products 1 2 3 4 5 6 7
Need to reduce IT costs 1 2 3 4 5 6 7
Use IT to develop competitive advantages 1 2 3 4 5 6 7
Need to keep up with emerging technologies 1 2 3 4 5 6 7
Creation of an IT architecture 1 2 3 4 5 6 7
Use oflT to improve quality of management information 1 2 3 4 5 6 7
145

2.3 When considering IT outsourcing, to what extent should the following IT support issues be taken into account I
II Not at all Extreme I
Processing of requests for changes to systems 1 2 3 4 5 6 7 I Lead time required for implementing new systems 1 2 3 4 5 6 7 r
IT's responsiveness to changing user needs 1 2 3 4 5 6 7 Support for users in preparing system proposals 1 2 3 4 5 6 7 Flexibility of data and reports from systems 1 2 3 4 5 6 7
2.4 When considering IT outsourcing, to what extent should the following IT staff issues be taken into account
Not at all Extreme Responsiveness of IT personnel to user needs 1 2 3 4 5 6 7 Quality and competence of IT personnel 1 2 3 4 5 6 7 Technical competence of the IT personnel 1 2 3 4 5 6 7 Effort extended by IT personnel to create new systems 1 2 3 4 5 6 7 Relationship of IT personnel with users 1 2 3 4 5 6 7
2.5 When analysing IT outsourcing and alternative strategies, to what extent should current IT be evaluated by
Not at all Extreme Reviewing the objectives of IT in the organisation 1 2 3 4 5 6 7 Quantifying all IT costs 1 2 3 4 5 6 7 The effectiveness /efficiency of IT operations 1 2 3 4 5 6 7 Identifying IT problems being experienced 1 2 3 4 5 6 7 The correct mix IT insourcing and outsourcing 1 2 3 4 5 6 7
146

12.6 To what extent is IT outsourcing feasibility influenced by
Not at all Extreme IT function too critical to relinquish to a third party 1 2 3 4 5 6 7 Cost savings difficult to demonstrate 1 2 3 4 5 6 7 Concerns about managing the outsourcing vendor 1 2 3 4 5 6 7 Outsourcing vendor able to meet service goals 1 2 3 4 5 6 7 Cost savings in IT personnel being sought 1 2 3 4 5 6 7 IT service improvements being sought 1 2 3 4 5 6 7 In-house skills to tackle a specific IS function 1 2 3 4 5 6 7 Freeing up in-house staff for strategic functions 1 2 3 4 5 6 7
2. 7 Please indicate the extend of IT outsourcing that has taken place in your organisation in the following areas (please tick relevant boxes - one tick per row)
IT Functions Fully Partially Fully outsourced outsourced inhouse
Data processing operations Telecommunications and networks Software development Technical support/help desk Disaster recovery
2.8 When deciding on the extent of IT outsourcing in your organisation, how convinced were you that the best strategy for your organisation was?
Fully outsourced Partial outsourced Fully insourcing
Not at all Extreme 1 2 3 4 5 6 7 NIA 1 2 3 4 5 6 7 NIA 1 2 3 4 5 6 7 NIA
147
i '1
,1: 1,

2.9 What are the factors that determine the extent of IT outsourcing strategy (ie. total, partial, inhouse) chosen
Not at all Extreme The IT function is a core business 1 2 3 4 5 6 7 The IT function requires expertise 1 2 3 4 5 6 7 Potential loss of control over the IT function 1 2 3 4 5 6 7 The level of IT service provided 1 2 3 4 5 6 7 Better management oflT risk 1 2 3 4 5 6 7 Perceived flexibility in providing IT services 1 2 3 4 5 6 7 Reduced cost of IT function 1 2 3 4 5 6 7
2. 1 0 When selecting the IT outsourcing vendor, to what extent do the following factors in respect of the vendor influence your decision
Not at all Extreme A good track record by the vendor 1 2 3 4 5 6 7 Appropriate talent to support your organisation 1 2 3 4 5 6 7 Reasonable price for the service agreed 1 2 3 4 5 6 7 Financial stability of the vendor 1 2 3 4 5 6 7 Ability to negotiate performance measurements 1 2 3 4 5 6 7 Satisfying organisation specific criteria 1 2 3 4 5 6 7
2.11 When considering the IT outsourcing contract, to what extent do the following factors in respect of the contract influence your decision
Not at all Extreme Ability to negotiate the price 1 2 3 4 5 6 7 Determining business requirements up front 1 2 3 4 5 6 7 Determining services to be provided 1 2 3 4 5 6 7 Negotiating service levels 1 2 3 4 5 6 7 Ability to withdraw from the contract 1 2 3 4 5 6 7 Determining the duration of the contract 1 2 3 4 5 6 7 Possibility of extending the contract 1 2 3 4 5 6 7
148
J ;f ,!
'1
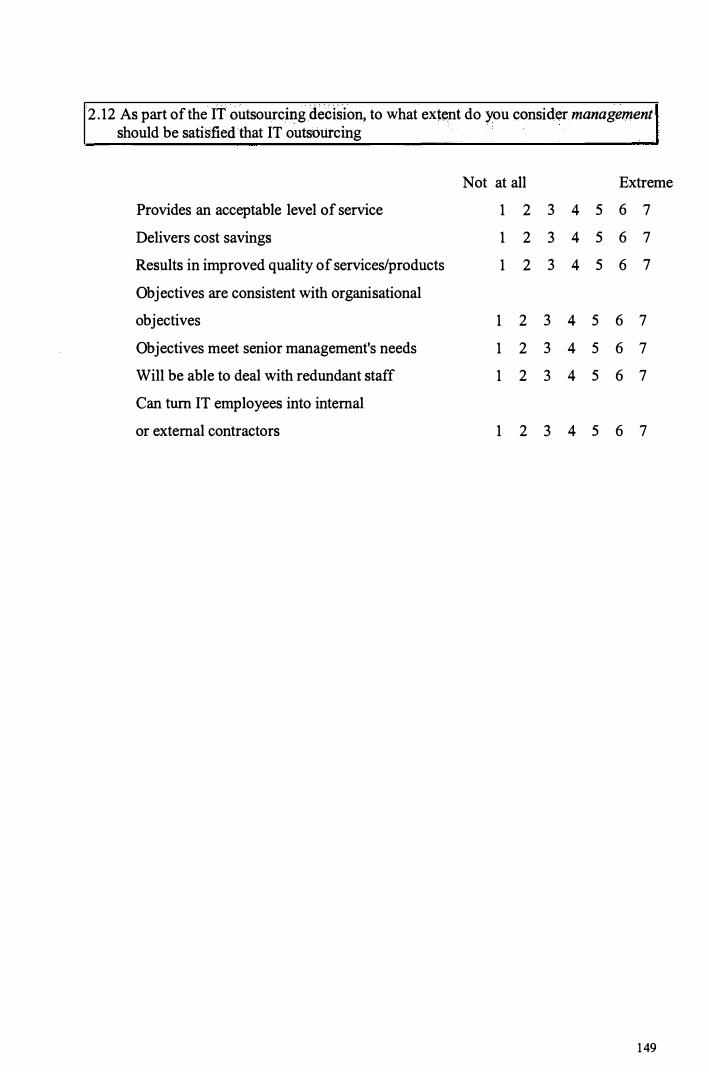
2.12 As part of the IT outsourcing decision, to what extent do you consider management should be satisfied that IT outsourcing
Not at all Extreme Provides an acceptable level of service 1 2 3 4 5 6 7 Delivers cost savings 1 2 3 4 5 6 7 Results in improved quality of services/products 1 2 3 4 5 6 7 Objectives are consistent with organisational objectives 1 2 3 4 5 6 7 Objectives meet senior management's needs 1 2 3 4 5 6 7 Will be able to deal with redundant staff 1 2 3 4 5 6 7 Can turn IT employees into internal or external contractors 1 2 3 4 5 6 7
149
l ·,� ,, !
?/
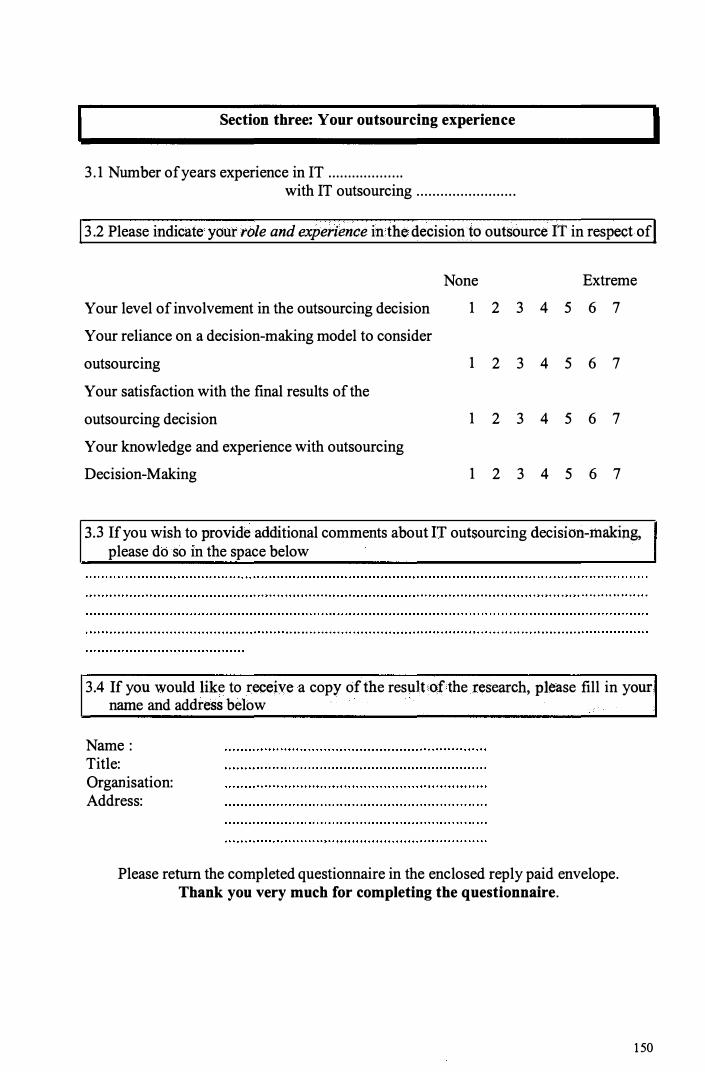
Section three: Your outsourcing experience
3. 1 Number of years experience in IT .................. . with IT outsourcing ........................ .
! 3.2 Please indicate your role and experience in the decision to outsource IT in respect of!
None Extreme
Your level of involvement in the outsourcing decision Your reliance on a decision-making model to consider
outsourcing
Your satisfaction with the final results of the
outsourcing decision
Your knowledge and experience with outsourcing Decision-Making
1 2 3 4 5 6 7
1 2 3 4 5 6 7
1 2 3 4 5 6 7
1 2 3 4 5 6 7
3.3 If you wish to provide additional comments about IT outsourcing decision-making, please do so in the space below
3.4 If you would like to receive a copy of the result of the research, please fill in your name and address below
Name : Title: Organisation: Address:
Please return the completed questionnaire in the enclosed reply paid envelope. Thank you very much for completing the questionnaire.
150
'1' ,,
I ; I r :� � )F

APPEN DIX B
Distribution of Data
151
I i
.I
I � ' Ii
'li * l'
\ ·�
I r
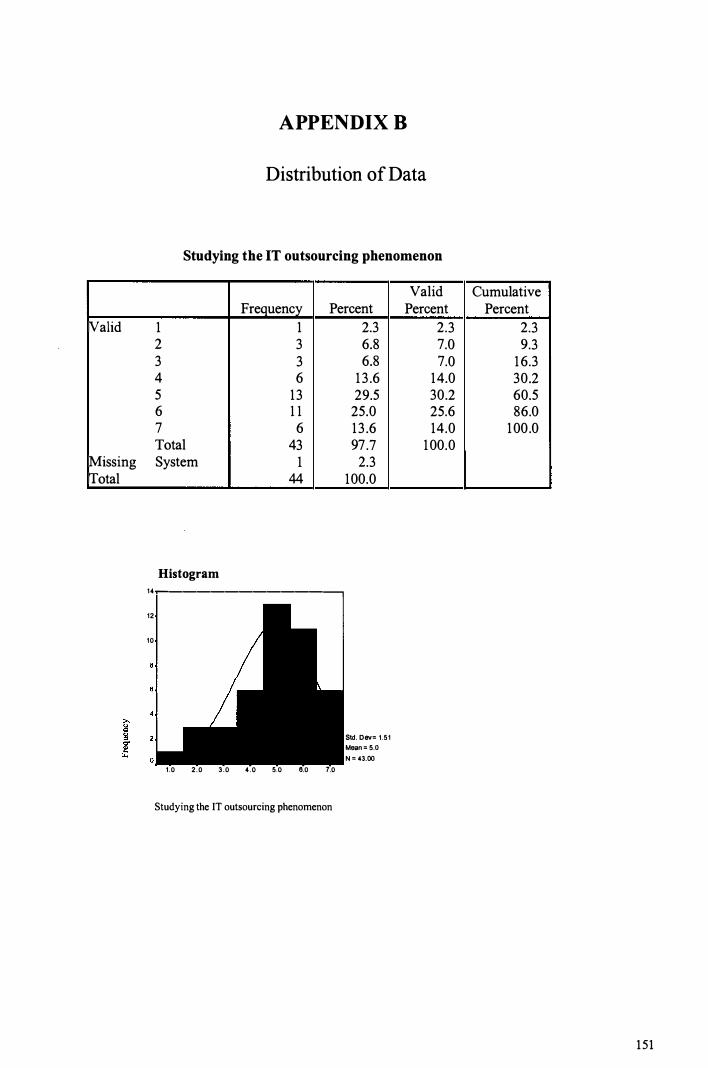
Valid
Missing Total
APPENDIX B
Distribution of Data
Studying the IT outsourcing phenomenon
Valid Frequency Percent Percent
1 1 2.3 2.3 2 3 6.8 7.0 3 3 6.8 7.0 4 6 1 3 .6 14.0 5 13 29.5 30.2 6 1 1 25.0 25.6 7 6 13 .6 14.0 Total 43 97.7 100.0 System 1 2.3
44 100.0
Histogram 14,------------------,
12
10
1.0 2.0 3.0 4.0 5.0 6.0 7.0
Studying the IT outsourcing phenomenon
Std. Dev= 1.51 Mean = 5.0 N = 43.00
Cumulative Percent
2.3 9.3
16.3 30.2 60.5 86.0
100.0
151
I I I
I ' ! I a k �
1 I '

Valid
Missing Total
Learning about the experiences of other companies
Frequency Percent 3 1 2.3 4 2 4.5 5 10 22.7 6 19 43 .2 7 1 1 25.0 Total 43 97.7 System 1 2.3
44 100.0
Histogram 20..--------------,
10
3.0 4.0 5.0 6.0 7.0
Std. Dev = .94 Mean = 5.9 N = 43.00
Learning about the experiences of other companies
Valid Cumulative Percent Percent
2.3 2.3 4.7 7 .0
23.3 30.2 44.2 74.4 25.6 100.0
100.0
152

�alid
!Missing rrotal
J
Gaining advice from IT outsourcing consultants
Frequency Percent 2 2 4.5 3 7 1 5 .9 4 7 1 5 .9 5 16 36.4 6 10 22.7 7 1 2.3 Total 43 97.7 System 1 2.3
44 100.0
Histogram 20.----------------,
10
Std. Dev = 1.21 Mean = 4.7
O N = 43.00 2.0 3.0 4.0 5.0 6.0 7.0
Gaining advice from IT outsourcing consultants
Valid Percent
4.7 16 .3 16.3 37.2 23 .3 2.3
100.0
Cumulative Percent
4.7 20 .9 37.2 74.4 97.7
100.0
153
f: I
I,
t i'
k i
1:, l'.
. if
t '! t I

!Valid
Missing rrotal
Use of IT to improve productivity
Frequency Percent 3 2 4.5 4 2 4.5 5 19 43.2 6 17 38.6 7 3 6.8 Total 43 97.7 System 1 2.3
44 100.0
Histogram 20�------------�
3.0 4.0 5.0 6.0
Use of IT to improve productivity
7.0
Std. Dev = .BB Mean = 5.4 N = 43.00
Valid Percent
4.7 4.7
44.2 39.5 7.0
100.0
Cumulative Percent
4.7 9.3
53 .5 93 .0
100.0
i: , ,
154

Valid
Missing Total
g g
Reengineering of IT to align with company strategy
Frequency Percent 2 1 3 1 4 7 5 16 6 1 3 7 5 Total 43 System 1
44
Histogram 20,---------------,
10
2.0 3.0 4.0 5.0 6.0 7.0
2.3 2.3
1 5 .9 36.4 29.5 1 1 .4 97.7 2.3
100.0
Std. Dev = 1 .09 Mean = 5.3 N = 43.00
Reengineering of IT to align with company strategy
Valid Percent
2.3 2.3
16.3 37 .2 30.2 1 1 .6
100.0
. !
j
Cumulative Percent
2.3 4.7
20.9 58 . 1 88.4
100.0
155
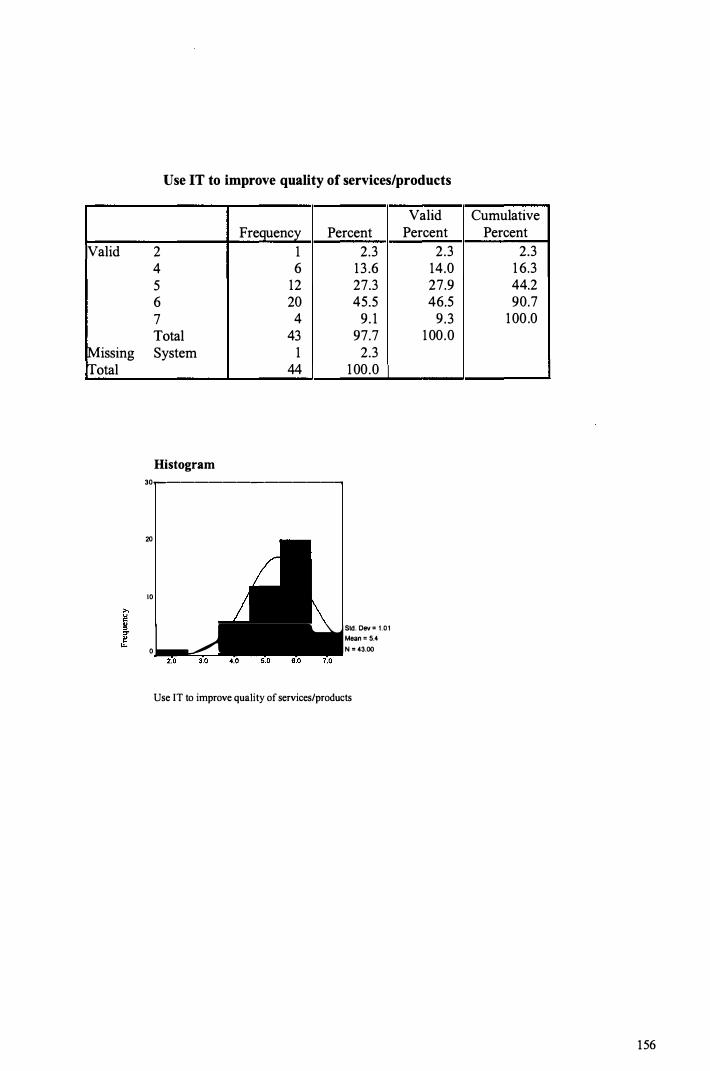
!Valid
Missing Total
Use IT to improve quality of services/products
Frequency Percent 2 1 2.3 4 6 13 .6 5 12 27.3 6 20 45.5 7 4 9. 1 Total 43 97.7 System 1 2.3
44 100.0
Histogram 30..--------------�
20
10
Mean = 5.4 L � Sld. Dev = 1.01
O N = 43.00
Use IT to improve quality of services/products
Valid Percent
2.3 14.0 27.9 46.5
9 .3 100.0
Cumulative Percent
2.3 1 6.3 44.2 90.7
100.0
156

Valid
Missing Total
14
12
10
8
8
4
0 �
1 2 3 4 5 6 7 Total System
Histogram
1.0 2.0 3.0
Need to reduce IT costs
Frequency 1 3 4
13 7
10 5
43 1
44
4.0
Percent 2.3 6.8 9.1
29.5 15 .9 22.7 1 1 .4 97.7 2.3
100.0
Std. Dev = 1 .52 Mean = 4.7 N = 43.00
Need to reduce IT costs
Valid Cumulative Percent Percent
2.3 2.3 7.0 9.3 9.3 1 8 .6
30.2 48.8 1 6.3 65 . 1 23 .3 88 .4 1 1 .6 100.0
100.0
157
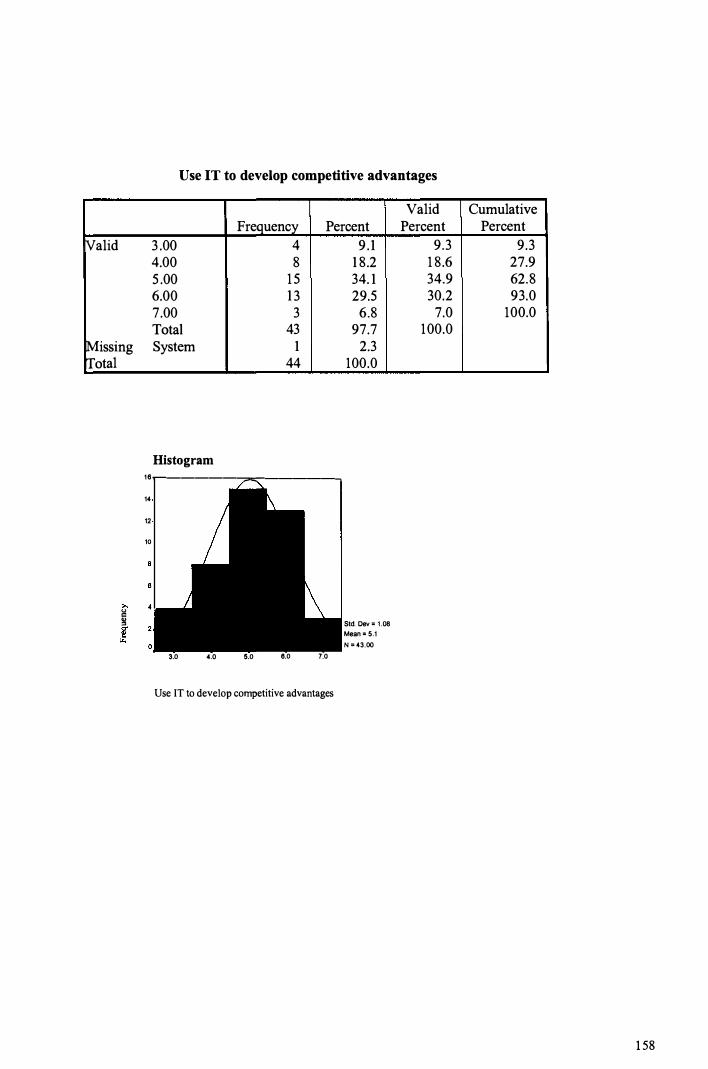
N'alid
Missing Total
::! !!
Use IT to develop competitive advantages
Frequency Percent 3 .00 4 4.00 8 5 .00 1 5 6.00 1 3 7.00 3 Total 43 System 1
44
Histogram 16,-------��------,
14
12
10
3.0 4.0 5.0 6.0 7.0
Use IT to develop competitive advantages
9 . 1 1 8.2 34. 1 29.5 6.8
97.7 2.3
100.0
Std. Dev = 1.08 Mean = 5.1 N = 43.00
Valid Percent
9.3 1 8 .6 34.9 30.2 7.0
100.0
Cumulative Percent
9.3 27.9 62.8 93.0
100.0
158
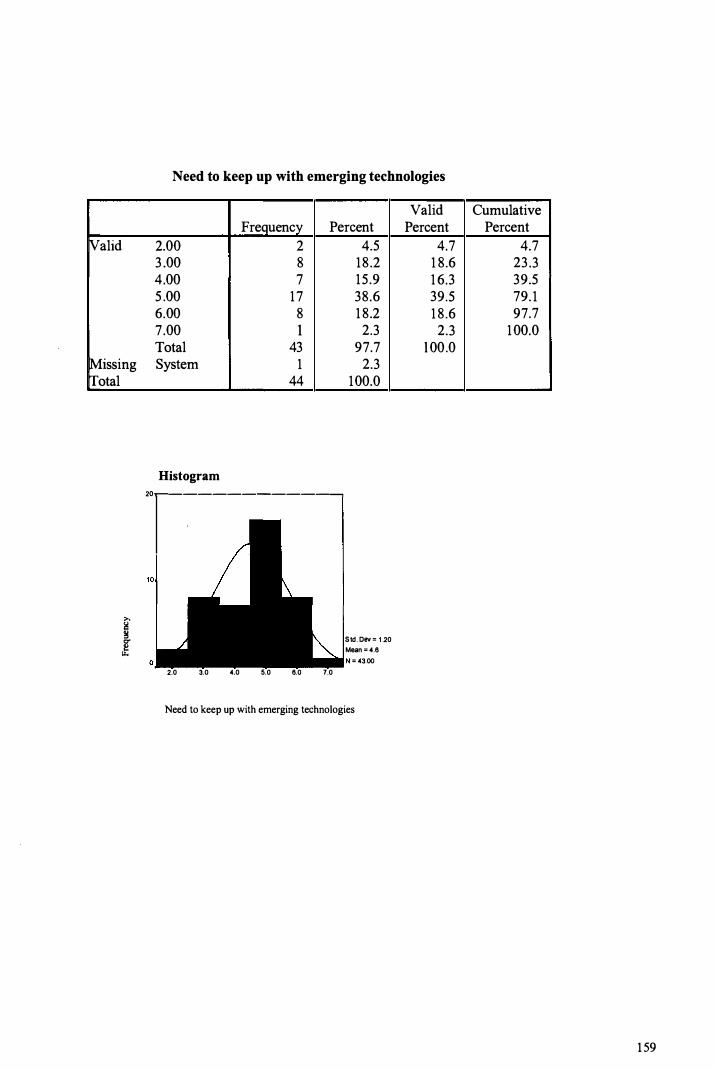
�alid
!Missing lfotal
I
Need to keep up with emerging technologies
Frequency Percent 2.00 2 3 .00 8 4.00 7 5 .00 17 6.00 8 7 .00 1 Total 43 System 1
44
Histogram 20...----------------,
2.0 3.0 4.0 5.0 6.0 7.0
4.5 18 .2 15 .9 38.6 1 8.2 2.3
97.7 2.3
100.0
Std. Dev = 1 .20 Mean = 4.6 N = 43.00
Need to keep up with emerging technologies
Valid Percent
4.7 1 8.6 1 6.3 39.5 1 8 .6 2.3
1 00.0
Cumulative Percent
4.7 23 .3 39.5 79. 1 97.7
100.0
159
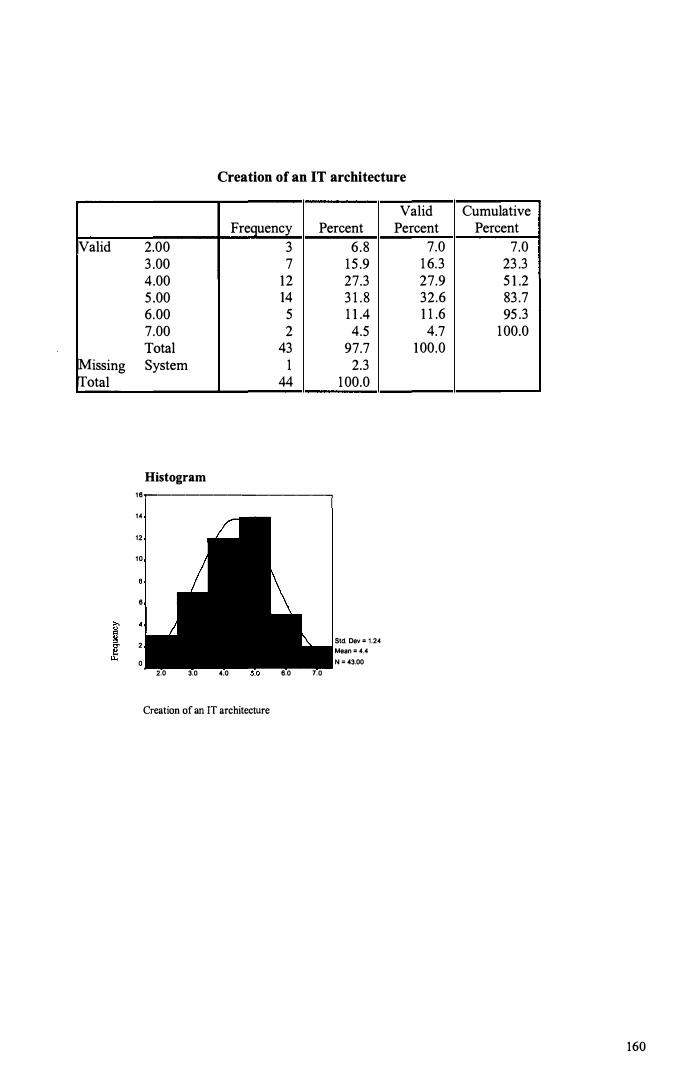
!Valid
Missing Total
Creation of an IT architecture
Frequency Percent 2.00 3 3 .00 7 4.00 12 5 .00 14 6.00 5 7.00 2 Total 43 System 1
44
Histogram 16.---------------,
14
12
10
6
2
0 2.0 3.0 4.0
Creation of an IT architecture
6.0 7.0
6.8 1 5 .9 27.3 3 1 .8 1 1 .4 4.5
97.7 2.3
100.0
Std. Dev = 1.24 Mean = 4.4 N = 43.00
Valid Percent
7.0 1 6.3 27.9 32.6 1 1 .6 4.7
100.0
Cumulative Percent
7.0 23 .3 5 1 .2 83 .7 95 .3
100.0
160
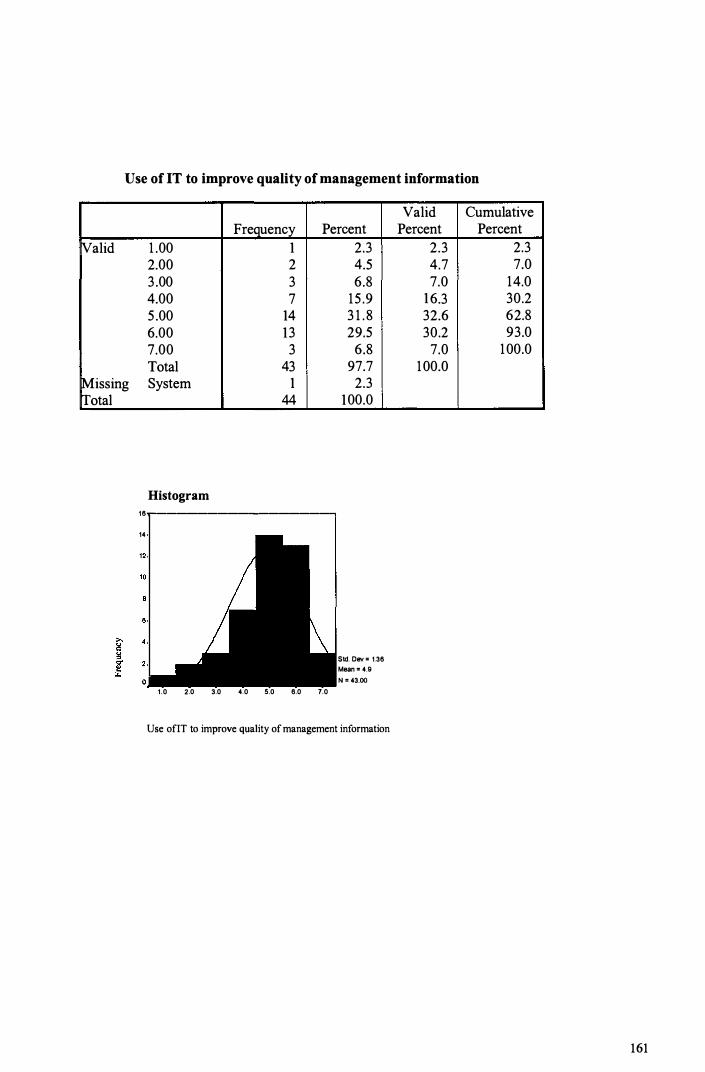
Use of IT to improve quality of management information
!Valid
Missing rrotal
Freauency Percent 1 .00 1 2.3 2.00 2 4.5 3 .00 3 6.8 4.00 7 15 .9 5 .00 14 3 1 . 8 6.00 13 29.5 7.00 3 6.8 Total 43 97.7 System 1 2.3
44 100.0
Histogram 16,-
------------------,
14
1.0 2.0 3.0 4.0 5.0 6.0 7.0
Std. Dev = 1.36 Mean = 4.9 N = 43.00
Use ofIT to improve quality of management information
Valid Cumulative Percent Percent
2.3 2.3 4.7 7.0 7.0 14.0
16.3 30.2 32.6 62.8 30.2 93.0 7.0 100.0
100.0
161

!Valid
Missing Total
Processing of requests for changes to systems
Frequency Percent 3 .00 3 6.8 4.00 6 13 .6 5 .00 1 8 40.9 6.00 9 20.5 7 .00 7 15 .9 Total 43 97.7 System 1 2.3
44 100.0
Histogram 20-------------�
10
3.0 4.0 5.0 8.0 7.0
Std. Dev = 1 . 1 1 Mean = 5.3 N = 43.00
Processing ofrequests for changes to systems
Valid Percent
7.0 14.0 4 1 .9 20.9 1 6.3
1 00.0
Cumulative Percent
7 .0 20.9 62.8 83.7
100.0
1 62
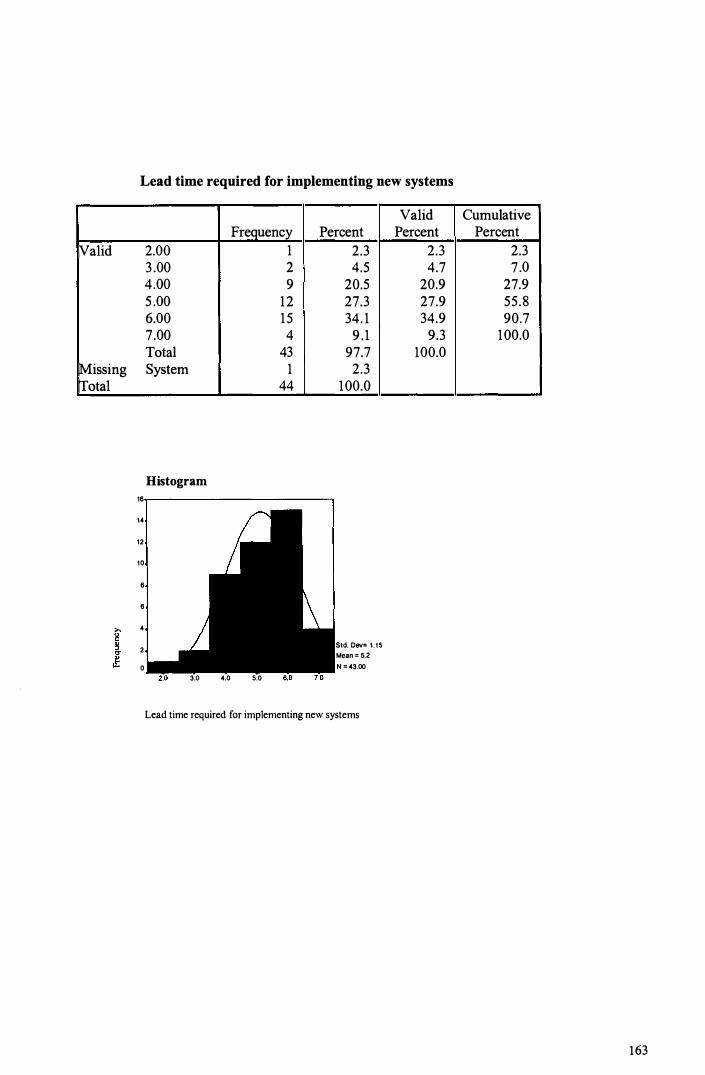
Lead time required for implementing new systems
Valid Cumulative Frequency Percent Percent Percent
Valid 2.00 1 2.3 2.3 2.3 3 .00 2 4.5 4.7 7 .0 4 .00 9 20.5 20.9 27.9 5 .00 12 27.3 27.9 55.8 6.00 15 34. 1 34.9 90.7 7 .00 4 9 . 1 9.3 100.0 Total 43 97.7 100.0
Missing System 1 2.3 rrotal 44 100.0
Histogram 16
14
12
10
6
6
>, 4
2 Std. Dev= 1.15 Mean = 5.2
0 N = 43.00 3.0 4.0 5.0
Lead time required for implementing new systems
163

!Valid
Missing Total
I
IT's responsiveness to changing user needs
Frequency Percent 3 .00 1 4.00 4 5 .00 12 6.00 17 7.00 9 Total 43 System 1
44
Histogram 20--------------,
10
3.0 4.0 5.0 6.0 7.0
ITs responsiveness to changing user needs
2.3 9 . 1
27.3 38.6 20.5 97.7 2.3
100.0
Std. Dev = .99 Mean = 5.7 N = 43.00
Valid Percent
2.3 9.3
27.9 39.5 20.9
100.0
Cumulative Percent
2.3 1 1 .6 39.5 79. 1
100.0
164
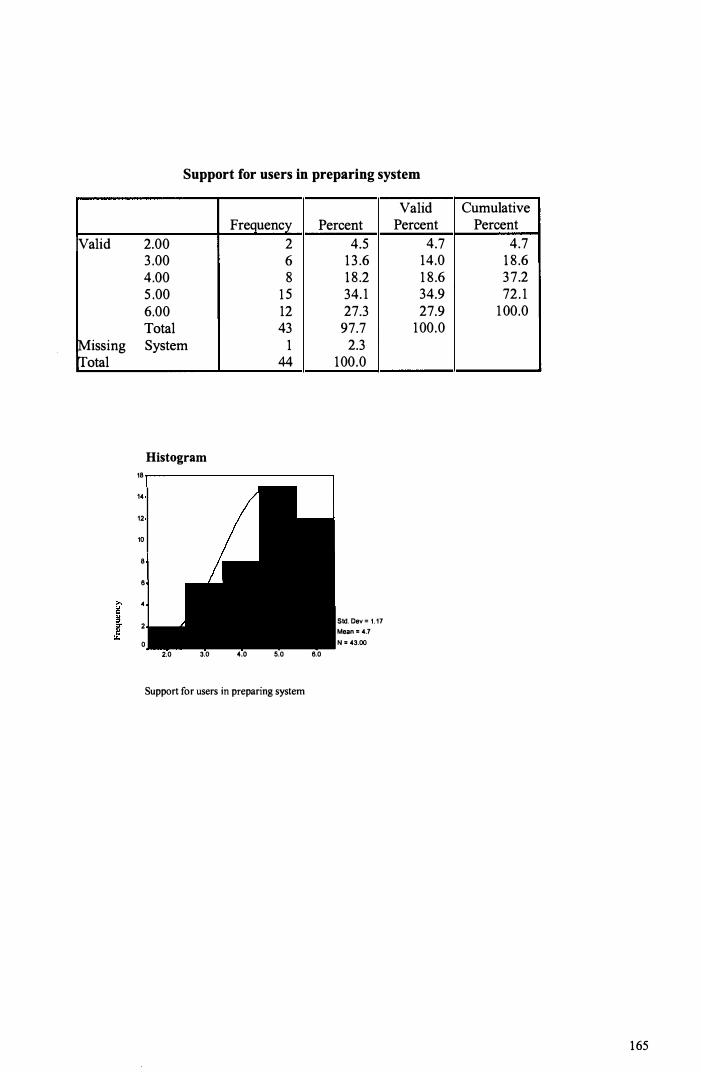
!Valid
!Missing Total
Support for users in preparing system
Frequency 2.00 2 3 .00 6 4.00 8 5 .00 1 5 6.00 12 Total 43 System 1
44
Histogram 18
14
12
10
8
6
2
0 2.0 3.0 4.0 5.0
Support for users in preparing system
Percent
6.0
4.5 1 3 .6 1 8 .2 34. 1 27.3 97.7 2.3
100.0
Std. Dev = 1.17 Mean = 4.7 N = 43.00
Valid Percent
4.7 14.0 1 8 .6 34.9 27.9
100.0
Cumulative Percent
4.7 1 8 .6 37.2 72. 1
1 00.0
165

Valid
Missing Total
Flexibility of data and reports from systems
Frequency Percent 2.00 2 3 .00 7 4.00 1 1 5 .00 8 6.00 12 7.00 3 Total 43 System 1
44
Histogram 14�-----------------�
12
10
2
0 -�2.0 3.0 4.0 5.0 6.0 7.0
Flexibility of data and reports from systems
4.5 1 5 .9 25.0 18 .2 27.3 6.8
97.7 2.3
100.0
Std. Dev = 1.35 Mean = 4.7 N = 43.00
Valid Percent
4.7 16.3 25.6 1 8 .6 27.9 7.0
100.0
Cumulative Percent
4.7 20.9 46.5 65 . 1 93 .0
100.0
1 66
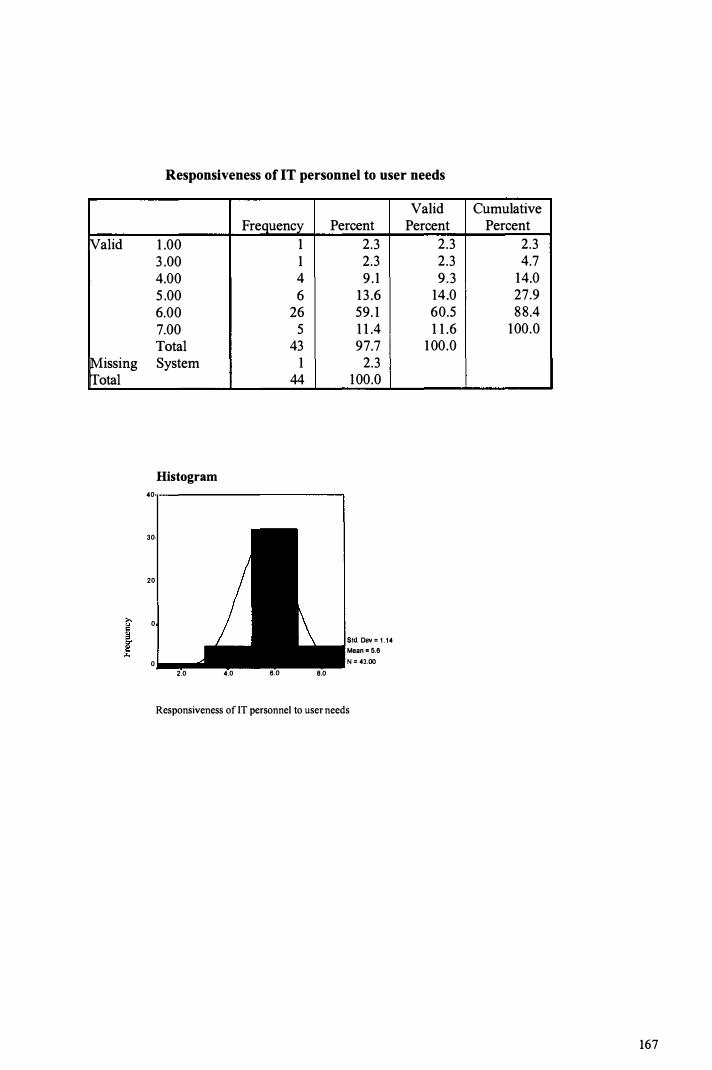
Responsiveness of IT personnel to user needs
Valid Cumulative Frequency Percent Percent Percent
Valid 1 .00 1 2.3 2.3 2.3 3 .00 1 2.3 2.3 4.7 4.00 4 9.1 9 .3 14.0 5 .00 6 13 .6 14.0 27.9 6.00 26 59. 1 60.5 88.4 7.00 5 1 1 .4 1 1 .6 100.0 Total 43 97.7 100.0
Missing System 1 2.3 rrotal 44 100.0
Histogram
40,
30
20
>, 0
Std. Dev = 1 .14
Mean = 5.6
0 N = 43.00
2.0 4.0 6.0 8.0
Responsiveness of IT personnel to user needs
167

Quality and competence of the IT personnel
Valid Cumulative Frequency Percent Percent Percent
Valid 1 .00 1 2.3 2.3 2.3 4.00 3 6.8 7.0 9.3 5 .00 9 20.5 20.9 30.2 6.00 20 45.5 46. 5 76.7 7 .00 10 22.7 23 .3 100.0 Total 43 97.7 100.0
Missing System 1 2.3 Total 44 100.0
Histogram 40
30,
20
0
Std. Dev = 1 . 13 Mean = 5.8
u.. 0 N = 43.00 2.0 4.0 6.0 8.0
Quality and competence of the IT personnel
168
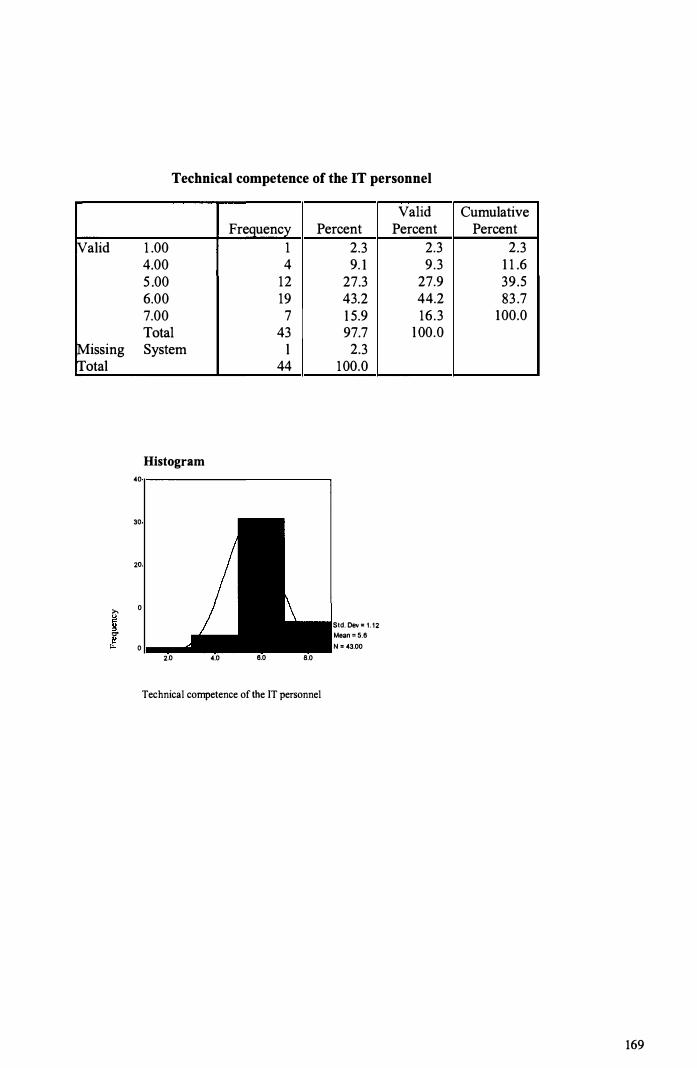
Technical competence of the IT personnel
Valid Cumulative Frequency Percent Percent Percent
�alid 1 .00 1 2.3 2.3 2.3 4.00 4 9. 1 9.3 1 1 .6 5 .00 12 27.3 27.9 39.5 6.00 19 43.2 44.2 83 .7 7.00 7 1 5.9 16 .3 100.0 Total 43 97.7 1 00.0
!Missing System 1 2.3 rl'otal 44 100.0
Histogram 40
30
20
>, 0
Std. Dev = 1 .12 O' Mean = 5.6
0 N = 43.00 2.0 4.0 6.0 8.0
Technical competence of the IT personnel
169

Valid
!Missing rrotal
I
Effort extended by IT personnel to create new systems
Frequency Percent 1 .00 1 2.3 3 .00 3 6.8 4.00 9 20.5 5 .00 16 36.4 6.00 1 1 25 .0 7 .00 2 4.5 Total 42 95.5 System 2 4.5
44 100.0
Histogram 30�-----------�
20
0 2.0 4.0 6.0 8.0
Std. Dev = 1.16 Mean = 4.9 N = 42.00
Effort extended by IT personnel to create new systems
Valid Cumulative Percent Percent
2.4 2.4 7 . 1 9.5
2 1 .4 3 1 .0 38 . 1 69.0 26.2 95.2 4.8 100.0
100.0
170
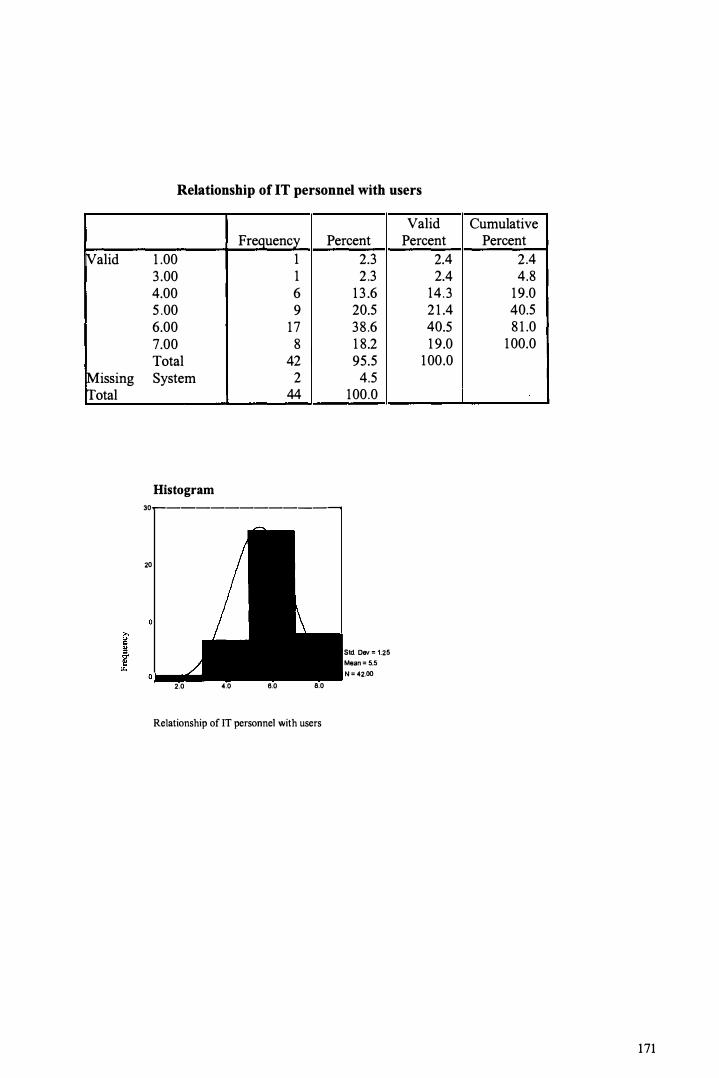
�alid
Missing rrotal
Relationship of IT personnel with users
Frequency Percent 1 .00 1 2.3 3 .00 1 2.3 4.00 6 1 3 .6 5 .00 9 20.5 6.00 17 38 .6 7.00 8 1 8.2 Total 42 95.5 System 2 4.5
44 100.0
Histogram
30------------�
20
2.0 4.0 6.0 8.0
Relationship of IT personnel with users
Std. Dev = 1.25 Mean = 5.5 N = 42.00
Valid Percent
2.4 2.4
14.3 2 1 .4 40.5 1 9.0
100.0
Cumulative Percent
2.4 4.8
19.0 40.5 8 1 .0
100.0
171

�alid
Missing rrotal
Reviewing the objectives of IT in the company
Frequency Percent 3 .00 1 2.3 4.00 6 1 3 .6 5 .00 8 1 8.2 6.00 1 8 40.9 7 .00 10 22.7 Total 43 97.7 System 1 2.3
44 100.0
Histogram 20�-------------,
3.0 4.0 5.0 6.0 7.0
Std. Dev = 1.06 Mean = 5.7 N = 43.00
Reviewing the objectives of IT in the company
Valid Percent
2.3 14.0 1 8.6 4 1 .9 23.3
100.0
Cumulative Percent
2.3 1 6.3 34.9 76.7
100.0
172

Valid
!Missing IT'otal
Quantifying all IT costs
Frequency Percent 3 .00 2 4.5 4.00 3 6.8 5 .00 8 1 8 .2 6.00 1 8 40.9 7.00 12 27.3 Total 43 97.7 System 1 2.3
44 100.0
Histogram 20,---------------,
3.0 4.0 5.0
Quantifying all IT costs
6.0 7.0
Std. Dev = 1.07 Mean = 5.8 N = 43.00
Valid Cumulative Percent Percent
4.7 4.7 7.0 1 1 .6
1 8 .6 30.2 4 1 .9 72. 1 27.9 100.0
100.0
173

K'alid
!Missing rrotal
I
The effectiveness/efficiency of IT operations
Frequency Percent 3 .00 1 2.3 4.00 2 4.5 5 .00 8 1 8 .2 6.00 23 52.3 7.00 9 20.5 Total 43 97.7 System 1 2.3
44 100.0
Histogram 30,---------------,
20
3.0 4.0 5.0 6.0 7.0
Std. Dev = .69 Mean = 5.9 N = 43.00
The effectiveness/efficiency of IT operations
Valid Percent
2.3 4.7
1 8 .6 53 .5 20.9
100.0
Cumulative Percent
2.3 7.0
25.6 79. 1
1 00.0
174
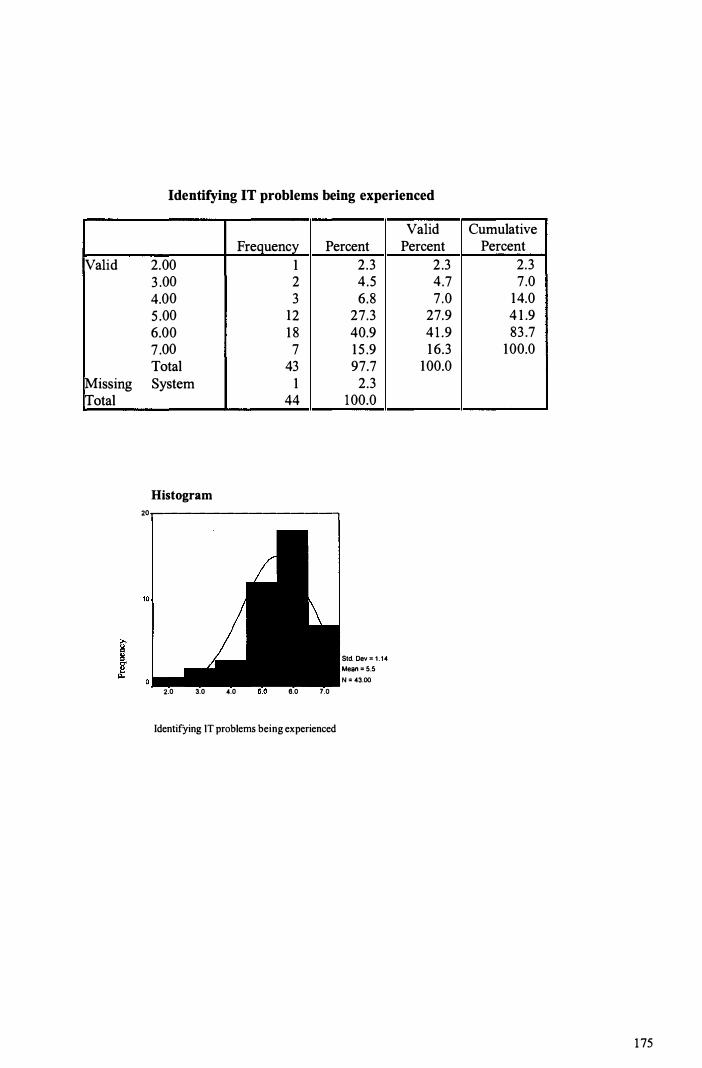
!Valid
Missing Total
Identifying IT problems being experienced
Frequency Percent 2.00 1 3 .00 2 4.00 3 5 .00 12 6.00 1 8 7 .00 7 Total 43 System 1
44
Histogram 20..----------------,
2.0 3.0 4.0 6.0 7.0
Identifying IT problems being experienced
2.3 4.5 6.8
27.3 40.9 1 5 .9 97.7 2.3
100.0
Std. Dev = 1.14 Mean = 5.5 N = 43.00
Valid Percent
2 .3 4.7 7 .0
27.9 41 .9 1 6.3
100.0
Cumulative Percent
2.3 7 .0
14.0 4 1 .9 83 .7
100.0
175
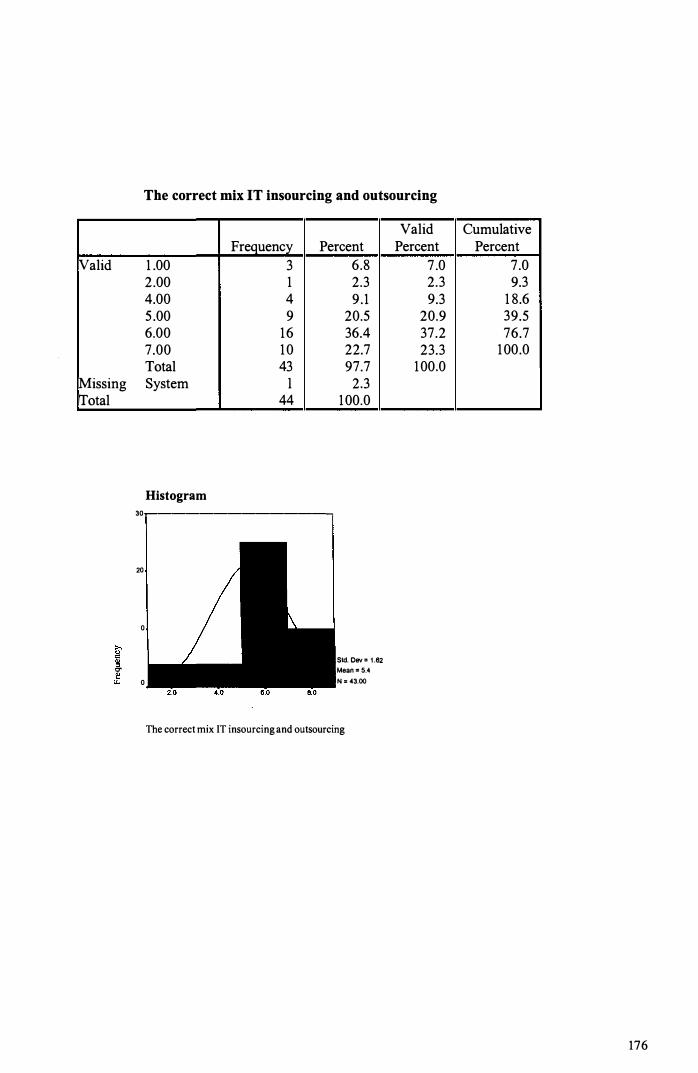
The correct mix IT insourcing and outsourcing
Valid Cumulative Frequency Percent Percent Percent
Valid 1 .00 3 6.8 7 .0 7.0 2.00 1 2.3 2.3 9.3 4.00 4 9.1 9.3 1 8.6 5 .00 9 20.5 20.9 39.5 6.00 16 36.4 37.2 76.7 7.00 10 22.7 23.3 100.0 Total 43 97.7 100.0
Missing System 1 2.3 Total 44 100.0
Histogram 30,---------------,
20
0
Std. Dev = 1 .62 O" Mean = 5.4
0 N = 43.00
The correct mix IT insourcing and outsourcing
176

K,' alid
!Missing rl'otal
IT function too critical to relinquish to a third party
Frequency Percent 1 .00 1 2.00 8 3 .00 6 4.00 6 5 .00 9 6.00 9 7 .00 3 Total 42 System 2
44
Histogram 10,-
--------::=-::'.------,
1.0 2.0 3.0 4.0 5.0 6.0 7.0
2.3 1 8 .2 1 3 .6 1 3 .6 20.5 20.5 6.8
95.5 4.5
100.0
Std. Dev = 1 .68 Mean = 4.3 N = 42.00
IT function too critical to relinquish to a third party
Valid Percent
2.4 1 9.0 14.3 14.3 2 1 .4 2 1 .4 7 . 1
100.0
Cumulative Percent
2.4 2 1 .4 35 .7 50.0 7 1 .4 92.9
100.0
177
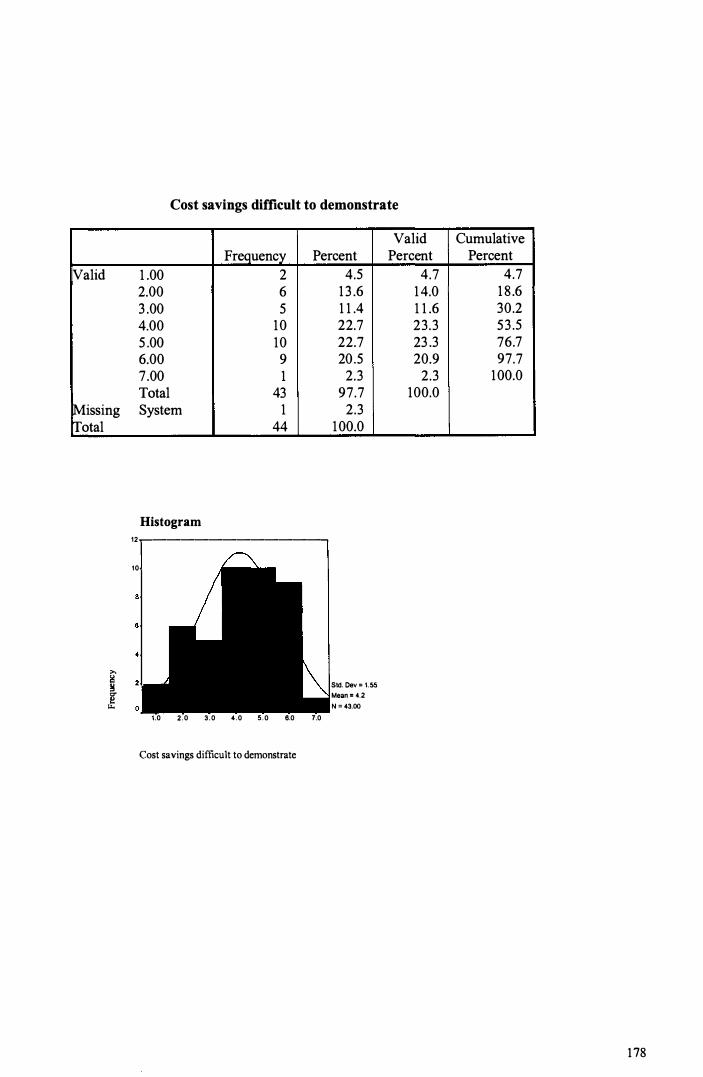
!Valid
!Missing rl'otal
I
Cost savings difficult to demonstrate
Frequency Percent 1 .00 2 2.00 6 3 .00 5 4.00 10 5 .00 10 6.00 9 7 .00 1 Total 43 System 1
44
Histogram 12-------------�
10
1.0 2:0 3.0 4.0 5.0 6.0 7.0
Cost savings difficult to demonstrate
4.5 1 3 .6 1 1 .4 22.7 22.7 20.5 2.3
97.7 2.3
100.0
Sid. Dev = 1.55 Mean = 4.2 N = 43.00
Valid Percent
4.7 14.0 1 1 .6 23.3 23 .3 20.9 2.3
100.0
Cumulative Percent
4.7 1 8 .6 30.2 53 .5 76.7 97.7
100.0
178

!Valid
Missing Total
J
Concerns about managing the outsourcing vendor
Frequency 1 .00 1 2.00 2 3 .00 1 4.00 10 5 .00 10 6.00 1 5 7 .00 4 Total 43 System 1
44
Histogram
Percent 2.3 4.5 2.3
22.7 22.7 34. 1 9 . 1
97.7 2.3
100.0
S1d. Dev = 1.37 Mean = 5.0 N = 43.00
1.0 2.0 3.0 4,0 5.0 6.0 7.0
Concerns about managing the outsourcing vendor
Valid Percent
2.3 4.7 2.3
23 .3 23 .3 34.9 9.3
100.0
Cumulative Percent
2.3 7 .0 9.3
32.6 55 .8 90.7
100.0
179
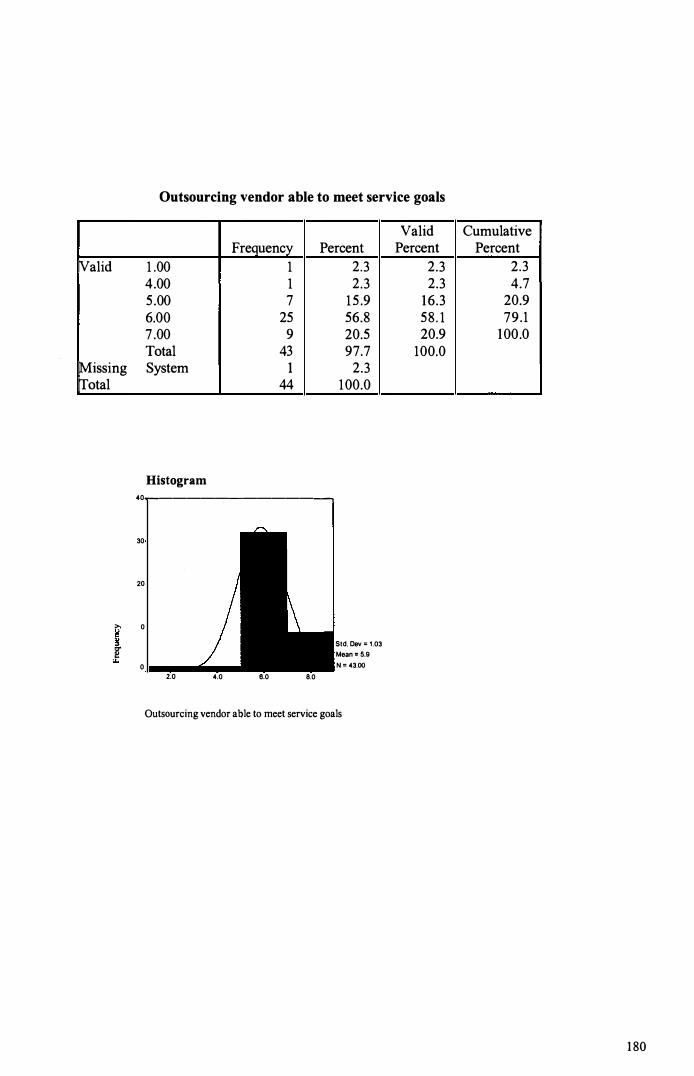
Outsourcing vendor able to meet service goals
Valid Cumulative Frequency Percent Percent Percent
!Valid 1 .00 1 2.3 2.3 2.3 4.00 1 2.3 2.3 4.7 5 .00 7 15 .9 16.3 20.9 6.00 25 56.8 58. 1 79.1 7 .00 9 20.5 20.9 100.0 Total 43 97.7 100.0
Missing System 1 2.3 rrotal 44 100.0
Histogram 40--------------,
30
20
>, 0
Std. Dev = 1.03
[ Mean = 5.9 N = 43.00 0
2.0 4.0 6.0 8.0
Outsourcing vendor able to meet service goals
1 80

�alid
!Missing rrotal
Cost savings in IT personnel being sought
Frequency Percent 1 .00 2 2.00 2 3 .00 10 4.00 9 5 .00 8 6.00 10 7.00 2 Total 43 System 1
44
Histogram 12--------------,
10
2
0 1.0 2.0 3.0 4.0 5.0 6.0 7.0
Cost savings in IT personnel being sought
4.5 4.5
22.7 20.5 1 8 .2 22.7 4.5
97.7 2.3
100.0
Std. Dev = 1 .52 Mean = 4.3 N = 43.00
Valid Percent
4.7 4.7
23.3 20.9 1 8.6 23 .3 4.7
100.0
Cumulative Percent
4.7 9.3
32.6 53 .5 72. 1 95 .3
100.0
181
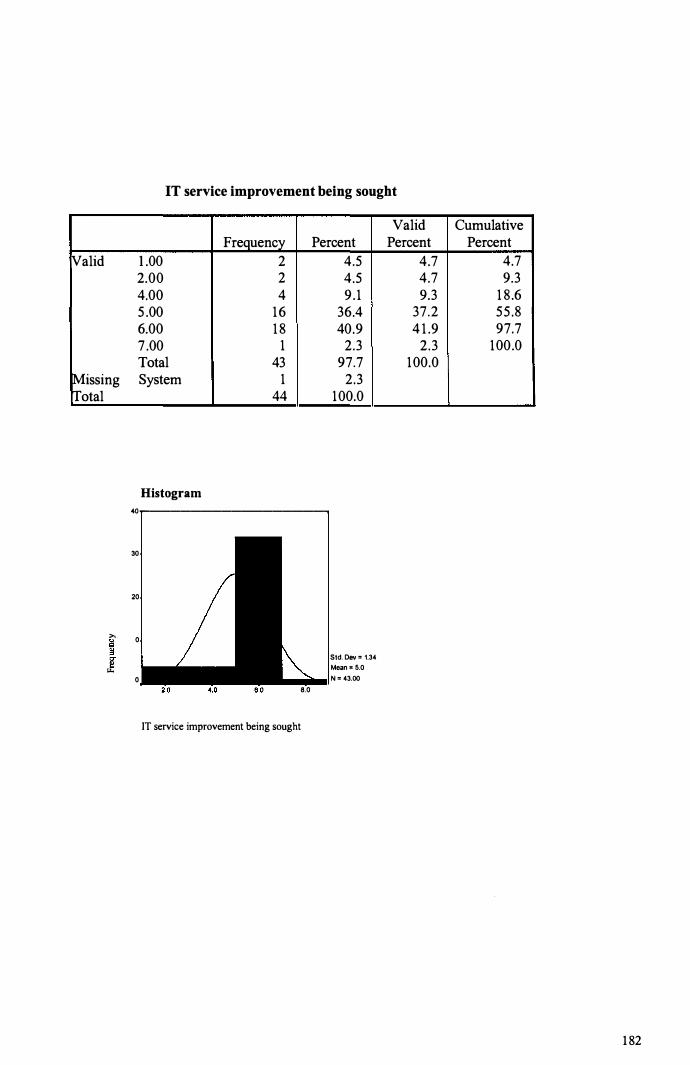
IT service improvement being sought
Valid Cumulative Frequency Percent Percent Percent
Valid 1 .00 2 4.5 4.7 4.7 2.00 2 4.5 4.7 9.3 4.00 4 9 . 1 9.3 1 8 .6 5 .00 16 36.4 37.2 55 .8 6.00 1 8 40.9 4 1 .9 97.7 7 .00 1 2.3 2.3 100.0 Total 43 97.7 100.0
Missing System 1 2.3 Total 44 100.0
Histogram 40..------------------�
30
20
>, 0
Std. Dev = 1.34 Mean = 5.0 ""
0 N = 43.00 8.0
IT service improvement being sought
182

Valid
Missing Total
I
In-house skills to tackle a specific IS function
Frequency Percent 1 .00 I 2.3 2.00 2 4.5 3 .00 2 4.5 4.00 1 3 29.5 5 .00 9 20.5 6.00 14 3 1 .8 7 .00 2 4.5 Total 43 97.7 System I 2.3
44 100.0
Histogram
16,----------------,
14
12
10
1.0 2.0 3.0 4.0 5.0 6.0 7.0
Std. Dev = 1.34
Mean = 4.6
N : 43.00
In-house skills to tackle a specific IS function
Valid Percent
2.3 4.7 4.7
30.2 20.9 32.6 4.7
100.0
Cumulative Percent
2.3 7 .0
1 1 .6 4 1 .9 62.8 95.3
100.0
1 83
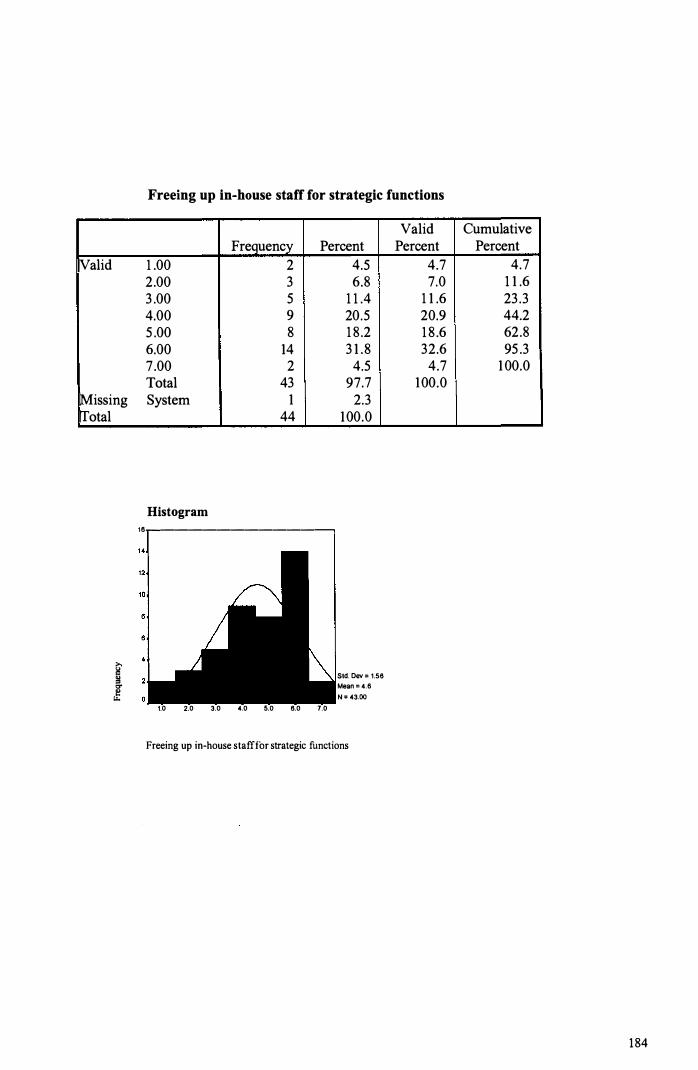
[Valid
Missing rrotal
J
Freeing up in-house staff for strategic functions
Frequency Percent 1 .00 2 2.00 3 3 .00 5 4.00 9 5 .00 8 6.00 14 7 .00 2 Total 43 System 1
44
Histogram 16--------------,
1.0 2.0 3.0 4.0 5.0 6.0 7.0
4.5 6.8
1 1 .4 20.5 1 8 .2 3 1 .8 4.5
97.7 2.3
100.0
Std. Dev = 1.56 Mean = 4.6 N = 43.00
Freeing up in-house staff for strategic functions
Valid Percent
4.7 7.0
1 1 .6 20.9 1 8 .6 32.6 4.7
100.0
Cumulative Percent
4.7 1 1 .6 23 .3 44.2 62.8 95 .3
1 00.0
184

!Valid
Missing Total
J
The IT function is a core business
Frequency Percent 1 .00 3 2 .00 4 3 .00 5 4.00 1 1 5 .00 5 6.00 13 7 .00 2 Total 43 System 1
44
Histogram 14-------------�
1.0 2:0 3:0 4:0 5.0 s:o 7.0
The IT function is a core business
6.8 9 .1
1 1 .4 25.0 1 1 .4 29.5 4.5
97.7 2.3
100.0
Std. Dev = 1.67 Mean = 4.3 N = 43.00
Valid Percent
7 .0 9 .3
1 1 .6 25.6 1 1 .6 30.2 4.7
100.0
Cumulative Percent
7 .0 1 6.3 27.9 53 .5 65 . 1 95.3
100.0
185

K,'alid
I
The IT function requires expertise
Frequency Percent 2.00 2 3 .00 3 4.00 5 5 .00 16 6.00 1 5 7 .00 3 Total 44
Histogram 201..-------------
10
0
2.0 3:0 4.o s:o s.o 1.0
The IT function requires expertise
4.5 6.8
1 1 .4 36.4 34. 1 6.8
100.0
Std. Dev = 1 .20 Mean = 5.1 N = 44.00
Valid Percent
4.5 6.8
1 1 .4 36.4 34. 1 6.8
100.0
Cumulative Percent
4.5 1 1 .4 22.7 59. 1 93 .2
100.0
186

!Valid
Potential loss of control over the IT function
Frequency Percent 1 .00 1 2 .00 6 3 .00 10 4.00 3 5 .00 10 6 .00 8 7.00 6 Total 44
Histogram 12....--------------,
10
1.0 2.0 3.0 4.0 5.0 6.0 7.0
Potential loss of control over the IT function
2.3 1 3 .6 22.7
6.8 22.7 1 8.2 1 3 .6
100.0
Std. Dev = 1 .74 Mean = 4.4 N = 44.00
Valid Percent
2.3 1 3 .6 22.7
6 .8 22.7 1 8 .2 1 3 .6
100.0
Cumulative Percent
2.3 1 5 .9 38.6 45.5 68.2 86.4
100 .0
1 87

Valid
� l
The level of IT service provided
Frequency Percent 2.00 1 3 .00 1 4.00 4 5 .00 16 6 .00 1 7 7.00 5 Total 44
Histogram 20�------------�
CJ
10
2.0 3.0 4.0 5.0 6.0 7.0
The level of IT service provided
2.3 2.3 9 . 1
36.4 38.6 1 1 .4
100.0
Std. D ev = 1.04 Mean = 5.4 N = 44.00
Valid Percent
2.3 2.3 9. 1
36.4 38 .6 1 1 .4
100.0
Cumulative Percent
2.3 4.5
1 3 .6 50.0 88.6
100.0
188
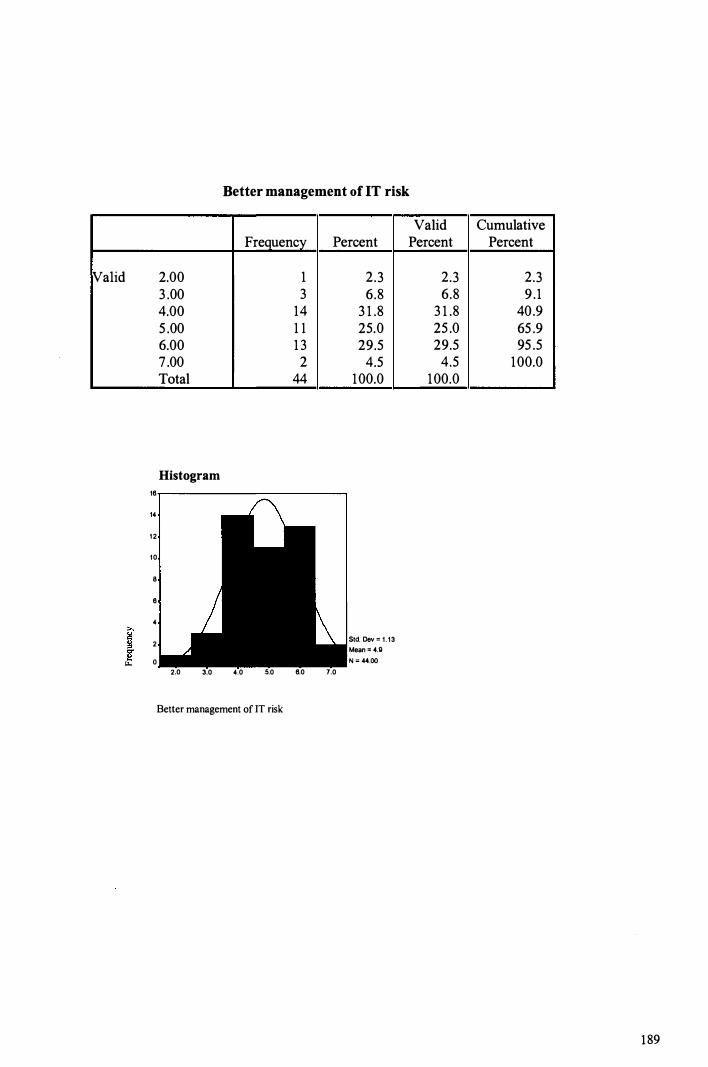
Valid
16
14
12
10
8
6
4
2
0 �
Better management of IT risk
2.00 3 .00 4.00 5 .00 6.00 7 .00 Total
Histogram
2.0 3.0 4.0
Frequency Percent
1 3
14 1 1 1 3 2
44
5.0 6.0 7.0
2.3 6.8
3 1 .8 25.0 29.5 4.5
100.0
Std. Dev = 1 . 13 Mean = '4.Q N = 44.00
Better management of IT risk
Valid Percent
2.3 6.8
3 1 .8 25 .0 29.5 4.5
100.0
Cumulative Percent
2.3 9 . 1
40.9 65 .9 95 .5
100.0
189
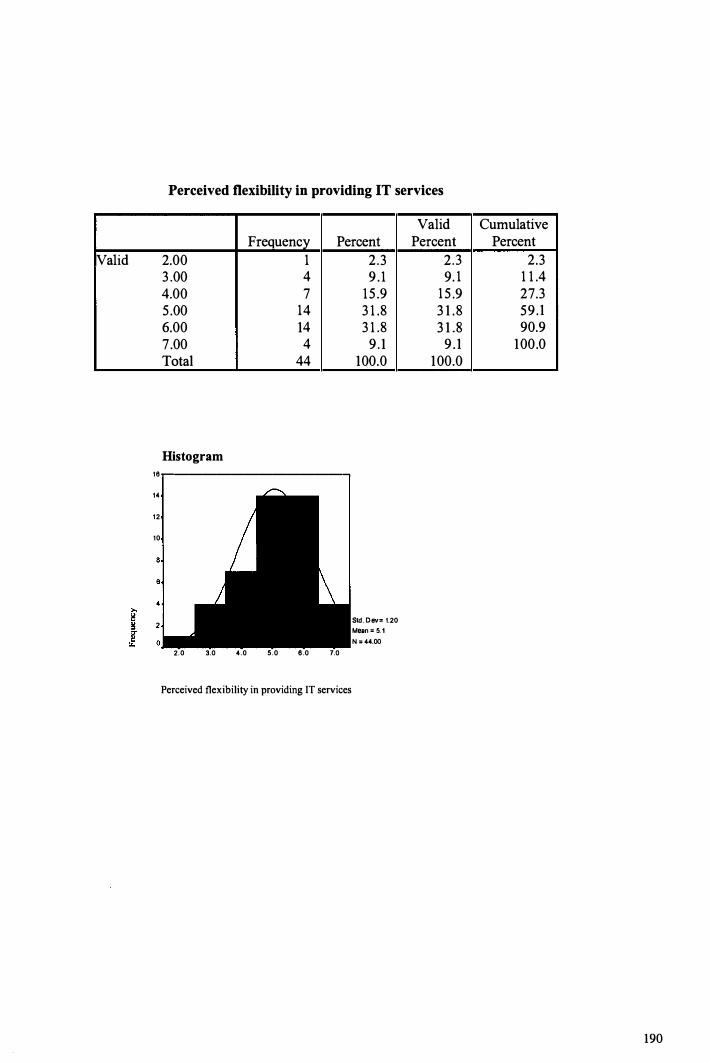
!Valid
Perceived flexibility in providing IT services
Frequency Percent 2.00 1 3 .00 4 4.00 7 5 .00 14 6.00 14 7 .00 4 Total 44
Histogram 16.----------------,
14
12
10
2.0 3.0 4.0 5.0 6.0 7.0
Perceived flexibility in providing IT services
2.3 9 . 1
1 5 .9 3 1 .8 3 1 .8 9 . 1
100.0
Std. Dev= 1.20 Mean = 5.1 N = 44.00
Valid Percent
2.3 9. 1
1 5 .9 3 1 .8 3 1 .8 9 . 1
100.0
Cumulative Percent
2.3 1 1 .4 27.3 59 . 1 90.9
100.0
190

�alid
I
Reduced cost of IT function
Frequency Percent 2.00 2 4.5 3 .00 10 22.7 4.00 1 1 25 .0 5 .00 8 1 8.2 6.00 8 1 8.2 7 .00 5 1 1 .4 Total 44 100.0
Histogram 12,---------,-===-------,
10
0 2.0 3.0 4.0 5.0 6.0 7.0
Reduced cost of IT function
Std. Dev = 1 .44 Mean = 4.6 N = 44.00
Valid Cumulative Percent Percent
4.5 4.5 22.7 27.3 25 .0 52.3 1 8 .2 70.5 1 8 .2 88.6 1 1 .4 100.0
100.0
191
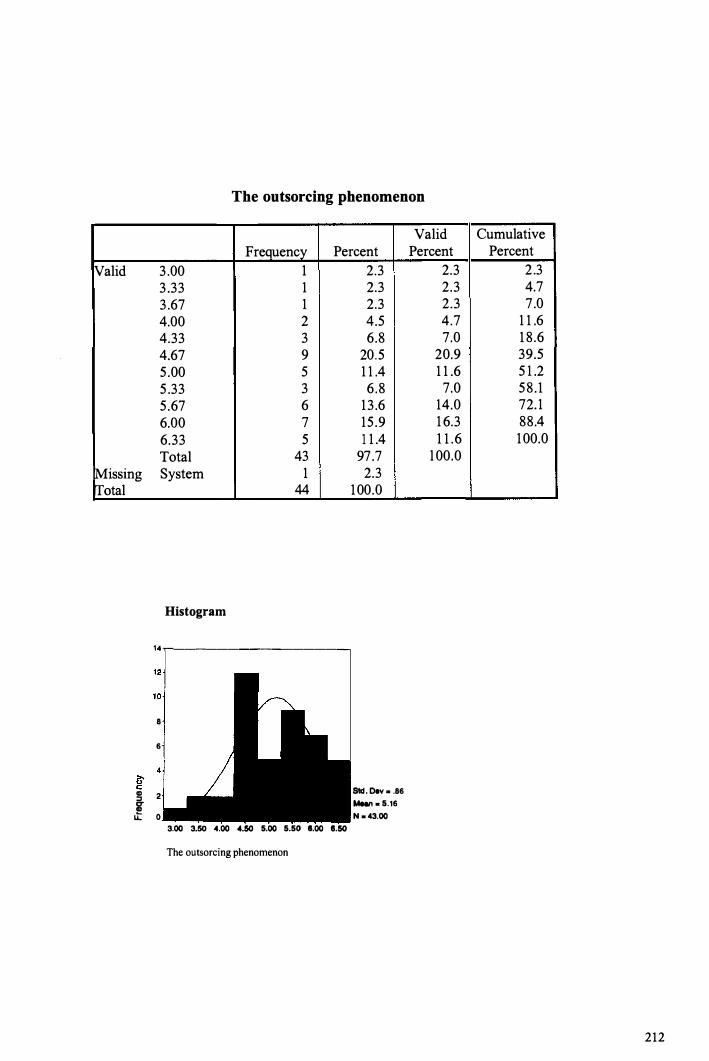
The outsorcing phenomenon
Frequency Percent Valid 3 .00 1
3 .33 1 3 .67 1 4.00 2 4.33 3 4.67 9 5 .00 5 5 .33 3 5 .67 6 6.00 7 6.33 5 Total 43
!Missing System 1 Total 44
Histogram
14 .-----------------
8
6
!l 2 5f U: 0
3.00 3.50 4.00 4.50 5.00 5.50 1.00 8.50
The outsorcing phenomenon
2.3 2.3 2.3 4.5 6.8
20.5 1 1 .4 6 .8
13 .6 15 .9 1 1 .4
97.7 2.3
100.0
Std. Dev • .86 Mean • 5.16 N • 43.00
Valid Percent
2.3 2.3 2.3 4.7 7.0
20.9 1 1 .6 7.0
14.0 1 6.3 1 1 .6
1 00.0
Cumulative Percent
2 .3 4.7 7.0
1 1 .6 1 8 .6 39.5 5 1 .2 58 . 1 72. 1 88.4 100.0
212

�alid
Missing lfotal
Organisational needs and circumstances
Valid Frequency Percent Percent
3 .25 1 2.3 3 .50 1 2.3 3 .63 1 2.3 4. 1 3 1 2.3 4.38 3 6.8 4.50 4 9 . 1 4.63 2 4.5 4.75 2 4.5 4.88 6 1 3 .6 5 .00 3 6.8 5 . 1 3 4 9 . 1 5 .25 5 1 1 .4 5 .38 1 2.3 5 .50 2 4.5 5 .75 2 4.5 5 .88 3 6.8 6 . 1 3 1 2.3 6.38 1 2.3 Total 43 97.7 System 1 2.3
44 100.0
Histogram
1 6r-
����������������
14
1 2 1
I 101
ei
� 4 C G> ::, 2
! 0
3.50 4.00 4.50 5.00 5.50 6.00 6.50
Organisational needs and circumstances
Std. Dev • .66 Mean - 4.96
N • 43.00
2.3 2.3 2.3 2.3 7.0 9.3 4.7 4.7
14.0 7 .0 9.3
1 1 .6 2.3 4.7 4.7 7.0 2.3 2.3
1 00.0
Cumulative Percent
2.3 4.7 7 .0 9.3
16 .3 25.6 30.2 34.9 48.8 55 .8 65 . 1 76.7 79. 1 83 .7 88 .4 95.3 97.7 100.0
213
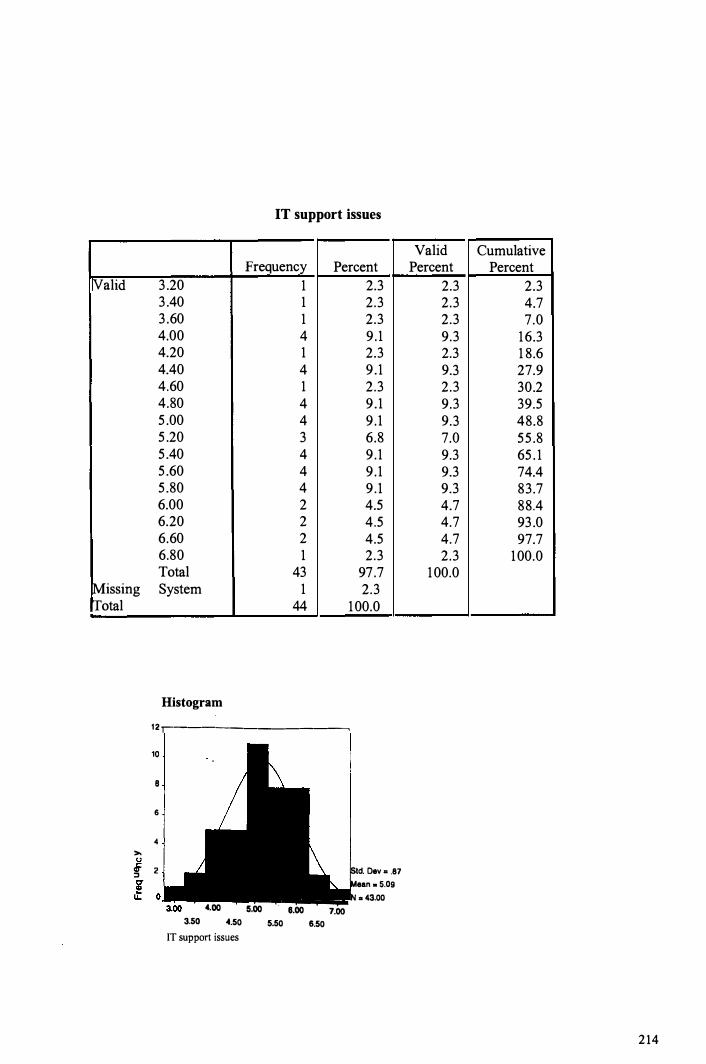
IT support issues
Frequency Percent K'alid 3 .20 1 2.3
3 .40 1 2.3 3 .60 1 2.3 4.00 4 9 . 1 4.20 1 2.3 4.40 4 9 . 1 4.60 1 2.3 4.80 4 9 . 1 5 .00 4 9 . 1 5 .20 3 6.8 5 .40 4 9 . 1 5 .60 4 9 . 1 5 .80 4 9 . 1 6.00 2 4.5 6.20 2 4.5 6.60 2 4.5 6.80 1 2.3 Total 43 97.7
!Missing System 1 2.3 tfotal 44 100.0
Histogram
12,-----------------,
10
8
6
4 >.
� 2
4.oo 5·."oo_""'"_e•.00-... -1".oo-3.so 4.50 5.50 &.50
IT support issues
Std. Dev = .87
Mean • 5.09
N = 43.00
Valid Cumulative Percent Percent
2.3 2.3 2.3 4.7 2.3 7.0 9.3 16.3 2.3 1 8.6 9.3 27.9 2.3 30.2 9.3 39.5 9.3 48.8 7.0 55 .8 9.3 65 . 1 9.3 74.4 9.3 83.7 4.7 88.4 4.7 93 .0 4.7 97.7 2.3 100.0
100.0
214
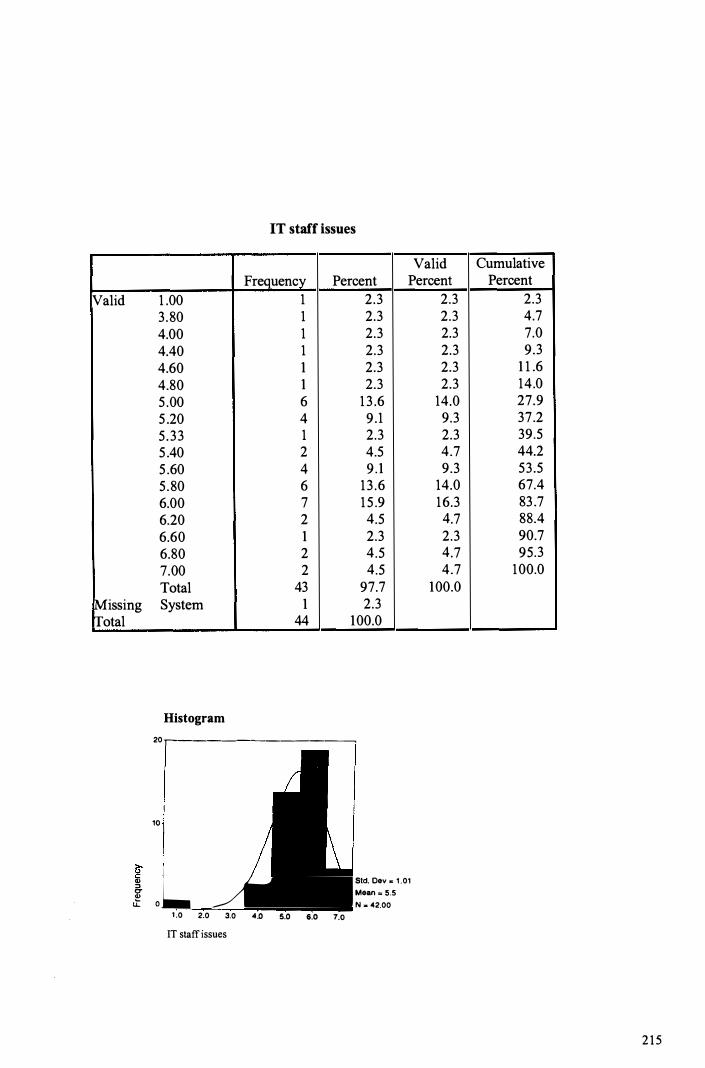
IT staff issues
Frequency Percent !Valid 1 .00 1 2.3
3 .80 1 2.3 4.00 1 2.3 4.40 1 2.3 4.60 1 2.3 4.80 1 2.3 5 .00 6 1 3 .6 5 .20 4 9 . 1 5 .33 1 2.3 5 .40 2 4.5 5 .60 4 9 . 1 5 .80 6 13 .6 6.00 7 1 5 .9 6.20 2 4.5 6.60 1 2.3 6.80 2 4.5 7.00 2 4.5 Total 43 97.7
!Missing System 1 2.3 tfotal 44 100.0
Histogram
20r--
-----------�
10
� L __AIIIIIIIIIIII
Std. Dev E l .01
g M� = U LL O N z 42.00
1 .0 2.0 3.0 4.0 5.0 6.0 7.0
IT staff issues
Valid Cumulative Percent Percent
2.3 2.3 2.3 4.7 2.3 7.0 2.3 9.3 2.3 1 1 .6 2.3 14.0
14.0 27.9 9.3 37.2 2.3 39.5 4.7 44.2 9.3 53 .5
14.0 67.4 16.3 83 .7 4.7 88.4 2.3 90.7 4.7 95.3 4.7 100.0
100.0
215
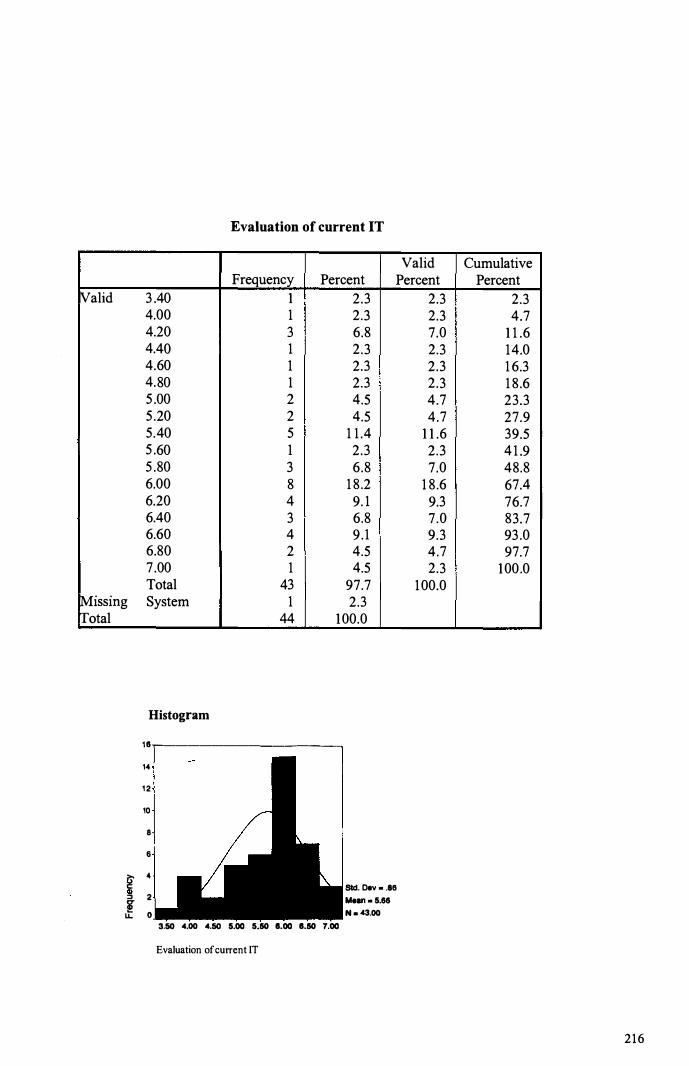
Evaluation of current IT
Valid Frequency Percent Percent
!Valid 3 .40 1 2.3 4.00 1 2.3 4.20 3 6.8 4.40 1 2.3 4.60 1 2.3 4.80 1 2.3 5 .00 2 4.5 5 .20 2 4.5 5.40 5 1 1 .4 5 .60 1 2.3 5 .80 3 6.8 6.00 8 1 8 .2 6.20 4 9. 1 6.40 3 6.8 6.60 4 9 . 1 6.80 2 4.5 7 .00 1 4.5 Total 43 97.7
!Missing System 1 2.3 rrotal 44 100.0
Histogram
16..---------------�
14
12
10
8
6
� 4
::, 2 w LL 0
3.50 4.00 4.50 5.00 5.50 8.00 8.50 7.00
Evaluation of current IT
std. Dev • .86 Mean • 5.66 N • '3.00
2.3 2.3 7.0 2.3 2.3 2.3 4.7 4.7
1 1 .6 2.3 7.0
1 8 .6 9.3 7.0 9.3 4.7 2.3
100.0
Cumulative Percent
2.3 4.7
1 1 .6 14.0 1 6.3 1 8 .6 23.3 27.9 39.5 4 1 .9 48.8 67.4 76.7 83.7 93 .0 97.7
100.0
216
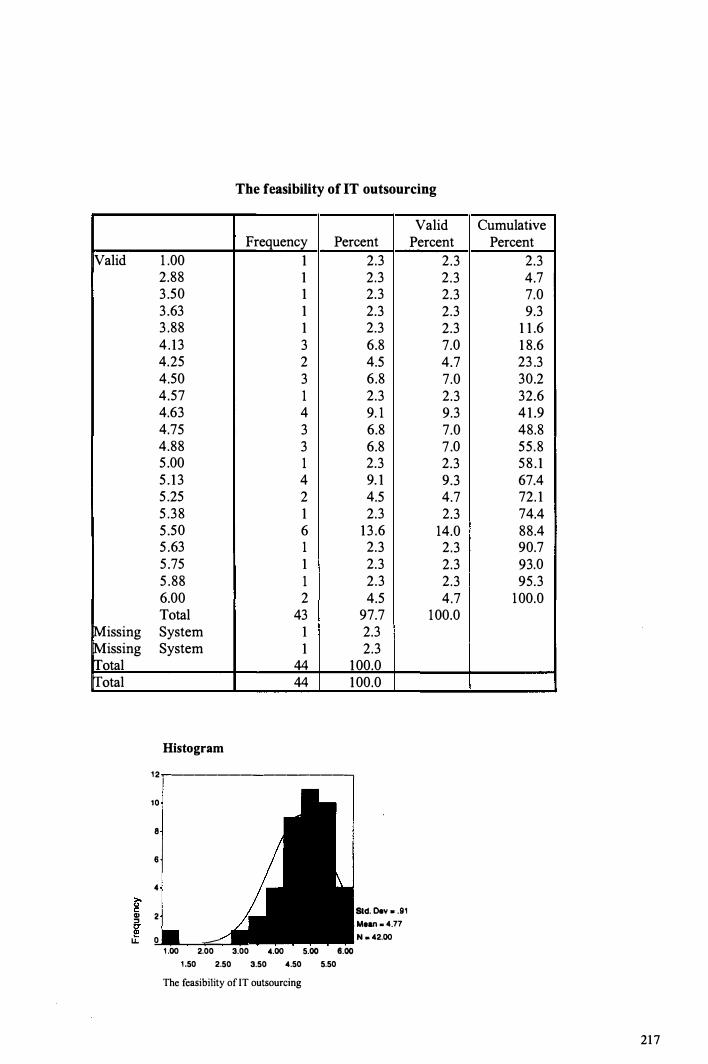
The feasibility of IT outsourcing
Frequency Percent !Valid 1 .00 1 2.3
2.88 1 2.3 3 .50 1 2.3 3 .63 1 2.3 3 .88 1 2.3 4 . 13 3 6.8 4.25 2 4.5 4.50 3 6.8 4.57 1 2.3 4.63 4 9. 1 4.75 3 6.8 4.88 3 6.8 5 .00 1 2.3 5 . 1 3 4 9. 1 5 .25 2 4.5 5 .38 1 2.3 5 .50 6 1 3 .6 5 .63 1 2.3 5 .75 1 2.3 5 .88 1 2.3 6.00 2 4.5 Total 43 97.7
!Missing System 1 2.3 !Missing System 1 2.3 Total rl'otal
44 100.0 44 100.0
Histogram
12 ..-----------------,
10
8
6
4
� 2
u. o .,.. ,--:::: ... 1 .00 2.00 3.00 4.00 5.00 6.00
1 .50 2.50 3.50 4.50 5.50
The feasibility of IT outsourcing
Std. Dev • .91 Mean - 4.77 N • 42.00
Valid Percent
2.3 2.3 2.3 2.3 2.3 7.0 4.7 7.0 2.3 9.3 7.0 7.0 2.3 9.3 4.7 2.3
14.0 2.3 2.3 2.3 4.7
100.0
Cumulative Percent
2.3 4.7 7.0 9.3
1 1 .6 1 8.6 23 .3 30.2 32.6 4 1 .9 48.8 55 .8 58 . 1 67.4 72. 1 74.4 88.4 90.7 93.0 95.3
100.0
217
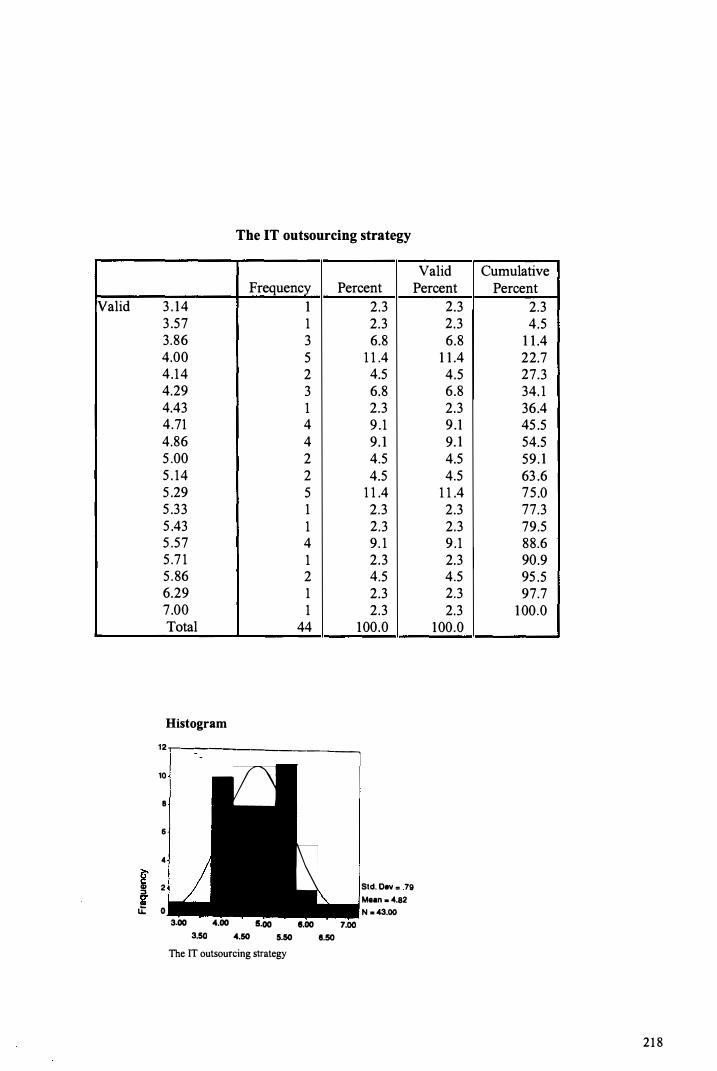
!Valid
The IT outsourcing strategy
Frequency Percent 3 . 14 1 2.3 3 .57 1 2.3 3.86 3 6.8 4.00 5 1 1 .4 4 .14 2 4.5 4.29 3 6.8 4.43 1 2.3 4.71 4 9 . 1 4.86 4 9. 1 5 .00 2 4.5 5 . 14 2 4.5 5 .29 5 1 1 .4 5 .33 1 2.3 5 .43 1 2.3 5 .57 4 9. 1 5 .7 1 1 2 .3 5 .86 2 4.5 6.29 1 2.3 7 .00 1 2.3 Total 44 100.0
Histogram
12 r-������������---.
8 • 10
6
4
! 2 I Std. Dev = .79 Maan • 4.82 N • 43.00 u: 0
3.00 4.00 5.00 8.00 7.00 3.50 4.50 5.50 8.50
The IT outsourcing strategy
Valid Cumulative Percent Percent
2.3 2.3 2.3 4.5 6.8 1 1 .4
1 1 .4 22.7 4.5 27.3 6.8 34. 1 2.3 36.4 9.1 45 .5 9. 1 54.5 4.5 59. 1 4.5 63 .6
1 1 .4 75 .0 2.3 77.3 2.3 79.5 9 . 1 88.6 2.3 90.9 4.5 95 .5 2.3 97.7 2.3 1 00.0
100.0
218

The IT outsourcing vendor selection criteria
Frequency Percent K'alid 2.83 1 2.3
4.25 1 2.3 4.33 1 2.3 4.83 2 4.5 5 .00 2 4.5 5 . 17 2 4.5 5 .33 2 4.5 5 .50 5 1 1 .4 5 .67 4 9 . 1 5 .83 4 9 . 1 6.00 12 27.3 6 . 17 2 4.5 6.33 1 2.3 6.50 1 2.3 6.67 1 2.3 6.83 1 2.3 7.00 1 2.3 Total 43 97.7
Missing System 1 2.3 Total
Histogram 18
-
14
1 2
1 0
8
6
g 4
l :
44
3.50 4.00 4.50 5.00 5.50 8.00 8.50 7.00
100.0
Std. Dev • .73 Mean • 5.14 N • 43.00
The IT outsourcing vendor selection criteria
Valid Percent
2.3 2.3 2.3 4.7 4.7 4.7 4.7
1 1 .6 9.3 9.3
27.9 4.7 2.3 2.3 2.3 2.3 2.3
100.0
Cumulative Percent
2.3 4.7 7.0
1 1 .6 16.3 20.9 25.6 37.2 46.5 55 .8 83.7 88.4 90.7 93 .0 95.3 97.7
100.0
219
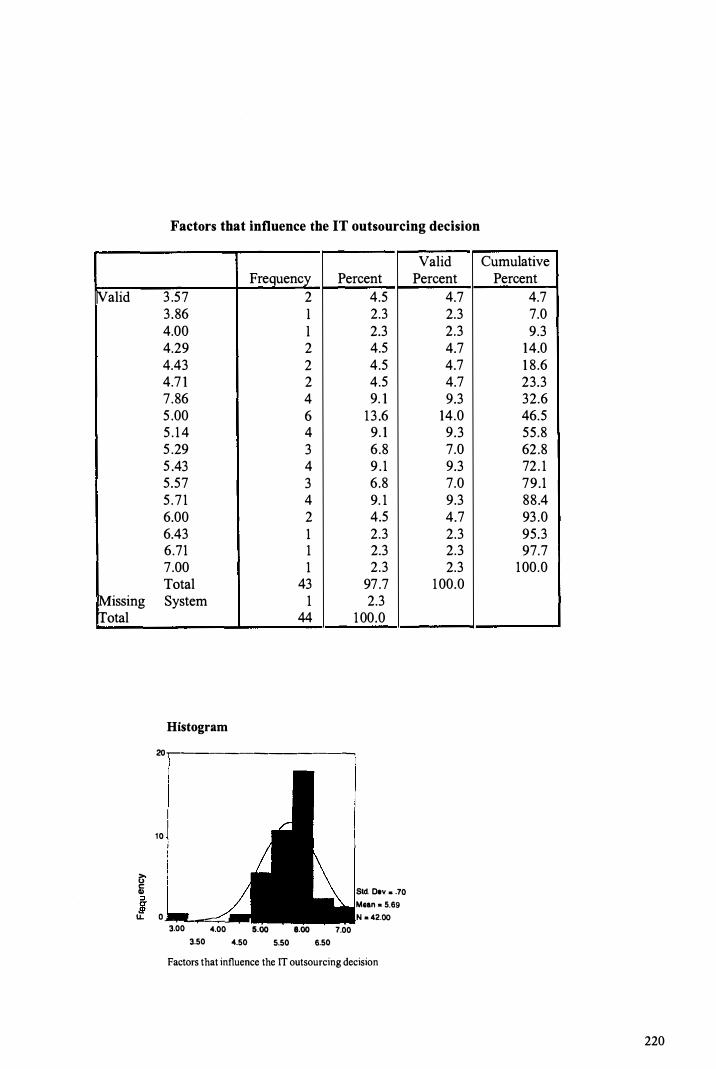
Factors that influence the IT outsourcing decision
�alid
!Missing rrotal
� ii
Frequency Percent 3 .57 2 4.5 3 .86 1 2.3 4.00 1 2.3 4.29 2 4.5 4.43 2 4.5 4.7 1 2 4.5 7 .86 4 9. 1 5 .00 6 13 .6 5 . 14 4 9. 1 5 .29 3 6.8 5 .43 4 9 . 1 5.57 3 6.8 5 .7 1 4 9. 1 6.00 2 4.5 6.43 1 2.3 6.71 1 2.3 7.00 1 2.3 Total 43 97.7 System 1 2.3
44 100.0
Histogram
20,------------�
10
� o.-,...._..,_e::::�--..-
Sid. Dev • .70 Mean • 5.69 N • 42.00
3.00 4.00 5.00 8.00 7.00 3.50 4.50 5.50 6.50
Factors that influence the IT outsourcing decision
Valid Percent
4.7 2.3 2.3 4.7 4.7 4.7 9.3
14.0 9.3 7.0 9.3 7.0 9.3 4.7 2.3 2.3 2.3
100.0
Cumulative Percent
4.7 7.0 9.3
14.0 1 8 .6 23.3 32.6 46.5 55.8 62.8 72. 1 79.1 88.4 93 .0 95.3 97.7
100.0
220

Management satisfiction with IT outsourcing
Frequency Percent �alid 2 . 14 1 2.3
3 .86 1 2.3 4.00 1 2.3 4.29 1 2.3 4.43 2 4.5 4.7 1 2 4.5 7 .86 5 1 1 .4 5 .00 2 4.5 5 . 14 4 9. 1 5 .29 1 2.3 5 .43 7 1 5 .9 5 .57 5 1 1 .4 5 .71 2 4.5 5 .86 3 6.8 6.00 2 4.5 6 .14 1 2.3 6.29 2 4.5 6.43 1 2.3 Total 43 97.7
Missing System 1 2.3 Total 44 100.0
Histogram 1 6 ..--����������������
14
12
10
6
i;' 4
6- 2 !!! u. o ..- . -=<=
2.00 3.00 4.00 5.00 6.00 2.50 3.50 4.50 5.50 6.50
Management satisfiction with IT outsourcing
Std. Dev • .77
Mean • 5.23 N = 43.00
Valid Percent
2.3 2.3 2.3 2.3 4.7 4.7
1 1 .6 4.7 9.3 2.3
16.3 1 1 .6 4.7 7.0 4.7 2.3 4.7 2.3
100.0
Cumulative Percent
2.3 4.7 7.0 9.3
14.0 1 8 .6 30.2 34.9 44.2 46.5 62.8 74.4 79. 1 86.0 90.7 93 .0 97.7
100.0
221


![Finishing Contractor Essentials QA/QC Plan Sample · [CompanyName] identifies a list of work tasks, phases of production, which will be quality controlled. WORK TASKS SERIES OF INSPE](https://img.pdfslide.net/doc/110x75/5ebe2e6d2ee18f6b7f53a691/finishing-contractor-essentials-qaqc-plan-sample-companyname-identifies-a-list.jpg)