Embed Size (px)
Citation preview
Outsourcing Tasks Online:Matching Supply and Demand on Peer-to-Peer Internet Platforms⇤
Zoe Cullen
†, Chiara Farronato
‡
February 2018
Abstract. We study the growth of online peer-to-peer markets. Using data from
TaskRabbit, an expanding marketplace for domestic tasks at the time of our data,
we show that growth is highly heterogeneous across cities. To disentangle the potential
drivers of growth, we separately look at demand and supply imbalances, network e↵ects,
and geographic heterogeneity. First, we find that supply is highly elastic: in periods
when demand doubles, sellers work almost twice as hard, prices hardly increase and the
probability of requested tasks being matched only slightly falls. The first result implies
that in markets where supply can accommodate demand fluctuations, growth relies on
attracting buyers at a faster rate than sellers. Second and perhaps most surprisingly,
we find no evidence of network e↵ects in matching: doubling the number of buyers
and sellers only doubles the number of matches. Third, we show that cities where
the market fundamentals promote e�cient matching of buyers and sellers are also the
cities that grow fast in the number of buyers. This heterogeneity in matching e�ciency
is related to two measures of market thickness: geographic density (buyers and sellers
living close together), and level of task standardization (buyers requesting homogeneous
tasks). The last two results imply that when network e↵ects are limited by the local and
time-sensitive nature of the services exchanged, growth of peer-to-peer markets largely
depends on strategic geographic expansion, and competition can prevent a winner-take-
all equilibrium in the long run.
⇤We would like to thank Jonathan Levin, Susan Athey, and Liran Einav for their mentorship and guidance. Weare also grateful to Juan Alcacer, Hemant Bhargava, Thomas Blake, Tim Bresnahan, Ramon Casadesus-Masanell,Michael Dinerstein, Pascaline Dupas, Andrey Fradkin, Shane Greenstein, Akshaya Jha, Brad Larsen, Michael To↵el,and many other seminar participants for their invaluable comments. We appreciate TaskRabbit for providing essentialdata access. Support for this research was provided through the B.F. Haley and E.S. Shaw Fellowship for Economicsthrough the Stanford Institute for Economic Policy Research.
†Harvard Business School, [email protected]‡Harvard Business School and NBER, [email protected]
1 Introduction
The Internet has facilitated the di↵usion of peer-to-peer markets for the exchange of underutilized
goods and services. Users rent rooms on Airbnb, arrange rides on Uber, and find cleaning and
moving help on TaskRabbit. These markets, which may compete with more traditional service
providers, act as marketplaces for decentralized buyers and sellers to meet up and transact. Their
growth has been highly heterogeneous. Uber, for example, is over ten times as big as Lyft, its
closest competitor in the US. Even within a single marketplace, growth can vary by geography. For
example, although Chicago and New York have similar numbers of hotel rooms, Airbnb is much
bigger in New York than in Chicago.1 This paper studies the drivers of growth of peer-to-peer
markets.
Since peer-to-peer markets help match many fragmented buyers and sellers, their growth de-
pends on balancing demand and supply. It is not enough to attract buyers if sellers’ participation
cannot accommodate their demand. At the same time, sellers will leave the marketplace if demand
is too low. Peer-to-peer markets are also often thought to benefit from scale economies, or net-
work e↵ects: doubling both buyers and sellers can more than double the number of matches, and
can speed up growth. Finally, since many peer-to-peer markets are designed for location-specific
services such as rides or house-cleaning, growth can be faster in some cities than others.
We empirically explore two key strategic decisions a↵ecting the growth of peer-to-peer markets.
The first decision relates to the basic chicken-and-egg problem. In a two-sided market both buyers
and sellers join only if the other side is already on board, so a peer-to-peer market must choose in
what proportions to attract buyers and sellers. Too few sellers per buyer will drive buyers away,
and analogously too few buyers per seller will drive sellers away. The second decision is about
entry across di↵erent geographies. When a peer-to-peer market is designed to match buyers and
sellers of local services, cities can vary in buyer and seller propensity to transact on the platform.
In addition, if network e↵ects exist so that doubling the number of buyers and sellers in one city
more than doubles platform matches, small initial di↵erences across cities can compound into much
larger di↵erences in long-run platform success.
We use data from TaskRabbit, an online marketplace where buyers (formerly known as posters)
can hire sellers (rabbits) to perform a wide range of domestic tasks and errands. We work with
internal data from the company that allows visibility into all posted tasks, o↵ers, and transactions.
The setting allows us to think about the e�ciency and benefits of online marketplaces because
successful matches must happen rapidly and locally. This feature, common across virtually all
1http://www.wired.com/2014/09/ubers-revenue-12-times-bigger-lyfts-new-study-says/, and Farronato
and Fradkin (2018).
1
online peer-to-peer markets, lets us divide the activity on the marketplace into separate sub-markets
by time and geography, and use the large and plausibly exogenous fluctuations in buyers and sellers
to explore the matching of supply and demand.
The opportunity to observe multiple spot markets where variable numbers of buyers and sellers
match while using the same marketplace technology is empirically relevant. In the past a common
challenge that researchers have faced in studies of online platforms is that it can be di�cult to
define and compare separate markets. In studying eBay, for example, it is hard to divide buyers and
sellers into geographically segregated markets given the prevalence of cross-state and cross-country
transactions. There also can be a selection problem related to the fact that only platforms which
have achieved a certain level of success are in use and can be studied. The fact that TaskRabbit
operates essentially separate markets in di↵erent cities, and that we can observe these markets as
they grow over time creates useful variation for understanding demand and supply decisions and
how scale economies might or might not arise.
In principle, there are several ways in which the market might function given fluctuations in
buyers and sellers. One possibility is that with fewer sellers, buyers may not be able to have tasks
performed, either because of higher prices which deter them, or because a smaller fraction of posted
tasks receive o↵ers. Another possibility is that seller labor supply expands. We establish that in this
context, seller e↵ort, or labor supply, is the key equilibrating factor. When demand is high relative
to the number of sellers, the latter sharply expand their e↵ort with very little price adjustment and
little reduction in the ability of buyers to consummate trades. The elastic labor supply is a major
contributor to the growth of the marketplace because it increases the number of matches created
relative to a setting in which seller e↵ort is fixed, and because it increases buyer retention. Because
sellers adjust e↵ort in response to demand increases, the marketplace success depends on the level
of task requests. This observation, combined with the finding that buyers’ posting rate of tasks is
fairly constant, implies that management e↵orts should be focused on attracting buyers more than
sellers.
Perhaps surprisingly we find that matching does not display economies of scale. Doubling the
number of requests and o↵ers for tasks proportionally increases the number of successful matches.
We confirm that this result is consistent with one possible mechanism driving scale economies. As
the marketplace grows within a city, we find that the distance between the location of buyers and
sellers stays constant.
We find large di↵erences across cities in the e�ciency with which requests and o↵ers for tasks
are converted into productive matches. Cities where a higher share of requests and o↵ers are turned
into successful matches are also cities that attract and retain demand at higher rates. We relate
2
matching e�ciency to two measures of market thickness. The first measure is geographic density:
the closer buyers and sellers live to each other, the higher the match rate between tasks and o↵ers.
The second measure is the level of task standardization: match rate is higher when buyers request
tasks in a few standardized categories, such as cleaning or delivery.
We start in Section 2 by presenting the relevant literature on multi-sided platforms, network
e↵ects, and platform growth. Section 3 describes TaskRabbit, in particular how buyers post tasks
such as cleaning or grocery shopping, and how sellers submit o↵ers to perform those tasks. We
then introduce the key motivating fact for our paper: growth is highly heterogeneous across the
cities where TaskRabbit operates. We intentionally separate the growth of a peer-to-peer market
in intensive and extensive margins. The extensive margins include platform adoption by new users
and attrition, while the intensive margins include the frequency of use by current users. We focus
on the intensive margins in Section 4, while in Section 5 we study the extensive margins. We
conclude our work by discussing some managerial implications of our findings for TaskRabbit and
other peer-to-peer markets more generally in Section 6.
2 Literature Review
Our research contributes to a growing literature studying multi-sided platforms as a distinct busi-
ness model (Evans (2003), Rysman (2009), Allon et al. (2012), Hagiu and Wright (2015) ) that
competes with more traditional service providers (Seamans and Zhu (2013), Zervas et al. (2016),
and Farronato and Fradkin (2018)). Specifically, we touch on three distinct themes: platform
market design, network e↵ects, and platform adoption and growth.
From a market design perspective, theoretical work by Rochet and Tirole (2003), Parker and
Van Alstyne (2005), Armstrong (2006), and later generalized by Weyl (2010)) has focused on how
to set platform fees as a function of users’ participation decisions. Other non-price choices, such as
information disclosure and search, have been explored by Boudreau and Hagiu (2009), Casadesus-
Masanell and Halaburda (2014), and Economides and Katsamakas (2006) among others. Until
recently, the empirical platform literature has focused on the interplay between the platform services
and those of complementary service providers, or sellers in our setting (Jiang et al. (2011), Huang
et al. (2013), and Rietveld et al. (2016)).
Lately, a subset of the empirical platform literature has specifically focused on online peer-
to-peer markets such as eBay, Airbnb, and Upwork, that match buyers and sellers of goods and
services. Recent work in this area has studied the micro-structure of specific marketplaces, estimat-
ing search ine�ciencies (Fradkin (2014)), heterogeneity in the matching process and problems of
3
congestion (Horton (2016), Arnosti et al. (2016)), the di↵erences between distinct types of pricing
mechanisms (Einav et al. (2018)), and the consequences of search frictions and platform design for
price competition (Dinerstein et al. (2014) and Li et al. (2016)). There is also a large literature on
trust and reputation systems (Luca and Zervas (2016), and Hui et al. (2016)), which dates back to
early work by Resnick and Zeckhauser (2002), Dellarocas (2003), and Dellarocas and Wood (2008).
Our work is complementary to this literature in that we empirically evaluate market equilibra-
tion in response to fluctuations in demand and supply, and we study the e↵ects of platform design
and how market e�ciency depends on fundamentals at the city level. Our approach abstracts from
many forms of individual heterogeneity and asymmetric information that are emphasized in other
papers, and from issues of strategic pricing and reputation. Instead, we o↵er a framework that
enables us to shed light on the growth of peer-to-peer markets, which are commonly characterized
by highly variable demand and supply (Hall and Krueger (2015) and Cachon et al. (2017)). The
estimation strategy we propose is in principle applicable to other peer-to-peer marketplaces that
match buyers and sellers of local and time-sensitive services.
Our analysis of scale economies touches on the literature on platforms and network e↵ects. We
highlight the main results on entry and competition from this literature. When network e↵ects
are strong, multi-homing is costly, and users have homogeneous needs, users will end up using
only a few platforms (Katz and Shapiro (1985), Zhu and Iansiti (2012), and Gawer and Cusumano
(2014)). At the extreme, a single winner may take the entire market, and because network e↵ects
compound small initial di↵erences a platform that by chance earns an early advantage in adoption
may end up as the leader (Arthur (1989) and Ellison and Fudenberg (2003)). One way to obtain
a small initial advantage is simply by moving first, as emphasized by Lieberman and Montgomery
(1988). Empirical studies such as Bohlmann et al. (2002) and Cennamo and Santalo (2013) have
analyzed the first-mover advantage and winner-take-all hypotheses in a multiplicity of industries,
and Bresnahan and Greenstein (1999) have focused on the evolution of platform competition in the
computer industry.
We find that in this specific context where network e↵ects can only arise locally and in a
time-sensitive manner scale economies per se are not a major determinant of market e�ciency,
for instance compared to basic fixed features such as the geography of a given city. The lack of
scale economies is perhaps the most surprising result, and it challenges some of the theoretical
predictions of the existing literature on first-mover advantage and the winner-take-all equilibrium.
Our results lend support to alternative strategies for platform growth, such as platform envelopment
(Eisenmann et al. (2006)) and product convergence(Greenstein and Khanna (1997)).
When we look at platform growth through adoption and attrition decisions, we also connect to a
4
large literature on product and innovation di↵usion pioneered by Griliches (1957) and Bass (1969),
and how the speed of growth of new technologies can depend on information flows, technology
improvements, and network e↵ects (for example, Tucker (2008) for an empirical analysis and Young
(2009) for a theoretical contribution). Our specific empirical setting requires balanced adoption
of both buyers and sellers, a topic that has been studied mostly theoretically until now (Caillaud
and Jullien (2003), and Hagiu (2009)). In this study we empirically quantify demand and supply
elasticities a way to identify platform’s relative e↵orts in attracting buyers and sellers.
3 Setting and Data
This section describes the TaskRabbit marketplace. We first describe how the marketplace operates,
how tasks are posted, and how o↵ers are made and accepted. We then show that matches are either
made quickly and locally, or not at all. Finally, we provide a first look at di↵erences in market
growth across cities, the issue that motivates our paper, and some preliminary evidence on the
drivers of growth.
3.1 The TaskRabbit Marketplace
TaskRabbit is an online peer-to-peer market that allows posters to outsource domestic tasks to
rabbits.2 Between 2009 and mid-2014, it operated in 18 major cities in the United States, and
London, UK.3 Posters post a description of the requested task in a flexible manner. Rabbits can
search through posted tasks on city-specific lists and respond with o↵ers (Fig. 1). We will refer to
posters as buyers and rabbits as sellers of services.4
Buyers on TaskRabbit can post virtually any sort of domestic tasks or errand (e.g. pet sitting for
a goldfish), but the majority of tasks are relatively standard and generic. The five largest categories
out of the 38 are delivery (20%), moving help (13%), cleaning (10%), minor home repairs (7%),
and shopping (6%).5 These tasks typically do not require sellers with highly specialized skills.
2In 2017, TaskRabbit was acquired by IKEA (https://www.forbes.com/sites/blakemorgan/2017/09/30/3-lessons-learned-from-ikeas-acquisition-of-gig-economy-start-up-taskrabbit.)
3The active cities in the US are, in order of entry: Boston (2008), San Francisco (June 2010), Los Angeles (June2011), New York (July 2011), Chicago (September 2011), Seattle (December 2011), Portland (January 2012), Austin(February 2012), San Antonio (August 2012), Philadelphia and Washington DC (July 2012), Atlanta, Dallas andHouston (August 2013), Miami and San Diego (October 2010) Phoenix and Denver (November 2011).
4Leah Busque first formulated her idea for TaskRabbit when one evening she realized she had ran out of dog food.With her husband she started contemplating the idea of “a place online where we could say we needed dog food, namethe price we’d be willing to pay, and see if there was someone in our neighborhood who would be willing to help usout” (http://www.fatbit.com/fab/young-self-made-millionaires-women-entrepreneurs-making-di↵erence-us-economy-part-1/).
5The 38 task categories include the following, from largest to smallest: Delivery, Moving Help, Cleaning, MinorHome Repairs, Shopping, Research, Furniture Assembly, Yard Work & Removal, Event Sta�ng, Usability Testing,Computer Help, O�ce Administration, Packing & Shipping, Marketing, Organization, Carpentry & Construction,
5
The nature of the tasks implies that services generally are provided locally and on relatively short
notice. Almost all users (93.6% of them) participate in just one city. At the same time, of the
48.5% of tasks that are matched, 97% are filled within one or two days.6
The matching process can work in two ways. A buyer can post a task-specific price and then
accept the first o↵er, or ask for bids and review the prices o↵ered by sellers. Fixed price tasks are
slightly more standardized (65% of them are in the top 5 categories versus 48% of auctions), and
prices are lower ($49 versus $63), but their share on the marketplace, at 41%, has not changed
considerably over time or across cities. About 78% of tasks receive an o↵er, and of them 63% result
in a match. Matches can fail because the buyer finds a better alternative and does not select any
of the bids received, or because the buyer and seller cannot coordinate on specific task details.
Users on TaskRabbit tend to be either buyers or sellers, but not both. Indeed, 80.3% of users
have only ever posted task requests, and 16.3% have only ever submitted o↵ers. The buyers on
the site are predominantly female (55% of buyers) and relatively a✏uent. Among those for which
information is available, the modal buyer is a woman between the age of 35 and 44 with a household
income between $150,000 and $175,000. The sellers are younger and not surprisingly have lower
income. The modal seller is 25-34 years old and has a household income between $50,000 and
$75,000.
Buyers go through a basic verification process that checks their identity on social networks and
their payment method. There is a more rigorous screening process for sellers. Until the spring of
2013, applicants received a background check, a digitized survey of their motivations, skills, and
availability, and were interviewed by TaskRabbit employees to determine their fit. Acceptance rates
of sellers’ applications varied widely. They ranged between 7 and 49% in di↵erent months, and on
average they were very low - only 13.6%. In the spring of 2013 TaskRabbit reduced the amount
of screening in a successful attempt to add more sellers. As of May 2014, the end of our sample
period, the process involved simpler background checks and social controls – Facebook or Linkedin
verification – paired with a system of users’ reviews.
Writing & Editing, Painting, Data Entry, Pet Care, Electrician, Photography, Laundry, Selling Online, Automotive,Web Design & Development, Plumbing, Event Planning, Graphic Design, Cooking & Baking, Videography, Arts& Crafts, Sewing, Executive Assistant, Accounting, Child Care, Senior & Disabled Care. The remaining tasks areposted under “Other”. Category shares of posted tasks are displayed in Table A10 for the categories with a sharehigher than 1%.
6To add to the local and urgent nature of tasks, TaskRabbit’s ranking algorithm prioritizes newly posted taskswithin each city. Indeed, to every seller searching through posted tasks, TaskRabbit shows a list of local tasks, rankedaccording to their posting time (most recent at the top).
6
3.2 Data
Our study uses internal data from TaskRabbit. We focus on the period from June 2010 to May
2014. During this period, TaskRabbit operated in 18 cities, although entry in these cities was
staggered over time. Since we have no record of the actual entry date, we define the month of entry
into a city as the first calendar month in which 20 or more local tasks were posted.7
The data include all posted tasks, o↵ers, and matches that occurred on TaskRabbit during the
study period. We exclude virtual tasks8 (10.4%) and tasks posted in not yet active cities (0.23%).
We also drop 10.3% of tasks that use other assignment mechanisms and keep only auction and
posted price tasks. We merge the tasks with the corresponding o↵ers, and we drop extreme price
outliers (top and bottom 1% in bids or charged prices). To deal with the fact that posted price
tasks occasionally receive multiple o↵ers (6.04% of them did), we only keep the matched o↵er in
case of success, or select one of the received o↵ers at random. This simplification restricts posted
price tasks to receive either one or no o↵ers. Finally, for much of the paper we will aggregate
activity at the city-month level, and drop city-months with less than 50 buyers posting tasks or
less than 20 sellers making o↵ers.
Table 1 shows summary statistics for the data. In the first panel, an observation is a posted
task. Out of all posted tasks 78% receive o↵ers, and those tasks receive 2.8 o↵ers on average. Of
the tasks receiving o↵ers, 63% are successfully completed at an average price of $57. TaskRabbit
charges a 20% commission fee on successful tasks.9
In the second panel of Table 1, an observation is a city-month. We define a buyer to be active
in a city-month if she posts at least one task in that city-month. Analogously, a seller is active if he
submits an o↵er to a task posted within the city-month. On average, there are 708 active buyers
and 255 sellers in a city-month, but there is large variation across cities and months. Each buyer
posts 1.6 tasks, and each seller submits 6.4 o↵ers. The task success rate is 46% and the average
price paid is $56. Of these four variables (tasks per buyer, o↵ers per seller, task match rate, and
prices), the number of o↵ers per sellers varies the most across city-month observations, with limited
variation in tasks per buyer, matches, and prices.
A first key feature of the platform is that its success is highly heterogeneous across geographies.
During the 4-year period we study, TaskRabbit was growing in all cities, but much more rapidly
in some cities than others. Figure 2 plots the number of successful matches for the 10 oldest
7We verified the accuracy of our definition through media coverage of the marketplace and by talking withTaskRabbit employees.
8A task is classified as virtual if the service does not require the seller to be at a specific location. Examplesinclude writing and editing, or usability testing of mobile applications.
9The commission fee can sometimes depart from 20%, for example in the case of coupons, referral bonuses, orother credits that reduce the price paid by buyers without a↵ecting the price received by sellers.
7
cities.10 Over the period considered, some cities grew from a few monthly matches to thousands
of exchanges, like San Francisco and New York, while some others grew at a reduced pace, like
Portland and Seattle. It is quite possible that the way in which the market equilibrates demand
and supply is di↵erent across cities. It might also be the case that scale economies magnify small
initial di↵erences in city growth.
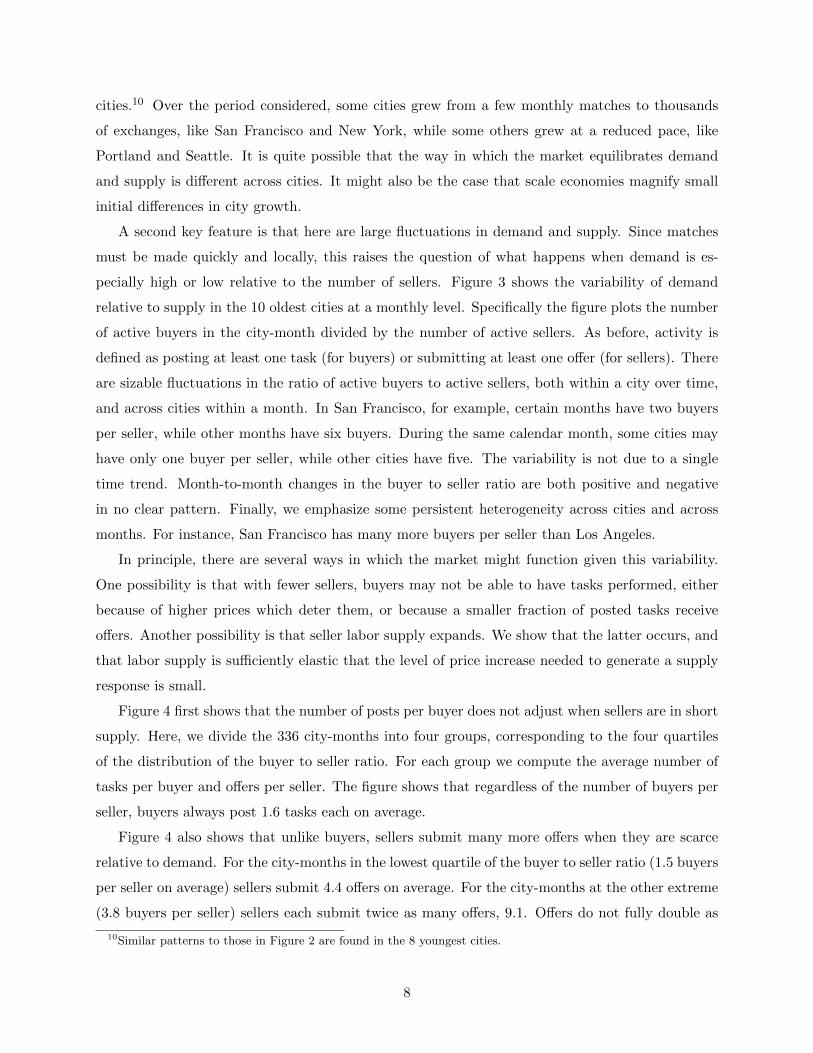
A second key feature is that here are large fluctuations in demand and supply. Since matches
must be made quickly and locally, this raises the question of what happens when demand is es-
pecially high or low relative to the number of sellers. Figure 3 shows the variability of demand
relative to supply in the 10 oldest cities at a monthly level. Specifically the figure plots the number
of active buyers in the city-month divided by the number of active sellers. As before, activity is
defined as posting at least one task (for buyers) or submitting at least one o↵er (for sellers). There
are sizable fluctuations in the ratio of active buyers to active sellers, both within a city over time,
and across cities within a month. In San Francisco, for example, certain months have two buyers
per seller, while other months have six buyers. During the same calendar month, some cities may
have only one buyer per seller, while other cities have five. The variability is not due to a single
time trend. Month-to-month changes in the buyer to seller ratio are both positive and negative
in no clear pattern. Finally, we emphasize some persistent heterogeneity across cities and across
months. For instance, San Francisco has many more buyers per seller than Los Angeles.
In principle, there are several ways in which the market might function given this variability.
One possibility is that with fewer sellers, buyers may not be able to have tasks performed, either
because of higher prices which deter them, or because a smaller fraction of posted tasks receive
o↵ers. Another possibility is that seller labor supply expands. We show that the latter occurs, and
that labor supply is su�ciently elastic that the level of price increase needed to generate a supply
response is small.
Figure 4 first shows that the number of posts per buyer does not adjust when sellers are in short
supply. Here, we divide the 336 city-months into four groups, corresponding to the four quartiles
of the distribution of the buyer to seller ratio. For each group we compute the average number of
tasks per buyer and o↵ers per seller. The figure shows that regardless of the number of buyers per
seller, buyers always post 1.6 tasks each on average.
Figure 4 also shows that unlike buyers, sellers submit many more o↵ers when they are scarce
relative to demand. For the city-months in the lowest quartile of the buyer to seller ratio (1.5 buyers
per seller on average) sellers submit 4.4 o↵ers on average. For the city-months at the other extreme
(3.8 buyers per seller) sellers each submit twice as many o↵ers, 9.1. O↵ers do not fully double as
10Similar patterns to those in Figure 2 are found in the 8 youngest cities.
8

buyers double relative to sellers, so the match rate of tasks slightly declines (Figure 5). However,
the sellers’ intensive margin response, together with buyers’ constant rate of task posting, translate
into a large expansion in the number of trades as the number of buyers per seller increases.
Perhaps surprisingly, transacted prices move very little when sellers are scarce or abundant.
Figure 5 shows the average price of completed tasks for the city-months sorted by the buyer to
seller quartiles. Average transacted price is always between $52 and $59, even if the number of
buyers per seller doubles and each seller chooses to work harder. Putting aside possible issues of
task composition and seller heterogeneity, an apparent implication is that not much price increase
is needed to generate a large intensive margin increase in labor supply.
In the next section we provide a parsimonious framework to think about market equilibration
in the presence of fluctuations in demand and supply, and we attempt to establish causality of these
preliminary findings.
4 Evidence on Short-Run Market Equilibration
In this section, we describe a simple static model of market equilibration, where buyers choose to
post task requests, sellers choose to submit o↵ers, and matches and prices are aggregate functions of
total requests and o↵ers. We also present how we apply the theoretical framework to the TaskRabbit
data. We describe our estimation strategy, discuss our results, and robustness checks.
4.1 Model of a Market for Services
We now propose a parsimonious model of how the TaskRabbit marketplace matches tasks and
o↵ers, and how buyers and sellers make decisions about whether to post tasks and how much
e↵ort to put into making o↵ers. Our modeling approach draws on the literature on frictional
search and matching in labor markets (Pissarides (2000)). We assume for simplicity that buyers
are all identical and in equilibrium choose the same number of tasks to post. Similarly, sellers
are identical and choose the same intensity with which to search and submit o↵ers. We also treat
tasks as homogeneous. Obviously, this is a large simplification, but it does correspond to our
earlier observations that most tasks on TaskRabbit are relatively standard and generic, and that
they do not require specialized skills. More importantly, it allows us to focus on the problem of
widely fluctuating supply and demand and increasing market size, without the complications of a
heterogeneous matching framework. We take long-run participation decisions as given. Instead of
focusing on users’ decision to join or leave the marketplace, we model the choice of how intensely to
use it conditional on participation. Separately, Section 5 looks at adoption and attrition (extensive
9
margins) as additional drivers of growth.
We assume there is a measure B of identical buyers and a measure S of identical sellers. Each
buyer will choose a number of tasks, �, to post. Each seller chooses a number of o↵ers, �, to
make. The total number of services requested in a market is b ⌘ B�, while the total number
of o↵ers submitted is s ⌘ S�. The number of trades between buyers and sellers is given by the
matching function m = M(s, b). M(s, b) is continuous and di↵erentiable, and increasing in both
its arguments. Each request is matched with probability q
b = mb and each o↵er is successful with
probability q
s = ms . We assume that M(s, b) b and M(s, b) s to guarantee that matches
are never larger than total requests or o↵ers. The matching technology displays constant returns
to scale if doubling the number of tasks b and o↵ers s doubles the number of matches m, or
M(2s, 2b) = 2M(s, b). In each match, the buyer pays price p = P (s, b), the seller receives (1� ⌧)p,
and the marketplace keeps ⌧p as commission fee. In particular, price is determined as a function
of services requested and o↵ered, and is assumed to be a continuous and di↵erentiable function,
increasing in b and decreasing in s.11 The price function is invariant to scale if doubling tasks and
o↵ers does not a↵ect the price p, or P (2s, 2b) = P (s, b).
Buyers and sellers choose how many requests to post and how many o↵ers to submit with
full knowledge of the matching and price determination processes, but without the possibility to
a↵ect either of those with their individual choices because each participant is small relative to the
market. Each buyer randomly receives a number of potential needs to outsource.12 Each need is
worth v�p to its buyer, where v is the fixed value of having the task completed. There is a random
cost of posting each task. The buyer’s problem is to choose whether to post each needed service.
The decision is separable across service needs. If a buyer makes a request for a need, she pays
the posting cost and expects payo↵ q
b(v � p). So �, the expected number of requests posted by a
representative buyer, will be increasing in q
b and decreasing in p.
Each seller chooses a level of e↵ort � spent searching through buyers’ requests. An e↵ort level �
corresponds to a discovery process of profitable requests, to which the seller submits o↵ers. Higher
e↵ort � makes it more likely to find a higher number of profitable submissions.13 Specifically, we
assume that the number of suitable tasks identified and o↵ers submitted is a random draw from a
discrete distribution, with mean equal to the chosen e↵ort level � and independent across sellers.
Given this assumption, we will interchangeably refer to � as the level of search e↵ort or the expected
11In fact, several matching models of the labor market assume that the wage is either a parameter altogether orpinned down by other parameters. See, for example, Montgomery (1991) and Hall (2005).
12For the conditions under which a continuum of independent and identically distributed random variables sum toa nonrandom quantity in large economies, see Judd (1985), and Du�e and Sun (2012).
13Specifically, we assume that the distribution of application arrivals for a given � first order stochastically domi-nates the distribution for any �0 �.
10
number of o↵ers submitted by a representative seller. Search e↵ort is costly, and its cost rises at
an increasing rate.14 Conditional on matching a submitted o↵er, the seller’s profit is (1� ⌧)p� c,
where c is the fixed cost of completing the task. So �, the expected number of o↵ers sumbmitted
by a representative seller, will be increasing in q
s and p.15
Equilibrium in the market is defined as a state in which buyers and sellers maximize utility
subject to the matching and pricing technologies, and to expectations of other agents’ behavior.
The equilibrium requires consistency of individual optimal choices (� and �) with expectations
on average behavior in the market. In equilibrium, all buyers choose the same strategy in terms
of the decision to post tasks, which in turn is consistent with the expected posting rate. The
model explains di↵erences in the actual number of requests across buyers as arising from a random
arrival rate of needs and from di↵erent posting costs. Analogously, in equilibrium, all sellers choose
the same level of search intensity, which in turn is consistent with the market average intensity.
Di↵erences in the rate of o↵er submission across sellers arise from the random process with which
they discover profitable requests.
We now apply this framework to TaskRabbit. Our framework envisions a single static market,
while trades occur continuously in the data. To create an empirical analogue, we define distinct
markets in the data. Given that 94% of users post or work in a single city, it is natural to treat cities
as separate. The fact that 97% of successful tasks are matched to o↵ers within 48 hours of posting
suggests segmenting the data in time as well. One option is to treat each city-month (e.g. San
Francisco in October 2013) as a separate market. Within a city-month, we treat buyers and sellers,
as well as their tasks and o↵ers, as homogeneous, following the model, and discuss this further in
Appendix A1. This definition allows us to consider each participant as small relative to the size of
the market, which is our modeling assumption, and also lets us smooth shorter time variation due
to potential task heterogeneity. Other market definitions do not change our qualitative results, as
shown in Appendix A2.
14We model sellers’ search costs as increasing in the intensity of search at an increasing rate. This assumption canbe better understood in terms of time needed before finding a new task to which a seller chooses to make an o↵er.Conditional on a level of e↵ort, it is likely that the first profitable task is easier to find than the second, the secondis easier than the third, and so on. If a seller wanted to double the number of profitable tasks found, his level ofe↵ort would then be more than twice as costly. In addition, search costs are decreasing in the number of total tasksposted. In a market with many posted tasks, a seller is likely to spend less time finding the same number of profitableapplications as in a smaller market. If a seller wanted to send the same expected number of o↵ers in a large markethis level of e↵ort would then be less costly.
15Buyers’ choice to post tasks and sellers’ choice of search e↵ort are not symmetric. On the buy side, there is anexogenous arrival of tasks, and a decision to post each of them separately conditional on arrival. A buyer in need ofmoving help selects whether to post it or find an alternative solution - another service provider or informal help - asa function of the expected value from each option. On the sell side, the setup is truly a choice of marketplace usageintensity. A seller selects his optimal level of search e↵ort, and if he finds profitable tasks he submits o↵ers for sure.In this case, a seller chooses his time allocation between leisure and searching for services to sell as a function of theexpected benefits from the two activities.
11
Our market definition is motivated by several additional considerations. First, we do not sepa-
rate markets along the various task categories - cleaning, furniture assembly, and so on - because
sellers do not specialize: of the sellers who submitted 10 o↵ers or more 63.6% did so in more than
10 categories, and of the sellers who were successfully matched to more than 10 tasks, 43% did so
for tasks in more than 10 categories. Second, we follow TaskRabbit business practice and do not
separate markets into geographic partitions smaller than the metropolitan boundaries.16 Third, we
choose the calendar month as the relevant time window as a way to balance the short time period
over which tasks receive o↵ers with the need to have enough o↵ers and tasks in each market to
estimate match probabilities, average prices, and search and posting intensities.
4.2 Tasks per Buyer and O↵ers per Seller
The theoretical framework above highlighted that buyer decisions to post tasks and seller decisions
to submit o↵ers are a function of match probabilities and prices. These outcomes are a function of
market conditions such as market size and relative numbers of buyers and sellers. When sellers are
scarce relative to buyers, their o↵ers will be more likely to be accepted and pay higher prices. If in
addition the overall number of participants makes the platform search and matching more e�cient,
sellers might find it easier to identify tasks to submit o↵ers to, and their o↵ers might be more likely
to be accepted.
In order to quantify how buyers choose to post tasks and how sellers choose to submit o↵ers as
a function of market size and seller relative scarcity, we estimate OLS regressions of the following
type:
log(yct) = ↵1 log
✓Bct
Sct
◆+ ↵2 log
⇣pSctBct
⌘+ ⌘c + ⌘t + ⌫ct , (1)
where c, t denote city c and year-month t, BctSct
is the buyer to seller ratio,pSctBct is the geometric
average of buyers and sellers, or market size. The outcome is one of two relevant variables: tasks per
buyer, and o↵ers per seller. The vector ⌘c controls for city-specific propensities to use TaskRabbit
which are time invariant. Similarly, ⌘t captures time-specific adjustments to usage intensities that
are common across all active cities. Therefore ↵1 and ↵2 are identified from variation in the
number of active buyers and sellers within cities over time and within months across cities. We
cluster standard errors at the city level.
What ⌫ct represents is a shock to user propensity to post tasks and submit o↵ers that we assume
to be independent of prior decisions to join or stay on TaskRabbit. On the buyer side, it can be
thought of as a city-month specific driver of demand for services among participating buyers. On
16We do not observe any sort of clear neighborhood partitioning in the data, although the setup on TaskRabbitdoes not preclude it.
12
the seller side it can be interpreted as a city-month increase in time availability among participating
sellers.
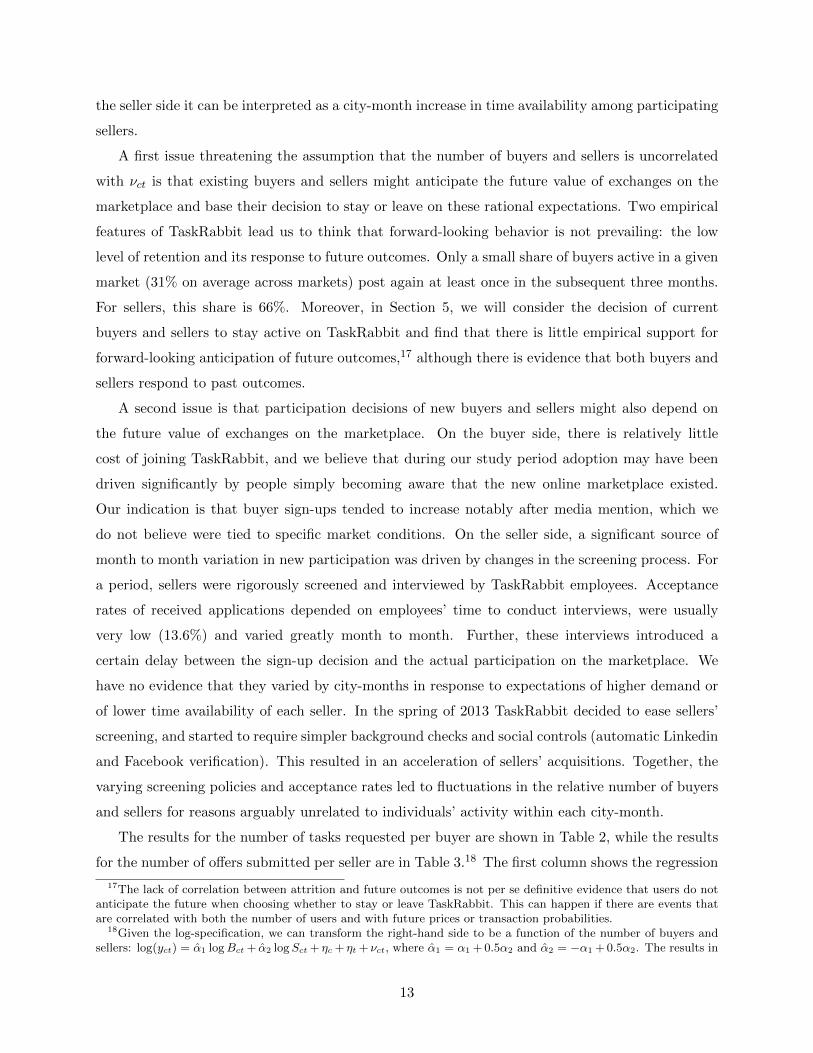
A first issue threatening the assumption that the number of buyers and sellers is uncorrelated
with ⌫ct is that existing buyers and sellers might anticipate the future value of exchanges on the
marketplace and base their decision to stay or leave on these rational expectations. Two empirical
features of TaskRabbit lead us to think that forward-looking behavior is not prevailing: the low
level of retention and its response to future outcomes. Only a small share of buyers active in a given
market (31% on average across markets) post again at least once in the subsequent three months.
For sellers, this share is 66%. Moreover, in Section 5, we will consider the decision of current
buyers and sellers to stay active on TaskRabbit and find that there is little empirical support for
forward-looking anticipation of future outcomes,17 although there is evidence that both buyers and
sellers respond to past outcomes.
A second issue is that participation decisions of new buyers and sellers might also depend on
the future value of exchanges on the marketplace. On the buyer side, there is relatively little
cost of joining TaskRabbit, and we believe that during our study period adoption may have been
driven significantly by people simply becoming aware that the new online marketplace existed.
Our indication is that buyer sign-ups tended to increase notably after media mention, which we
do not believe were tied to specific market conditions. On the seller side, a significant source of
month to month variation in new participation was driven by changes in the screening process. For
a period, sellers were rigorously screened and interviewed by TaskRabbit employees. Acceptance
rates of received applications depended on employees’ time to conduct interviews, were usually
very low (13.6%) and varied greatly month to month. Further, these interviews introduced a
certain delay between the sign-up decision and the actual participation on the marketplace. We
have no evidence that they varied by city-months in response to expectations of higher demand or
of lower time availability of each seller. In the spring of 2013 TaskRabbit decided to ease sellers’
screening, and started to require simpler background checks and social controls (automatic Linkedin
and Facebook verification). This resulted in an acceleration of sellers’ acquisitions. Together, the
varying screening policies and acceptance rates led to fluctuations in the relative number of buyers
and sellers for reasons arguably unrelated to individuals’ activity within each city-month.
The results for the number of tasks requested per buyer are shown in Table 2, while the results
for the number of o↵ers submitted per seller are in Table 3.18 The first column shows the regression
17The lack of correlation between attrition and future outcomes is not per se definitive evidence that users do notanticipate the future when choosing whether to stay or leave TaskRabbit. This can happen if there are events thatare correlated with both the number of users and with future prices or transaction probabilities.
18Given the log-specification, we can transform the right-hand side to be a function of the number of buyers andsellers: log(yct) = ↵1 logBct + ↵2 logSct + ⌘c + ⌘t + ⌫ct, where ↵1 = ↵1 +0.5↵2 and ↵2 = �↵1 +0.5↵2. The results in
13

results without fixed e↵ects, while the second column shows results with fixed e↵ects. Adding fixed
e↵ects does not change the response of buyers or sellers to fluctuations in the buyer to seller ratio,
not in sign, size, or significance. This provides some confidence that TaskRabbit is used by buyers
and sellers in a similar way both over time and across cities.
The results correspond to our earlier evidence. An increase in the number of buyers per seller
has virtually no e↵ect on how many tasks each buyer posts. On the other hand, doubling the
number of buyers per seller of the median city-month, where the median is selected according to
the distribution in the buyer to seller ratio and holding everything else constant, increases the
number of o↵ers submitted by each seller from 5.6 to 7.5.
We cannot fully rule out endogeneity of the number of buyers and sellers active on the platform.
In particular, exogenous growth on one side of the market might be anticipated by the other side.
For example, if the weather forecast anticipates heavy snow in Chicago in January, more buyers will
join the platform to request snow plowing. Now, sellers will also know about the weather forecast,
and in anticipation of higher demand they will join TaskRabbit in higher numbers.19 Platform
policies can also facilitate seller response by advertising or loosening their screening process during
these periods. This endogenous supply-side adjustment would reduce the variability in the buyer
to seller ratio. At the extreme, if the number of sellers perfectly adjusted to an exogenous demand
shock, we would not even be able to see the fluctuations in buyer to seller ratio shown in Figure
3. So in this sense our estimates of the e↵ect of buyer to seller ratio on buyer and seller usage
intensity are biased towards zero. The fact that we still find a positive e↵ect of changes in buyer to
seller ratio on the number of o↵ers submitted suggests that sellers are truly responsive to demand
and supply imbalances, and at least more responsive than buyers.
TaskRabbit advertising and marketing decisions might be another reason why the number of
buyers and sellers could be correlated with shocks to request and o↵er intensity. However, we
are not overly concerned with the possibility that marketing and advertising could a↵ect both the
number of buyers and sellers and their posting and search decisions for mature cities. This is
because according to internal conversations, during the period of our study TaskRabbit did not
spend heavily to attract buyers and sellers. Marketing targeted at the city level occurred only for a
Tables 2 and 3 imply that buyers post the same number of tasks, regardless of how many users are active. Each sellersubmits more o↵ers when there are more buyers, holding constant the number of sellers, but submits fewer o↵erswhen there are more sellers. We do still prefer the specification from equation 1 because of the particular nature ofnetwork externalities on TaskRabbit: users benefit from the marketplace insofar as it allows them to trade services,and users’ participation a↵ects the terms of trade. A seller benefits from a market with relatively more buyers, wherehis services are highly demanded, but is hurt in a market with relatively more sellers, where his services face fiercecompetition. At the same time, holding the relative number of buyers and sellers constant, a seller can like a largemarket more or less than a small market. A preference for larger markets can arise because of scale economies, whileone for smaller markets may be due to congestion.
19We thank an anonymous referee for providing this useful example of possible sources of endogeneity.
14

few weeks around the time of entry into that city. TaskRabbit would start by acquiring some sellers
before opening the marketplace to buyers, and would train them to perform services by assigning
them to a small number of marketing tasks - e.g. flyer distribution. By only keeping markets
with more than 50 active buyers and 20 active sellers, we are fairly confident that TaskRabbit’s
marketing e↵orts are not the driving activity within a market.
To account for remaining sources of endogeneity, we can use instrumental variables. We need
two instruments, one shifting overall participation, and another shifting participation of sellers
more than participation of buyers. Unemployment rate is likely to disproportionately a↵ect the
number of sellers joining the platform. When more people are unemployed, more sellers sign up
for TaskRabbit relative to buyers. Media coverage, on the other hand, is likely to shift overall
participation on the platform. Indeed, after the initial marketing campaign at the time of entry,
advertising relied on articles mentioning TaskRabbit in newspapers and blogs. 40% of these articles
were not pitched by TaskRabbit directly, but rather made reference to TaskRabbit while discussing
the sharing economy.20 In addition, about 65% of them were on national media, as opposed to
local newspapers.21 This media coverage, or at least its 1-month lag, is unlikely to be specifically
tied to market conditions a↵ecting posting or search e↵ort at a city-month level. So we use the
1-month lag of media articles mentioning TaskRabbit as a reasonable instrument that a↵ects the
task posting and o↵er submission propensity of current users only through its e↵ect on the number
of active buyers and sellers.
We can also use another set of instruments in the spirit of Bartik (1991). Specifically, we
instrument the buyer to seller ratio in city-month c, t with the average ratio in month t in cities
other than c. We compute an analogous instrument for the number of participants. These averages
produce masures of market conditions that are unrelated to city-month specific circumstances.
Instrumental variable estimates of equation 1 are reported in the last two columns of Tables 2
and 3. Column (3) uses Bartik instruments, while column (4) uses 1-month lags of media articles
mentioning TaskRabbit from Factiva, and unemployment rates from the Bureau of Labor Statistics
as instruments.22 Results are remarkably similar to the OLS results. In addition, we find a slightly
larger response of sellers to an increase in the number of buyers per seller, in support of our earlier
discussion that endogeneity is likely to bias our estimates towards zero. Buyers do not respond
to fluctuations in the relative number of buyers and sellers, while sellers adjust their e↵ort level
20The sharing economy (or collaborative consumption) is the term often used to refer to online peer-to-peer mar-ketplaces like Airbnb, Uber, or TaskRabbit. In the sharing economy, owners rent or share something they are notusing (e.g., a car, house) or provide a service themselves to a stranger using peer-to-peer markets.
21The numbers rely on TaskRabbit’s tracking activity of its media presence in 2012, and on the media articlesmentioning TaskRabbit retrieved from Factiva.
22Data on media coverage are available at https://www.dowjones.com/products/factiva/. Data on unemploy-ment rates are publicly available at https://beta.bls.gov/dataQuery/find.
15
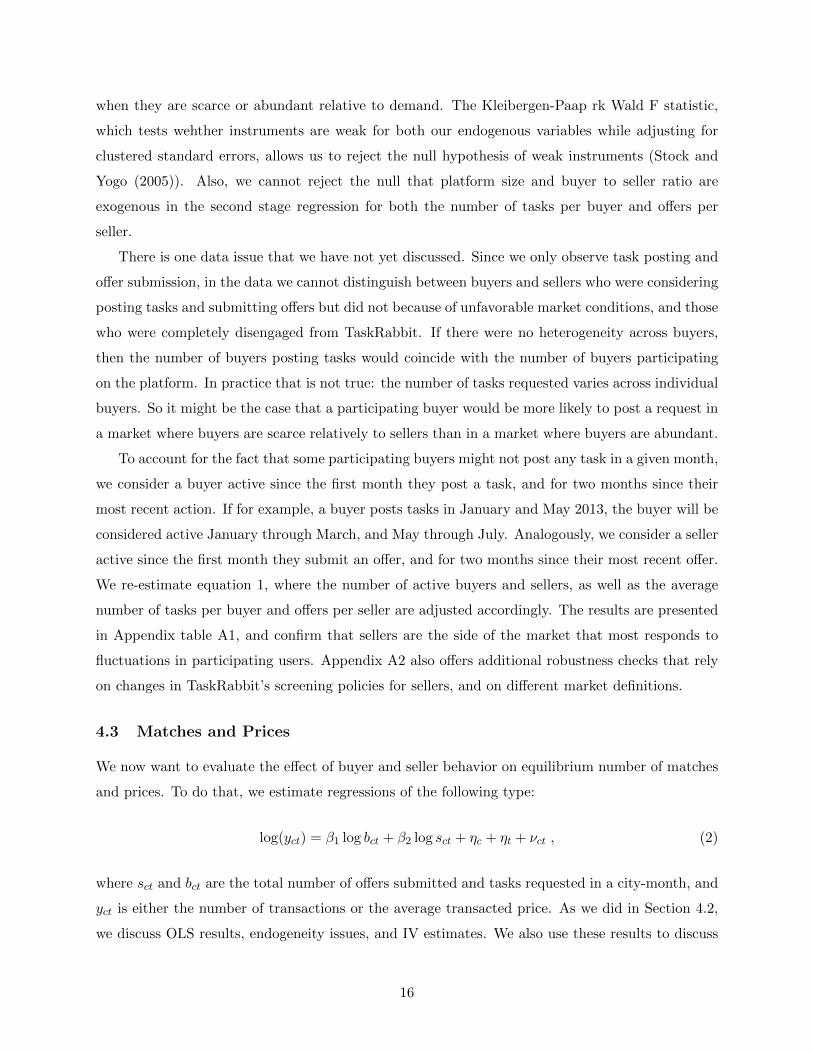
when they are scarce or abundant relative to demand. The Kleibergen-Paap rk Wald F statistic,
which tests wehther instruments are weak for both our endogenous variables while adjusting for
clustered standard errors, allows us to reject the null hypothesis of weak instruments (Stock and
Yogo (2005)). Also, we cannot reject the null that platform size and buyer to seller ratio are
exogenous in the second stage regression for both the number of tasks per buyer and o↵ers per
seller.
There is one data issue that we have not yet discussed. Since we only observe task posting and
o↵er submission, in the data we cannot distinguish between buyers and sellers who were considering
posting tasks and submitting o↵ers but did not because of unfavorable market conditions, and those
who were completely disengaged from TaskRabbit. If there were no heterogeneity across buyers,
then the number of buyers posting tasks would coincide with the number of buyers participating
on the platform. In practice that is not true: the number of tasks requested varies across individual
buyers. So it might be the case that a participating buyer would be more likely to post a request in
a market where buyers are scarce relatively to sellers than in a market where buyers are abundant.
To account for the fact that some participating buyers might not post any task in a given month,
we consider a buyer active since the first month they post a task, and for two months since their
most recent action. If for example, a buyer posts tasks in January and May 2013, the buyer will be
considered active January through March, and May through July. Analogously, we consider a seller
active since the first month they submit an o↵er, and for two months since their most recent o↵er.
We re-estimate equation 1, where the number of active buyers and sellers, as well as the average
number of tasks per buyer and o↵ers per seller are adjusted accordingly. The results are presented
in Appendix table A1, and confirm that sellers are the side of the market that most responds to
fluctuations in participating users. Appendix A2 also o↵ers additional robustness checks that rely
on changes in TaskRabbit’s screening policies for sellers, and on di↵erent market definitions.
4.3 Matches and Prices
We now want to evaluate the e↵ect of buyer and seller behavior on equilibrium number of matches
and prices. To do that, we estimate regressions of the following type:
log(yct) = �1 log bct + �2 log sct + ⌘c + ⌘t + ⌫ct , (2)
where sct and bct are the total number of o↵ers submitted and tasks requested in a city-month, and
yct is either the number of transactions or the average transacted price. As we did in Section 4.2,
we discuss OLS results, endogeneity issues, and IV estimates. We also use these results to discuss
16

scale economies in matching.
If we were to interpret the coe�cients structurally, this specification would be analogous to
assuming that the total number of matches and average prices in a market are Cobb-Douglas
functions of the number of tasks posted and o↵ers submitted.23 The sum ⌘c + ⌘t + ⌫ct is a market
level productivity shifter, where ⌘t is a month e↵ect common across cities, ⌘c is a time-invariant
city-specific parameter of match e�ciency, and ⌫ct is an idiosyncratic shock to matching, which is
not anticipated by buyers or sellers.
In this specification, we expect that the number of matches will be increasing in both inputs,
i.e. �1 � 0 and �2 � 0. The market exhibits increasing returns in matching if �1 + �2 > 1, and
constant returns if �1 + �2 = 1. Under increasing returns, doubling the number of tasks and o↵ers
more than doubles the number of matches. For pricing, we expect more posted tasks will drive up
prices, and more o↵ers will reduce them, so that �2 0 �1 when yct is the average transacted
price. If �1 + �2 = 0 price is not a↵ected by scale: doubling both the number of o↵ers and tasks
has no price e↵ect.
The assumption of exogeneity here means that buyers and sellers do not anticipate ⌫ct when
joining the platform nor when making their posting and o↵er submission decisions. These shocks
can result from unexpected concentration of o↵ers among a small number of tasks, for example due
to variation in the time when users access the marketplace: if all sellers in a market find themselves
looking for tasks at the same time within a month, o↵ers will tend to be sent to the same tasks,
more so than if sellers search for tasks at di↵erent times. This could decrease the rate at which
o↵ers and tasks are converted into matches and the price at which matches trade. Our assumption
essentially requires that buyers and sellers cannot anticipate these coordination problems.
The first two columns of Table 4 present OLS estimates of the number of matches. We discuss
the results from column (2), noticing once again that including city fixed e↵ects and month fixed
e↵ects does not a↵ect our estimates of how tasks and o↵ers contribute to matching. The coe�cients
can be interpreted as elasticities, because of the log-log specification. The first column shows that
doubling the number of tasks, holding constant the number of o↵ers, increases the number of
matches by 41%. Similarly, doubling the number of o↵ers, holding fixed the number of tasks,
increases the number of matches by 52%. The estimates suggest that scaling up either tasks or
o↵ers contributes about equally to the creation of successful matches.
The sum of the two elasticities provides an estimate of the returns to scale in the matching
technology. Work on two-sided platforms has emphasized the importance of increasing returns to
scale for market structure (Parker and Van Alstyne (2005)). The hypothesis is that active and
23Petrongolo and Pissarides (2001) summarize the wide empirical support for a Cobb-Douglas matching functionwith constant returns to scale. For its micro-foundation, see Stevens (2007).
17
thick markets may lead to easier matching. Our estimates, however, show no evidence of increasing
returns to scale. Returns are slightly (and significantly) less than constant when estimated by
ordinary least squares.
The bias arising from endogeneity would likely work in favor of finding economies of scale. If for
example TaskRabbit took advantage of the snow forecast to advertise to both buyers and sellers, the
increase in number of participants to the platform would be positively correlated with an increase
in the number of matches. This would bias our estimates towards estimating positive network
e↵ects, unless compositional changes would make both the marginal tasks and the marginal o↵ers
inferior. We cannot rule this possibility out completely, but we can check whether entrants are
systematically di↵erent as a function of market size.
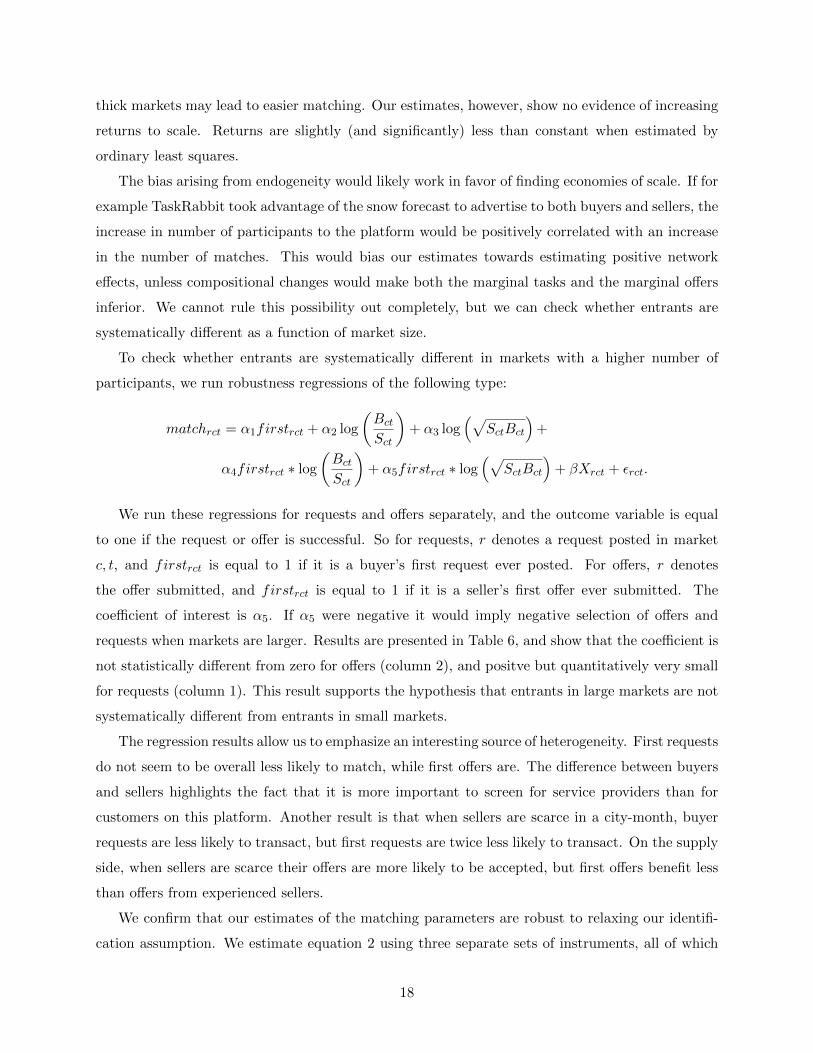
To check whether entrants are systematically di↵erent in markets with a higher number of
participants, we run robustness regressions of the following type:
matchrct = ↵1firstrct + ↵2 log
✓Bct
Sct
◆+ ↵3 log
⇣pSctBct
⌘+
↵4firstrct ⇤ log✓Bct
Sct
◆+ ↵5firstrct ⇤ log
⇣pSctBct
⌘+ �Xrct + ✏rct.
We run these regressions for requests and o↵ers separately, and the outcome variable is equal
to one if the request or o↵er is successful. So for requests, r denotes a request posted in market
c, t, and firstrct is equal to 1 if it is a buyer’s first request ever posted. For o↵ers, r denotes
the o↵er submitted, and firstrct is equal to 1 if it is a seller’s first o↵er ever submitted. The
coe�cient of interest is ↵5. If ↵5 were negative it would imply negative selection of o↵ers and
requests when markets are larger. Results are presented in Table 6, and show that the coe�cient is
not statistically di↵erent from zero for o↵ers (column 2), and positve but quantitatively very small
for requests (column 1). This result supports the hypothesis that entrants in large markets are not
systematically di↵erent from entrants in small markets.
The regression results allow us to emphasize an interesting source of heterogeneity. First requests
do not seem to be overall less likely to match, while first o↵ers are. The di↵erence between buyers
and sellers highlights the fact that it is more important to screen for service providers than for
customers on this platform. Another result is that when sellers are scarce in a city-month, buyer
requests are less likely to transact, but first requests are twice less likely to transact. On the supply
side, when sellers are scarce their o↵ers are more likely to be accepted, but first o↵ers benefit less
than o↵ers from experienced sellers.
We confirm that our estimates of the matching parameters are robust to relaxing our identifi-
cation assumption. We estimate equation 2 using three separate sets of instruments, all of which
18
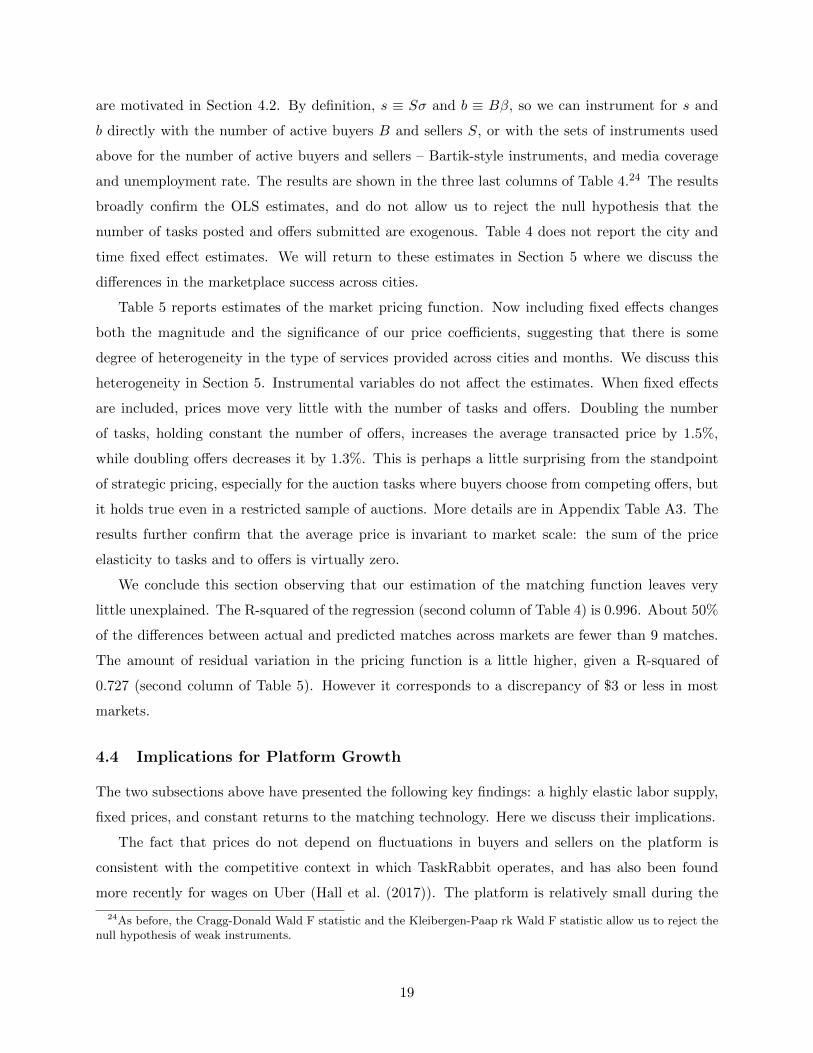
are motivated in Section 4.2. By definition, s ⌘ S� and b ⌘ B�, so we can instrument for s and
b directly with the number of active buyers B and sellers S, or with the sets of instruments used
above for the number of active buyers and sellers – Bartik-style instruments, and media coverage
and unemployment rate. The results are shown in the three last columns of Table 4.24 The results
broadly confirm the OLS estimates, and do not allow us to reject the null hypothesis that the
number of tasks posted and o↵ers submitted are exogenous. Table 4 does not report the city and
time fixed e↵ect estimates. We will return to these estimates in Section 5 where we discuss the
di↵erences in the marketplace success across cities.
Table 5 reports estimates of the market pricing function. Now including fixed e↵ects changes
both the magnitude and the significance of our price coe�cients, suggesting that there is some
degree of heterogeneity in the type of services provided across cities and months. We discuss this
heterogeneity in Section 5. Instrumental variables do not a↵ect the estimates. When fixed e↵ects
are included, prices move very little with the number of tasks and o↵ers. Doubling the number
of tasks, holding constant the number of o↵ers, increases the average transacted price by 1.5%,
while doubling o↵ers decreases it by 1.3%. This is perhaps a little surprising from the standpoint
of strategic pricing, especially for the auction tasks where buyers choose from competing o↵ers, but
it holds true even in a restricted sample of auctions. More details are in Appendix Table A3. The
results further confirm that the average price is invariant to market scale: the sum of the price
elasticity to tasks and to o↵ers is virtually zero.
We conclude this section observing that our estimation of the matching function leaves very
little unexplained. The R-squared of the regression (second column of Table 4) is 0.996. About 50%
of the di↵erences between actual and predicted matches across markets are fewer than 9 matches.
The amount of residual variation in the pricing function is a little higher, given a R-squared of
0.727 (second column of Table 5). However it corresponds to a discrepancy of $3 or less in most
markets.
4.4 Implications for Platform Growth
The two subsections above have presented the following key findings: a highly elastic labor supply,
fixed prices, and constant returns to the matching technology. Here we discuss their implications.
The fact that prices do not depend on fluctuations in buyers and sellers on the platform is
consistent with the competitive context in which TaskRabbit operates, and has also been found
more recently for wages on Uber (Hall et al. (2017)). The platform is relatively small during the
24As before, the Cragg-Donald Wald F statistic and the Kleibergen-Paap rk Wald F statistic allow us to reject thenull hypothesis of weak instruments.
19
period of our study, and the tasks requested do not require high skills. Data from Crunchbase,
the most comprehensive database of startups and larger companies, suggest that TaskRabbit faces
many competitors. A search for “Home Services” companies based in the US and started before
June 2014 returns over 137 results, ranging from similar online platforms such as Thumbtack to
publicly listed companies such as HomeServe.25 In addition it seems reasonable to believe that
similar services could be exchanged through informal connections and word of mouth.
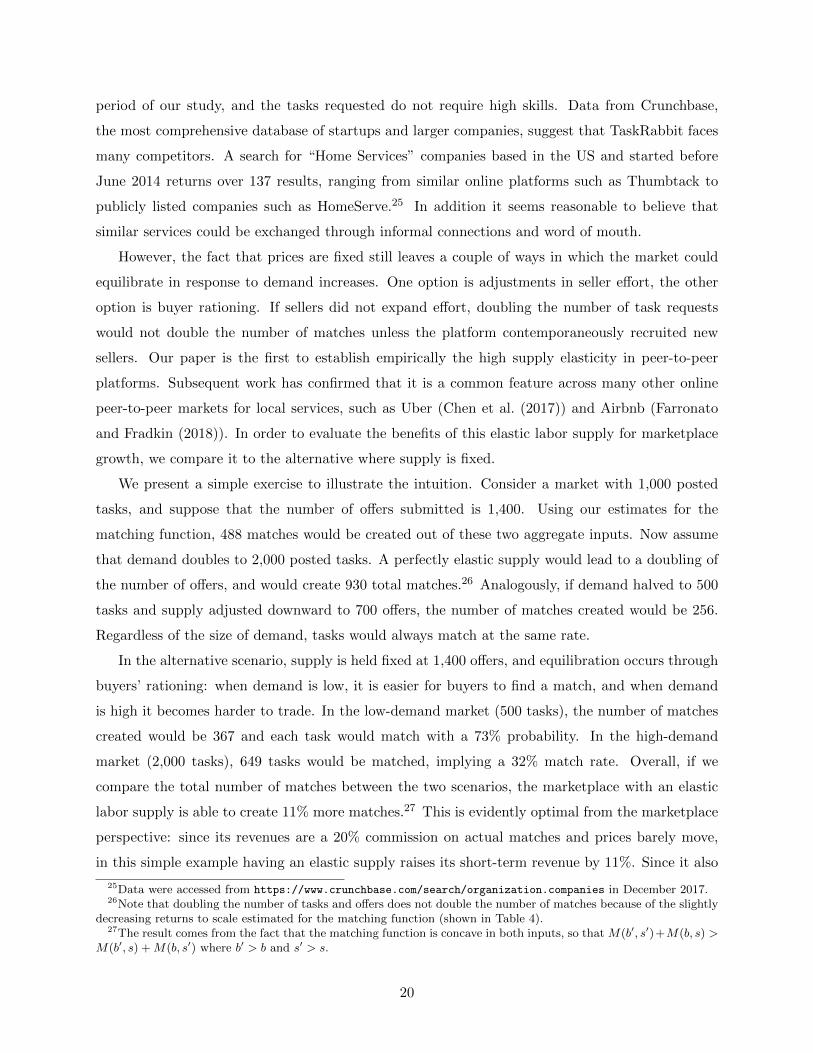
However, the fact that prices are fixed still leaves a couple of ways in which the market could
equilibrate in response to demand increases. One option is adjustments in seller e↵ort, the other
option is buyer rationing. If sellers did not expand e↵ort, doubling the number of task requests
would not double the number of matches unless the platform contemporaneously recruited new
sellers. Our paper is the first to establish empirically the high supply elasticity in peer-to-peer
platforms. Subsequent work has confirmed that it is a common feature across many other online
peer-to-peer markets for local services, such as Uber (Chen et al. (2017)) and Airbnb (Farronato
and Fradkin (2018)). In order to evaluate the benefits of this elastic labor supply for marketplace
growth, we compare it to the alternative where supply is fixed.
We present a simple exercise to illustrate the intuition. Consider a market with 1,000 posted
tasks, and suppose that the number of o↵ers submitted is 1,400. Using our estimates for the
matching function, 488 matches would be created out of these two aggregate inputs. Now assume
that demand doubles to 2,000 posted tasks. A perfectly elastic supply would lead to a doubling of
the number of o↵ers, and would create 930 total matches.26 Analogously, if demand halved to 500
tasks and supply adjusted downward to 700 o↵ers, the number of matches created would be 256.
Regardless of the size of demand, tasks would always match at the same rate.
In the alternative scenario, supply is held fixed at 1,400 o↵ers, and equilibration occurs through
buyers’ rationing: when demand is low, it is easier for buyers to find a match, and when demand
is high it becomes harder to trade. In the low-demand market (500 tasks), the number of matches
created would be 367 and each task would match with a 73% probability. In the high-demand
market (2,000 tasks), 649 tasks would be matched, implying a 32% match rate. Overall, if we
compare the total number of matches between the two scenarios, the marketplace with an elastic
labor supply is able to create 11% more matches.27 This is evidently optimal from the marketplace
perspective: since its revenues are a 20% commission on actual matches and prices barely move,
in this simple example having an elastic supply raises its short-term revenue by 11%. Since it also
25Data were accessed from https://www.crunchbase.com/search/organization.companies in December 2017.26Note that doubling the number of tasks and o↵ers does not double the number of matches because of the slightly
decreasing returns to scale estimated for the matching function (shown in Table 4).27The result comes from the fact that the matching function is concave in both inputs, so that M(b0, s0)+M(b, s) >
M(b0, s) +M(b, s0) where b0 > b and s0 > s.
20

raises retention, which we show in Section 5, it benefits the marketplace by accelerating its growth.
The absence of increasing returns in the matching technology was perhaps unexpected given the
specific nature of the market. In a platform like TaskRabbit where tasks typically require a buyer
and a seller to meet, e�ciency can come from matching buyers and sellers who live close to each
other. But interestingly it does not seem to be the case that distances between matched buyers and
sellers shrink as a market grows. Figure 6 plots the median distance within a city-month, where
the distance is measured between the zip codes reported by buyers and sellers.28 The top line takes
a seller who made an o↵er at a specific time, and pairs him to every buyer who posted tasks in the
preceding 48 hours. The median distance is computed among all such pairs within a city-month.
The middle line is just the pairing of tasks and their corresponding o↵ers, and the distance is
computed between the zip codes of buyers who posted those tasks and sellers who submitted those
o↵ers. The bottom line is the pairing of buyers and sellers from successful matches. The figure
plots the median distance for the three largest cities over time, and the other cities display similar
time trends. None of these measures of buyer-seller distance shrinks as a market scales up.
Because sellers flexibly expand e↵ort in response to increases in demand, a direct implication is
that peer-to-peer markets should focus on increasing demand rather than supply. In addition, the
absence of economies of scale means that maintaining an e�cient matching process is crucial for
marketplace success. The next section explores demand growth across cities, and how it relates to
market e�ciency.
5 Growth and City Heterogeneity
The motivating feature of the data for our paper is that some cities exhibit striking growth in the
number of matches, and others exhibit more moderate growth (Figure 2). The previous section has
demonstrated how growth relies on attracting buyers, given that supply is highly elastic.
In principle, two types of theories can explain di↵erences in how cities attract and retain a
large number of buyers. The first type relies on scale economies and strategic complementarities
between the adoption patterns of buyers and sellers. If market frictions were reduced by market
scale, we would expect that cities which started o↵ with a large user base grew much faster than
cities of modest size, exactly because growth led to more growth. However in Section 4 we found no
evidence supporting scale economies in matching. Therefore initial di↵erences in adoption cannot
explain increasing heterogeneity over time.
28We compute the geodetic distance, i.e. the length of the shortest curve between the two zip codes, where theinput coordinates are assumed to be based on the WGS 1984 datum. The distances are ellipsoidal distances computedusing equations from Vincenty (1975).
21
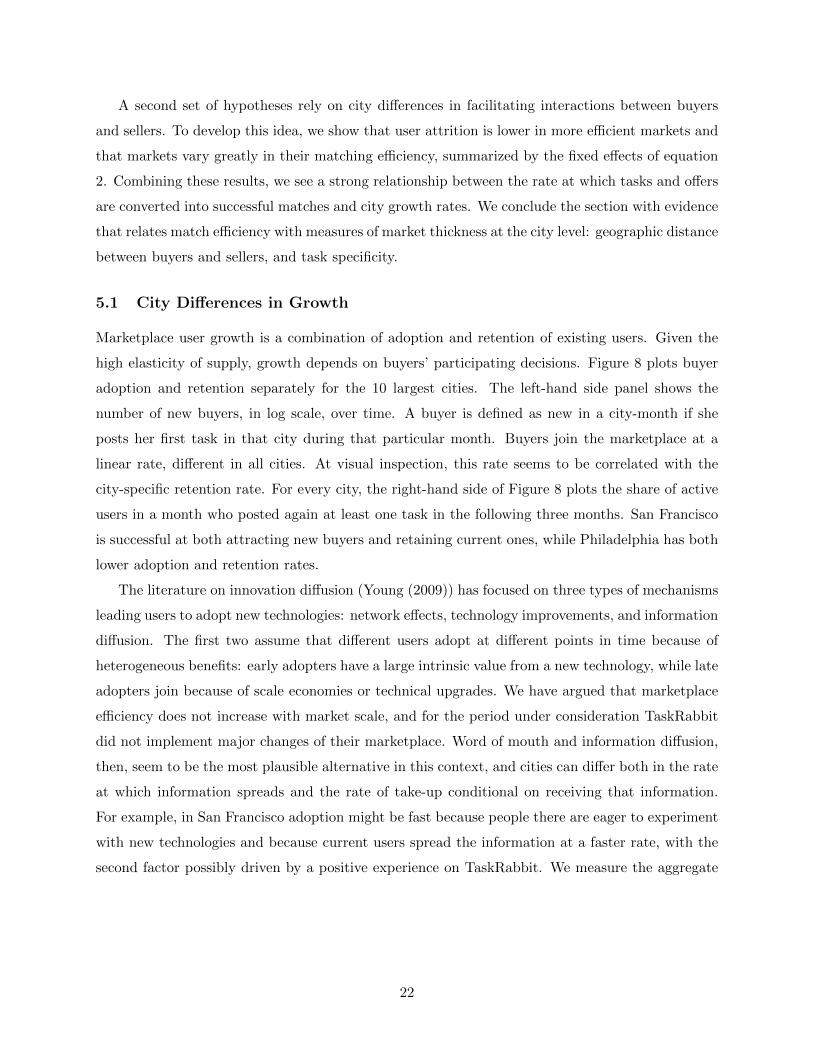
A second set of hypotheses rely on city di↵erences in facilitating interactions between buyers
and sellers. To develop this idea, we show that user attrition is lower in more e�cient markets and
that markets vary greatly in their matching e�ciency, summarized by the fixed e↵ects of equation
2. Combining these results, we see a strong relationship between the rate at which tasks and o↵ers
are converted into successful matches and city growth rates. We conclude the section with evidence
that relates match e�ciency with measures of market thickness at the city level: geographic distance
between buyers and sellers, and task specificity.
5.1 City Di↵erences in Growth
Marketplace user growth is a combination of adoption and retention of existing users. Given the
high elasticity of supply, growth depends on buyers’ participating decisions. Figure 8 plots buyer
adoption and retention separately for the 10 largest cities. The left-hand side panel shows the
number of new buyers, in log scale, over time. A buyer is defined as new in a city-month if she
posts her first task in that city during that particular month. Buyers join the marketplace at a
linear rate, di↵erent in all cities. At visual inspection, this rate seems to be correlated with the
city-specific retention rate. For every city, the right-hand side of Figure 8 plots the share of active
users in a month who posted again at least one task in the following three months. San Francisco
is successful at both attracting new buyers and retaining current ones, while Philadelphia has both
lower adoption and retention rates.
The literature on innovation di↵usion (Young (2009)) has focused on three types of mechanisms
leading users to adopt new technologies: network e↵ects, technology improvements, and information
di↵usion. The first two assume that di↵erent users adopt at di↵erent points in time because of
heterogeneous benefits: early adopters have a large intrinsic value from a new technology, while late
adopters join because of scale economies or technical upgrades. We have argued that marketplace
e�ciency does not increase with market scale, and for the period under consideration TaskRabbit
did not implement major changes of their marketplace. Word of mouth and information di↵usion,
then, seem to be the most plausible alternative in this context, and cities can di↵er both in the rate
at which information spreads and the rate of take-up conditional on receiving that information.
For example, in San Francisco adoption might be fast because people there are eager to experiment
with new technologies and because current users spread the information at a faster rate, with the
second factor possibly driven by a positive experience on TaskRabbit. We measure the aggregate
22

e↵ect by estimating the city-specific buyer adoption equation:29
newct = �cagect + ✏ct , (3)
where newct is the number of new buyers joining city c in calendar month t, and agect is the age of
the marketplace in city c at time t. For example, agect = 1 if month t is the first since TaskRabbit
became active in city c. In Appendix A3, Table A13 shows the results, and we verify that deviations
from the linear adoption rate are not driven by contemporaneous market conditions, in support of
our earlier identification assumptions.
We compare adoption rates with retention. Retention can be city-specific and, within each city,
further depend on current outcomes, match rates and prices:
log
✓stayct
1� stayct
◆= ✓0Xct + ✓t + ✓c + ✏ct . (4)
The variable stayct is the share of users active in city-month c, t who were active again at least once
in the following three months within the same city. Xct is a two-element vector of relevant outcomes
in city-month c, t: realized buyer match rate and average transacted price. We expect that a high
match rate would increase the odds that a buyer will be active again in the next three months,
while a high price would drive away more buyers. As with equation 3, Table A15 in Appendix A4
shows the results, which confirm our hypothesis, and we verify that retention is not correlated with
future outcomes, in partial support of our earlier identification assumption.
Figure 9 plots the estimates of �c (city-specific adoption rate) and ✓c (retention rate) from
equations 3 and 4. A certain correlation exists between the rate at which a city is able to attract
buyers and the rate at which it can retain them, although it is by no means perfect. San Francisco
and New York are successful on both measures, while Houston, Atlanta and Phoenix lag behind on
both. However, in San Diego buyers adopt at a fast rate but are also likely to leave the marketplace,
while in Portland new buyers are just a few but they stay longer. Retention is arguably the decision
that is mostly related to the experience on the marketplace, and indeed in the next section we show
that it is associated with how e�ciently the marketplace matches buyers and sellers in each city.
29We assume a linear growth rate di↵erent across cities, given Figure 8. It can be rationalized within the Bass modelof new product di↵usion (Bass (1969)): newct = �c + newc,t�1, where newct is the number of new buyers joiningcity c in calendar month t. Two things di↵er from the standard specification. First, the total number of potentialadopters is assumed to be large relative to the size of the marketplace, which is consistent with the population sizeof the metropolitan cities relative to the current users on TaskRabbit. Second, we assume that new adopters in theprevious month are the only users spreading information, and not adopters of previous months. Each new adopterdi↵uses information so that exactly one extra adopter joins the marketplace in the following month.
23
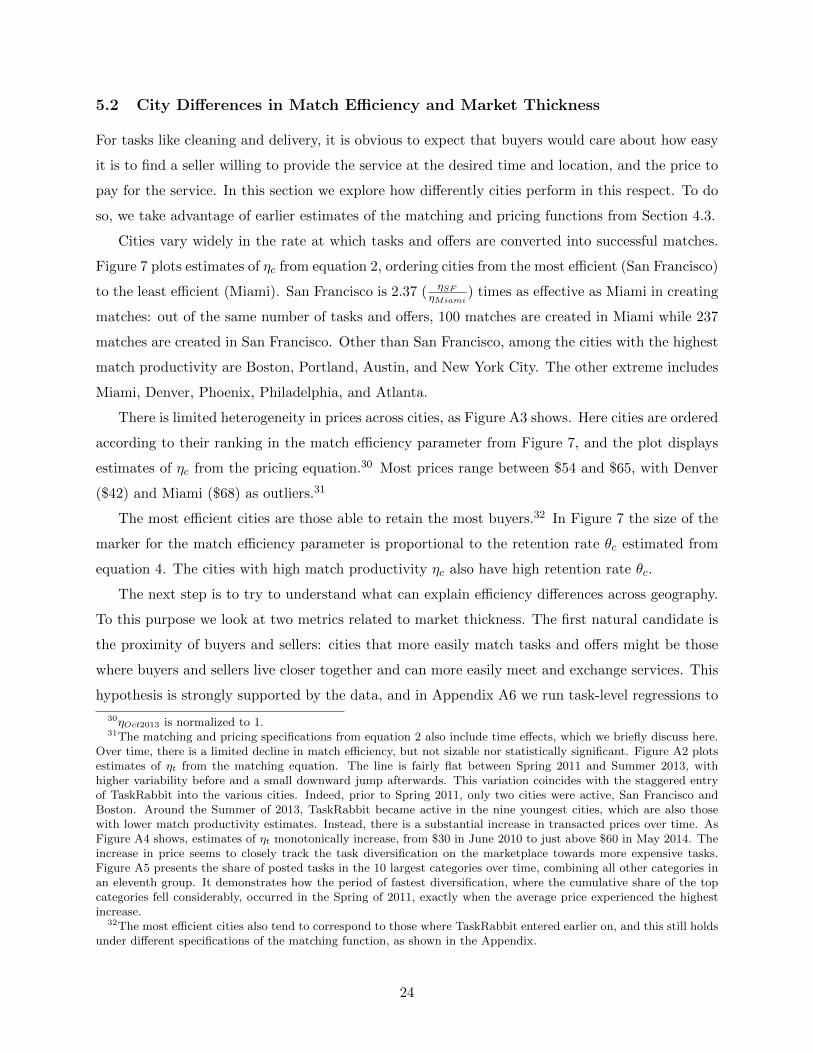
5.2 City Di↵erences in Match E�ciency and Market Thickness
For tasks like cleaning and delivery, it is obvious to expect that buyers would care about how easy
it is to find a seller willing to provide the service at the desired time and location, and the price to
pay for the service. In this section we explore how di↵erently cities perform in this respect. To do
so, we take advantage of earlier estimates of the matching and pricing functions from Section 4.3.
Cities vary widely in the rate at which tasks and o↵ers are converted into successful matches.
Figure 7 plots estimates of ⌘c from equation 2, ordering cities from the most e�cient (San Francisco)
to the least e�cient (Miami). San Francisco is 2.37 ( ⌘SF⌘Miami
) times as e↵ective as Miami in creating
matches: out of the same number of tasks and o↵ers, 100 matches are created in Miami while 237
matches are created in San Francisco. Other than San Francisco, among the cities with the highest
match productivity are Boston, Portland, Austin, and New York City. The other extreme includes
Miami, Denver, Phoenix, Philadelphia, and Atlanta.
There is limited heterogeneity in prices across cities, as Figure A3 shows. Here cities are ordered
according to their ranking in the match e�ciency parameter from Figure 7, and the plot displays
estimates of ⌘c from the pricing equation.30 Most prices range between $54 and $65, with Denver
($42) and Miami ($68) as outliers.31
The most e�cient cities are those able to retain the most buyers.32 In Figure 7 the size of the
marker for the match e�ciency parameter is proportional to the retention rate ✓c estimated from
equation 4. The cities with high match productivity ⌘c also have high retention rate ✓c.
The next step is to try to understand what can explain e�ciency di↵erences across geography.
To this purpose we look at two metrics related to market thickness. The first natural candidate is
the proximity of buyers and sellers: cities that more easily match tasks and o↵ers might be those
where buyers and sellers live closer together and can more easily meet and exchange services. This
hypothesis is strongly supported by the data, and in Appendix A6 we run task-level regressions to
30⌘Oct2013 is normalized to 1.31The matching and pricing specifications from equation 2 also include time e↵ects, which we briefly discuss here.
Over time, there is a limited decline in match e�ciency, but not sizable nor statistically significant. Figure A2 plotsestimates of ⌘t from the matching equation. The line is fairly flat between Spring 2011 and Summer 2013, withhigher variability before and a small downward jump afterwards. This variation coincides with the staggered entryof TaskRabbit into the various cities. Indeed, prior to Spring 2011, only two cities were active, San Francisco andBoston. Around the Summer of 2013, TaskRabbit became active in the nine youngest cities, which are also thosewith lower match productivity estimates. Instead, there is a substantial increase in transacted prices over time. AsFigure A4 shows, estimates of ⌘t monotonically increase, from $30 in June 2010 to just above $60 in May 2014. Theincrease in price seems to closely track the task diversification on the marketplace towards more expensive tasks.Figure A5 presents the share of posted tasks in the 10 largest categories over time, combining all other categories inan eleventh group. It demonstrates how the period of fastest diversification, where the cumulative share of the topcategories fell considerably, occurred in the Spring of 2011, exactly when the average price experienced the highestincrease.
32The most e�cient cities also tend to correspond to those where TaskRabbit entered earlier on, and this still holdsunder di↵erent specifications of the matching function, as shown in the Appendix.
24
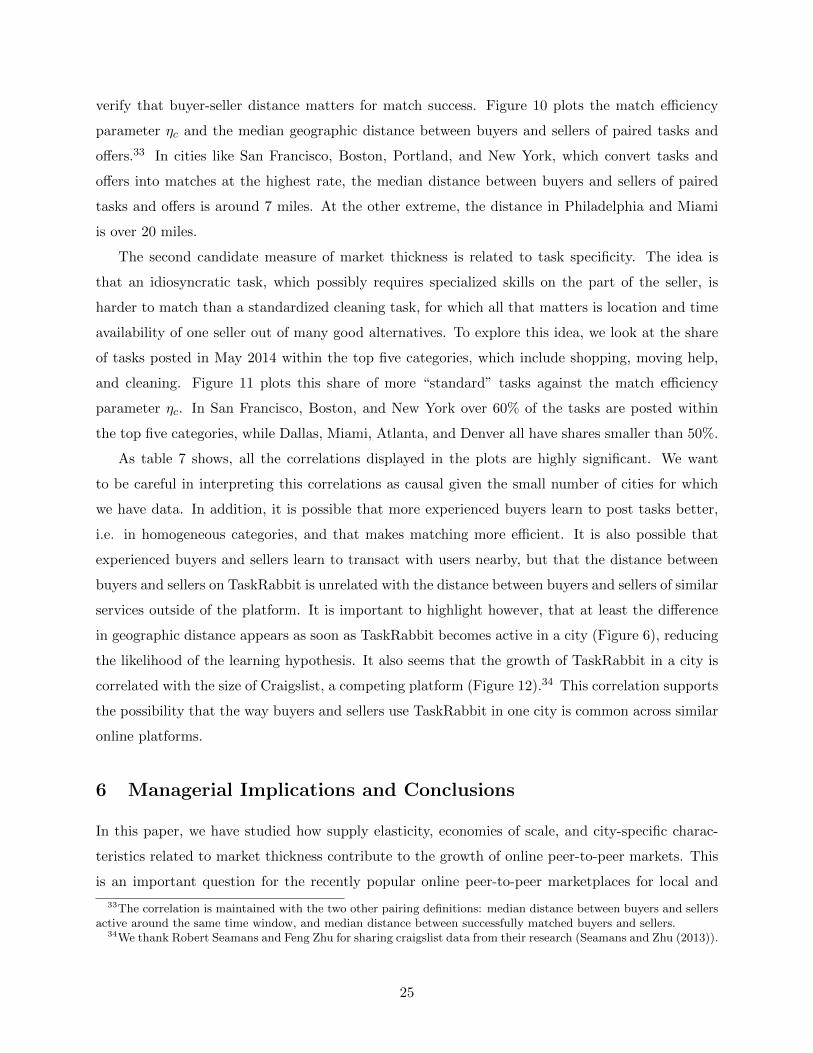
verify that buyer-seller distance matters for match success. Figure 10 plots the match e�ciency
parameter ⌘c and the median geographic distance between buyers and sellers of paired tasks and
o↵ers.33 In cities like San Francisco, Boston, Portland, and New York, which convert tasks and
o↵ers into matches at the highest rate, the median distance between buyers and sellers of paired
tasks and o↵ers is around 7 miles. At the other extreme, the distance in Philadelphia and Miami
is over 20 miles.
The second candidate measure of market thickness is related to task specificity. The idea is
that an idiosyncratic task, which possibly requires specialized skills on the part of the seller, is
harder to match than a standardized cleaning task, for which all that matters is location and time
availability of one seller out of many good alternatives. To explore this idea, we look at the share
of tasks posted in May 2014 within the top five categories, which include shopping, moving help,
and cleaning. Figure 11 plots this share of more “standard” tasks against the match e�ciency
parameter ⌘c. In San Francisco, Boston, and New York over 60% of the tasks are posted within
the top five categories, while Dallas, Miami, Atlanta, and Denver all have shares smaller than 50%.
As table 7 shows, all the correlations displayed in the plots are highly significant. We want
to be careful in interpreting this correlations as causal given the small number of cities for which
we have data. In addition, it is possible that more experienced buyers learn to post tasks better,
i.e. in homogeneous categories, and that makes matching more e�cient. It is also possible that
experienced buyers and sellers learn to transact with users nearby, but that the distance between
buyers and sellers on TaskRabbit is unrelated with the distance between buyers and sellers of similar
services outside of the platform. It is important to highlight however, that at least the di↵erence
in geographic distance appears as soon as TaskRabbit becomes active in a city (Figure 6), reducing
the likelihood of the learning hypothesis. It also seems that the growth of TaskRabbit in a city is
correlated with the size of Craigslist, a competing platform (Figure 12).34 This correlation supports
the possibility that the way buyers and sellers use TaskRabbit in one city is common across similar
online platforms.
6 Managerial Implications and Conclusions
In this paper, we have studied how supply elasticity, economies of scale, and city-specific charac-
teristics related to market thickness contribute to the growth of online peer-to-peer markets. This
is an important question for the recently popular online peer-to-peer marketplaces for local and
33The correlation is maintained with the two other pairing definitions: median distance between buyers and sellersactive around the same time window, and median distance between successfully matched buyers and sellers.
34We thank Robert Seamans and Feng Zhu for sharing craigslist data from their research (Seamans and Zhu (2013)).
25
time-sensitive services, such as Uber, Airbnb, and TaskRabbit.
In order to study supply elasticity and scale economies, we have separated users’ decision of
how intensely to use the marketplace in the short-run from the decision to join or leave the market-
place, both of which a↵ect growth. We have studied short and long-run participation decisions on
TaskRabbit, a growing peer-to-peer market for domestic tasks, using variation in market conditions
across cities and over time.
Our analysis has unveiled three main findings. First, buyers post similar numbers of tasks
regardless of their scarcity relative to sellers, while sellers expand their e↵ort when they are scarce
and contract it when they are abundant. This adjustment on the seller side has virtually no impact
on average prices, suggesting a highly elastic labor supply. Second, the number of matches scales
linearly with the number of market participants, suggesting that there are no network e↵ects or
match e�ciency gains from increasing the number of participants. Third, geographical proximity of
buyers and sellers, and task homogenization are positively associated with match e�ciency, which
helps explain di↵erences in platform success across cities.
Our findings have four important implications for managing the growth of peer-to-peer market-
places. First, the managerial challenge unique to two-sided platforms is striking a balance between
demand and supply. This is the classical chicken-egg problem: limited demand discourages sell-
ers from joining, and limited supply discourages buyers (Caillaud and Jullien (2003), and Hagiu
(2007)). Our results suggest that managerial e↵orts should focus on attracting the most inelastic
side of the market because the inelastic side constraints the volume of trades on the platform, and
thus profits. On TaskRabbit, we found that demand is more inelastic, so the platform should spend
resources attracting buyers at a faster rate than sellers because sellers flexibly adjust their e↵ort
in response to changes in relative demand, with almost no e↵ects on prices or the probability that
tasks are filled. It seems that TaskRabbit was initially devoting more resources to the recruiting
and screening of sellers than to attracting buyers, as evidenced by their initially tight background
checks. The fact that the platform changed their seller screening policies towards easier background
checks in the middle of 2013 suggests a shift of focus away from sellers, in line with our findings.
On other platforms however, the most inelastic side may be sellers rather than buyers, and our
framework can be applied to other data to identify how responsive each side is to market conditions.
Second, the standard assumption is that two-sided platforms benefit from large network e↵ects,
so the challenge is to either achieve scale fast and deter competitive entry or drastically innovate.
However, when it comes to peer-to-peer platforms for local and time-sensitive services, the nature
of network e↵ects can be limited to a specific geography and time interval, and our results suggest
that other local characteristics are more important for growth than economies of scale. As a
26
consequence, managerial e↵orts should be targeted at strategically picking cities for geographic
expansion, and the characteristics of those cities should promote market thickness. In the case of
TaskRabbit, and more generally for marketplaces for personal services, a relevant characteristic is
the distance between the locations of buyers and sellers.
Third, our results have implications for competition. Existing literature assumes that multiple
platforms cannot coexist in equilibrium and that a single winner will dominate the market (Eisen-
mann et al. (2011)). In our setting where services are local, we find that the proximity of buyers and
sellers is a main driver of e�ciency. This implies that it is crucial to select which cities to operate
in, but also that entry and competition are much more likely here than in other markets, such as
those for remote work, where network e↵ects are not local by nature. Indeed, a simple count of
the number of active “Home Services” companies on Crunchbase returns 249 firms, against only 67
“Freelance” companies.35 Empirical studies of other factors contributing to the equilibrium level
of competition in platform-based markets is a valuable avenue for future research.
Finally, the level of service standardization is a crucial strategic choice for platforms like
TaskRabbit. We have found that standardization is positively associated with matching e�ciency
because it guarantees that fairly undi↵erentiated supply is available and task requests are more
easily filled, which in turn increases user retention. This result suggests managerial e↵orts should
focus on choosing a few standardized services to be exchanged on the marketplace, at least early
on. Many other peer-to-peer markets have indeed started with narrow service o↵erings – e.g. rides
on Uber, accommodation on Airbnb – and have later expanded – Uber to food delivery and Airbnb
to local experiences to complementary service categories.36 When and how to diversify services
exchanged on a platform is an important open question.
A slightly less direct implication of our findings is that when services are relatively undi↵eren-
tiated (e.g. cleaning) and buyers’ tastes are not highly heterogeneous, peer-to-peer markets can
design the search and matching mechanism to reduce search costs. Given the platform design where
sellers need to submit o↵ers to each individual task request, it seems costly for sellers to search
through posted tasks, and with some probability profitable tasks are not found by any seller and are
left unmatched, or are found by sellers who turned out to be unavailable to perform them. Indeed,
13% of the tasks that did not receive any o↵ers were canceled because the buyer reported having
the task done sooner, and 19% of the tasks that did receive o↵ers were canceled because one of the
parties reported inability to resolve scheduling conflicts. So, what would happen if instead of having
sellers search for profitable submissions, the marketplace let sellers directly list their availability
35On Crunchbase platforms similar to TaskRabbit are classified as ”Home Services”, while platforms similar toUpwork are classified as ”Freelance”. The database was accessed in December 2017.
36www.ubereats.com and www.airbnb.com/s/experiences, accessed in December 2017.
27
on a calendar and within a specific geographic area? This would eliminate search costs of supply,
while benefiting buyers and the marketplace by raising task match rates.
The benefits of reducing sellers’ search costs and improving match e�ciency provide a rationale
for a re-design of the marketplace, which actually occurred in the Spring of 2014. Buyers can now
select the category, location, and time for a given task request, and then either choose among the
sellers available to perform that task type at the specified time and location, or have TaskRabbit
automatically choose for them. The benefits of reducing search frictions and increasing match
e�ciency may however come at a cost. Specifically, listing time availability may decrease flexibility
of seller schedules, which recent research shows to be valuable for service providers of peer-to-peer
markets (Chen et al. (2017)). Automatic matching might also reduce seller opportunity to trade
more specialized skills at a premium. These examples highlight the fact that the two sides of a
peer-to-peer market have conflicting interests, and design choices benefiting one side might hurt
the other.
Our paper has primarily focused on aggregate measures of scale economies, supply elasticity, and
city di↵erences as contributors to growth of peer-to-peer markets, leaving aside buyer and seller
heterogeneity. A valuable avenue for future research would be to study dynamic participation
decisions of buyers and sellers in more detail than done here. Better understanding the drivers of
user adoption can help explain competition between peer-to-peer markets, both between multiple
peer-to-peer marketplaces and between the online marketplace model and more traditional service
providers.
28

References
Allon, Gad, Achal Bassamboo, and Eren B. Cil. 2012. “Large-Scale Service Marketplaces:
The Role of the Moderating Firm.” Management Science, 58(10): 1854–1872.
Armstrong, Mark. 2006. “Competition in two-sided markets.” Journal of Economics, 37(3): 668–
691.
Arnosti, Nick, Ramesh Johari, and Yash Kanoria. 2016. “Managing Congestion in Matching
Markets.” Working Paper.
Arthur, W Brian. 1989. “Competing Technologies, Increasing Returns, and Lock-In by Historical
Events.” The Economic Journal, 99(394): 116–131.
Bartik, Timothy J. 1991. Who Benefits from State and Local Economic Development Policies?
W.E. Upjohn Institute for Employment Research.
Bass, Frank M. 1969. “A New Product Growth for Model Consumer Durables.” Management
Science, 15(5): 215–227.
Bohlmann, Jonathan D, Peter N Golder, and Debanjan Mitra. 2002. “Deconstructing the
pioneer’s advantage: Examining vintage e↵ects and consumer valuations of quality and variety.”
Management Science, 48(9): 1175–1195.
Boudreau, Kevin, and Andrei Hagiu. 2009. “Platforms Rules: Multi-Sided Platforms as Reg-
ulators.” In Platforms, Markets and Innovation. Edward Elgar.
Bresnahan, Timothy F, and Shane Greenstein. 1999. “Technological competition and the
structure of the computer industry.” The Journal of Industrial Economics, 47(1): 1–40.
Cachon, Gerard P, Kaitlin M Daniels, and Ruben Lobel. 2017. “The role of surge pric-
ing on a service platform with self-scheduling capacity.” Manufacturing & Service Operations
Management, 19(3): 368–384.
Caillaud, Bernard, and Bruno Jullien. 2003. “Chicken-and-egg: competition among interme-
diation service providers.” The RAND Journal of Economics, 34(2): 309–328.
Casadesus-Masanell, Ramon, and Hanna Halaburda. 2014. “When Does a Platform Create
Value by Limiting Choice?” Journal of Economics and Management Strategy, 23(2): 259–293.
Cennamo, Carmelo, and Juan Santalo. 2013. “Platform competition: Strategic trade-o↵s in
platform markets.” Strategic Management Journal, 34(11): 1331–1350.
29

Chen, M Keith, Judith Chevalier, Peter Rossi, and Emily Oehlsen. 2017. “The Value
of Flexible Work: Evidence from Uber Drivers.” National Bureau of Economic Research, Cam-
bridge, MA.
Dellarocas, Chrysanthos. 2003. “The Digitization of Word of Mouth: Promise and Challenges
of Online Feedback Mechanisms.” Management Science, 49(10): 1407–1424.
Dellarocas, Chrysanthos, and Charles A Wood. 2008. “The sound of silence in online
feedback: Estimating trading risks in the presence of reporting bias.” Management Science,
54(3): 460–476.
Dinerstein, Michael, Liran Einav, Jonathan Levin, and Neel Sundaresan. 2014. “Con-
sumer Price Search and Platform Design in Internet Commerce.” NBER Working Paper 20415.
Du�e, Darrell, and Yeneng Sun. 2012. “The exact law of large numbers for independent
random matching.” Journal of Economic Theory, 147(3): 1105–1139.
Economides, Nicholas, and Evangelos Katsamakas. 2006. “Two-sided competition of pro-
prietary vs. open source technology platforms and the implications for the software industry.”
Management Science, 52(7): 1057–1071.
Einav, Liran, Chiara Farronato, Jonathan Levin, and Neel Sundaresan. 2018. “Auctions
versus posted prices in online markets.” Journal of Political Economy, 126(1): 178–215.
Eisenmann, Thomas, Geo↵rey Parker, and Marshall W Van Alstyne. 2006. “Strategies
for two-sided markets.” Harvard business review, 84(10): 92.
Eisenmann, Thomas R, Geo↵rey Parker, and Marshall W Van Alstyne. 2011. “Platform
Envelopment.” Strategic Management Journal, 32(12): 1270–1285.
Ellison, Glenn, and Drew Fudenberg. 2003. “Knife-edge or plateau: When do market models
tip?” The Quarterly Journal of Economics, 118(4): 1249–1278.
Evans, David S. 2003. “The Antitrust Economics of Multi-Sided Platform Markets.” Yale Journal
on Regulation, 20(2): 4.
Farronato, Chiara, and Andrey Fradkin. 2018. “The Welfare E↵ects of Peer Entry in the
Accommodation Market: The Case of Airbnb.”
Fradkin, Andrey. 2014. “Search Frictions and the Design of Online Marketplaces.” Working
Paper.
30
Gawer, A, and M A Cusumano. 2014. “Industry platforms and ecosystem innovation.” Journal
of Product Innovation.
Greenstein, Shane, and Tarun Khanna. 1997. “What does industry convergence mean.” In
Competing in the age of digital convergence. Boston:Harvard Business School Press.
Griliches, Zvi. 1957. “Hybrid corn: An exploration in the economics of technological change.”
Econometrica, Journal of the Econometric Society, 501–522.
Hagiu, Andrei. 2007. “Merchant or Two-Sided Platform?” Review of Network Economics, 6(2).
Hagiu, Andrei. 2009. “Two-Sided Platforms: Product Variety and Pricing Structures.” Journal
of Economics & Management Strategy, 18(4): 1011–1043.
Hagiu, Andrei, and Julian Wright. 2015. “Marketplace or Reseller?” Management Science,
61(1): 184–203.
Hall, Jonathan V, and Alan B Krueger. 2015. “An Analysis of the Labor Market for Uber’s
Driver-Partners in the United States.”
Hall, Jonathan V, John J Horton, and Daniel T Knoepfle. 2017. “Labor Market Equili-
bration: Evidence from Uber.”
Hall, Robert E. 2005. “Employment fluctuations with equilibrium wage stickiness.” American
Economic Review, 50–65.
Horton, John J. 2016. “Supply Constraints as a Market Friction: Evidence from an Online Labor
Market.”
Huang, Peng, Marco Ceccagnoli, Chris Forman, and D J Wu. 2013. “Appropriability mech-
anisms and the platform partnership decision: Evidence from enterprise software.” Management
Science, 59(1): 102–121.
Hui, Xiang, Maryam Saeedi, Zeqian Shen, and Neel Sundaresan. 2016. “Reputation and
Regulations: Evidence from eBay.” Management Science, mnsc.2015.2323.
Jiang, Baojun, Kinshuk Jerath, and Kannan Srinivasan. 2011. “Firm strategies in the “mid
tail” of platform-based retailing.” Marketing Science, 30(5): 757–775.
Judd, Kenneth L. 1985. “The law of large numbers with a continuum of iid random variables.”
Journal of Economic theory, 35(1): 19–25.
31
Katz, Michael L, and Carl Shapiro. 1985. “Network externalities, competition, and compati-
bility.” The American economic review, 75(3): 424–440.
Lieberman, Marvin B, and David B Montgomery. 1988. “First-mover advantages.” Strategic
Management Journal, 9(S1): 41–58.
Li, Jun, Antonio Moreno, and Dennis J Zhang. 2016. “Agent Behavior in the Sharing
Economy: Evidence from Airbnb.”
Luca, Michael, and Georgios Zervas. 2016. “Fake it till you make it: Reputation, competition,
and Yelp review fraud.” Management Science, 62(12): 3412–3427.
Montgomery, James D. 1991. “Equilibrium wage dispersion and interindustry wage di↵eren-
tials.” The Quarterly Journal of Economics, 163–179.
Parker, Geo↵rey G, and Marshall W Van Alstyne. 2005. “Two-sided network e↵ects: A
theory of information product design.” Management Science, 51(10): 1494–1504.
Petrongolo, Barbara, and Christopher A Pissarides. 2001. “Looking into the Black Box: A
Survey of the Matching Function.” Journal of Economic Literature, 39(2): 390–431.
Pissarides, Christopher A. 2000. Equilibrium Unemployment Theory. The MIT Press.
Resnick, Paul, and Richard Zeckhauser. 2002. “Trust among strangers in Internet trans-
actions: Empirical analysis of eBay’s reputation system.” The Economics of the Internet and
E-commerce, 127–157.
Rietveld, Joost, Melissa A Scholling, and Cristiano Bellavitis. 2016. “Reload and Relaunch:
Strategic Governance of Platform Ecosystems.” Working Paper.
Rochet, Jean-Charles, and Jean Tirole. 2003. “Platform competition in two-sided markets.”
Journal of the European Economic Association, 1(4): 990–1029.
Rysman, Marc. 2009. “The economics of two-sided markets.” Journal of Economic Perspectives,
23(3): 125–43.
Seamans, Robert, and Feng Zhu. 2013. “Responses to entry in multi-sided markets: The
impact of Craigslist on local newspapers.” Management Science, 60(2): 476–493.
Stevens, Margaret. 2007. “New Microfoundations for the Aggregate Matching Function.” Inter-
national Economics Review, 48(3): 847–868.
32
Stock, James, and Motohiro Yogo. 2005. “Testing for Weak Instruments in Linear IV Regres-
sion.” Identification and Inference for Econometric Models, , ed. Donald W K Andrews, 80–108.
New York:Cambridge University Press.
Tucker, Catherine. 2008. “Identifying formal and informal influence in technology adoption with
network externalities.” Management Science, 54(12): 2024–2038.
Vincenty, Thaddeus. 1975. “Direct and inverse solutions of geodesics on the ellipsoid with ap-
plication of nested equations.” Survey review, 23(176): 88–93.
Weyl, E Glen. 2010. “A price theory of multi-sided platforms.” The American Economic Review,
100(4): 1642–1672.
Young, H Peyton. 2009. “Innovation di↵usion in heterogeneous populations: Contagion, social
influence, and social learning.” The American economic review, 1899–1924.
Zervas, Georgios, Davide Proserpio, and John Byers. 2016. “The Rise of the Sharing Econ-
omy: Estimating the Impact of Airbnb on the Hotel Industry.” Working Paper.
Zhu, Feng, and Marco Iansiti. 2012. “Entry into platform-based markets.” Strategic Manage-
ment Journal, 33(1): 88–106.
33
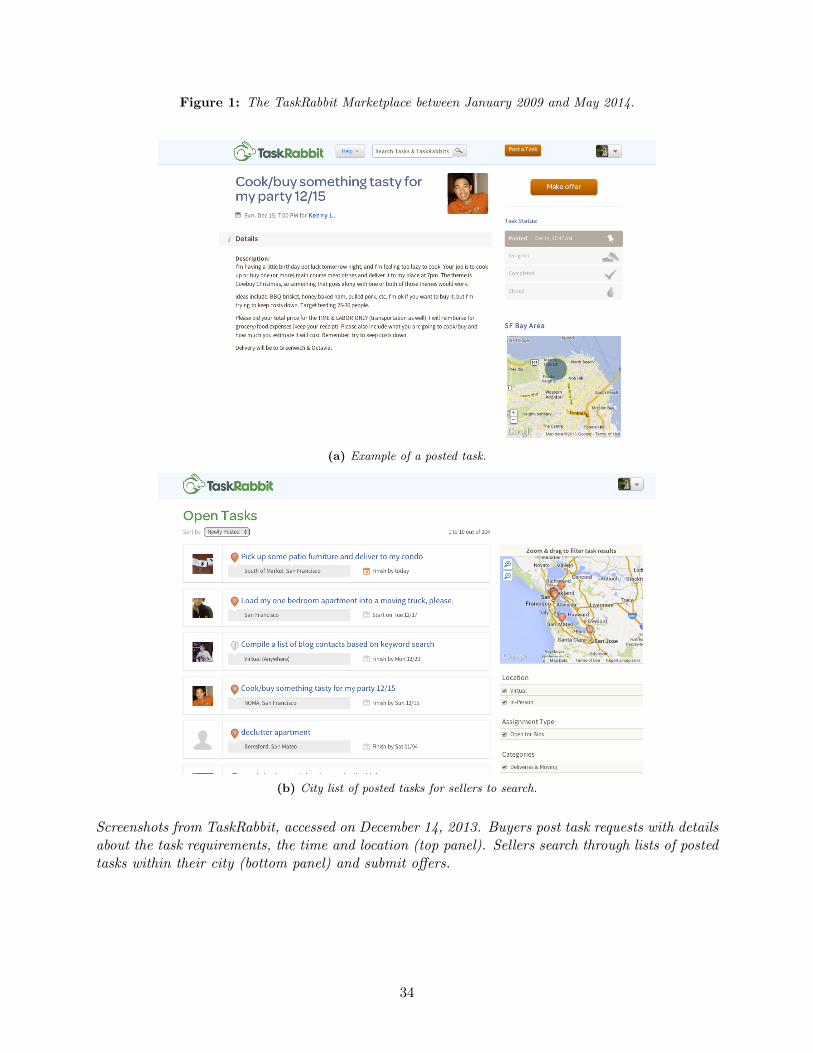
Figure 1: The TaskRabbit Marketplace between January 2009 and May 2014.
(a) Example of a posted task.
(b) City list of posted tasks for sellers to search.
Screenshots from TaskRabbit, accessed on December 14, 2013. Buyers post task requests with detailsabout the task requirements, the time and location (top panel). Sellers search through lists of postedtasks within their city (bottom panel) and submit o↵ers.
34
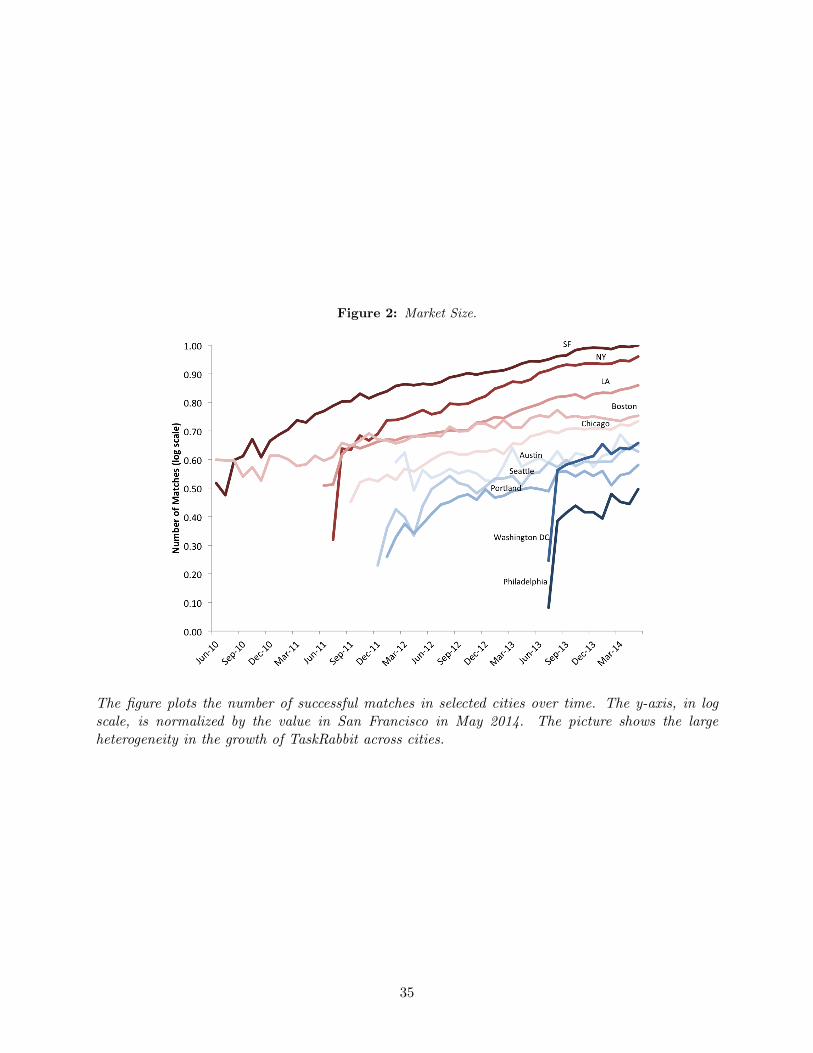
Figure 2: Market Size.
The figure plots the number of successful matches in selected cities over time. The y-axis, in logscale, is normalized by the value in San Francisco in May 2014. The picture shows the largeheterogeneity in the growth of TaskRabbit across cities.
35
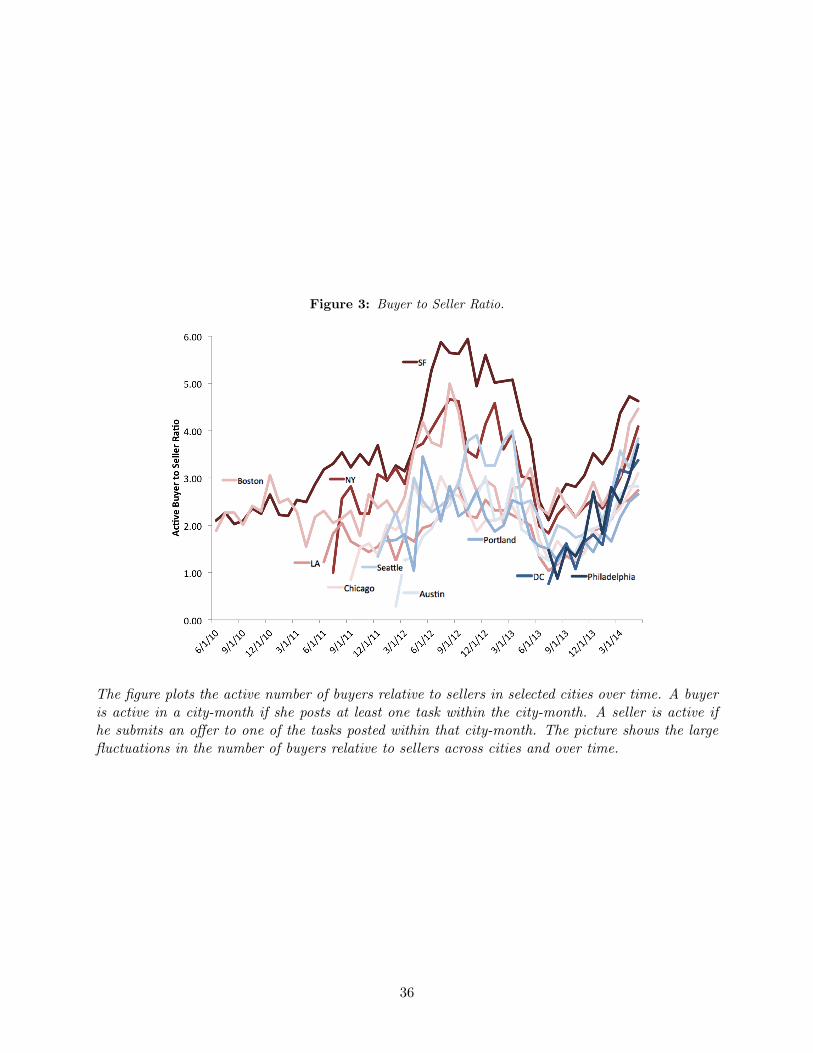
Figure 3: Buyer to Seller Ratio.
The figure plots the active number of buyers relative to sellers in selected cities over time. A buyeris active in a city-month if she posts at least one task within the city-month. A seller is active ifhe submits an o↵er to one of the tasks posted within that city-month. The picture shows the largefluctuations in the number of buyers relative to sellers across cities and over time.
36
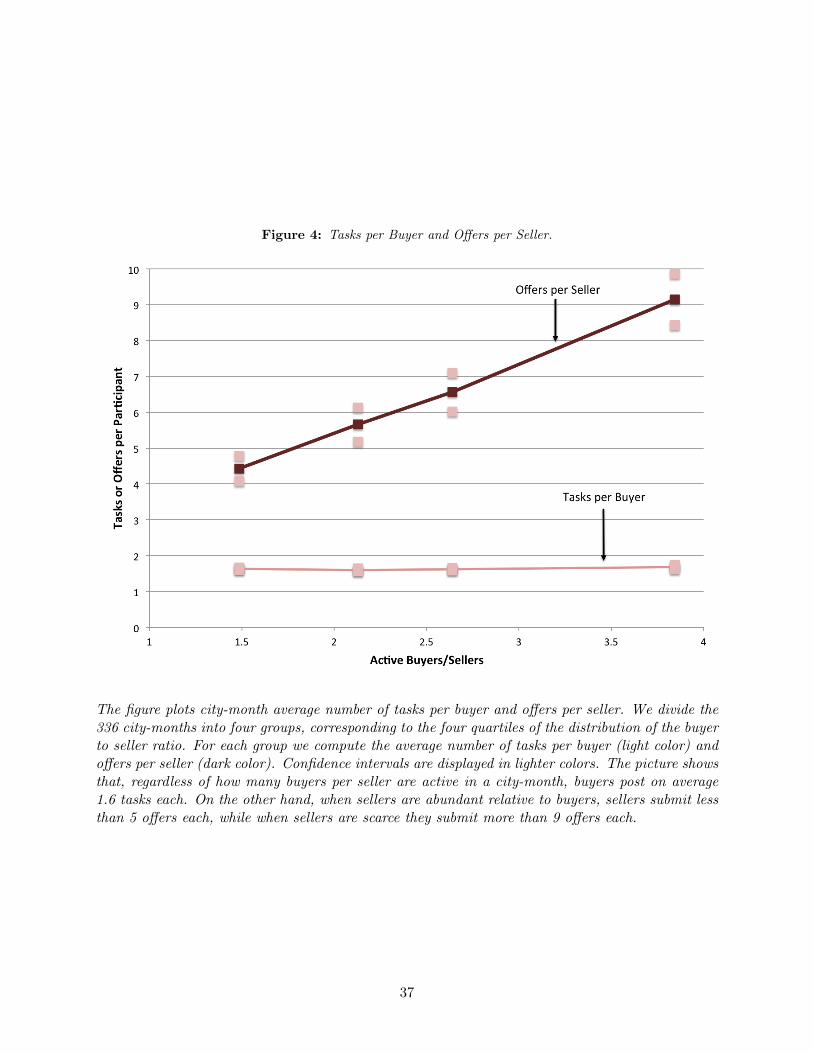
Figure 4: Tasks per Buyer and O↵ers per Seller.
The figure plots city-month average number of tasks per buyer and o↵ers per seller. We divide the336 city-months into four groups, corresponding to the four quartiles of the distribution of the buyerto seller ratio. For each group we compute the average number of tasks per buyer (light color) ando↵ers per seller (dark color). Confidence intervals are displayed in lighter colors. The picture showsthat, regardless of how many buyers per seller are active in a city-month, buyers post on average1.6 tasks each. On the other hand, when sellers are abundant relative to buyers, sellers submit lessthan 5 o↵ers each, while when sellers are scarce they submit more than 9 o↵ers each.
37
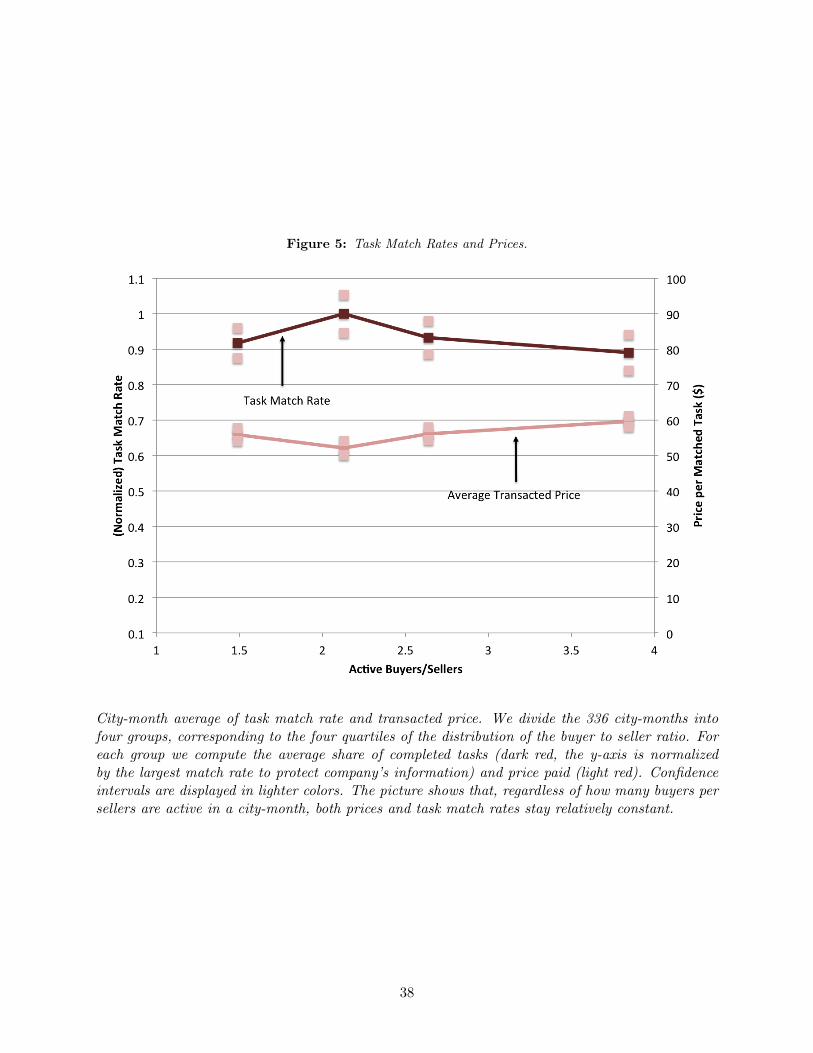
Figure 5: Task Match Rates and Prices.
City-month average of task match rate and transacted price. We divide the 336 city-months intofour groups, corresponding to the four quartiles of the distribution of the buyer to seller ratio. Foreach group we compute the average share of completed tasks (dark red, the y-axis is normalizedby the largest match rate to protect company’s information) and price paid (light red). Confidenceintervals are displayed in lighter colors. The picture shows that, regardless of how many buyers persellers are active in a city-month, both prices and task match rates stay relatively constant.
38

Figure 6: Geographic Distance Between Buyers and Sellers Over Time.
The figure plots the median distance within a city-month between three di↵erent pairings of buyersand sellers, for the three largest cities over time, and confirms that even if the platform is growingin size in every city, the distance between buyers and sellers does not decrease. The distance ismeasured as the length of the shortest ellipsoidal curve between the buyer zip code and the sellerzip code (Vincenty (1975)). In each plot, buyers and sellers are paired in three di↵erent ways. Thefirst pairing (top line) takes a seller who made an o↵er at a specific time, and pairs him to everybuyer who posted tasks in the preceding 48 hours. The median distance is computed among all suchpairs within a city-month. In the second pairing (middle line) a buyer is paired with a seller if hertask received an o↵er from that seller. Each pair is weighted by the number of their task-o↵er pairswithin a city-month, and the median is computed among all such pairings. In the third pairing(bottom line) a buyer is paired with a seller if they actually exchanged services. As before, eachbuyer-seller pair is weighted by the number of their successful matches within a city-month.
39
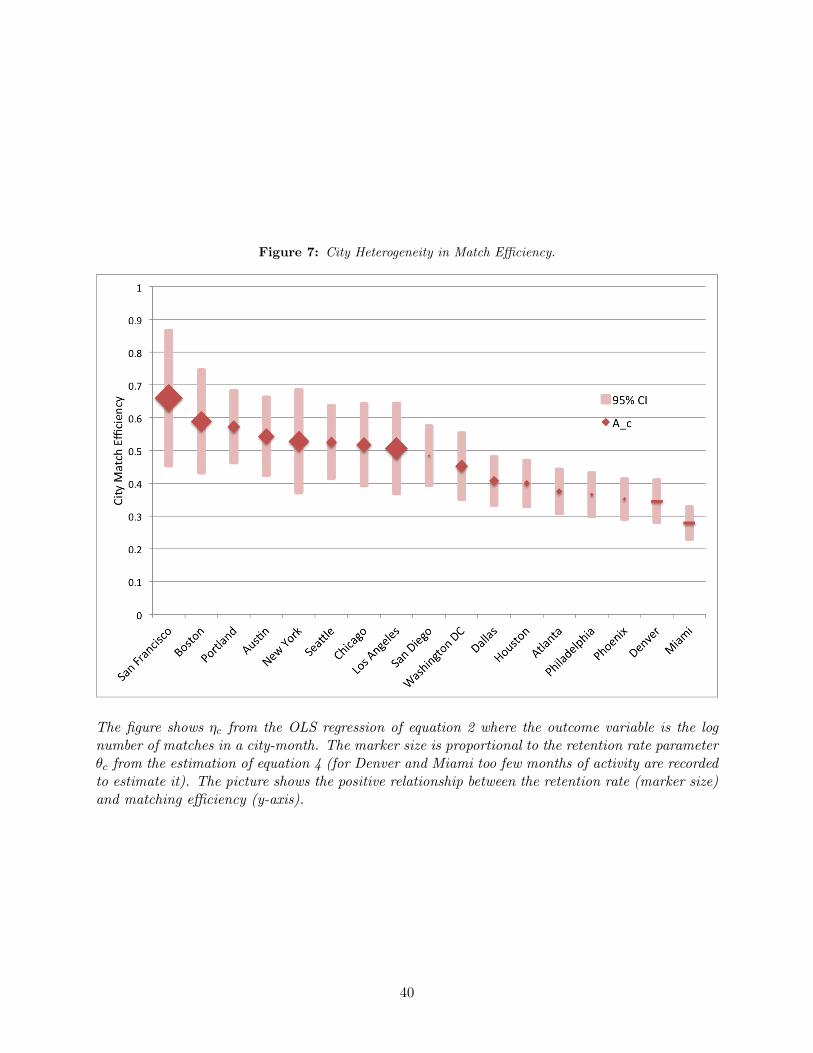
Figure 7: City Heterogeneity in Match E�ciency.
The figure shows ⌘c from the OLS regression of equation 2 where the outcome variable is the lognumber of matches in a city-month. The marker size is proportional to the retention rate parameter✓c from the estimation of equation 4 (for Denver and Miami too few months of activity are recordedto estimate it). The picture shows the positive relationship between the retention rate (marker size)and matching e�ciency (y-axis).
40
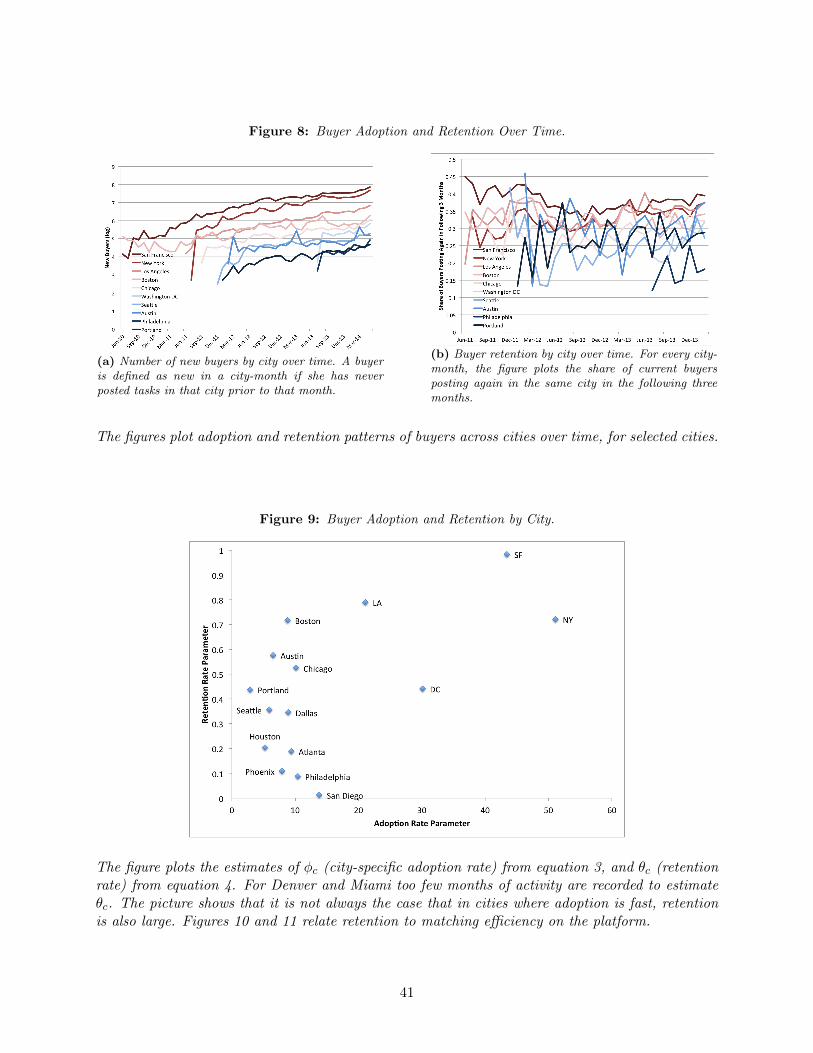
Figure 8: Buyer Adoption and Retention Over Time.
(a) Number of new buyers by city over time. A buyer
is defined as new in a city-month if she has never
posted tasks in that city prior to that month.
(b) Buyer retention by city over time. For every city-
month, the figure plots the share of current buyers
posting again in the same city in the following three
months.
The figures plot adoption and retention patterns of buyers across cities over time, for selected cities.
Figure 9: Buyer Adoption and Retention by City.
The figure plots the estimates of �c (city-specific adoption rate) from equation 3, and ✓c (retentionrate) from equation 4. For Denver and Miami too few months of activity are recorded to estimate✓c. The picture shows that it is not always the case that in cities where adoption is fast, retentionis also large. Figures 10 and 11 relate retention to matching e�ciency on the platform.
41
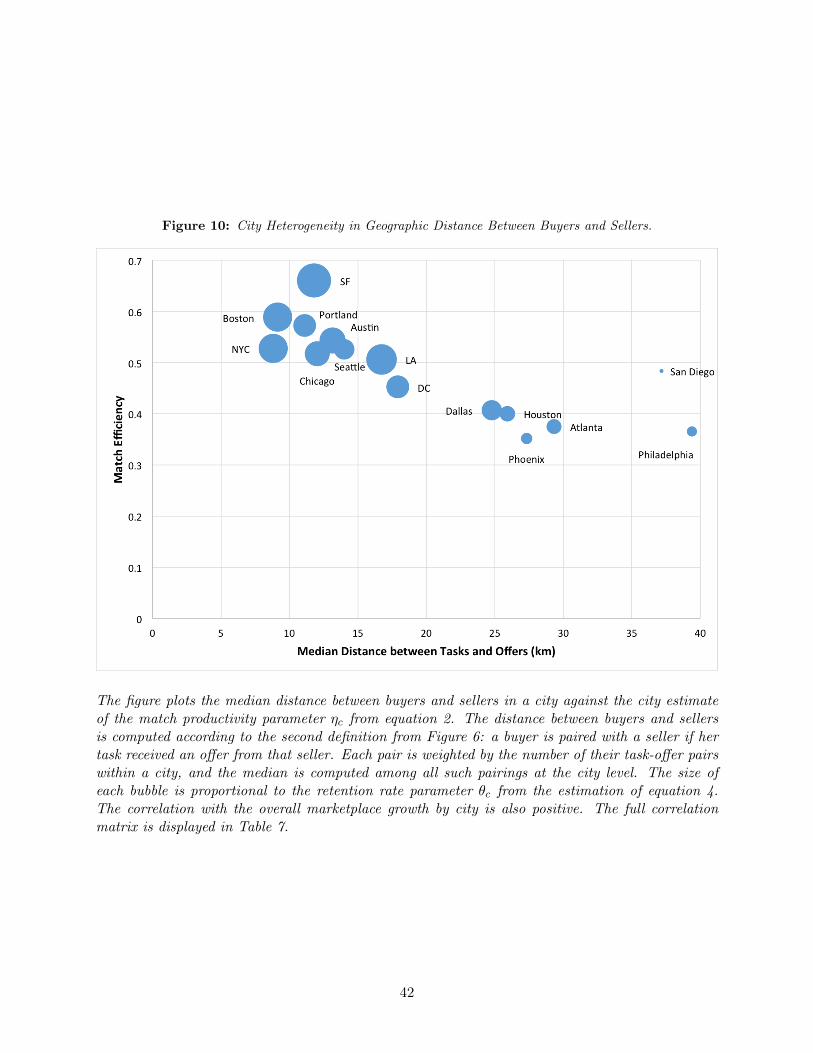
Figure 10: City Heterogeneity in Geographic Distance Between Buyers and Sellers.
The figure plots the median distance between buyers and sellers in a city against the city estimateof the match productivity parameter ⌘c from equation 2. The distance between buyers and sellersis computed according to the second definition from Figure 6: a buyer is paired with a seller if hertask received an o↵er from that seller. Each pair is weighted by the number of their task-o↵er pairswithin a city, and the median is computed among all such pairings at the city level. The size ofeach bubble is proportional to the retention rate parameter ✓c from the estimation of equation 4.The correlation with the overall marketplace growth by city is also positive. The full correlationmatrix is displayed in Table 7.
42
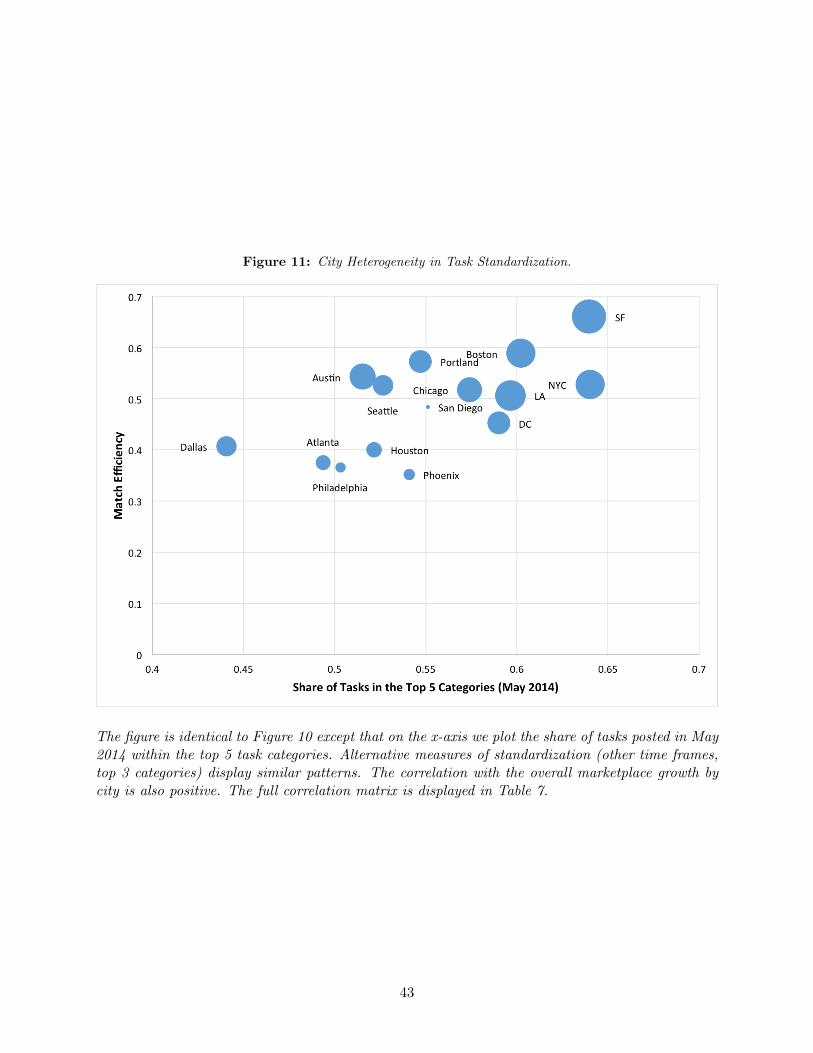
Figure 11: City Heterogeneity in Task Standardization.
The figure is identical to Figure 10 except that on the x-axis we plot the share of tasks posted in May2014 within the top 5 task categories. Alternative measures of standardization (other time frames,top 3 categories) display similar patterns. The correlation with the overall marketplace growth bycity is also positive. The full correlation matrix is displayed in Table 7.
43
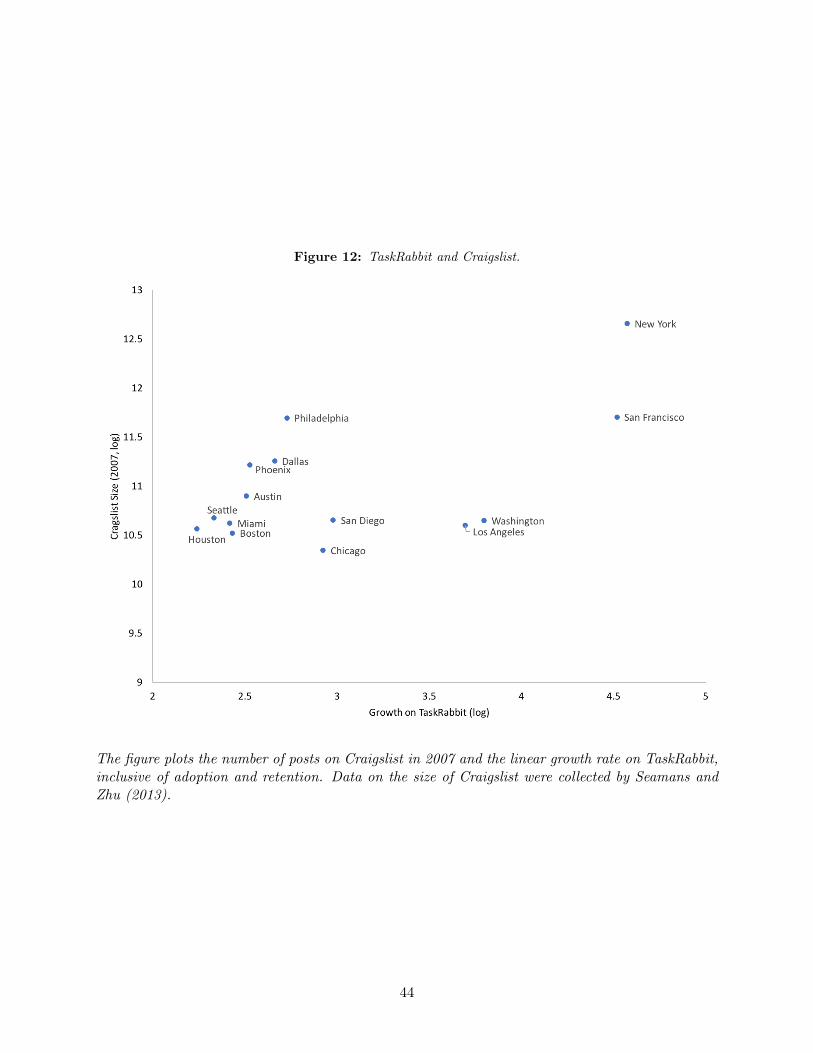
Figure 12: TaskRabbit and Craigslist.
The figure plots the number of posts on Craigslist in 2007 and the linear growth rate on TaskRabbit,inclusive of adoption and retention. Data on the size of Craigslist were collected by Seamans andZhu (2013).
44
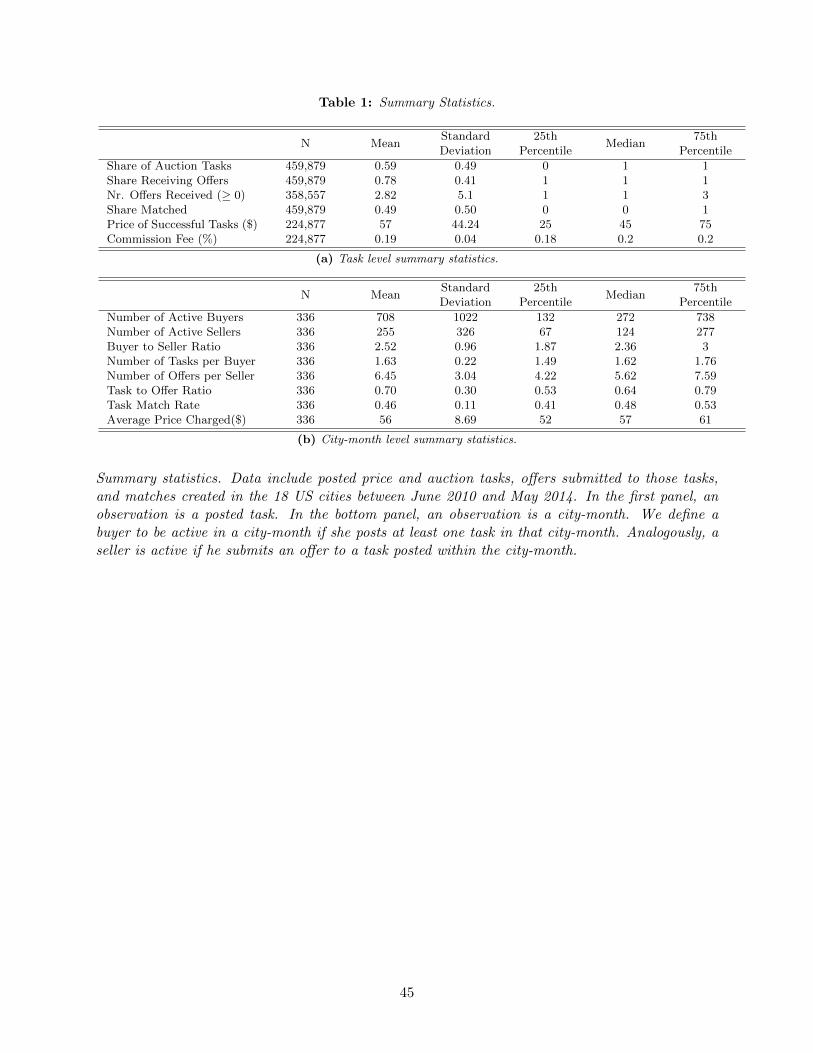
Table 1: Summary Statistics.
N MeanStandardDeviation
25thPercentile
Median75th
PercentileShare of Auction Tasks 459,879 0.59 0.49 0 1 1Share Receiving O↵ers 459,879 0.78 0.41 1 1 1Nr. O↵ers Received (� 0) 358,557 2.82 5.1 1 1 3Share Matched 459,879 0.49 0.50 0 0 1Price of Successful Tasks ($) 224,877 57 44.24 25 45 75Commission Fee (%) 224,877 0.19 0.04 0.18 0.2 0.2
(a) Task level summary statistics.
N MeanStandardDeviation
25thPercentile
Median75th
PercentileNumber of Active Buyers 336 708 1022 132 272 738Number of Active Sellers 336 255 326 67 124 277Buyer to Seller Ratio 336 2.52 0.96 1.87 2.36 3Number of Tasks per Buyer 336 1.63 0.22 1.49 1.62 1.76Number of O↵ers per Seller 336 6.45 3.04 4.22 5.62 7.59Task to O↵er Ratio 336 0.70 0.30 0.53 0.64 0.79Task Match Rate 336 0.46 0.11 0.41 0.48 0.53Average Price Charged($) 336 56 8.69 52 57 61
(b) City-month level summary statistics.
Summary statistics. Data include posted price and auction tasks, o↵ers submitted to those tasks,and matches created in the 18 US cities between June 2010 and May 2014. In the first panel, anobservation is a posted task. In the bottom panel, an observation is a city-month. We define abuyer to be active in a city-month if she posts at least one task in that city-month. Analogously, aseller is active if he submits an o↵er to a task posted within the city-month.
45
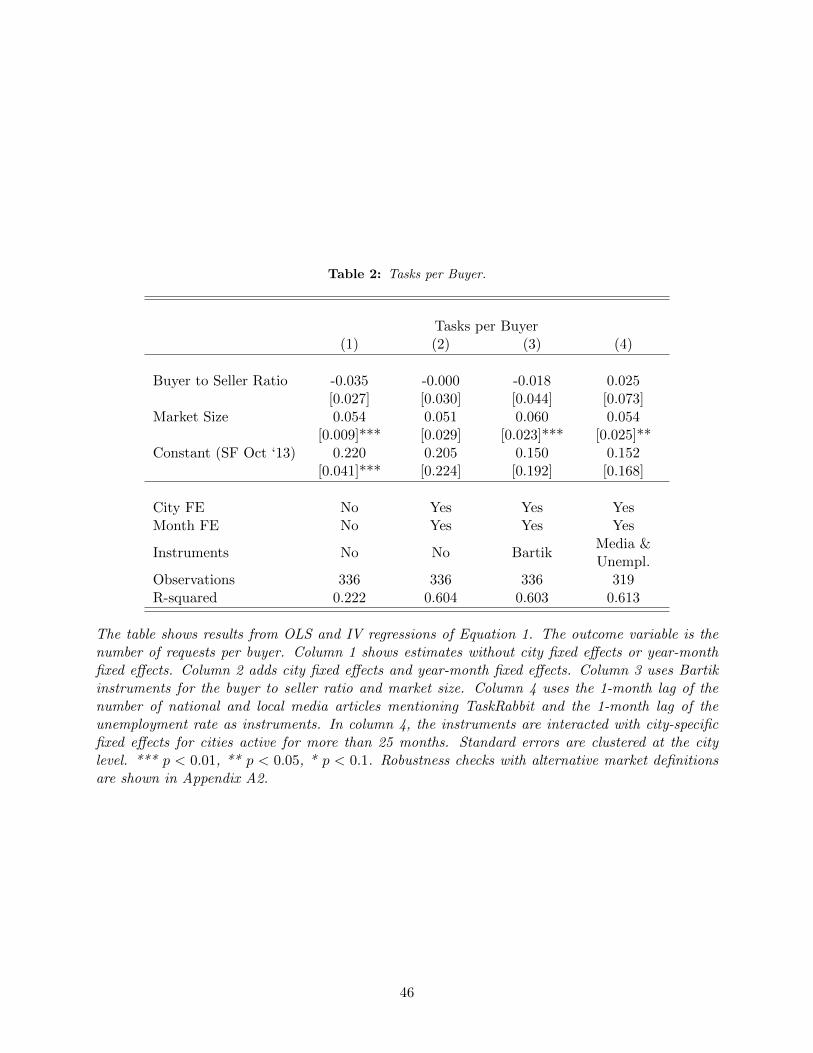
Table 2: Tasks per Buyer.
Tasks per Buyer(1) (2) (3) (4)
Buyer to Seller Ratio -0.035 -0.000 -0.018 0.025[0.027] [0.030] [0.044] [0.073]
Market Size 0.054 0.051 0.060 0.054[0.009]*** [0.029] [0.023]*** [0.025]**
Constant (SF Oct ‘13) 0.220 0.205 0.150 0.152[0.041]*** [0.224] [0.192] [0.168]
City FE No Yes Yes YesMonth FE No Yes Yes Yes
Instruments No No BartikMedia &Unempl.
Observations 336 336 336 319R-squared 0.222 0.604 0.603 0.613
The table shows results from OLS and IV regressions of Equation 1. The outcome variable is thenumber of requests per buyer. Column 1 shows estimates without city fixed e↵ects or year-monthfixed e↵ects. Column 2 adds city fixed e↵ects and year-month fixed e↵ects. Column 3 uses Bartikinstruments for the buyer to seller ratio and market size. Column 4 uses the 1-month lag of thenumber of national and local media articles mentioning TaskRabbit and the 1-month lag of theunemployment rate as instruments. In column 4, the instruments are interacted with city-specificfixed e↵ects for cities active for more than 25 months. Standard errors are clustered at the citylevel. *** p < 0.01, ** p < 0.05, * p < 0.1. Robustness checks with alternative market definitionsare shown in Appendix A2.
46
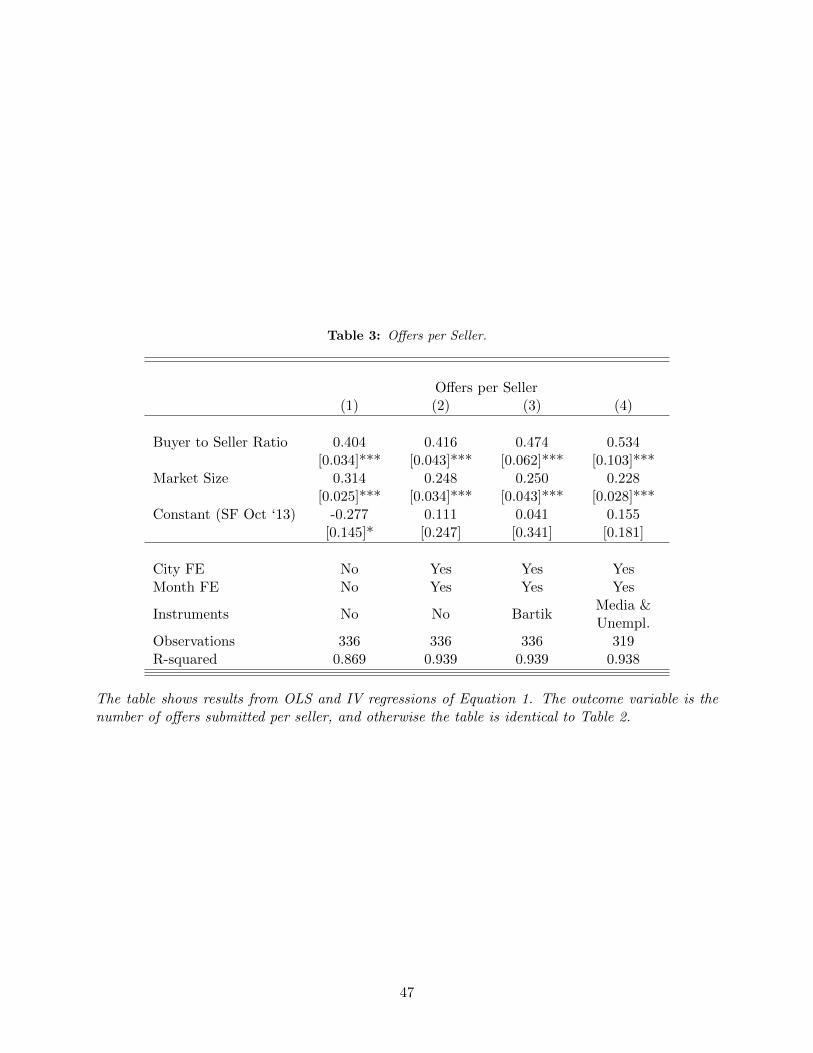
Table 3: O↵ers per Seller.
O↵ers per Seller(1) (2) (3) (4)
Buyer to Seller Ratio 0.404 0.416 0.474 0.534[0.034]*** [0.043]*** [0.062]*** [0.103]***
Market Size 0.314 0.248 0.250 0.228[0.025]*** [0.034]*** [0.043]*** [0.028]***
Constant (SF Oct ‘13) -0.277 0.111 0.041 0.155[0.145]* [0.247] [0.341] [0.181]
City FE No Yes Yes YesMonth FE No Yes Yes Yes
Instruments No No BartikMedia &Unempl.
Observations 336 336 336 319R-squared 0.869 0.939 0.939 0.938
The table shows results from OLS and IV regressions of Equation 1. The outcome variable is thenumber of o↵ers submitted per seller, and otherwise the table is identical to Table 2.
47

Table 4: Number of Matches.
Number of Matches(1) (2) (3) (4) (5)
Tasks 0.405 0.410 0.615 0.518 0.416[0.094]*** [0.054]*** [0.077]*** [0.071]*** [0.100]***
O↵ers 0.583 0.521 0.344 0.389 0.529[0.092]*** [0.043]*** [0.069]*** [0.061]*** [0.080]***
Constant (SF Oct ‘13) -0.970 -0.416 -0.505 -0.096 -0.552[0.173]*** [0.168]** [0.113]*** [0.224] [0.202]***
City FE No Yes Yes Yes YesMonth FE No Yes Yes Yes Yes
Instruments No NoNr. Buyers& Sellers
BartikMedia &Unempl.
Observations 336 336 336 336 319R-squared 0.973 0.996 0.996 0.996 0.997
The table shows results from OLS and IV regressions of Equation 2. The outcome variable is thenumber of matches. Column 1 shows estimates without city fixed e↵ects or year-month fixed e↵ects.Column 2 adds city fixed e↵ects and year-month fixed e↵ects. Column 3 uses the number of activebuyers and sellers to instrument for the number of tasks requested and o↵ers submitted. Column 4uses Bartik instruments for the number of active buyers and sellers. Column 5 uses the 1-monthlag of the number of national and local media articles mentioning TaskRabbit and the 1-month lagof the unemployment rate as instruments. In column 5, the instruments are interacted with city-specific fixed e↵ects for cities active for more than 25 months. Standard errors are clustered atthe city level. *** p < 0.01, ** p < 0.05, * p < 0.1. Robustness checks with alternative marketdefinitions are shown in Appendix A2.
48

Table 5: Transacted Prices.
Transacted Prices(1) (2) (3) (4) (5)
Tasks 0.185 0.015 0.016 0.020 0.108[0.057]*** [0.049] [0.072] [0.079] [0.120]
O↵ers -0.137 -0.013 -0.016 -0.032 -0.115[0.044]*** [0.042] [0.063] [0.056] [0.106]
Constant (SF Oct ‘13) 3.771 4.099 4.129 4.254 4.277[0.116]*** [0.152]*** [0.112]*** [0.274]*** [0.076]***
City FE No Yes Yes Yes YesMonth FE No Yes Yes Yes Yes
Instruments No NoNr. Buyers& Sellers
BartikMedia &Unempl.
Observations 336 336 336 336 319R-squared 0.108 0.727 0.727 0.726 0.718
The tables show results from OLS and IV regressions of Equation 2. The outcome variable is theaverage transacted price, and otherwise the table is identical to Table 4.
49
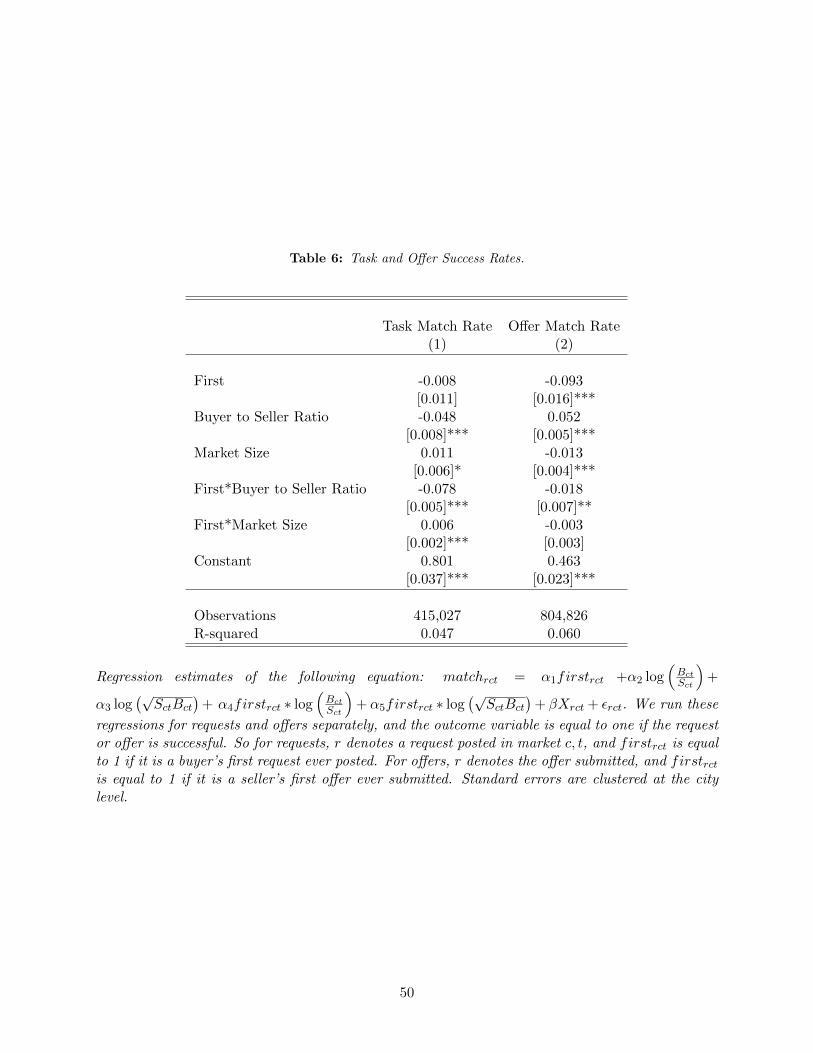
Table 6: Task and O↵er Success Rates.
Task Match Rate O↵er Match Rate(1) (2)
First -0.008 -0.093[0.011] [0.016]***
Buyer to Seller Ratio -0.048 0.052[0.008]*** [0.005]***
Market Size 0.011 -0.013[0.006]* [0.004]***
First*Buyer to Seller Ratio -0.078 -0.018[0.005]*** [0.007]**
First*Market Size 0.006 -0.003[0.002]*** [0.003]
Constant 0.801 0.463[0.037]*** [0.023]***
Observations 415,027 804,826R-squared 0.047 0.060
Regression estimates of the following equation: matchrct = ↵1firstrct +↵2 log⇣BctSct
⌘+
↵3 log�p
SctBct�+ ↵4firstrct ⇤ log
⇣BctSct
⌘+ ↵5firstrct ⇤ log
�pSctBct
�+ �Xrct + ✏rct. We run these
regressions for requests and o↵ers separately, and the outcome variable is equal to one if the requestor o↵er is successful. So for requests, r denotes a request posted in market c, t, and firstrct is equalto 1 if it is a buyer’s first request ever posted. For o↵ers, r denotes the o↵er submitted, and firstrct
is equal to 1 if it is a seller’s first o↵er ever submitted. Standard errors are clustered at the citylevel.
50
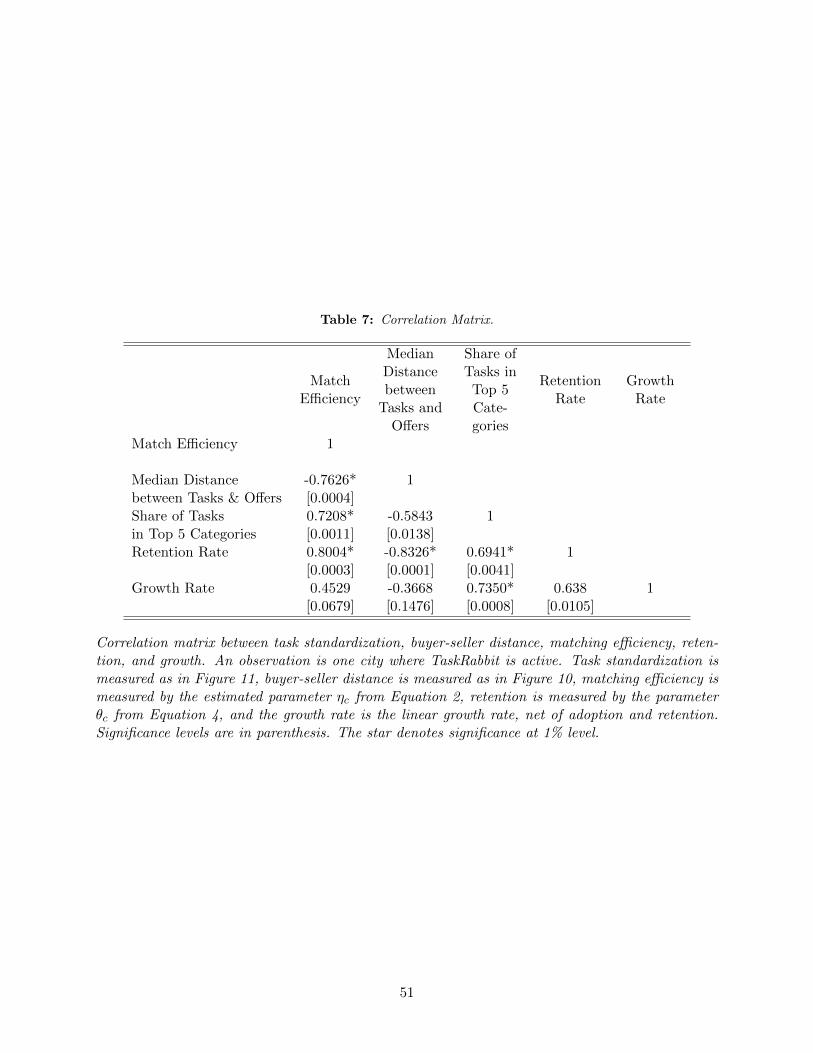
Table 7: Correlation Matrix.
MatchE�ciency
MedianDistancebetweenTasks andO↵ers
Share ofTasks inTop 5Cate-gories
RetentionRate
GrowthRate
Match E�ciency 1
Median Distance -0.7626* 1between Tasks & O↵ers [0.0004]Share of Tasks 0.7208* -0.5843 1in Top 5 Categories [0.0011] [0.0138]Retention Rate 0.8004* -0.8326* 0.6941* 1
[0.0003] [0.0001] [0.0041]Growth Rate 0.4529 -0.3668 0.7350* 0.638 1
[0.0679] [0.1476] [0.0008] [0.0105]
Correlation matrix between task standardization, buyer-seller distance, matching e�ciency, reten-tion, and growth. An observation is one city where TaskRabbit is active. Task standardization ismeasured as in Figure 11, buyer-seller distance is measured as in Figure 10, matching e�ciency ismeasured by the estimated parameter ⌘c from Equation 2, retention is measured by the parameter✓c from Equation 4, and the growth rate is the linear growth rate, net of adoption and retention.Significance levels are in parenthesis. The star denotes significance at 1% level.
51