Embed Size (px)
Citation preview

Key Figures of
Success Miba Shareholder Information
First Half-Year 2015–2016 February 1 to July 31, 2015


3
Condensed management report for the first half of 2015-2016bericht über das erste Halbjahr 2015/16 4 Economic conditions 4 Revenue and performance analysis 5 Financial position, assets and liablilities 6 Order backlog 6 Employees 6 Other events 7 Segment reporting 7 Significant risks and uncertainties 8 Outlook 8 Miba shares 9
Consolidated interim financial statements 11 IFRS consolidat de balance sheet 11 IFRS consolidated income statements 13 IFRS consolidated statement of comprehensive income 14 IFRS consolidated statement of changes in equity 15 IFRS consolidated cash flow statement 17 Selected notes to the consolidated interim financial statements for the period ended July 31, 2015 19
Statement by the Management Board as required by section 87(1) number 3 of the Austrian Stock Exchange
Act (BörseG) 35
Contents
> Half-Year 2015–2016 > Management Report
4
Economic conditions
In the first half of 2015, global economic growth was again characterized by geopolitical uncertainties,
weakening growth in China and overheated financial markets. Against this background, the International
Monetary Fund (IMF) has revised the global growth expectations published in April and, as of now, reduced the
forecast for 2015 by 0.2 percentage points to 3.3 percent. According to the IMF, industrial nations will grow by
2.1 percent in 2015 (and thus 0.3 percentage points less than predicted in April). Due to the current economic
situation, the IMF revised the growth projections for the US downwards by 0.6 percentage points to 2.5
percent; the growth forecast for the eurozone remains unchanged at 1.5 percent (after growth of 0.8 percent in
2014). For emerging market economies, the IMF is expecting economic growth of 4.2 percent, which
corresponds to a slight markdown of 0.1 percentage points. For China, the growth forecast remains unchanged
at 6.8 percent (after growth of 7.4 percent in 2014), although these predictions do not yet take account of the
latest developments after the fall in the stock market, which started after the middle of the year, and the
disappointing economic data for June and July 2015.1
Performance in Miba’s sales markets was inconsistent in the first half of fiscal year 2015–2016. Overall, the first
half of the year was still based on rising sales in most global automotive markets and a temporary recovery in
large engines. The automotive industry was characterized by differing performances in sales and production
figures: While registrations continued their positive performance of the past year, essentially driven by the
market situation in Europe and the US, production figures remained virtually unchanged in the first half of the
year. In Europe, the number of registrations rose by 9.4 percent in the first six months of the year compared
with the prior-year comparative period.2 North America also recorded 4.2 percent more registrations in the first
half of 2015 than in the first half of 2014; the number of passenger vehicles and light commercial vehicles
produced however only rose by 1.7 percent.3 By contrast, in the first half of 2015, the Chinese automotive
industry only recorded a small increase in sales of 1 percent and an increase in production of 3 percent
compared with the prior-year comparative period.4 The figures for July 2015 were particularly disappointing;
initial registrations declined by 7 percent year on year.5 The automotive market in India remains at a low level
and does not demonstrate any sustained growth trends. In the first half of the year, sales and production
figures each recorded a rise of 6 percent compared with the first half of 2014.6 In Brazil, the downward trend of
the past year also continued from January to June 2015 – production figures fell by 18.5 percent, registrations
even by 20.7 percent.7
The picture in the capital goods industry, and in the global truck industry in particular, was markedly negative. In
the first half of 2015, China, the largest and, for Miba, the most significant truck market in the world, recorded a
dramatic 33 percent reduction in production figures compared with the first half of 2014.8
By contrast, while the European and North American truck markets performed positively with an increase in
registrations and sales of 20.3 percent and 31 percent respectively, the outlook is still difficult.9 The weak or
declining trends in the construction machinery and mining equipment markets and the agricultural commercial
Condensed management report for the first half of 2015–2016
1 cf. International Monetary Fund (IMF), World Economic Outlook Update, July 2015 2 cf. LMC Automotive, July 2015 3 cf. Automotive News, July 20, 2015 4 cf. LMC Automotive, July 2015
5 cf. LMC Automotive, July 2015 6 cf. www.anfavea.com.br/July2015 7 cf. ACEA, New Commercial Vehicle Registrations, June 2015, and Act Research, June 2015
8 cf. LMC Automotive, July 2015 9 cf. LMC Automotive, July 2015
5
vehicle markets persisted in all regions. The persistently poor investment climate (not just in Europe but
particularly also in China) and declining public orders also had a negative effect on the construction machinery
industry in particular in the first half of the year. The restrained investment activity was also, in the first six
months of the year, reflected in the slow to declining performance of the sales markets for power electronics
components and special machinery.
Overall, it can be said that the climate in Miba’s markets has gradually worsened in recent months and that the
outlook for the majority of sales markets is also negative. This results in a higher risk profile for Miba’s business
model.
Revenue and performance analysis
Miba was not fully able to carry the momentum from the first quarter of 2015–2016 through the whole half of
the year. While the results for the first six months were also satisfactory, the pace of growth declined
significantly and the result continued to be supported by markedly positive currency translation effects.
For the period from February to July 2015, Miba generated revenue of EUR 375.2 million, which equates to an
increase of 14.0 percent compared to the prior-year comparative period. Most of this growth in revenue was
based on positive foreign currency effects (+6.7 percentage points) and effects from acquisitions (+1.6
percentage points). Organic growth for the first six months was only 5.8 percentage points. At 4.2 percentage
points, organic growth in the second quarter was significantly weaker than in the previous quarter (7.4
percentage points).
The Miba Europe segment generated the largest proportion of consolidated revenue with 68.7 percent,
followed by Miba Americas with 18.2 percent and Miba Asia with 13.1 percent. The Miba Shared Services
segment did not generate any external revenue.
In the first half of 2015–2016, Miba achieved profit before interest and tax (EBIT) of EUR 49.7 million (previous
year: EUR 41.9 million). The positive currency translation effects and increases in profit from acquisitions
contributed EUR 5.5 million to EBIT and facilitated an increase in EBIT margin to 13.3 percent (previous year:
12.7 percent). Without the above effects, EBIT margin was unchanged from the previous year at 12.7 percent.
Financial position, assets and liabilities
Total assets of EUR 789.7 million were EUR 47.8 million higher than at the January 31, 2015, reporting date
(EUR 741.9 million). Increases in working capital on the asset side (+EUR 20.7 million) were mainly attributable
to property, plant and equipment (+EUR 12.6 million) and cash and cash equivalents and current securities
(+EUR 8.5 million).
> Half-Year 2015–2016 > Management Report
6
Cash outflow for investments in property, plant and equipment and intangible assets amounted to
EUR 32.9 million (previous year: EUR 23.3 million) and was again fully covered in this period by cash flow from
operating activities, which amounted to EUR 57.7 million (previous year: EUR 39.5 million).
Group equity increased in the first six months of the current fiscal year by EUR 27.2 million and amounted to
EUR 449.2 million as of July 31, 2015 (January 31, 2015: EUR 422.0 million). The increase includes a positive
currency translation effect of EUR 5.2 million. At 56.9 percent, the equity ratio as of July 31, 2015, was exactly
at the level of the last reporting date (January 31, 2015: 56.9 percent) and above the July 31, 2014, comparative
(55.0 percent). Combined with a robust financing structure, it safeguards the financial autonomy and
independence of the Miba Group.
As of July 31, 2015, the Miba Group continued to report a solid financing structure with an excess of financial
assets over debt (net liquidity plus (current and non-current) financial assets, excluding securities to cover
pension provisions) in the amount of EUR 99.7 million.
Order backlog
At EUR 186.7 million, the order backlog as of July 31, 2015, was already lower than the order backlog as of the
January 31, 2015, reporting date (EUR 188.8 million). The order backlog still demonstrates solid demand in most
areas of the passenger vehicle industry. Order intake in capital goods markets however weakened significantly
or persisted at a low level.
Employees
As of the July 31, 2015, reporting date, the Miba Group had 4,950 employees worldwide (excluding agency
staff), which equates to an increase of 3.9 percent, or 188 employees, compared to July 31, 2014 (4,762
employees). The increase in employee numbers mainly occurred in the US and China, where numbers rose
within one year by 82 and 76 persons respectively. In Austria, Miba employed 25 more employees than as of
July 31, 2014. Including agency staff, 5,385 employees were working for Miba worldwide as of July 31, 2015
(previous year: 5,037 employees).
As of July 31, 2015, Miba was training 172 apprentices. On September 1, 2015, 36 young people commenced
their training at the Upper Austrian sites. Moreover, 12 employees started their metal worker apprenticeships as
mature students in September. The training has been tailored to Miba’s requirements, with workers from
production or production-related areas being offered the opportunity of a higher qualification regardless of their
previous training. To actively promote management talent and strengthen international collaboration, Miba is
initiating a global training program for university and college graduates in the fall.
7
Other events
Disclosures relating to the takeover offer from Mitterbauer Beteiligungs-Aktiengesellschaft (MBAG) to
Miba AG’s non-controlling interest shareholders are outlined below under Miba shares.
All detailed information, mailings and documentation in connection with the takeover offer can be downloaded
from the Miba AG website.
Other events after the reporting date which are significant to measurement as of the reporting date, such as
ongoing litigation or claims for damages, as well as other obligations or expected losses which must be
recognized or disclosed under IAS 10, have been reflected in the accompanying half-year financial statements or
are not known.
Segment reporting
Miba Europe
In the first half of 2015–2016, the Miba Europe segment particularly benefited from the continued positive
performance of the European automotive and truck industry and from numerous new sintering start-ups. At
EUR 257.6 million, external segment revenue in the reporting period was 6.1 percent higher than the prior-year
amount of EUR 242.7 million.
In the reporting period, Miba Europe invested EUR 18.4 million in new customer projects and only a very small
amount in the expansion of capacity.
Miba Americas
The Miba Americas segment was mainly able to benefit from positive currency translation effects, with revenue
in the reporting period increasing by 30.8 percent to EUR 68.3 million compared to the previous year (EUR 52.2
million). Most of the growth is attributable to the strength of the US dollar (25.2 percent), while only 3.7 percent
represents organic growth. Organic growth in the segment arose above all from the positive situation in the US
passenger vehicle and truck market.
The segment’s capital expenditure in the first half of the year amounted to EUR 9.1 million (previous year:
EUR 7.8 million); this was invested almost exclusively in the passenger vehicle market.
Miba Asia
At EUR 49.3 million, segment revenue for the first half of 2015–2016 was a notable 44.6 percent above the
prior-year comparative (EUR 34.1 million). This increase from the comparative prior-year quarter is attributable to
the initial consolidation of EBG Shenzhen Ltd. (EUR 4.2 million) and positive exchange rate effects (32.0
percentage points). Therefore, organic growth was only 16.7 percent.
> Half-Year 2015–2016 > Management Report
8
During the reporting period, Miba Asia invested a further EUR 4.1 million in capacity expansion (previous year:
EUR 5.7 million).
Miba Shared Services
The Miba Shared Services segment comprises all Miba Group companies which provide internal (management)
services to all or to a number of segments. These companies do not therefore generate any external revenue.
Capital expenditure in the Miba Shared Services segment amounted to EUR 1.0 million in the first half of
2015–2016 (previous year: EUR 0.3 million).
Significant risks and uncertainties
In the first half of the current fiscal year, there were no material changes in the risk categories listed in the
2014–2015 Annual Report. For further information, please refer to the risk report in the 2014–2015 Annual
Report.
Outlook
While the positive effects from the strong demand for automobiles and positive currency translation effects
prevailed in the first half of the year, the persistent downturn in the capital goods industry will lead to a further
slowdown in Miba’s growth in the second half of the year. Growth will primarily be sustained by the automotive
industry; Miba expects demand in most other sectors to stagnate.
Geopolitical uncertainties, the volatile situation in the financial markets and the current weakness of China make
accurate predictions about the Company’s medium-term performance difficult. Overall however, Miba is
expecting organic growth in the region of up to 5 percent for the full year and a slight improvement in earnings
quality year on year as a result of currency translation effects.
9
Miba shares
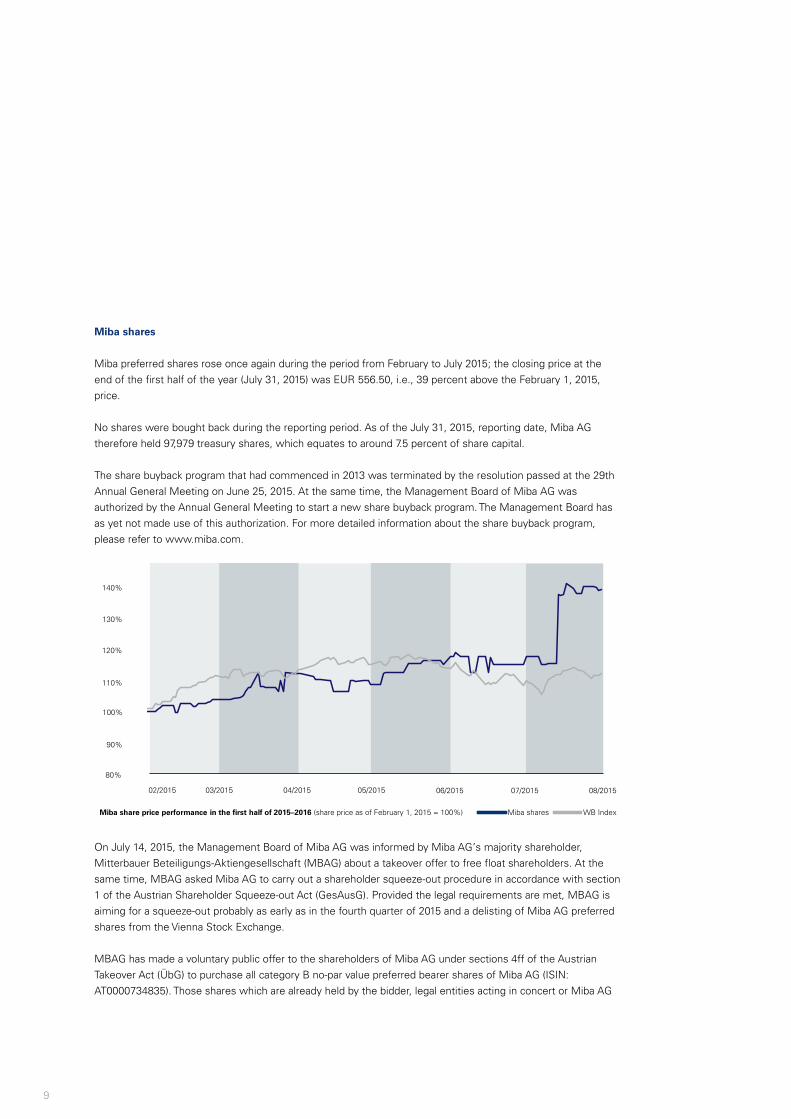
Miba preferred shares rose once again during the period from February to July 2015; the closing price at the
end of the first half of the year (July 31, 2015) was EUR 556.50, i.e., 39 percent above the February 1, 2015,
price.
No shares were bought back during the reporting period. As of the July 31, 2015, reporting date, Miba AG
therefore held 97,979 treasury shares, which equates to around 7.5 percent of share capital.
The share buyback program that had commenced in 2013 was terminated by the resolution passed at the 29th
Annual General Meeting on June 25, 2015. At the same time, the Management Board of Miba AG was
authorized by the Annual General Meeting to start a new share buyback program. The Management Board has
as yet not made use of this authorization. For more detailed information about the share buyback program,
please refer to www.miba.com.
On July 14, 2015, the Management Board of Miba AG was informed by Miba AG’s majority shareholder,
Mitterbauer Beteiligungs-Aktiengesellschaft (MBAG) about a takeover offer to free float shareholders. At the
same time, MBAG asked Miba AG to carry out a shareholder squeeze-out procedure in accordance with section
1 of the Austrian Shareholder Squeeze-out Act (GesAusG). Provided the legal requirements are met, MBAG is
aiming for a squeeze-out probably as early as in the fourth quarter of 2015 and a delisting of Miba AG preferred
shares from the Vienna Stock Exchange.
MBAG has made a voluntary public offer to the shareholders of Miba AG under sections 4ff of the Austrian
Takeover Act (ÜbG) to purchase all category B no-par value preferred bearer shares of Miba AG (ISIN:
AT0000734835). Those shares which are already held by the bidder, legal entities acting in concert or Miba AG
02/2015
130%
120%
110%
100%
90%
03/2015 04/2015 05/2015 06/2015 07/2015 08/2015
140%
80%
Miba shares WB IndexMiba share price performance in the first half of 2015–2016 (share price as of February 1, 2015 = 100%)
> Half-Year 2015–2016 > Consolidated interim financial statements
10
itself are excluded. The offer therefore relates to 121,233 category B preferred shares which equates to 9.33
percent of the total share capital of the target company. The offer price is EUR 550 per preferred share.
The offer was published on July 30, 2015. The offer period is three weeks and ends on August 20, 2015. MBAG
announced on August 21, 2015, that a total of 40,224 shares had been submitted for sale. The squeeze-out
threshold of 90 percent has therefore been exceeded; this extends the acceptance period by three months.
The Annual General Meeting which deals with the resolution on the shareholder squeeze-out is expected to
take place on or around October 12, 2015.
All detailed information, mailings and documentation in connection with the takeover offer can be downloaded
from the Miba AG website.
11
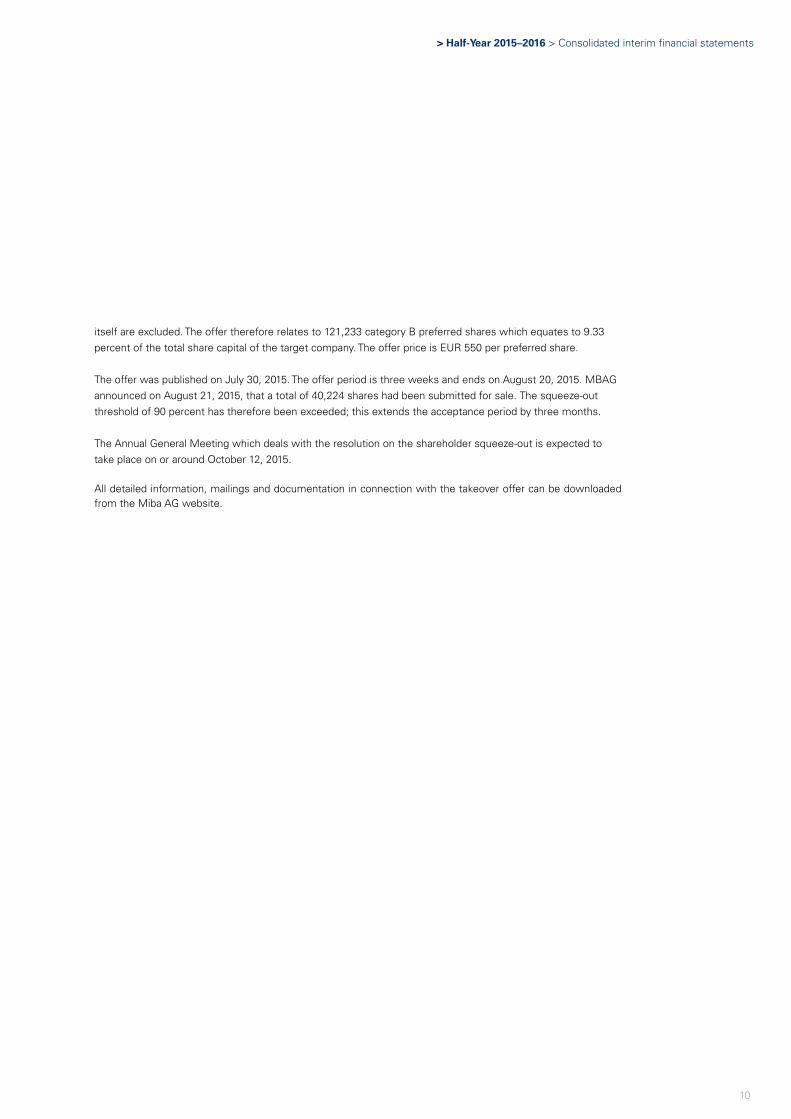
in TEUR 7/31/2015 1/31/2015
Assets
Non-current assets
Intangible assets 42,502 45,149
Property, plant and equipment 278,294 265,707
Investments in associates 0 3,155
Financial assets 42,969 37,110
Deferred tax assets 4,409 2,260
368,174 353,381
Current assets
Inventories 103,667 93,084
Trade receivables 107,202 97,107
Other assets 27,561 23,712
Current financial assets 32,058 36,451
Cash and cash equivalents 150,998 138,132
421,486 388,486
Total assets 789,660 741,867
Consolidated interim financial statements IFRS consolidated balance sheet
Rounding differences may arise due to the use of accounting software.
> Half-Year 2015–2016 > Consolidated interim financial statements
12
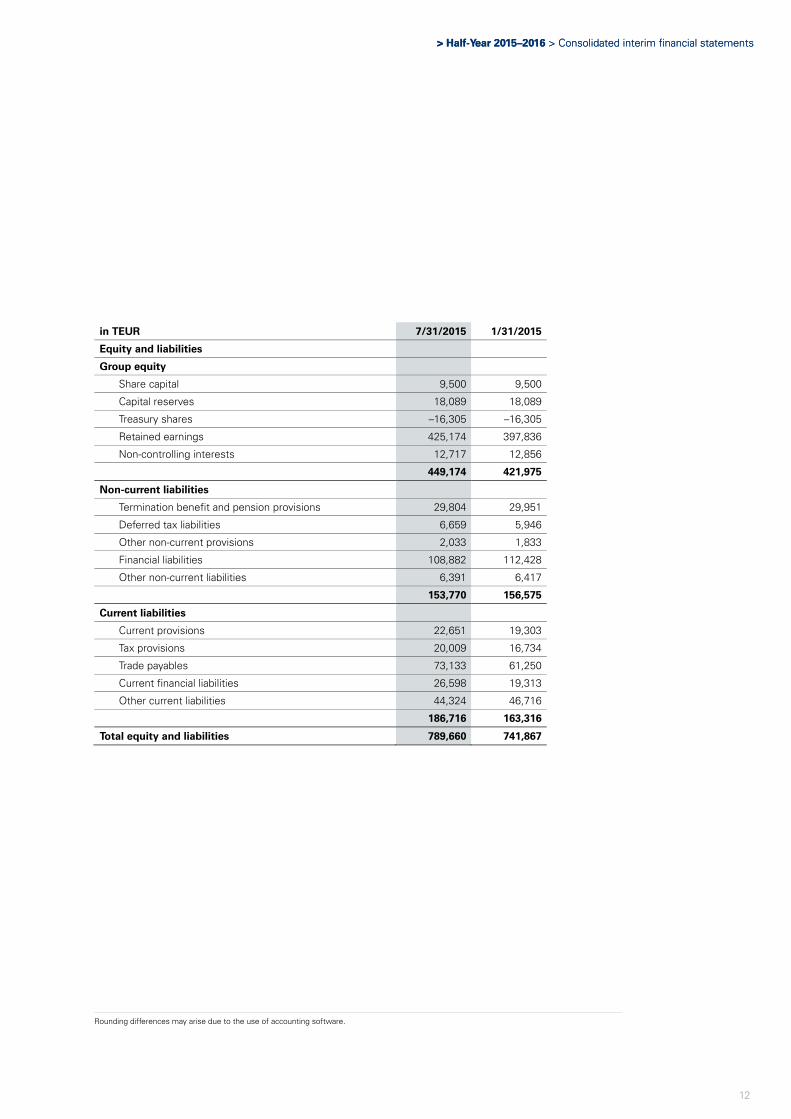
in TEUR 7/31/2015 1/31/2015
Equity and liabilities
Group equity
Share capital 9,500 9,500
Capital reserves 18,089 18,089
Treasury shares –16,305 –16,305
Retained earnings 425,174 397,836
Non-controlling interests 12,717 12,856
449,174 421,975
Non-current liabilities
Termination benefit and pension provisions 29,804 29,951
Deferred tax liabilities 6,659 5,946
Other non-current provisions 2,033 1,833
Financial liabilities 108,882 112,428
Other non-current liabilities 6,391 6,417
153,770 156,575
Current liabilities
Current provisions 22,651 19,303
Tax provisions 20,009 16,734
Trade payables 73,133 61,250
Current financial liabilities 26,598 19,313
Other current liabilities 44,324 46,716
186,716 163,316
Total equity and liabilities 789,660 741,867
Rounding differences may arise due to the use of accounting software.
> Half-Year 2015–2016 > Consolidated interim financial statements
13
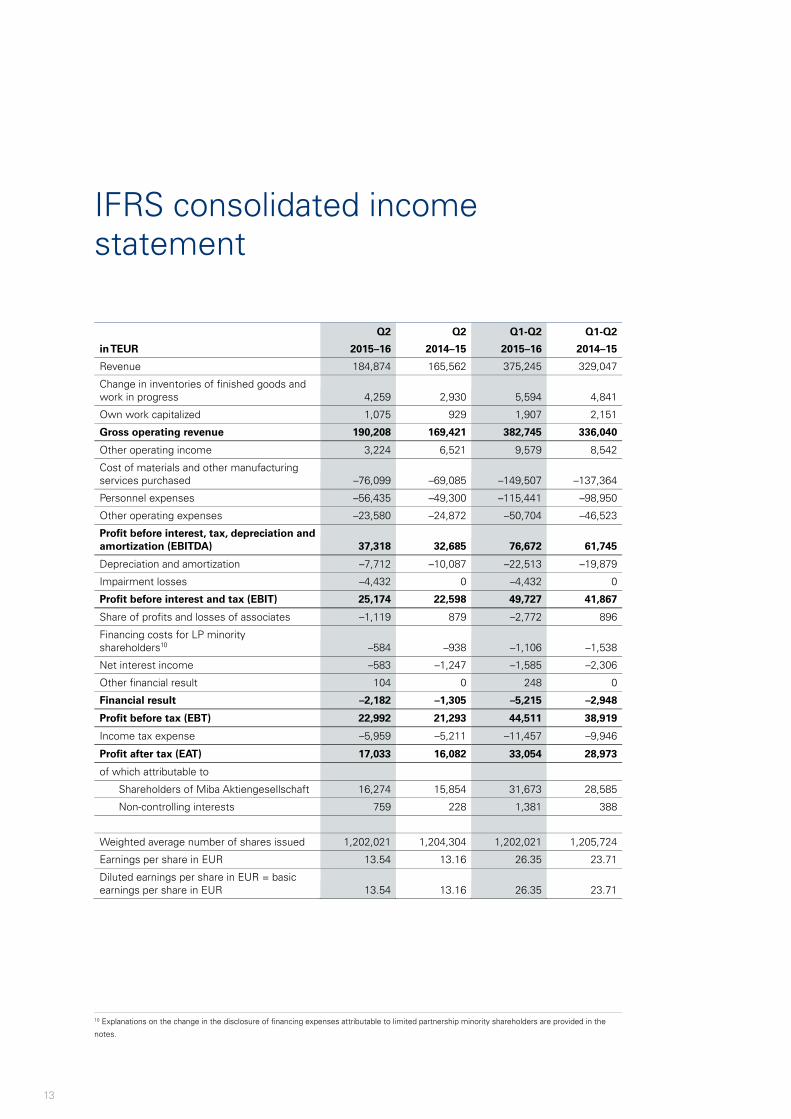
Q2 Q2 Q1-Q2 Q1-Q2
in TEUR 2015–16 2014–15 2015–16 2014–15
Revenue 184,874 165,562 375,245 329,047
Change in inventories of finished goods and work in progress 4,259 2,930 5,594 4,841
Own work capitalized 1,075 929 1,907 2,151
Gross operating revenue 190,208 169,421 382,745 336,040
Other operating income 3,224 6,521 9,579 8,542
Cost of materials and other manufacturing services purchased –76,099 –69,085 –149,507 –137,364
Personnel expenses –56,435 –49,300 –115,441 –98,950
Other operating expenses –23,580 –24,872 –50,704 –46,523
Profit before interest, tax, depreciation and amortization (EBITDA) 37,318 32,685 76,672 61,745
Depreciation and amortization –7,712 –10,087 –22,513 –19,879
Impairment losses –4,432 0 –4,432 0
Profit before interest and tax (EBIT) 25,174 22,598 49,727 41,867
Share of profits and losses of associates –1,119 879 –2,772 896
Financing costs for LP minority shareholders10 –584 –938 –1,106 –1,538
Net interest income –583 –1,247 –1,585 –2,306
Other financial result 104 0 248 0
Financial result –2,182 –1,305 –5,215 –2,948
Profit before tax (EBT) 22,992 21,293 44,511 38,919
Income tax expense –5,959 –5,211 –11,457 –9,946
Profit after tax (EAT) 17,033 16,082 33,054 28,973
of which attributable to
Shareholders of Miba Aktiengesellschaft 16,274 15,854 31,673 28,585
Non-controlling interests 759 228 1,381 388
Weighted average number of shares issued 1,202,021 1,204,304 1,202,021 1,205,724
Earnings per share in EUR 13.54 13.16 26.35 23.71
Diluted earnings per share in EUR = basic earnings per share in EUR 13.54 13.16 26.35 23.71
IFRS consolidated income statement
10 Explanations on the change in the disclosure of financing expenses attributable to limited partnership minority shareholders are provided in the
notes.
> Half-Year 2015–2016 > Consolidated interim financial statements
14
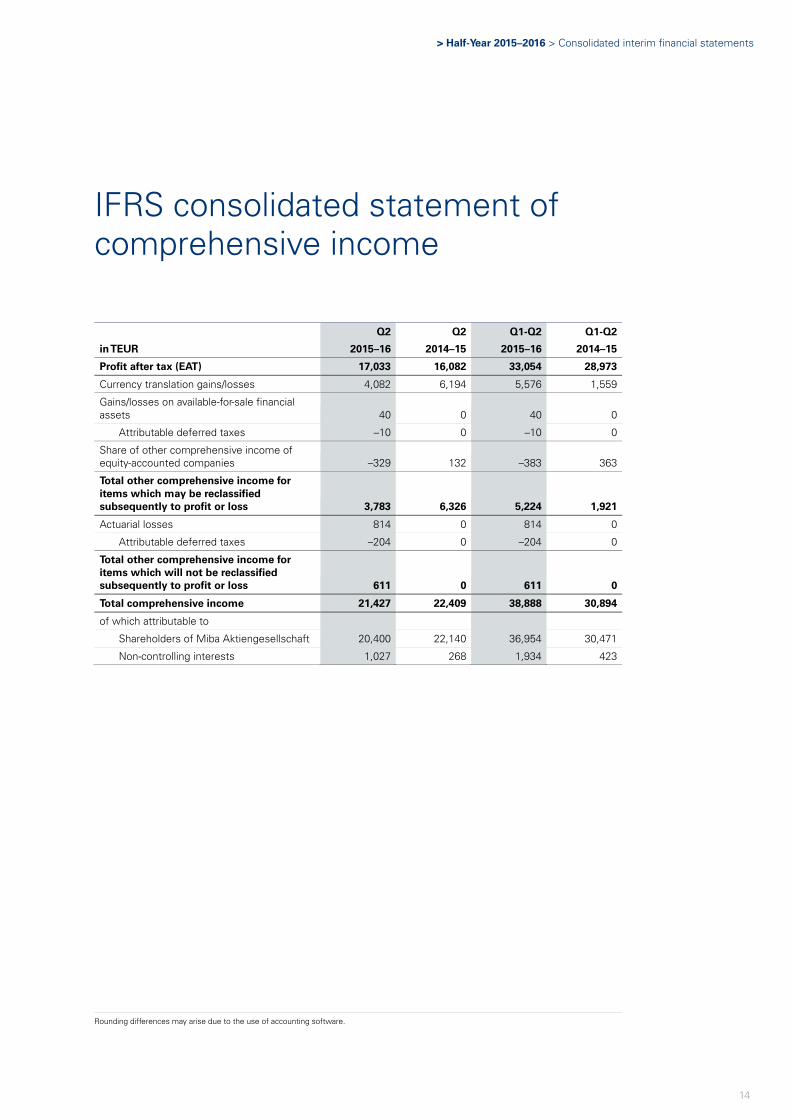
Q2 Q2 Q1-Q2 Q1-Q2
in TEUR 2015–16 2014–15 2015–16 2014–15
Profit after tax (EAT) 17,033 16,082 33,054 28,973
Currency translation gains/losses 4,082 6,194 5,576 1,559
Gains/losses on available-for-sale financial assets 40 0 40 0
Attributable deferred taxes –10 0 –10 0
Share of other comprehensive income of equity-accounted companies –329 132 –383 363
Total other comprehensive income for items which may be reclassified subsequently to profit or loss 3,783 6,326 5,224 1,921
Actuarial losses 814 0 814 0
Attributable deferred taxes –204 0 –204 0
Total other comprehensive income for items which will not be reclassified subsequently to profit or loss 611 0 611 0
Total comprehensive income 21,427 22,409 38,888 30,894
of which attributable to
Shareholders of Miba Aktiengesellschaft 20,400 22,140 36,954 30,471
Non-controlling interests 1,027 268 1,934 423
IFRS consolidated statement of comprehensive income
Rounding differences may arise due to the use of accounting software.
15
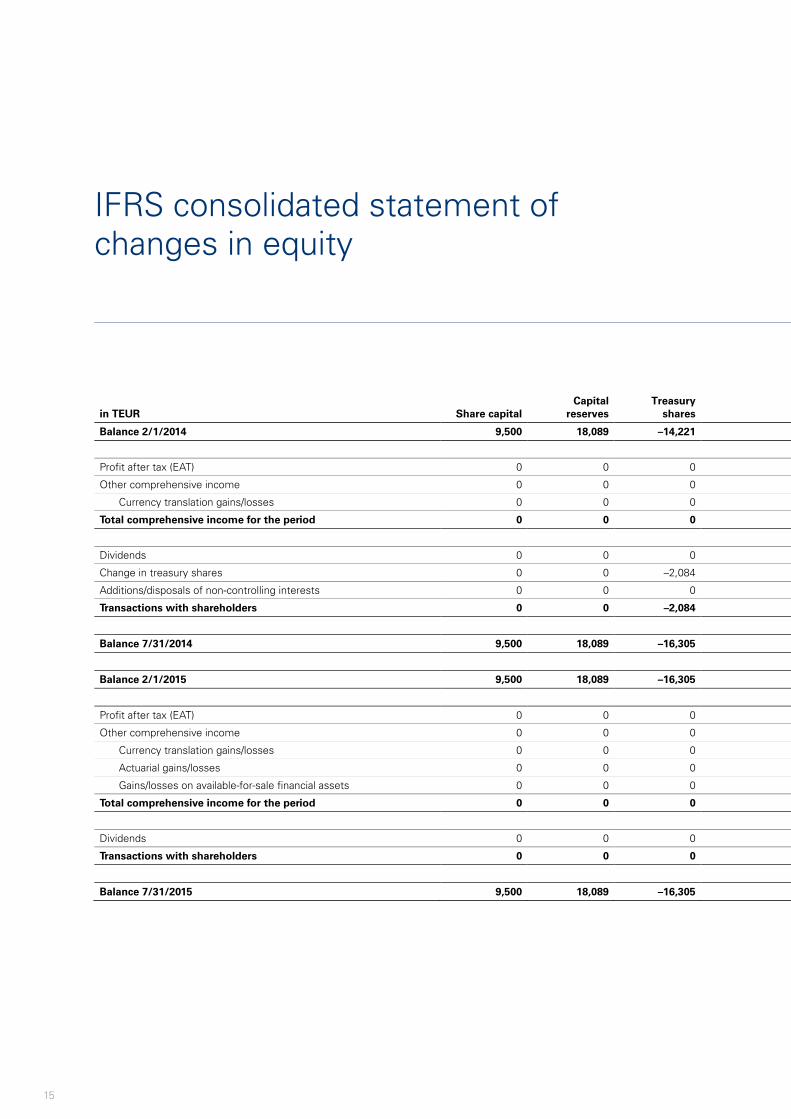
in TEUR Share capital Capital
reserves Treasury
shares
Balance 2/1/2014 9,500 18,089 –14,221
Profit after tax (EAT) 0 0 0
Other comprehensive income 0 0 0
Currency translation gains/losses 0 0 0
Total comprehensive income for the period 0 0 0
Dividends 0 0 0
Change in treasury shares 0 0 –2,084
Additions/disposals of non-controlling interests 0 0 0
Transactions with shareholders 0 0 –2,084
Balance 7/31/2014 9,500 18,089 –16,305
Balance 2/1/2015 9,500 18,089 –16,305
Profit after tax (EAT) 0 0 0
Other comprehensive income 0 0 0
Currency translation gains/losses 0 0 0
Actuarial gains/losses 0 0 0
Gains/losses on available-for-sale financial assets 0 0 0
Total comprehensive income for the period 0 0 0
Dividends 0 0 0
Transactions with shareholders 0 0 0
Balance 7/31/2015 9,500 18,089 –16,305
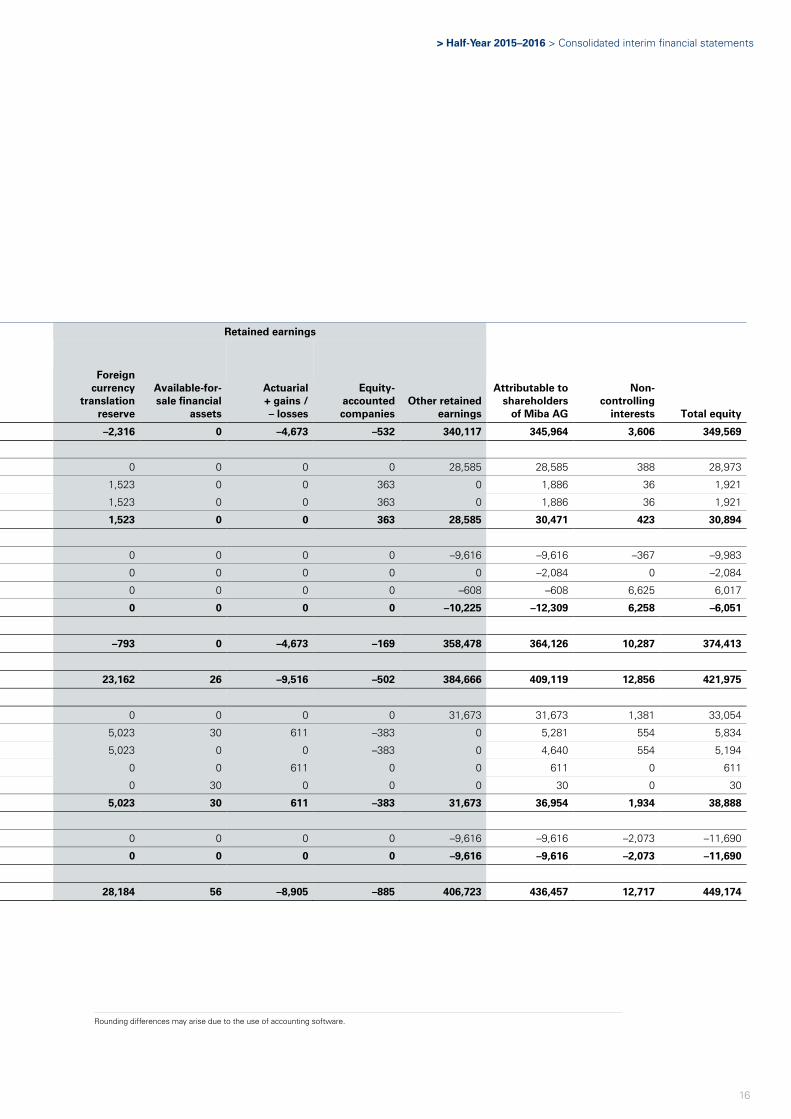
IFRS consolidated statement of changes in equity
> Half-Year 2015–2016 > Consolidated interim financial statements
16
Retained earnings
Foreign currency
translation reserve
Available-for-sale financial
assets
Actuarial + gains / – losses
Equity-accounted companies
Other retained earnings
Attributable to shareholders
of Miba AG
Non-controlling
interests Total equity
–2,316 0 –4,673 –532 340,117 345,964 3,606 349,569
0 0 0 0 28,585 28,585 388 28,973
1,523 0 0 363 0 1,886 36 1,921
1,523 0 0 363 0 1,886 36 1,921
1,523 0 0 363 28,585 30,471 423 30,894
0 0 0 0 –9,616 –9,616 –367 –9,983
0 0 0 0 0 –2,084 0 –2,084
0 0 0 0 –608 –608 6,625 6,017
0 0 0 0 –10,225 –12,309 6,258 –6,051
–793 0 –4,673 –169 358,478 364,126 10,287 374,413
23,162 26 –9,516 –502 384,666 409,119 12,856 421,975
0 0 0 0 31,673 31,673 1,381 33,054
5,023 30 611 –383 0 5,281 554 5,834
5,023 0 0 –383 0 4,640 554 5,194
0 0 611 0 0 611 0 611
0 30 0 0 0 30 0 30
5,023 30 611 –383 31,673 36,954 1,934 38,888
0 0 0 0 –9,616 –9,616 –2,073 –11,690
0 0 0 0 –9,616 –9,616 –2,073 –11,690
28,184 56 –8,905 –885 406,723 436,457 12,717 449,174
Rounding differences may arise due to the use of accounting software.
17
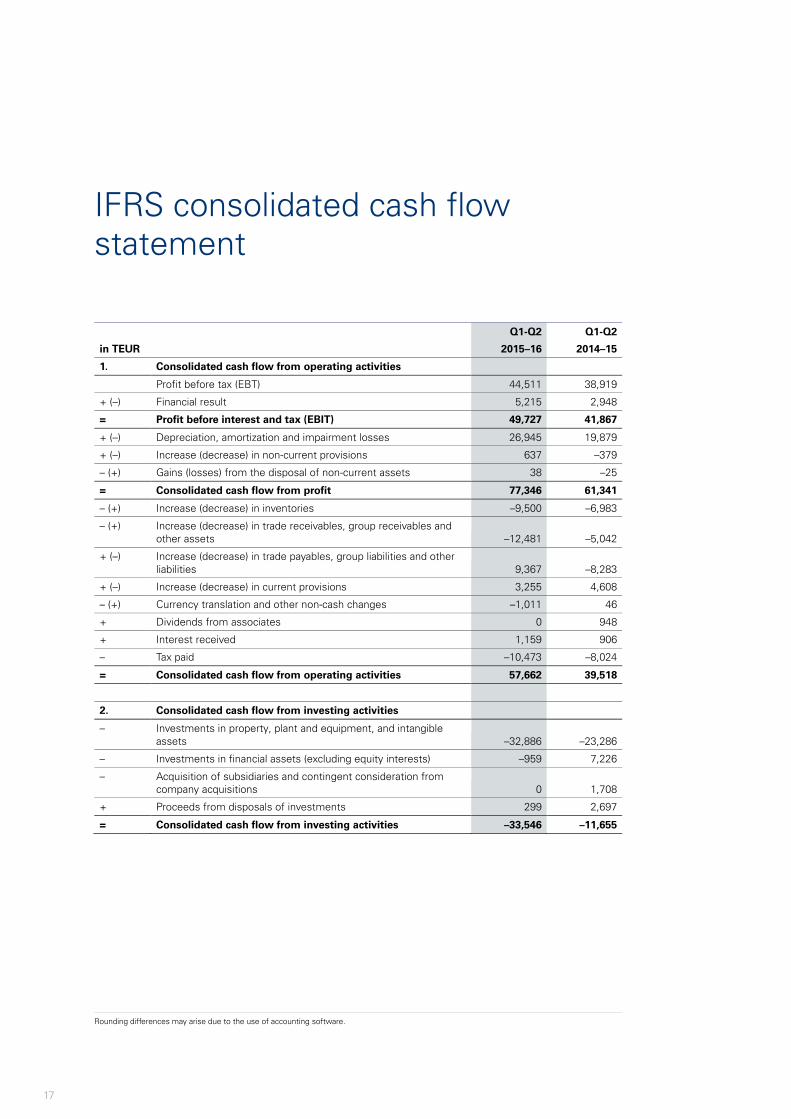
Q1-Q2 Q1-Q2
in TEUR 2015–16 2014–15
1. Consolidated cash flow from operating activities
Profit before tax (EBT) 44,511 38,919
+ (–) Financial result 5,215 2,948
= Profit before interest and tax (EBIT) 49,727 41,867
+ (–) Depreciation, amortization and impairment losses 26,945 19,879
+ (–) Increase (decrease) in non-current provisions 637 –379
– (+) Gains (losses) from the disposal of non-current assets 38 –25
= Consolidated cash flow from profit 77,346 61,341
– (+) Increase (decrease) in inventories –9,500 –6,983
– (+) Increase (decrease) in trade receivables, group receivables and other assets –12,481 –5,042
+ (–) Increase (decrease) in trade payables, group liabilities and other liabilities 9,367 –8,283
+ (–) Increase (decrease) in current provisions 3,255 4,608
– (+) Currency translation and other non-cash changes –1,011 46
+ Dividends from associates 0 948
+ Interest received 1,159 906
– Tax paid –10,473 –8,024
= Consolidated cash flow from operating activities 57,662 39,518
2. Consolidated cash flow from investing activities
– Investments in property, plant and equipment, and intangible assets –32,886 –23,286
– Investments in financial assets (excluding equity interests) –959 7,226
– Acquisition of subsidiaries and contingent consideration from company acquisitions 0 1,708
+ Proceeds from disposals of investments 299 2,697
= Consolidated cash flow from investing activities –33,546 –11,655
IFRS consolidated cash flow statement
Rounding differences may arise due to the use of accounting software.
> Half-Year 2015–2016 > Consolidated interim financial statements
18
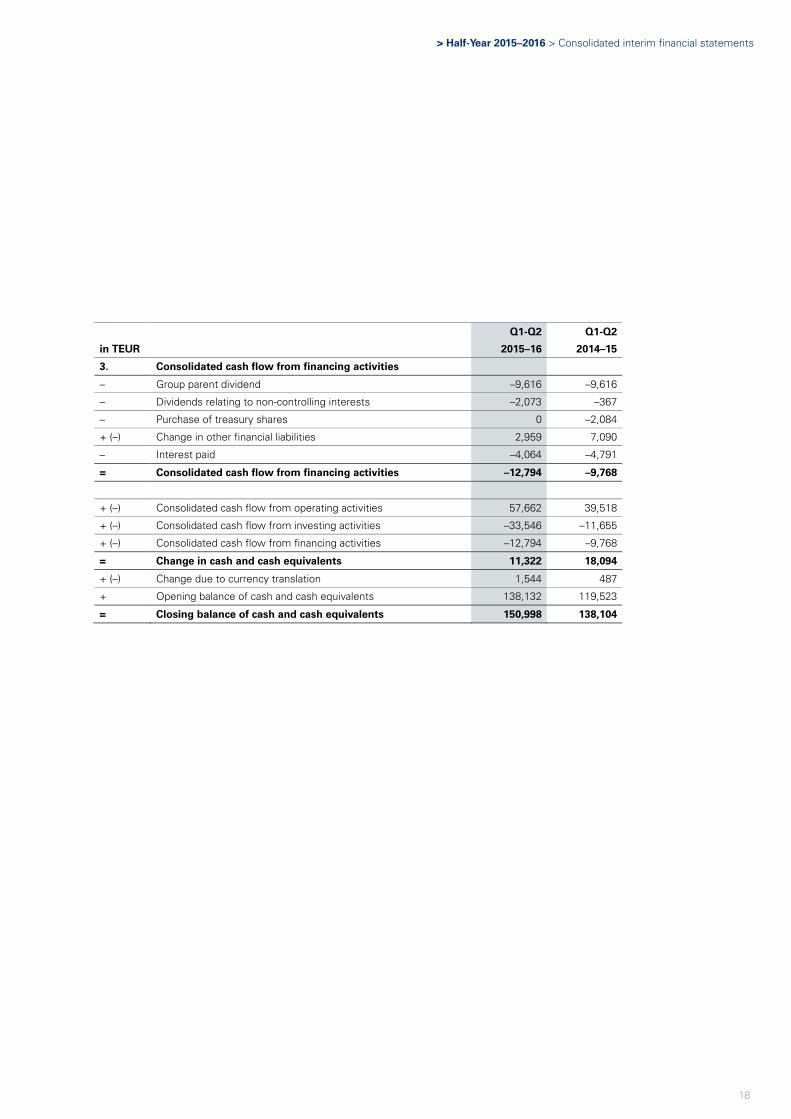
Q1-Q2 Q1-Q2
in TEUR 2015–16 2014–15
3. Consolidated cash flow from financing activities
– Group parent dividend –9,616 –9,616
– Dividends relating to non-controlling interests –2,073 –367
– Purchase of treasury shares 0 –2,084
+ (–) Change in other financial liabilities 2,959 7,090
– Interest paid –4,064 –4,791
= Consolidated cash flow from financing activities –12,794 –9,768
+ (–) Consolidated cash flow from operating activities 57,662 39,518
+ (–) Consolidated cash flow from investing activities –33,546 –11,655
+ (–) Consolidated cash flow from financing activities –12,794 –9,768
= Change in cash and cash equivalents 11,322 18,094
+ (–) Change due to currency translation 1,544 487
+ Opening balance of cash and cash equivalents 138,132 119,523
= Closing balance of cash and cash equivalents 150,998 138,104
19
Information on the Company
Miba Aktiengesellschaft is an international group domiciled in Austria. The Group’s business activities focus on
the following products:
Sintered components (Sinter)
Engine bearings (Bearing)
Friction materials (Friction)
Passive electronic components (New Technologies)
Coatings (Coating) and
Special machinery (Equipment Manufacturing)
The Group’s head office is located at Dr.-Mitterbauer-Strasse 3, 4663 Laakirchen, Austria. The Company is
registered at the Wels regional and commercial court (Landes- als Handelsgericht Wels) under number
FN 107386 x.
Basis of preparation of the financial statements
The accompanying consolidated interim financial statements for the period ended July 31, 2015, (February 1,
2015, to July 31, 2015) have been prepared in accordance with the International Financial Reporting Standards
(IFRSs), as adopted by the European Union and applicable at the reporting date, under the responsibility of the
Management Board. IAS 34 Interim Financial Reporting and its simplified procedures to condense the
consolidated interim financial statements were applied. The accompanying consolidated interim financial
statements for the period ended July 31, 2015, have been prepared based on Miba AG’s consolidated financial
statements for the year ended January 31, 2015, and should therefore always be read in conjunction with these.
Audit and review of financial statements
The accompanying condensed consolidated interim financial statements of the Miba Group have neither been
audited nor reviewed by an auditor.
Accounting policies
The accounting pronouncements whose application is mandatory from fiscal year 2015–2016 onwards do not
have a material effect on the presentation of the assets, liabilities, financial position, and profit or loss of the
consolidated interim financial statements.
Apart from the circumstances presented below concerning the changes in the disclosure of the financing
expenses attributable to limited partnership minority shareholders, the accounting policies from the year ended
Selected notes to the consolidated interim financial statements for the period ended July 31, 2015
> Half-Year 2015–2016 > Consolidated interim financial statements
20
January 31, 2015, have been applied unchanged when preparing the consolidated interim financial statements.
For further information on accounting policies please therefore refer to the consolidated financial statements for
the year ended January 31, 2015.
The income tax expense for the consolidated interim financial statements has been calculated in accordance
with IAS 34 as an estimate based on the average annual tax rate expected for the entire fiscal year.
The consolidated interim financial statements have been prepared in euros (EUR). Unless stated otherwise,
amounts are presented in euro thousands (TEUR) for clarity.
Change in the disclosure of financing expenses attributable to limited partnership minority shareholders
Non-controlling interests in Austrian limited partnerships do not meet the IAS 32 conditions for being reported
in equity since limited partners have a statutory right to offer their shares to the general partner. Interests in
Miba Energy Holding GmbH & Co KG and its subsidiaries are therefore recognized in other liabilities as
“liabilities to affiliated companies” as these interests are held by higher-tier Group companies.
The “financing expense” arising from the appropriation of profit to these limited partnership minority
shareholders was until the first quarter of 2015–2016 reported separately after profit after tax (EAT) as
“financing costs for limited partnership minority shareholders”. To improve clarity of presentation, this share of
profits or losses is being reported separately in financial result as “financing costs for limited partnership
minority shareholders” from the first half of 2015–2016 onwards. Prior-year disclosures have been adjusted
correspondingly in accordance with IAS 1.41. This has resulted in the following adjustments:
21
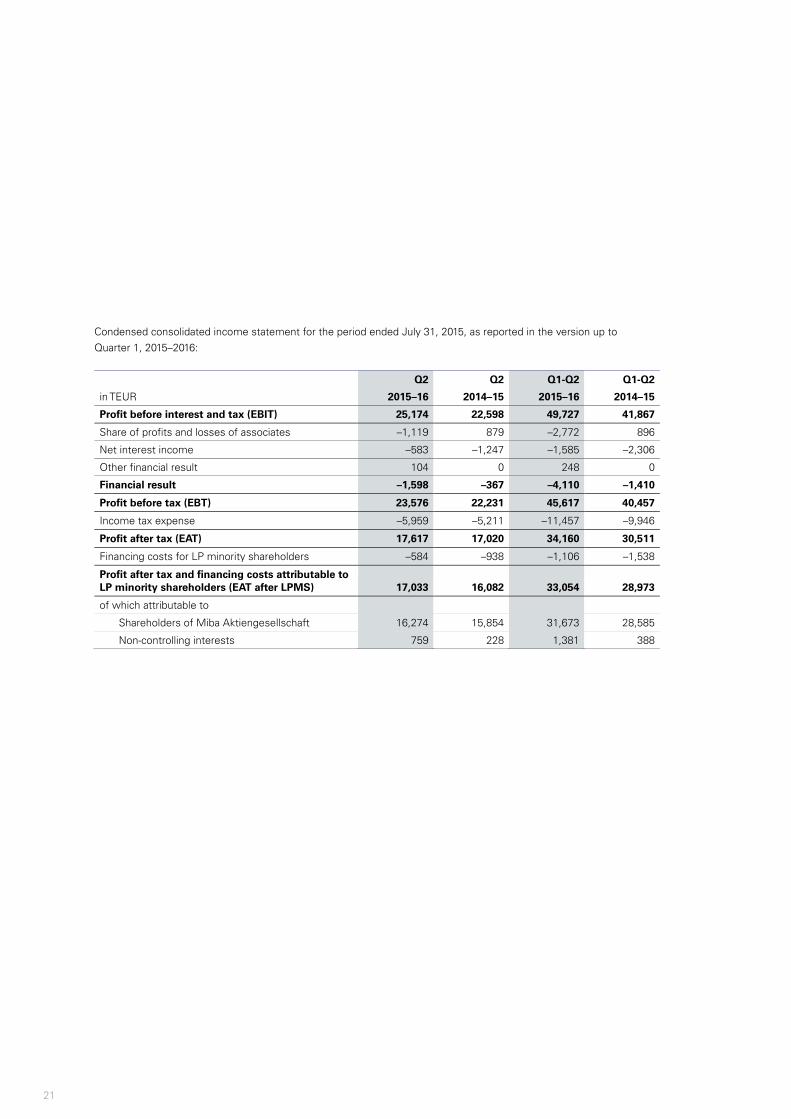
Condensed consolidated income statement for the period ended July 31, 2015, as reported in the version up to
Quarter 1, 2015–2016:
Q2 Q2 Q1-Q2 Q1-Q2
in TEUR 2015–16 2014–15 2015–16 2014–15
Profit before interest and tax (EBIT) 25,174 22,598 49,727 41,867
Share of profits and losses of associates –1,119 879 –2,772 896
Net interest income –583 –1,247 –1,585 –2,306
Other financial result 104 0 248 0
Financial result –1,598 –367 –4,110 –1,410
Profit before tax (EBT) 23,576 22,231 45,617 40,457
Income tax expense –5,959 –5,211 –11,457 –9,946
Profit after tax (EAT) 17,617 17,020 34,160 30,511
Financing costs for LP minority shareholders –584 –938 –1,106 –1,538
Profit after tax and financing costs attributable to LP minority shareholders (EAT after LPMS) 17,033 16,082 33,054 28,973
of which attributable to
Shareholders of Miba Aktiengesellschaft 16,274 15,854 31,673 28,585
Non-controlling interests 759 228 1,381 388
> Half-Year 2015–2016 > Consolidated interim financial statements
22
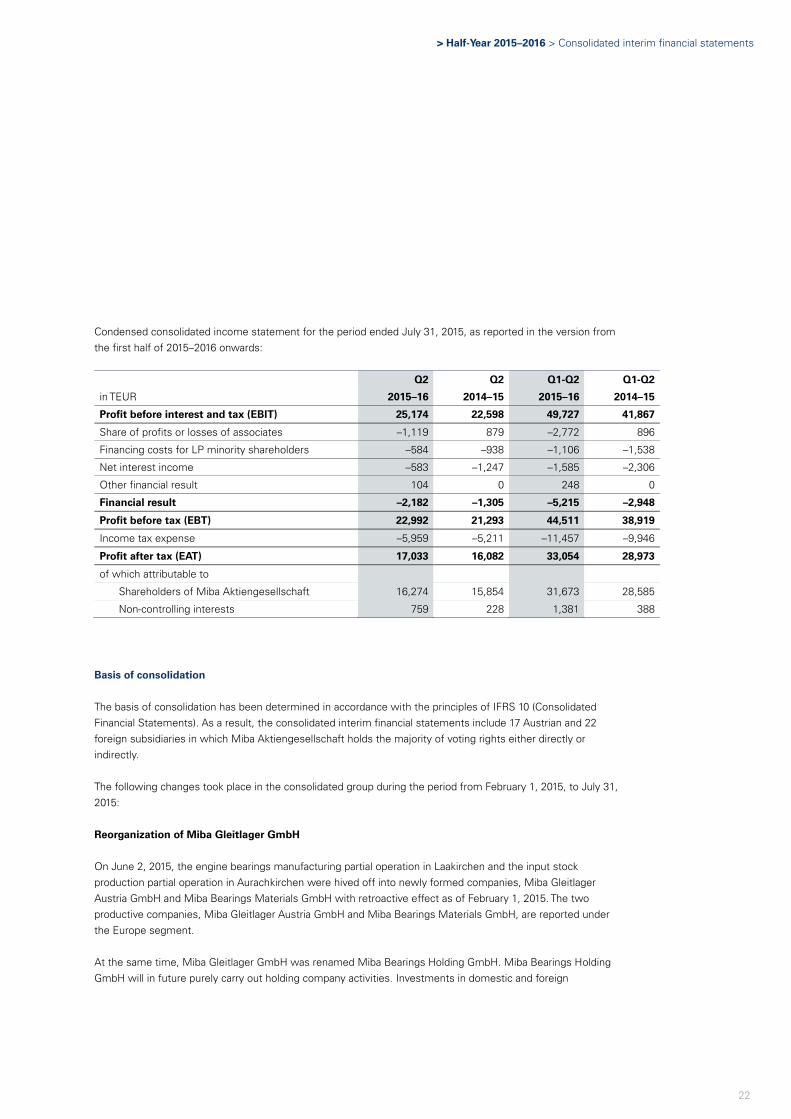
Condensed consolidated income statement for the period ended July 31, 2015, as reported in the version from
the first half of 2015–2016 onwards:
Q2 Q2 Q1-Q2 Q1-Q2
in TEUR 2015–16 2014–15 2015–16 2014–15
Profit before interest and tax (EBIT) 25,174 22,598 49,727 41,867
Share of profits or losses of associates –1,119 879 –2,772 896
Financing costs for LP minority shareholders –584 –938 –1,106 –1,538
Net interest income –583 –1,247 –1,585 –2,306
Other financial result 104 0 248 0
Financial result –2,182 –1,305 –5,215 –2,948
Profit before tax (EBT) 22,992 21,293 44,511 38,919
Income tax expense –5,959 –5,211 –11,457 –9,946
Profit after tax (EAT) 17,033 16,082 33,054 28,973
of which attributable to
Shareholders of Miba Aktiengesellschaft 16,274 15,854 31,673 28,585
Non-controlling interests 759 228 1,381 388
Basis of consolidation
The basis of consolidation has been determined in accordance with the principles of IFRS 10 (Consolidated
Financial Statements). As a result, the consolidated interim financial statements include 17 Austrian and 22
foreign subsidiaries in which Miba Aktiengesellschaft holds the majority of voting rights either directly or
indirectly.
The following changes took place in the consolidated group during the period from February 1, 2015, to July 31,
2015:
Reorganization of Miba Gleitlager GmbH
On June 2, 2015, the engine bearings manufacturing partial operation in Laakirchen and the input stock
production partial operation in Aurachkirchen were hived off into newly formed companies, Miba Gleitlager
Austria GmbH and Miba Bearings Materials GmbH with retroactive effect as of February 1, 2015. The two
productive companies, Miba Gleitlager Austria GmbH and Miba Bearings Materials GmbH, are reported under
the Europe segment.
At the same time, Miba Gleitlager GmbH was renamed Miba Bearings Holding GmbH. Miba Bearings Holding
GmbH will in future purely carry out holding company activities. Investments in domestic and foreign
23
subsidiaries as well as the Laakirchen properties remain as assets in Miba Bearings Holding GmbH. Miba
Bearings Holding GmbH is reported under the Miba Shared Services segment.
Estimates and uncertainties
For management judgments and uncertainties arising from estimates, please refer to the Miba Group’s
consolidated financial statements for the year ended January 31, 2015. There were no changes in this respect in
the first half of 2015–2016 other than those described as part of impairment testing.
Selected consolidated income statement disclosures
Depreciation, amortization and impairment losses
Significant negative deviations from budget in the period from February to July 2015 led to indications of an
impairment loss under IAS 36.8 for the property, plant and equipment of Miba HydraMechanica Corp., USA. At
DAU Thermal Solutions North America Inc., USA, changes in the order situation led to indications of an
impairment loss for property, plant and equipment.
On the one hand, value in use was determined for both companies using a discounted cash flow (DCF)
calculation. Details on the DCF calculation are provided in note C.1. of Miba AG’s consolidated financial
statements for the year ended January 31, 2015.
On the other hand, fair value less costs to sell was established using external opinions and observable market
prices. These amounts must be allocated to level 2 in the IFRS 13 fair value hierarchy.
For Miba HydraMechanica Corp. as well as for DAU Thermal Solutions North America Inc., fair value less costs
to sell is the higher of these amounts which is being used as a basis for determining impairments. For Miba
HydraMechanica Corp., this resulted in an impairment loss of TEUR 3,984 and for DAU Thermal Solutions North
America Inc., in an impairment loss of TEUR 448. The impairment losses should be allocated to the Americas
segment.
Share of profits and losses of associates
The market environment in Brazil and Latin America, in which the associate, Mahle Metal Leve Miba
Sinterizados Ltda., Brazil, operates, was characterized by further marked decreases in 2015 after a very difficult
2014. A quick recovery in the market is not to be expected. The budget prepared for Mahle Metal Leve Miba
Sinterizados Ltda. in this environment showed markedly negative deviations from the previous budgeted
amounts and led to a reduction in the cash generating unit’s value in use and to an impairment loss for the
equity-accounted investment in the amount of TEUR 1,423.
> Half-Year 2015–2016 > Consolidated interim financial statements
24
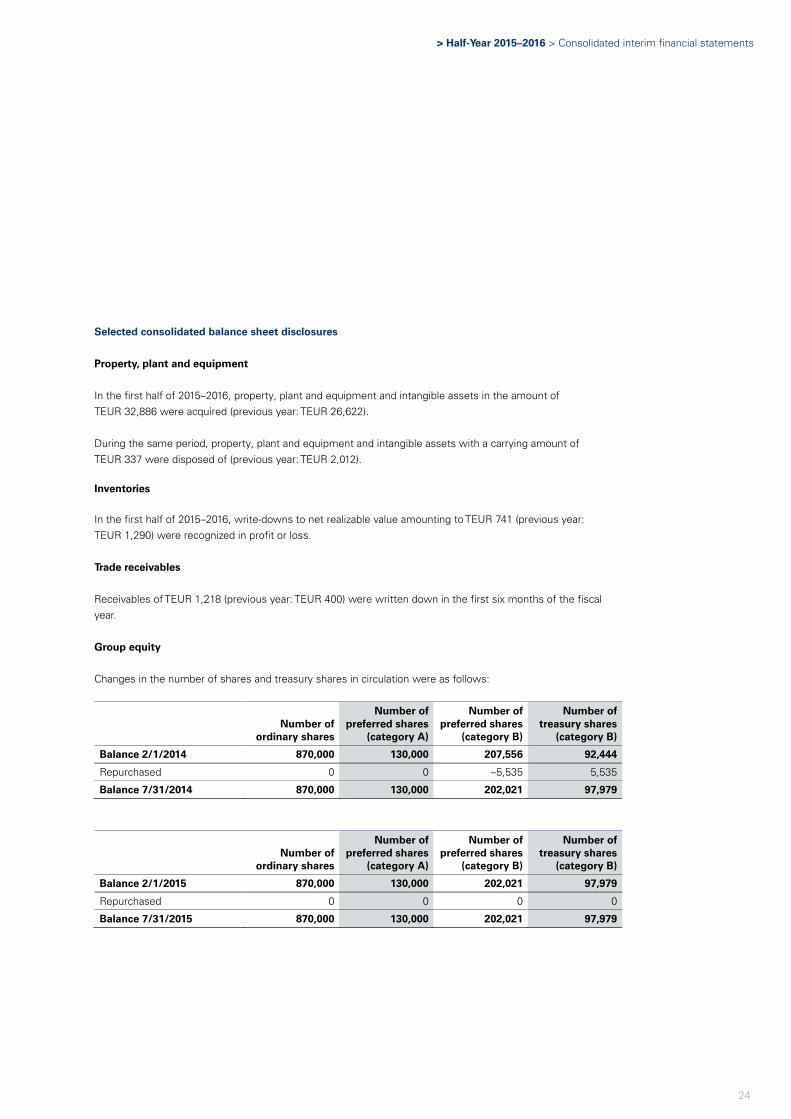
Selected consolidated balance sheet disclosures
Property, plant and equipment
In the first half of 2015–2016, property, plant and equipment and intangible assets in the amount of
TEUR 32,886 were acquired (previous year: TEUR 26,622).
During the same period, property, plant and equipment and intangible assets with a carrying amount of
TEUR 337 were disposed of (previous year: TEUR 2,012).
Inventories
In the first half of 2015–2016, write-downs to net realizable value amounting to TEUR 741 (previous year:
TEUR 1,290) were recognized in profit or loss.
Trade receivables
Receivables of TEUR 1,218 (previous year: TEUR 400) were written down in the first six months of the fiscal
year.
Group equity
Changes in the number of shares and treasury shares in circulation were as follows:
Number of
ordinary shares
Number of preferred shares
(category A)
Number of preferred shares
(category B)
Number of treasury shares
(category B)
Balance 2/1/2014 870,000 130,000 207,556 92,444
Repurchased 0 0 –5,535 5,535
Balance 7/31/2014 870,000 130,000 202,021 97,979
Number of
ordinary shares
Number of preferred shares
(category A)
Number of preferred shares
(category B)
Number of treasury shares
(category B)
Balance 2/1/2015 870,000 130,000 202,021 97,979
Repurchased 0 0 0 0
Balance 7/31/2015 870,000 130,000 202,021 97,979
25
Treasury shares – June 25, 2015, share buyback program
Miba AG’s 29th Annual General Meeting on June 25, 2015, authorized Miba AG’s Management Board – by
revoking the authorization granted at the 27th Annual General Meeting on June 28, 2013 – to buy back own
shares (category B preferred shares) to the maximum extent permitted in law of 10 percent of the share capital
including shares already acquired, for a period of 30 months from June 25, 2015, as a general acquisition
pursuant to section 65(1) number 8 of the Austrian Stock Corporation Act (AktG), and to set the terms of the
buy-back, whereby the buy-back amount to be paid per share may not be less than EUR 100.00 and not more
than a maximum of 10 percent above the average non-weighted closing price of the ten trading days prior to the
buy-back and the acquisition may take place in any manner permissible in law, in particular including over the
counter and from individual shareholders who are willing to sell (negotiated purchase). Trading in own shares is
precluded from being a purpose of the acquisition.
Miba AG’s Management Board has not yet used the Annual General Meeting’s authorization to buy back own
shares.
In the first six months of fiscal year 2015–2016, no own shares were bought back under the share buyback
program.
Furthermore, the Management Board is also authorized for the duration of five years from the date of the
adoption of the resolution to resolve, with the agreement of the Supervisory Board, a different legally
permissible type of sale than via the stock exchange or public offer for the sale of own shares and any
applicable disapplication of shareholder repurchase rights (preemptive rights) in accordance with section 65(1b)
in conjunction with sections 169 to 171 of the Austrian Stock Corporation Act (AktG) – especially as
consideration for the acquisition of companies, (partial) operations, other assets or shares in one or more
companies in Austria or abroad.
As of the reporting date, none of the treasury shares had been used as authorized by the Annual General
Meeting.
Termination benefit and pension provisions
Provisions for termination benefits and pensions are measured based on actuarial assumptions in accordance
with the projected unit credit method. The provisions are determined at the respective annual financial
statement reporting date using an actuarial report. After checking the changes in the underlying actuarial
assumptions, these amounts were included by taking an interest rate of 2.0 percent (January 31, 2015: 1.7
percent) into account for the consolidated interim financial statements.
Contingent liabilities
There were no material changes in contingent liabilities from January 31, 2015.
> Half-Year 2015–2016 > Consolidated interim financial statements
26
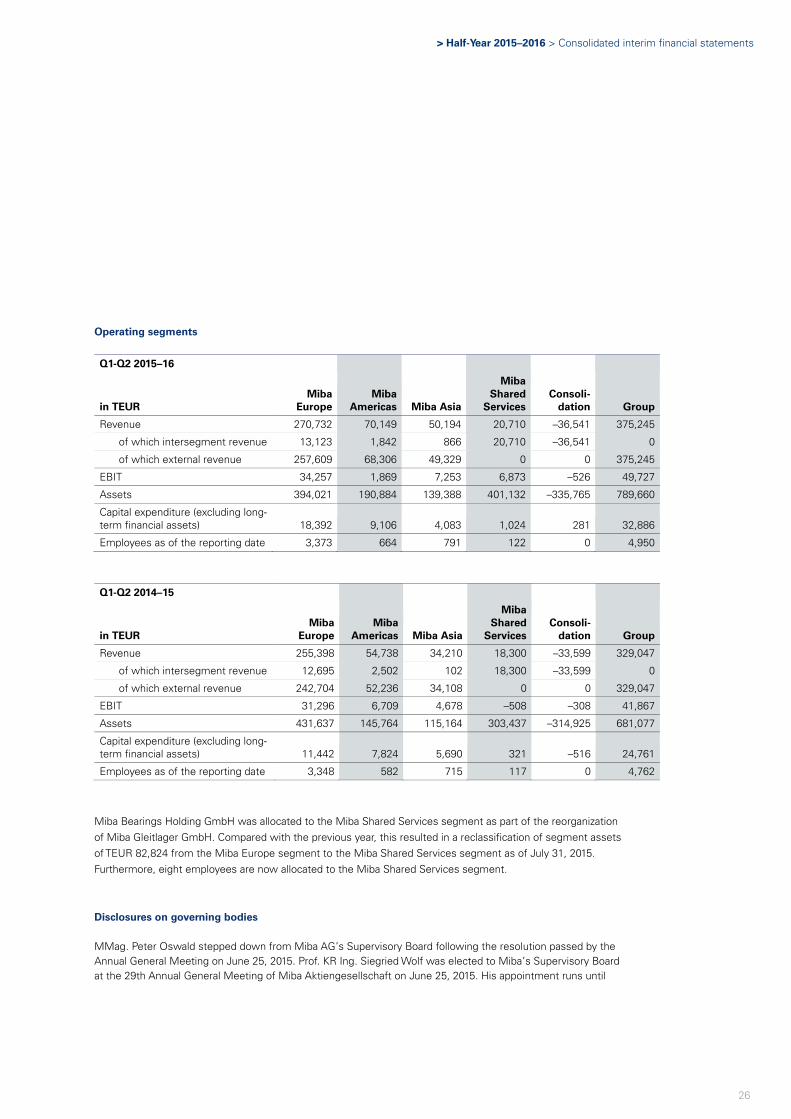
Operating segments
Q1-Q2 2015–16
in TEUR Miba
Europe Miba
Americas Miba Asia
Miba Shared
Services Consoli-
dation Group
Revenue 270,732 70,149 50,194 20,710 –36,541 375,245
of which intersegment revenue 13,123 1,842 866 20,710 –36,541 0
of which external revenue 257,609 68,306 49,329 0 0 375,245
EBIT 34,257 1,869 7,253 6,873 –526 49,727
Assets 394,021 190,884 139,388 401,132 –335,765 789,660
Capital expenditure (excluding long-term financial assets) 18,392 9,106 4,083 1,024 281 32,886
Employees as of the reporting date 3,373 664 791 122 0 4,950
Q1-Q2 2014–15
in TEUR Miba
Europe Miba
Americas Miba Asia
Miba Shared
Services Consoli-
dation Group
Revenue 255,398 54,738 34,210 18,300 –33,599 329,047
of which intersegment revenue 12,695 2,502 102 18,300 –33,599 0
of which external revenue 242,704 52,236 34,108 0 0 329,047
EBIT 31,296 6,709 4,678 –508 –308 41,867
Assets 431,637 145,764 115,164 303,437 –314,925 681,077
Capital expenditure (excluding long-term financial assets) 11,442 7,824 5,690 321 –516 24,761
Employees as of the reporting date 3,348 582 715 117 0 4,762
Miba Bearings Holding GmbH was allocated to the Miba Shared Services segment as part of the reorganization
of Miba Gleitlager GmbH. Compared with the previous year, this resulted in a reclassification of segment assets
of TEUR 82,824 from the Miba Europe segment to the Miba Shared Services segment as of July 31, 2015.
Furthermore, eight employees are now allocated to the Miba Shared Services segment.
Disclosures on governing bodies
MMag. Peter Oswald stepped down from Miba AG’s Supervisory Board following the resolution passed by the
Annual General Meeting on June 25, 2015. Prof. KR Ing. Siegried Wolf was elected to Miba’s Supervisory Board
at the 29th Annual General Meeting of Miba Aktiengesellschaft on June 25, 2015. His appointment runs until
27
the conclusion of the Annual General Meeting which has to deal with the resolution to grant discharge for fiscal
year 2018–2019.
Appropriation of net profit
At the 29th Annual General Meeting of Miba Aktiengesellschaft on June 25, 2015, a resolution on the use of
net retained profit for fiscal year 2014–2015 was adopted. A dividend of EUR 8.00 per share was paid out to the
preferred and ordinary shareholders from net retained profit of EUR 85,193,166.97. The remainder was carried
forward to new account.
The dividend payment was split as follows:
in TEUR
Category A preferred shareholders 1,040
Category B preferred shareholders 1,616
Ordinary shareholders 6,960
Carry forward to new account 11,283
Total 20,899
The dividend payment to category B preferred shareholders was calculated by deducting treasury shares which
have no dividend entitlement amounting to 97,979 shares. The dividend was paid on July 3, 2015.
Business relationships with related parties
Material business relationships in the first half of 2015–2016 related to joint ventures with material costs of
TEUR 7,221 (previous year: TEUR 4,953), loans of TEUR 3,280 (previous year: TEUR 1,756) and trade payables of
TEUR 1,596 (previous year: TEUR 930), as well as unconsolidated affiliated companies with other expenses of
TEUR 1,002 (previous year: TEUR 1,253). The business relationship with Mitterbauer Beteiligungs-AG resulted
in other expenses of TEUR 378 (previous year: TEUR 379), tax allocations of TEUR 345 (previous year: TEUR
466), trade payables of TEUR 207 (previous year: TEUR 215) and tax allocation liabilities of TEUR 345 (previous
year: TEUR 466). For further business relationships with related parties, please refer to the disclosures in note
35 of Miba AG’s consolidated financial statements for the year ended January 31, 2015.
For repeated clarification, the explanations about the takeover offer to non-controlling interests in relation to
business relationships and the identity of governing bodies between Miba AG and Mitterbauer Beteiligungs-
Aktiengesellschaft (MBAG) are cited here again.
In terms of the takeover offer to Miba AG’s non-controlling interests, MBAG is the acquirer and Miba AG the
target company. MBAG is the majority shareholder of Miba AG. The target company and the acquirer maintain
business relationships; these are limited to the recharge of services rendered, particularly consulting projects.
> Half-Year 2015–2016 > Consolidated interim financial statements
28
The following members of the acquirer’s governing bodies are members of Miba AG’s Supervisory Board or
Management Board:
DI F. Peter Mitterbauer, MBA, is Chairman of the Management Board of Miba AG and has an interest
in the share capital of the acquirer.
DI DDr. h.c. Peter Mitterbauer is a member of the Supervisory Board and the Management Board of
the target company and has an interest in the share capital of the acquirer.
Dkfm. Dr. Wolfgang C. Berndt is Chairman of the Supervisory Board of the target company and is also
Chairman of the Supervisory Board of the acquirer.
Dipl.-Bw. Alfred Heinzel is Vice Chairman of the Supervisory Board of the target company and also
Vice Chairman of the Supervisory Board of the acquirer.
Prof. KR Ing. Siegfried Wolf is a member of the Supervisory Board of the target company and also a
member of the Supervisory Board of the acquirer.
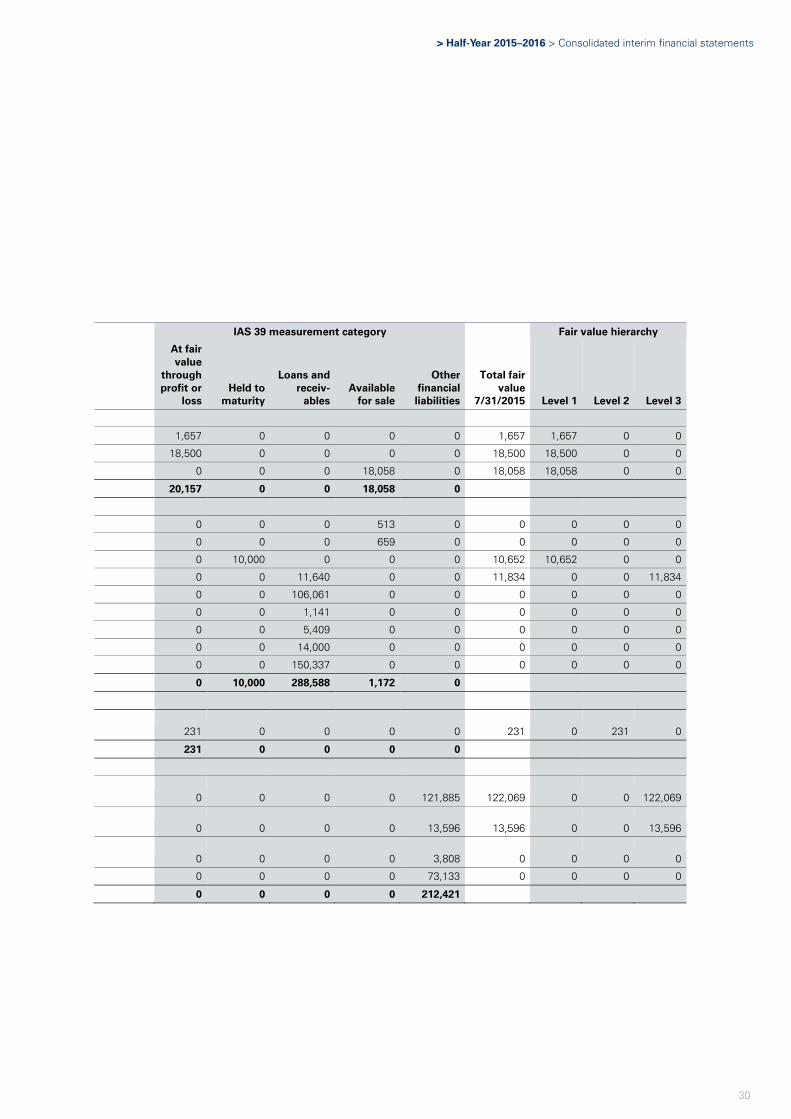
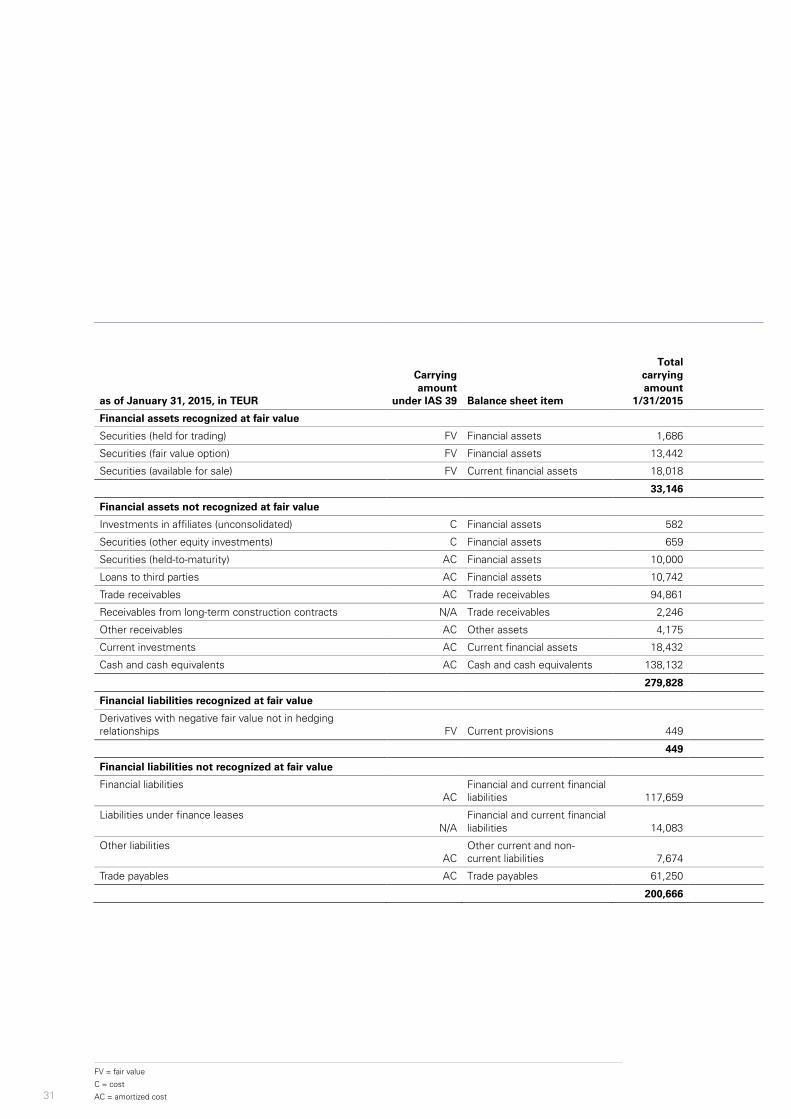
Financial instruments
The carrying amounts (classified according to IAS 39 measurement categories) and fair values (classified
according to fair value hierarchy) of financial assets and financial liabilities as of July 31, 2015, and January 31,
2015, were as follows:

29
as of July 31, 2015, in TEUR
Carrying amount
under IAS 39 Balance sheet item
Total carrying amount
7/31/2015
Financial assets recognized at fair value
Securities (held for trading) FV Financial assets 1,657
Securities (fair value option) FV Financial assets 18,500
Securities (available for sale) FV Current financial assets 18,058
38,215
Financial assets not recognized at fair value
Investments in affiliates (unconsolidated) C Financial assets 513
Securities (other equity investments) C Financial assets 659
Securities (held-to-maturity) AC Financial assets 10,000
Loans to third parties AC Financial assets 11,640
Trade receivables AC Trade receivables 106,061
Receivables from long-term construction contracts N/A Trade receivables 1,141
Other receivables AC Other assets 5,409
Current investments AC Current financial assets 14,000
Cash and cash equivalents AC Cash and cash equivalents 150,337
299,760
Financial liabilities recognized at fair value
Derivatives with negative fair value not in hedging relationships FV Current provisions 231
231
Financial liabilities not recognized at fair value
Financial liabilities AC
Financial and current financial liabilities 121,885
Liabilities under finance leases N/A
Financial and current financial liabilities 13,596
Other liabilities AC
Other current and non-current liabilities 3,808
Trade payables AC Trade payables 73,133
212,421
FV = fair value
C = cost
AC = amortized cost
> Half-Year 2015–2016 > Consolidated interim financial statements
30
IAS 39 measurement category Fair value hierarchy
At fair value
through profit or
loss Held to
maturity
Loans and receiv-
ables Available
for sale
Other financial
liabilities
Total fair value
7/31/2015 Level 1 Level 2 Level 3
1,657 0 0 0 0 1,657 1,657 0 0
18,500 0 0 0 0 18,500 18,500 0 0
0 0 0 18,058 0 18,058 18,058 0 0
20,157 0 0 18,058 0
0 0 0 513 0 0 0 0 0
0 0 0 659 0 0 0 0 0
0 10,000 0 0 0 10,652 10,652 0 0
0 0 11,640 0 0 11,834 0 0 11,834
0 0 106,061 0 0 0 0 0 0
0 0 1,141 0 0 0 0 0 0
0 0 5,409 0 0 0 0 0 0
0 0 14,000 0 0 0 0 0 0
0 0 150,337 0 0 0 0 0 0
0 10,000 288,588 1,172 0
231 0 0 0 0 231 0 231 0
231 0 0 0 0
0 0 0 0 121,885 122,069 0 0 122,069
0 0 0 0 13,596 13,596 0 0 13,596
0 0 0 0 3,808 0 0 0 0
0 0 0 0 73,133 0 0 0 0
0 0 0 0 212,421
31
as of January 31, 2015, in TEUR
Carrying amount
under IAS 39 Balance sheet item
Total carrying amount
1/31/2015
Financial assets recognized at fair value
Securities (held for trading) FV Financial assets 1,686
Securities (fair value option) FV Financial assets 13,442
Securities (available for sale) FV Current financial assets 18,018
33,146
Financial assets not recognized at fair value
Investments in affiliates (unconsolidated) C Financial assets 582
Securities (other equity investments) C Financial assets 659
Securities (held-to-maturity) AC Financial assets 10,000
Loans to third parties AC Financial assets 10,742
Trade receivables AC Trade receivables 94,861
Receivables from long-term construction contracts N/A Trade receivables 2,246
Other receivables AC Other assets 4,175
Current investments AC Current financial assets 18,432
Cash and cash equivalents AC Cash and cash equivalents 138,132
279,828
Financial liabilities recognized at fair value
Derivatives with negative fair value not in hedging relationships FV Current provisions 449
449
Financial liabilities not recognized at fair value
Financial liabilities AC
Financial and current financial liabilities 117,659
Liabilities under finance leases N/A
Financial and current financial liabilities 14,083
Other liabilities AC
Other current and non-current liabilities 7,674
Trade payables AC Trade payables 61,250
200,666
FV = fair value
C = cost
AC = amortized cost

> Half-Year 2015–2016 > Consolidated interim financial statements
32
IAS 39 measurement category Fair value hierarchy
At fair value
through profit or
loss Held to
maturity
Loans and Receiv-
ables Available
for sale
Other financial
liabilities
Total fair value
1/31/2015 Level 1 Level 2 Level 3
1,686 0 0 0 0 1,686 1,686 0 0
13,442 0 0 0 0 13,442 13,442 0 0
0 0 0 18,018 0 18,018 18,018 0 0
15,128 0 0 18,018 0
0 0 0 582 0 0 0 0 0
0 0 0 659 0 0 0 0 0
0 10,000 0 0 0 10,901 10,901 0 0
0 0 10,742 0 0 10,916 0 0 10,916
0 0 94,861 0 0 0 0 0 0
0 0 2,246 0 0 0 0 0 0
0 0 4,175 0 0 0 0 0 0
0 0 18,432 0 0 0 0 0 0
0 0 138,132 0 0 0 0 0 0
0 10,000 268,588 1,241 0
449 0 0 0 0 449 0 449 0
449 0 0 0 0
0 0 0 0 117,659 117,989 0 0 117,989
0 0 0 0 14,083 14,083 0 0 14,083
0 0 0 0 7,674 0 0 0 0
0 0 0 0 61,250 0 0 0 0
0 0 0 0 200,666
33
For financial assets and liabilities that are not recognized at fair value and have predominantly short remaining
maturities, the carrying amount as of the reporting date approximately corresponds to fair value. The fair values
for these are not presented in the table. Fair values of financial assets and liabilities are classified into levels 1 to
3 depending on how observable the inputs used to determine fair value are or how material they are to the
measurement. Transfers between the levels of financial assets and liabilities recognized at fair value are applied
at the end of the reporting period in which a change has taken place. There were no transfers between levels of
the fair value hierarchy during the reporting period.
Level 1: Market prices quoted in active markets for identical financial assets and liabilities.
Level 2: Fair values determined using quoted prices or measurement methods for which the inputs that are
important for determining value are based on observable market data.
Level 3: Fair values calculated using models in which the inputs that are important for determining value are
based on non-observable data.
Under IAS 39, financial assets are either classified on initial recognition as loans and receivables, available for
sale, held to maturity or financial assets at fair value through profit or loss, with the latter also being subdivided
into held for trading and fair value option. Trade payables and financial liabilities are recognized at amortized cost,
if applicable using the effective interest method, and classified as financial liabilities at amortized cost. Liabilities
under finance leases are generally recognized as a liability at the present value of future lease payments.
Positive fair values of derivative financial instruments classified as held for trading and for which the Miba Group
does not use hedge accounting are reported under other assets. Negative fair values of derivative financial
instruments classified as financial liabilities at fair value through profit or loss (held for trading) and for which the
Miba Group does not use hedge accounting are reported under current provisions. There was no change in the
classification of financial assets and liabilities in the reporting period.
In the Miba Group, debt instruments (securities) are allocated to the financial assets at fair value through profit
or loss (held for trading) category. In addition, there are debt instruments (securities) which are classified on
initial recognition as financial assets at fair value through profit or loss (fair value option) if the IAS 39 criteria are
met. These comprise securities which are managed and reported on the basis of fair value while complying
with a documented risk management strategy. They are accounted for at fair value at the date of acquisition and
in subsequent periods. Changes in value, if material, are recognized in the income statement. The fair value of
securities (with the exception of other equity investments) is based on current prices and equates to the market
value as of the reporting date.
Investments in unconsolidated companies and other equity investments are generally classified as available for
sale. As there are no active markets for these equity instruments and there are significant margins of
fluctuation for possible fair values, they are reported at cost. In addition, debt instruments (securities) are
allocated to the available for sale category. Fluctuations in the value of financial assets that are classified as
available for sale are, if material, presented in other comprehensive income, taking account of deferred tax.
Recycling to profit or loss for the period of the amounts recognized in other comprehensive income only takes
place on the date of disposal or in the event of a material or permanent impairment of the corresponding
financial assets. Investments in (unconsolidated) affiliated companies and other equity investments in
> Half-Year 2015–2016 > Consolidated interim financial statements
34
companies include unquoted equity instruments whose fair value cannot be reliably determined and which are
therefore recognized at cost. No disposals are planned in the foreseeable future.
Derivative financial instruments are valued using recognized actuarial techniques (DCF method) which are
based on observable market parameters (yield curves, exchange rates, quoted copper prices) and unobservable
parameters (credit ratings and counterparty default risk). In addition, as of the reporting date, market prices
established by banks are used and adjustments made taking account of the credit risk (credit value
adjustments) if these adjustments are material.
Other events
Disclosures relating to the takeover offer from Mitterbauer Beteiligungs-Aktiengesellschaft (MBAG) to Miba
AG’s non-controlling interest shareholders are outlined in the management report of the half-yearly financial
statements under Miba shares.
All detailed information, mailings and documentation in connection with the takeover offer can be downloaded
from the Miba AG website (www.miba.com).
Seasonal business trends
The revenue of the Miba Group is generally distributed almost equally over the four quarters of the fiscal year.
Events after the reporting date
Events after the reporting date which are significant to measurement as of the reporting date, such as ongoing
litigation or claims for damages, as well as other obligations or expected losses which must be recognized or
disclosed under IAS 10, have been reflected in the accompanying interim financial statements or are not
known.
35
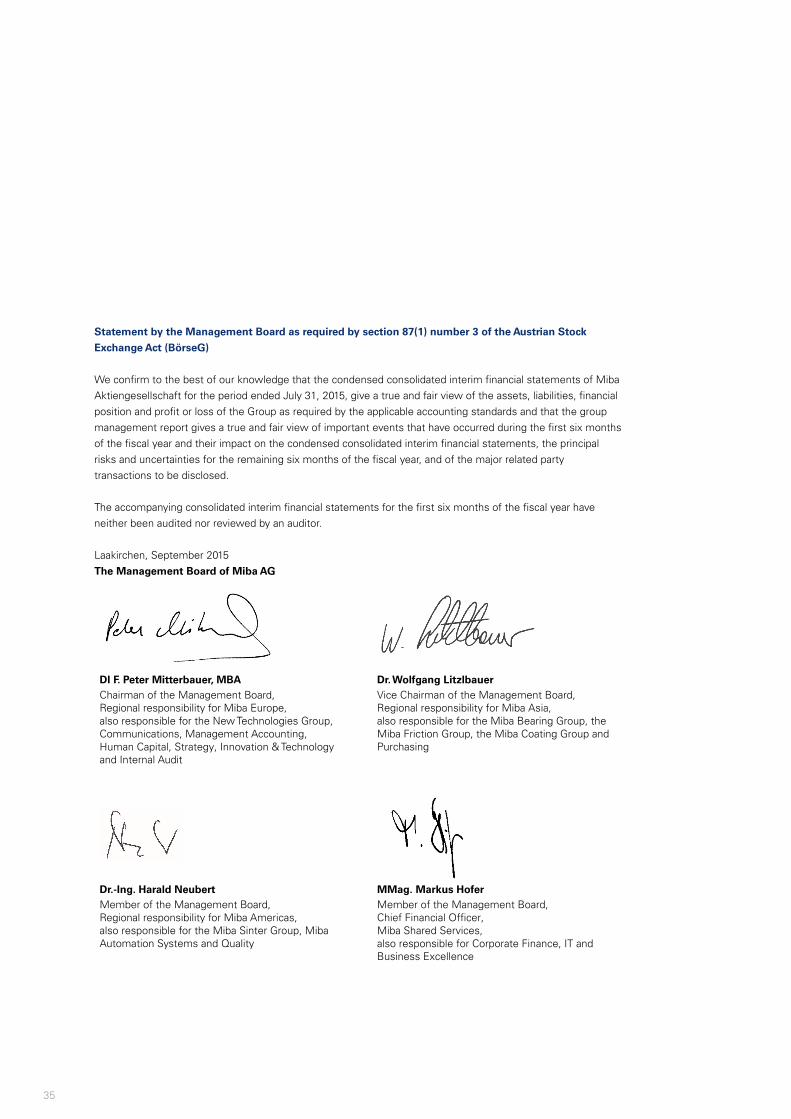
Statement by the Management Board as required by section 87(1) number 3 of the Austrian Stock
Exchange Act (BörseG)
We confirm to the best of our knowledge that the condensed consolidated interim financial statements of Miba
Aktiengesellschaft for the period ended July 31, 2015, give a true and fair view of the assets, liabilities, financial
position and profit or loss of the Group as required by the applicable accounting standards and that the group
management report gives a true and fair view of important events that have occurred during the first six months
of the fiscal year and their impact on the condensed consolidated interim financial statements, the principal
risks and uncertainties for the remaining six months of the fiscal year, and of the major related party
transactions to be disclosed.
The accompanying consolidated interim financial statements for the first six months of the fiscal year have
neither been audited nor reviewed by an auditor.
Laakirchen, September 2015
The Management Board of Miba AG
DI F. Peter Mitterbauer, MBA
Chairman of the Management Board, Regional responsibility for Miba Europe, also responsible for the New Technologies Group, Communications, Management Accounting, Human Capital, Strategy, Innovation & Technology and Internal Audit
Dr. Wolfgang Litzlbauer
Vice Chairman of the Management Board, Regional responsibility for Miba Asia, also responsible for the Miba Bearing Group, the Miba Friction Group, the Miba Coating Group and Purchasing
Dr.-Ing. Harald Neubert
Member of the Management Board, Regional responsibility for Miba Americas, also responsible for the Miba Sinter Group, Miba Automation Systems and Quality
MMag. Markus Hofer
Member of the Management Board, Chief Financial Officer, Miba Shared Services, also responsible for Corporate Finance, IT and Business Excellence
> Half-Year 2015–2016 > Consolidated interim financial statements
36
This Interim Report was produced in-house with FIRE.sys.
Publisher
Miba Aktiengesellschaft
Dr.-Mitterbauer-Strasse 3
4663 Laakirchen, Austria
www.miba.com

37


![Insurance market development and economic growth in transition … · INSURANCE MARKET DEVELOPMENT AND ECONOMIC GROWTH […] 215 density and penetration (cf. Figures 1 to3). This](https://img.pdfslide.net/doc/110x75/5ea9d80f430290276b3787dd/insurance-market-development-and-economic-growth-in-transition-insurance-market.jpg)