Embed Size (px)
Citation preview
JOURNAL OF BACTERIOLOGY, Jan. 1971, p. 165-171 Vol. 105, No. ICopyright 1971 American Society for Microbiology Printed in U.S.A.
Kinetics of Thermal Death of BacteriaWILLIAM A. MOATS
Market Quality Research Division, Agricultural Research Service,U.S. Department of Agriculture, Beltsville, Maryland 20705
Received for publication 21 September 1970
Experimental observations on thermal injury and death of bacteria in the sta-tionary phase can be explained by assuming that death results from inactivationof (XL) of N critical sites. It is assumed: (i) that inactivation of individual sites oc-curs at random and follows first-order kinetics, (ii) that the critical sites are iden-tical and of equal heat resistance, and (iii) the bacterial population is homogeneousin heat resistance. A method is described for calculating k (the rate constant for in-activation of individual sites), N (sites per cell), and XL (the number which must beinactivated to cause death under the experimental conditions used) from experi-mental data. Theoretical curves calculated by using this model are identical withexperimental curves, providing support for the assumptions used. Calculated valuesof N and XL were 130 and 21.7 for Pseudomonas viscosa and 175 and 2.7 for Sal-monella anatum. There is considerable uncertainty in the absolute values of N, butthey are probably > 100. It is predicted that XL will vary depending on the recov-ery medium used after heating. This theory is consistent with all experimental ob-servations on thermal injury and death of bacteria.
Heat treatment is one of the most widely usedmethods for destruction of spoilage and patho-genic bacteria. Mild-heat treatment, known aspasteurization, dates from the discoveries ofPasteur in 1860-64 (11), and is widely used forfood products which are adversely affected byexcessive heating. Despite this long history, noadequate explanation has been developed for themechanism of thermal destruction of bacteria byheat. An understanding of the mechanism andkinetics of thermal death of bacteria would behelpful in the practical use of heat in processingheat-sensitive foods.Most textbooks of microbiology state that, at
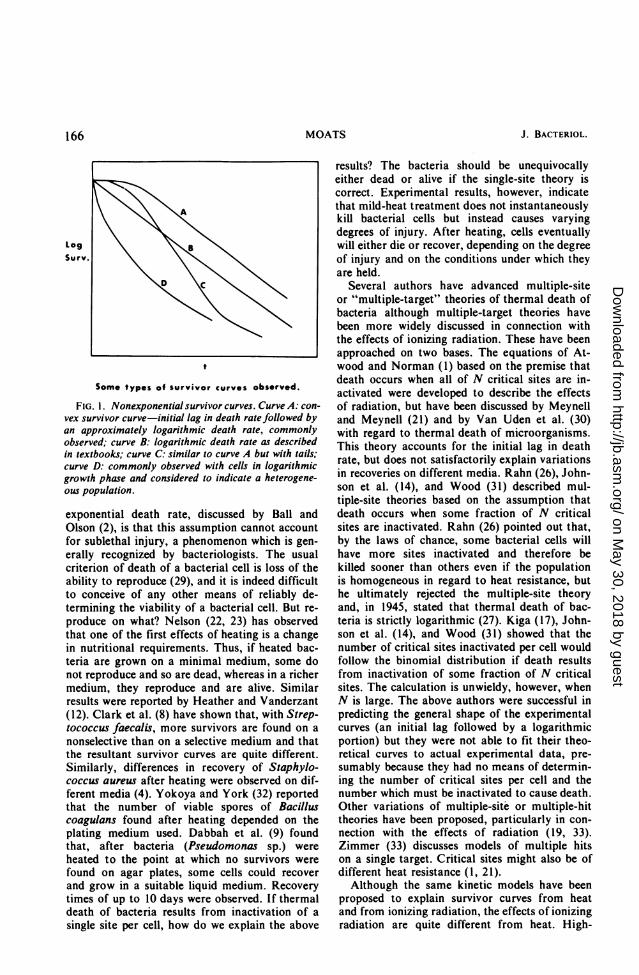
constant temperature, thermal death of bacteriais exponential with time, and thermal processcalculations used in food processing are based onthis assumption (2, 29). However, examples ofnonexponential survivor curves, too numerous tolist, are found in the literature. They fall intofour general types (Fig. 1) which were recognizedas early as 1912 by Eikjmann (10). Curve A isthe type commonly found by the most careful in-vestigators and shows an initial lag in death ratefollowed by a logarithmic portion. Curve C issimilar to curve A but tails. Wood (31) attributesthe tailing to a small population of heat-resistantcells. Concave curves similar to curve D aregenerally interpreted as indicating that the popu-lation is heterogeneous with regard to heat re-sistance.Rahn (25, 26) gives a good discussion of the
early literature on survivor curves. He creditsMadsen and Nyman (20) and Chick (6), workingindependently, with being the first to observe theapparently exponential nature of survivor curves,although Madsen and Nyman present few datato support their conclusions with regard to ther-mal death. Chick (7) also observed both concaveand convex curves. She explained concave sur-vivor curves as indicating a population hetero-geneous in heat resistance; this remains the onlysatisfactory explanation. Rahn (25) replotteddata of Reichenbach (28) obtained with "Bact.paratyphosum" to show that the shape of thesurvivor curve depends on the age of the culture,being concave at 5.5 hr, linear at 13.5 and 18 hr,and convex, with an initial lag in death rate, af-ter 24 hr.The theory that thermal death of bacteria fol-
lows the kinetics of a unimolecular reaction (first-order kinetics) has been discussed in detail by anumber of authors, including Rahn (26, 27),Charm (5), and Stumbo (29). A first-order reac-tion is one in which the rate is proportional to thenumber of molecules present. If thermal death ofbacteria truly follows first-order kinetics, deathmust then result from inactivation of a singlemolecule or site per bacterial cell. Furthermore,the death rate should be highest at the start whenthe number of bacteria is highest. This theorycannot, therefore, account for the initial lag indeath rate which is frequently observed.A further objection to the assumption of an
165
on May 30, 2018 by guest
http://jb.asm.org/
Dow
nloaded from
J. BACTERIOL.
t
Some types of survivor curves observed.
FIG. 1. Nonexponential survivor curves. Curve A: con-
vex survivor curve-initial lag in death rate followed byan approximately logarithmic death rate, commonlyobserved; curve B: logarithmic death rate as describedin textbooks; curve C: similar to curve A but with tails;curve D: commonly observed with cells in logarithmicgrowth phase and considered to indicate a heterogene-ous population.
exponential death rate, discussed by Ball andOlson (2), is that this assumption cannot accountfor sublethal injury, a phenomenon which is gen-erally recognized by bacteriologists. The usualcriterion of death of a bacterial cell is loss of theability to reproduce (29), and it is indeed difficultto conceive of any other means of reliably de-termining the viability of a bacterial cell. But re-produce on what? Nelson (22, 23) has observedthat one of the first effects of heating is a changein nutritional requirements. Thus, if heated bac-teria are grown on a minimal medium, some donot reproduce and so are dead, whereas in a richermedium, they reproduce and are alive. Similarresults were reported by Heather and Vanderzant(12). Clark et al. (8) have shown that, with Strep-tococcus faecalis, more survivors are found on a
nonselective than on a selective medium and thatthe resultant survivor curves are quite different.Similarly, differences in recovery of Staphylo-coccus aureus after heating were observed on dif-ferent media (4). Yokoya and York (32) reportedthat the number of viable spores of Bacilluscoagulans found after heating depended on theplating medium used. Dabbah et al. (9) foundthat, after bacteria (Pseudomonas sp.) wereheated to the point at which no survivors werefound on agar plates, some cells could recoverand grow in a suitable liquid medium. Recoverytimes of up to 10 days were observed. If thermaldeath of bacteria results from inactivation of a
single site per cell, how do we explain the above
results? The bacteria should be unequivocallyeither dead or alive if the single-site theory iscorrect. Experimental results, however, indicatethat mild-heat treatment does not instantaneouslykill bacterial cells but instead causes varyingdegrees of injury. After heating, cells eventuallywill either die or recover, depending on the degreeof injury and on the conditions under which theyare held.
Several authors have advanced multiple-siteor "multiple-target" theories of thermal death ofbacteria although multiple-target theories havebeen more widely discussed in connection withthe effects of ionizing radiation. These have beenapproached on two bases. The equations of At-wood and Norman (1) based on the premise thatdeath occurs when all of N critical sites are in-activated were developed to describe the effectsof radiation, but have been discussed by Meynelland Meynell (21) and by Van Uden et al. (30)with regard to thermal death of microorganisms.This theory accounts for the initial lag in deathrate, but does not satisfactorily explain variationsin recoveries on different media. Rahn (26), John-son et al. (14), and Wood (31) described mul-tiple-site theories based on the assumption thatdeath occurs when some fraction of N criticalsites are inactivated. Rahn (26) pointed out that,by the laws of chance, some bacterial cells willhave more sites inactivated and therefore bekilled sooner than others even if the populationis homogeneous in regard to heat resistance, buthe ultimately rejected the multiple-site theoryand, in 1945, stated that thermal death of bac-teria is strictly logarithmic (27). Kiga (17), John-son et al. (14), and Wood (31) showed that thenumber of critical sites inactivated per cell wouldfollow the binomial distribution if death resultsfrom inactivation of some fraction of N criticalsites. The calculation is unwieldy, however, whenN is large. The above authors were successful inpredicting the general shape of the experimentalcurves (an initial lag followed by a logarithmicportion) but they were not able to fit their theo-retical curves to actual experimental data, pre-sumably because they had no means of determin-ing the number of critical sites per cell and thenumber which must be inactivated to cause death.Other variations of multiple-site or multiple-hittheories have been proposed, particularly in con-nection with the effects of radiation (19, 33).Zimmer (33) discusses models of multiple hitson a single target. Critical sites might also be ofdifferent heat resistance (1, 21).
Although the same kinetic models have beenproposed to explain survivor curves from heatand from ionizing radiation, the effects of ionizingradiation are quite different from heat. High-
166 MOATS
on May 30, 2018 by guest
http://jb.asm.org/
Dow
nloaded from
THERMAL DEATH IN BACTERIA
energy radiation can be expected to cause local-ized indiscriminate damage to the cell along itstrack, either directly or from the formation ofions or free radicals which cause secondary ef-fects (33). Heat, on the other hand, will be more
or less uniformly distributed in the cell and may
be expected to selectively damage only the mostsensitive molecules within the cell. For example,ionizing radiation is mutagenic, whereas heat isnot known to be, indicating quite different typesof damage to the cell.
In this paper, I will consider the application tothe kinetics of thermal death of bacteria of themodel where inactivation of a portion of multiplecritical sites causes death and present evidencethat, with homogeneous bacterial populations, a
curve calculated on this assumption fits experi-mental data to very high probabilities of kill.
MATERIALS AND METHODS
Preparation of cultures. The culture of Salmonellaanatum (ATCC 9270) was carried on Trypticase SoyAgar (TSA; BBL) slants and then passed once in Tryp-ticase Soy Broth (TSB; BBL) before being inoculated inthe growth medium (TSB) or basal minimal medium[formula of Heather and Vanderzant (12)]. Cultureswere grown at 35 C for 24 hr in TSB or 48 hr in basalmedium, centrifuged, washed twice in 0.1 N phos-phate buffer (pH 7.0), and suspended in the heatingmedium.
Heating procedure. Heating was carried out insealed l-ml ampoules completely immersed in the waterbath. Temperatures in the ampoules were measured inan identical ampoule with a thermocouple sealed inside.Holding times were recorded from the time the tem-perature reached 5 C below the holding temperature toremoval from the water bath which gives a reasonablecorrection for come-up and cooling time. Ampouleswere removed at intervals and immediately cooled inan ice-water bath.
Enumeration of survivors. The cooled ampoules were
opened, and appropriate dilutions in peptone (BBL)water were plated in triplicate on the indicated agar.
Theoretical considerations. According to the modelused, the probability that a cell survives is equal tothe probability that the cell has less than XL of N criti-cal sites inactivated. The binomial solution may be ex-
pressed as the following equation.XL- 1
P(survivors) = 2 (N/X)e-kt(N-X)(l - e-kt)X (1)x = 0
If XI = N, the expression reduces to the equation ofAtwood and Norman (1).When N is large, the normal distribution approxi-
mates the binomial distribution (24). 1 have derived a
method of determining the rate constant (k) for inac-tivation of individual sites, the number of critical sites(N), and the number which must be inactivated tocause death (XL) from experimental data, by using thenormal distribution. I am considering "sites" at themolecular level where a single event is required tochange or inactivate a site. It does not appear useful, inthe present context, to define sites in a manner where
more than one "hit" is required to inactivate a "target"as proposed by Zimmer (33). For the derivation, thefollowing assumptions are made. (i) Inactivation of in-dividual sites follows the first-order rate equation andoccurs at random, (ii) all sites are identical and of equalheat resistance, and (iii) the bacterial population ishomogeneous with regard to heat resistance.
The first-order rate equation may be written (18):
or
or
ln N/(N - X) = kt
(N - X)/N = e-kt
X = N(I - e-kt)
(2)
(3)
(4)
where t is the time, k the rate constant, N the initialnumber of critical sites, and X the number of criticalsites inactivated at any time (t). N and X are concen-
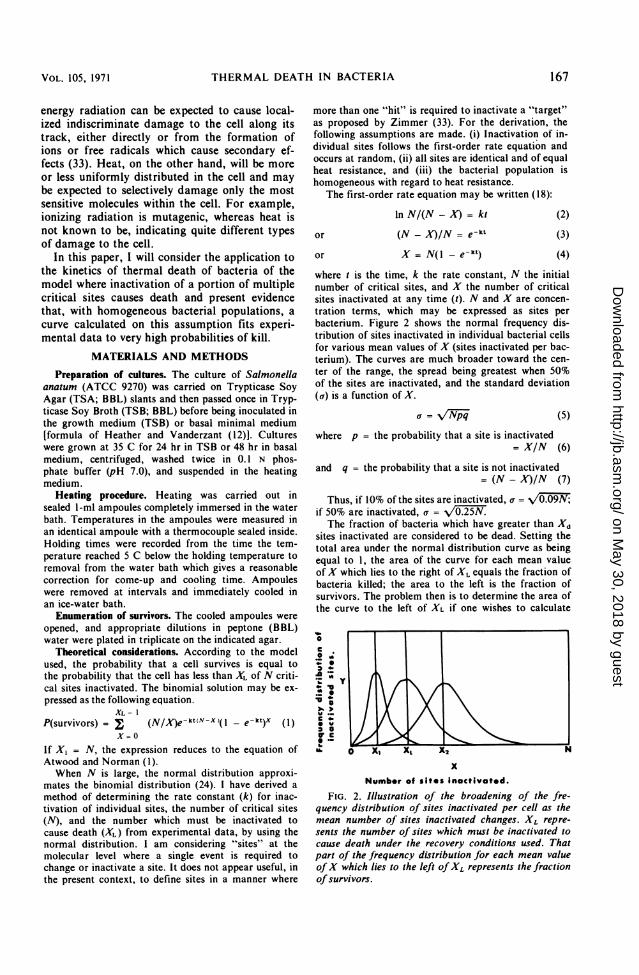
tration terms, which may be expressed as sites perbacterium. Figure 2 shows the normal frequency dis-tribution of sites inactivated in individual bacterial cellsfor various mean values of X (sites inactivated per bac-terium). The curves are much broader toward the cen-ter of the range, the spread being greatest when 50%of the sites are inactivated, and the standard deviation(a) is a function of X.
a = /1VrN-p (5)
where p = the probability that a site is inactivated= X/N (6)
and q = the probability that a site is not inactivated= (N - X)/N (7)
Thus, if 10% of the sites are inactivated, a = V0if 50% are inactivated, a = 2The fraction of bacteria which have greater than Xd
sites inactivated are considered to be dead. Setting thetotal area under the normal distribution curve as beingequal to 1, the area of the curve for each mean valueofX which lies to the right of XL equals the fraction ofbacteria killed; the area to the left is the fraction ofsurvivors. The problem then is to determine the area ofthe curve to the left of XL if one wishes to calculate
o-
0
>.W:;
0-
W. iXI xi X2
x
Number of sites inactivated.
FIG. 2. Illustration of the broadening of the fre-quency distribution of sites inactivated per cell as themean number of sites inactivated changes. XL repre-sents the number of sites which must be inactivated tocause death under the recovery conditions used. Thatpart of the frequency distribution for each mean valueofX which lies to the left ofXL represents the fractionofsurvivors.
VOL. 105, 1971 167
on May 30, 2018 by guest
http://jb.asm.org/
Dow
nloaded from
J. BACTERIOL.
the fraction of survivors. Tables of the normal proba-bility integral are available in terms of the area underthe curve from various ratios of dia to infinity. Thedeviation (d) from the mean is
d = X - XL
From equations 5 to 7
-f= o/(X)(N -X)/N
When 50% of the bacteria are killed, X = XL-
XL = N(I - e kt50)
Then div = (X - XL)/!/X[(N - X)/N]
N = 175
XL = N(l- e- k50 )
175 (1 =e-0013 (1.2))
= 2.7(8)
To determine the fraction surviving at any time (t),(9) X = N(l - e-kt). For t = 4.5 min, X = 175 (I -
e-(0.013)(4.5))= 9.9.
(10)
(I 1)
Substituting from equations 3, 4, and 10, squaringboth sides, and rearranging, we obtain
(d/a)2 = N(e 2kt 2e- (kt+kt50) +e-2kto)i(e-kt _e-2kt) (12)
This is an equation with two unknowns, k and N. Thetimes (t and t50) are determined experimentally and diacan be determined from the fraction surviving at time(t). From the fraction surviving at two different times,equation 12 can be solved simultaneously for k. Thereis no direct way to solve for k; solution requires substi-tution of values of k until the equality is satisfied. Thisis tedious if done by hand but can be done easily be com-puter.
Sample calculation. Salmonella anatum was heatedat 55 C for various lengths of time, plated on TrypticaseSoy Agar, and incubated at 35 to 37 C for 48 hr. Thesurvivor curve was plotted, and the time that 50% of thepopulation was killed (t50) was determined from thegraph to be 1.2 min. Two experimental points which layon the curve were selected and were used to solve equa-tion 12 simultaneously for k.
At 2.5 min, the fraction is 0.108. From a table of thenormal probability function, it can be determined thedla is 1.24 when the area of the tail of the normal prob-ability function is 0.108.
Similarly, at 8.5 min, the fraction surviving is0.000059 and dia is 3.85.
Substituting these values into equation 12
(1.24)2 = N(e 5.Ok _ 2e-37k + e-2.4k )/(e-2.5 - e-5sk ) (2.5 min) (13)
(3.85)2 = N(e 17k - 2e-97k + e-2.4k)V(e-8.5k _ e- 17k ) (8.5 min) (14)
Solving simultaneously for k
(3.85)2/(1.24)2 = (e-17k _ 2e-9.7k + e-2.4
-(e-2.5k e-5Ok)i(e-5.Ok _ 2e-3.7k + e-2.4k)*(e-8.5- e- 17k) = 9.65 (15)
This equation can be solved by substituting values ofk until the equality is satisfied. A good set of tables ofthe exponential function is necessary. A value of k =
0.013/min satisfies the equality. It should be empha-sized that k is the rate at which individual sites in bac-teria are being inactivated, not the rate at which the en-tire bacterium is inactivated.N can then be determined from equation 13 or 14.
Thus, d/a = (X - XL)/! /X[(N - X)/NM] = (9.9 -
2.7)/(9.9) [(175 - 9.9] = 2.35.
From the tables, the area of the tail of the normaldistribution for dia = 2.35 is 0.0094 = fraction of sur-vivors as 4.5 min.From Table 1, the observed fraction of survivors is
0.0092.
RESULTS AND DISCUSSIONTables I to 3 show the theoretical and calcu-
lated fraction of survivors of S. anatum (datafrom our own laboratory), Pseudomonas viscosa[data from Kaufmann and Andrews (15)], andStreptococcus faecalis (A. J. Mercuri, unpub-lished data), respectively. For the data of Kauf-
TABLE 1. Experimental versus calculatedfractionsurviving Salmonella anatum heated at 55 Ca
Fraction survivorsTime (min)
Experimental Calculated
0 1.00 1.002.5 0.108 0.1094.5 0.0092 0.00946.5 0.00083 0.000748.5 0.000059 0.00005710.5 0.0000053 0.0000046
a Heated in Trypticase Soy Broth and plated onTrypticase Soy Agar; k = 0.013/min, N = 175, XL =2.7, ta0 = 1.2 min.
TABLE 2. Experimental versus calculatedfractionsurviving Pseudomonas viscosa heated at 118.6 Fa
Fraction survivorsTime (min)"
Experimental Calculated
0 1.00 1.004.8 0.85 0.866.8 0.33 0.317.8 0.124 0.1259.8 0.0098 0.010411.8 0.00055 0.0005613.8 0.000037 0.00001816.0 - 0.00000026
a Data of Kaufmann and Andrews (15); k0.030/min, N = 130, XL = 21.7, t50 = 6.1 min.
bCorrected for heating lag.
168 MOATS
on May 30, 2018 by guest
http://jb.asm.org/
Dow
nloaded from
THERMAL DEATH IN BACTERIA
mann and Andrews (15), a correction of 0.2 minwas subtracted from the published holding times.The authors injected the bacteria into the heatingmedium and assumed no lag in heating. Laterfindings by Kaufmann et al. (16) shqwed that,when bacteria are injected into the heating me-dium, the effective temperature is lower than thatof the medium for the first few tenths of a minuteso that the correction is justified.
I have applied this method of calculation to anumber of survivor curves of type A or C, andagreement between calculated and experimentalcurves was excellent in all cases. With curves oftype C, it is necessary to disregard the tail whichapparently results from a small heat-resistantpopulation as suggested by Wood (31). Many ofour experimental curves are more complex andthese will be discussed in another paper.The values calculated for k and N are mark-
edly affected by small changes in the value se-lected for t.0. A change by ±0.1 min in tao maychange the values of k and N several fold, thetwo being roughly inversely proportional. Thismeans that the absolute values of k and N arequite uncertain since it is difficult to estimatet50 more accurately than ±0.1 min. However,the accuracy of the parameters N, k, and XLcalculated from various estimates of t50 can bechecked to some extent by comparing theoreticalcurves calculated by using these parameters withthe experimental curves. If N is < 100& the theo-retical curve falls decidedly below thV extrapo-lated logarithmic portion of the experimentalcurve after a 105- to 106-fold reduction in survi-vors. We have carried many survivor curvesthrough a 108- to 109-fold reduction in survivors,and, in all cases, they continue to be nearly log-arithmic or tail to the right. Therefore, N isprobably > 100 and values below 100 are ques-tionable. Calculated values of N from a numberof experiments have generally been in the 100 to200 range.
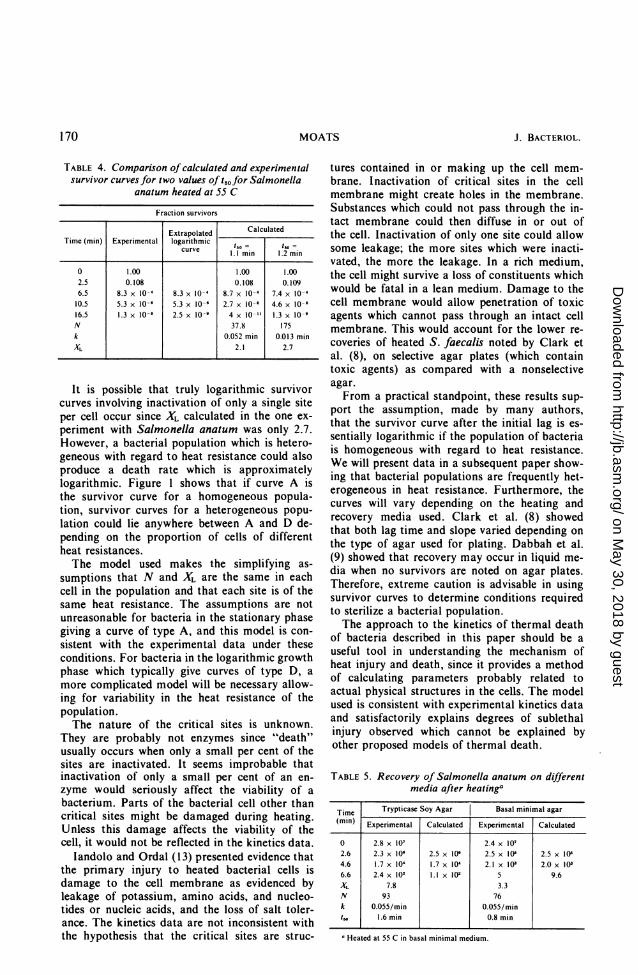
In the example shown in Table 1, the value of1.2 min was used for t,0. If 1.3 min is used, kis negative which cannot be; if a value of 1.1 minis used, k = 0.052/min, N = 37.8, and XL = 2.1.The curves are compared in Table 4. The devia-tion between the calculated curves is slight up to8.5 min, but is very marked at 16.5 min. The ex-
perimental number of survivors at 16.5 min istoo few (ten) for a precise estimate but is cer-tainly closer to the curve calculated by using N =
175.Despite the large uncertainty in the absolute
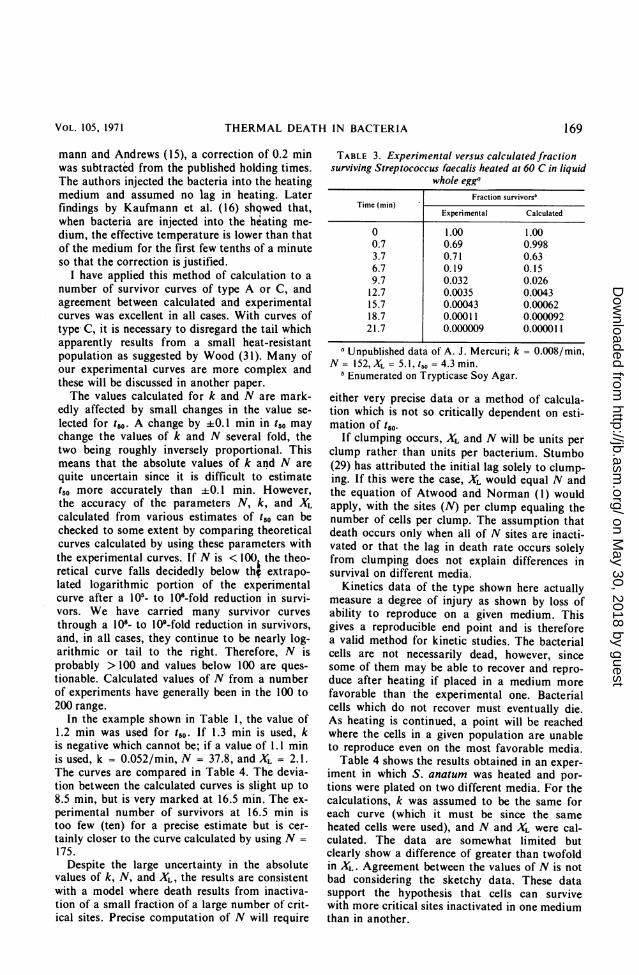
values of k, N, and XL, the results are consistentwith a model where death results from inactiva-tion of a small fraction of a large number of crit-ical sites. Precise computation of N will require
TABLE 3. Experimental versus calculatedfractionsurviving Streptococcus faecalis heated at 60 C in liquid
whole eggaFraction survivors"
Time (min)Experimental Calculated
O 1.00 1.000.7 0.69 0.9983.7 0.71 0.636.7 0.19 0.159.7 0.032 0.02612.7 0.0035 0.004315.7 0.00043 0.0006218.7 0.00011 0.00009221.7 0.000009 0.000011
a Unpublished data of A. J. Mercuri; k = 0.008/min,N= 152,XL= 5.1,t55= 4.3min.
Enumerated on Trypticase Soy Agar.
either very precise data or a method of calcula-tion which is not so critically dependent on esti-mation of t50.
If clumping occurs, XL and N will be units perclump rather than units per bacterium. Stumbo(29) has attributed the initial lag solely to clump-ing. If this were the case, XL would equal N andthe equation of Atwood and Norman (1) wouldapply, with the sites (N) per clump equaling thenumber of cells per clump. The assumption thatdeath occurs only when all of N sites are inacti-vated or that the lag in death rate occurs solelyfrom clumping does not explain differences insurvival on different media.
Kinetics data of the type shown here actuallymeasure a degree of injury as shown by loss ofability to reproduce on a given medium. Thisgives a reproducible end point and is thereforea valid method for kinetic studies. The bacterialcells are not necessarily dead, however, sincesome of them may be able to recover and repro-duce after heating if placed in a medium morefavorable than the experimental one. Bacterialcells which do not recover must eventually die.As heating is continued, a point will be reachedwhere the cells in a given population are unableto reproduce even on the most favorable media.
Table 4 shows the results obtained in an exper-iment in which S. anatum was heated and por-tions were plated on two different media. For thecalculations, k was assumed to be the same foreach curve (which it must be since the sameheated cells were used), and N and XL were cal-culated. The data are somewhat limited butclearly show a difference of greater than twofoldin XL. Agreement between the values of N is notbad considering the sketchy data. These datasupport the hypothesis that cells can survivewith more critical sites inactivated in one mediumthan in another.
VOL. 105, 1971 169
on May 30, 2018 by guest
http://jb.asm.org/
Dow
nloaded from
J. BACTERIOL.
TABLE 4. Comparison of calculated and experimentalsurvivor curves for two values oft50 for Salmonella
anatum heated at 55 C
Fraction survivors
Extrapolated CalculatedTime (min) Experimental logarithmic I I m 1 i
curve 1.1I min 1.2 min
0 1.00 1.00 1.002.5 0.108 0.108 0.1096.5 8.3 x 10⁻⁴ 8.3 x 10⁻⁴ 8.7 x 10-' 7.4 x 10-'10.5 5.3 x 10⁻⁶ 5.3 x 10-' 2.7 x 10⁻⁶ 4.6 x 10-616.5 1.3 x 10⁻⁶ 2.5 x 10⁻⁶ 4 x 10-" 1.3 x 10-'N 37.8 175k 0.052 min 0.013 minXL 2.1 2.7
It is possible that truly logarithmic survivorcurves involving inactivation of only a single siteper cell occur since XL calculated in the one ex-periment with Salmonella anatum was only 2.7.However, a bacterial population which is hetero-geneous with regard to heat resistance could alsoproduce a death rate which is approximatelylogarithmic. Figure shows that if curve A isthe survivor curve for a homogeneous popula-tion, survivor curves for a heterogeneous popu-lation could lie anywhere between A and D de-pending on the proportion of cells of differentheat resistances.The model used makes the simplifying as-
sumptions that N and XL are the same in eachcell in the population and that each site is of thesame heat resistance. The assumptions are notunreasonable for bacteria in the stationary phasegiving a curve of type A, and this model is con-
sistent with the experimental data under theseconditions. For bacteria in the logarithmic growthphase which typically give curves of type D, a
more complicated model will be necessary allow-ing for variability in the heat resistance of thepopulation.The nature of the critical sites is unknown.
They are probably not enzymes since "death"usually occurs when only a small per cent of thesites are inactivated. It seems improbable thatinactivation of only a small per cent of an en-
zyme would seriously affect the viability of a
bacterium. Parts of the bacterial cell other thancritical sites might be damaged during heating.Unless this damage affects the viability of thecell, it would not be reflected in the kinetics data.
landolo and Ordal (13) presented evidence thatthe primary injury to heated bacterial cells isdamage to the cell membrane as evidenced byleakage of potassium, amino acids, and nucleo-tides or nucleic acids, and the loss of salt toler-ance. The kinetics data are not inconsistent withthe hypothesis that the critical sites are struc-
tures contained in or making up the cell mem-brane. Inactivation of critical sites in the cellmembrane might create holes in the membrane.Substances which could not pass through the in-tact membrane could then diffuse in or out ofthe cell. Inactivation of only one site could allowsome leakage; the more sites which were inacti-vated, the more the leakage. In a rich medium,the cell might survive a loss of constituents whichwould be fatal in a lean medium. Damage to thecell membrane would allow penetration of toxicagents which cannot pass through an intact cellmembrane. This would account for the lower re-coveries of heated S. faecalis noted by Clark etal. (8), on selective agar plates (which containtoxic agents) as compared with a nonselectiveagar.From a practical standpoint, these results sup-
port the assumption, made by many authors,that the survivor curve after the initial lag is es-sentially logarithmic if the population of bacteriais homogeneous with regard to heat resistance.We will present data in a subsequent paper show-ing that bacterial populations are frequently het-erogeneous in heat resistance. Furthermore, thecurves will vary depending on the heating andrecovery media used. Clark et al. (8) showedthat both lag time and slope varied depending onthe type of agar used for plating. Dabbah et al.(9) showed that recovery may occur in liquid me-dia when no survivors are noted on agar plates.Therefore, extreme caution is advisable in usingsurvivor curves to determine conditions requiredto sterilize a bacterial population.The approach to the kinetics of thermal death
of bacteria described in this paper should be auseful tool in understanding the mechanism ofheat injury and death, since it provides a methodof calculating parameters probably related toactual physical structures in the cells. The modelused is consistent with experimental kinetics dataand satisfactorily explains degrees of sublethalinjury observed which cannot be explained byother proposed models of thermal death.
TABLE 5. Recovery of Salmonella analum on differentmedia after heatinga
Time Trypticase Soy Agar Basal minimal agar(min) Experimental Calculated Experimental Calculated
0 2.8 x 10' 2.4 x 10'2.6 2.3 x 10' 2.5 x 10 2.5 x 10' 2.5 x 104.6 1.7 x 10' 1.7 x 10' 2.1 x 10³ 2.0 x IO'6.6 2.4 x 10² 1.1 x 10² 5 9.6XL 7.8 3.3N 93 76k 0.055/min 0.055/mints, 1.6 min 0.8 min
'Heated at 55 C in basal minimal medium.
170 MOATS
on May 30, 2018 by guest
http://jb.asm.org/
Dow
nloaded from
THERMAL DEATH IN BACTERIA
ACKNOWLEDGMENTS
The author expresses his appreciation to Roy Heatwole, BiometricalServices Staff, ARS, for developing a computer program for solvingequation 12, and to Roger Dabbah and V. M. Edwards for preparingthe experimental survivor curves used.
LITERATURE CITED1. Atwood, K. C., and A. Norman. 1949. On the interpretation of multi-
hit survival curves. Proc. Nat. Acad. Sci. U.S.A. 35:696-709.2. Ball, C. O., and F. C. W. Olson. 1955. Foundation of food process
calculations. Food Res. 20:666-686.3. Ball, C. O., and F. C. W. Olson. 1957. Sterilization in food technol-
ogy. McGraw-Hill Book Co., Inc., New York.4. Busta, F. F., and J. J. Jejeski. 1963. Effects of sodium chloride con-
centration in an agar medium on growth of heat-shocked Staphylo-coccus aureus. Appl. Microbiol. 11-.404-407.
5. Charm, S. E. 1958. The kinetics of bacterial inactivation by heat.Food Technol. 12:4-8.
6. Chick, H. 1908. An investigation of the laws of disinfection. J. Hyg.8:92-158.
7. Chick, H. 1910. The process of disinfection by chemical agencies andhot water. J. Hyg. 10:237-286.
8. Clark, C. W., L. 0. Witter, and Z. J. Ordal. 1966. Thermal injuryand recovery of Streptococcus faecalis. AppI. Microbiol. 16:1764-1769.
9. Dabbah, R., W. A. Moats, and F. J. Mattick. 1969. Factors affectingresistance to heat and recovery of heat-injured bacteria. J. DairySci. 52:608-614.
10. Eikjmann, C. 1912. Untersuchungen uber die Reaktions Geschwindig-keit der Microorganismen. Folia Microbiol. 1:359-376.
11. Foster, E. M., F. E. Nelson, M. L. Speck, R. N. Doetsch, and J. C.Olson, Jr. 1957. Dairy microbiology. Prentice-Hall, EnglewoodCliffs, N.J.
12. Heather, C. D., and W. C. Vanderzant. 1957. Effect of the platingmedium on the survival of heat-treated cells of Pseudomonasfluorescens. Food Res. 22:164.
13. landolo, J. J., and Z. J. Ordal. 1966. Repair of thermal injury ofStaphylococcus aureus. J. Bacteriol. 91:134-142.
14. Johnson, F. H., H. Eyring, and M. J. Polissar. 1954. The kinetic basisof molecular biology. John Wiley & Sons, Inc., New York.
15. Kaufmann, 0. W., and R. H. Andrews. 1954. The destruction rate ofpsychrophilic bacteria in skim milk. J. Dairy Sci. 37:317-327.
16. Kaufmann, 0. W., L. G. Harmon, 0. C. Pailthorp, and 1. J. Pflug.1959. Effect of heat treatment on the growth of surviving cells. J.Bacteriol. 78:834-838.
17. Kiga, M. 1952. Hypothesis of the biological action of radiation. Sci-ence 115:549-550.
18. Laidler, K. J. 1950. Chemical kinetics. McGraw-Hill Book Co., Inc.,New York.
19. Lea, D. E. 1947. Actions of radiations on living cells. Macmillan, NewYork.
20. Madsen, T., and M. Nyman. 1907. Zur Theorie der Desinfection 1.Z. Hyg. 57:388-404.
21. Meynell, G. G., and E. Meynell, 1965. Theory and practice in experi-mental bacteriology. Cambridge University Press, Cambridge, Eng-land.
22. Nelson, F. E. 1943. Factors which influence the growth of heat treatedbacteria. 1. A comparison of four agar media. J. Bacteriol. 45:395.
23. Nelson, F. E. 1944. Factors which influence the growth of heat treatedbacteria. 11. Further studies on media. J. Bacteriol. 48:473.
24. Peters, C. C., and W. R. Van Voorhis. 1940. Statistical proceduresand their mathematical basis. McGraw-Hill Book Co., Inc., NewYork, London.
25. Rahn, 0. 1930. The non-logarithmic order of death of some bacteria.J. Gen. Physiol. 13:395-407.
26. Rahn, 0. 1929. The size of bacteria as the cause of the logarithmicorder of death. J. Gen. Physiol. 13:179-205.
27. Rahn, 0. 1945. Physical methods of sterilization of microorganisms.Bacteriol. Rev. 9:1-47.
28. Reichenbach, H. 1911. Die Absterbeordung der Bakterien und ihreBedeutung fur Theorie und Praxis der Desinfektion. Z. Hyg.69:171-222.
29. Stumbo, C. R. 1965. Thermobacteriology in food processing. Aca-demic Press, Inc., New York.
30. Van Uden, N., P. Abranches, and C. Cabeca-Silva. 1968. Tempera-ture functions of thermal death in yeasts and their relation to themaximum temperature of growth. Arch. Microbiol. 61:381-393.
31. Wood, T. H. 1956. Lethal effects of high and low temperatures on
Unicellular organisms. Advan. Biol. Med. Phys. 4:119-165.32. Yokoya, F., and G. K. York. 1965. Effect of several environmental
conditions on the "thermal death rate" of endospores of aerobic,thermophilic bacteria. Appl. Microbiol. 13:993-999.
33. Zimmer, K. G. 1961. Studies in quantitative radiation biology. Haf-ner, New York.
VOL. 105, 1971 171
on May 30, 2018 by guest
http://jb.asm.org/
Dow
nloaded from


![Growth and Multiplication of Bacteria - · PDF fileGrowth and Multiplication of Bacteria . 2 There are four phases of bacterial growth [and death]: the lag phase ... Streptococci require](https://img.pdfslide.net/doc/110x75/5abc3d477f8b9af27d8db9d4/growth-and-multiplication-of-bacteria-and-multiplication-of-bacteria-2-there.jpg)