Embed Size (px)
Citation preview

KKR & Co. Inc. ReportsThird Quarter 2021 Financial Results
November 2, 2021

1
New York, November 2, 2021 – KKR & Co. Inc. (NYSE: KKR) today reported its third quarter 2021 results.
Conference CallA conference call to discuss KKR's financial results will be held on November 2, 2021 at 10:00 a.m. ET. The conference call may be accessed by dialing +1 (877) 407-0312 (U.S. callers) or +1 (201) 389-0899 (non-U.S. callers); a pass code is not required. Additionally, the conference call will be broadcast live over the Internet and may be accessed through the Investor Center section of KKR's website at https://ir.kkr.com/events-presentations/. A replay of the live broadcast will be available on KKR's website beginning approximately one hour after the live broadcast ends.
About KKRKKR is a leading global investment firm that offers alternative asset management and capital markets and insurance solutions. KKR aims to generate attractive investment returns by following a patient and disciplined investment approach, employing world-class people, and supporting growth in its portfolio companies and communities. KKR sponsors investment funds that invest in private equity, credit and real assets and has strategic partners that manage hedge funds. KKR’s insurance subsidiaries offer retirement, life and reinsurance products under the management of The Global Atlantic Financial Group. References to KKR’s investments may include the activities of its sponsored funds and insurance subsidiaries. For additional information about KKR & Co. Inc. (NYSE: KKR), please visit KKR's website at www.kkr.com and on Twitter @KKR_Co.
“This was an exceptional quarter for KKR. We are delivering differentiated investment performance on behalf of our clients and are experiencing a continued acceleration across our key operating metrics and our financial results. We were delighted last month to announce the appointment of Joe Bae and Scott Nuttall to Co-Chief Executive Officers of KKR. Joe and Scott have played a significant role in shaping the firm’s market leading businesses and its culture into what they are today. Momentum across the firm remains high and we have never felt better about how KKR is positioned for the future.”
Henry R. Kravis and George R. RobertsCo-Executive Chairmen
KKR Reports Third Quarter 2021 Financial Results

2
Legal DisclosuresThis presentation has been prepared by KKR & Co. Inc. solely for informational purposes for its public stockholders in connection with evaluating the business, operations and financial results of KKR & Co. Inc. and its subsidiaries (collectively, “KKR”), which includes The Global Atlantic Financial Group LLC and its subsidiaries (collectively, “Global Atlantic”) as of February 1, 2021. This presentation is not and shall not be construed as an offer to purchase or sell, or the solicitation of an offer to purchase or sell any securities of KKR & Co. Inc. This presentation may not be distributed, referenced, quoted or linked by website, in whole or in part, except as agreed to in writing by KKR & Co. Inc.
The statements contained in this presentation are made as of the date of this presentation (other than financial figures, which are as of quarter end), unless another time is specified in relation to them, and access to this presentation at any given time shall not give rise to any implication that there has been no change in the facts set forth in this presentation since that date.
This presentation contains certain forward-looking statements pertaining to KKR, including with respect to the investment funds, vehicles and accounts managed by KKR and the insurance companies managed by Global Atlantic. Forward-looking statements relate to expectations, estimates, beliefs, projections, future plans and strategies, anticipated events or trends and similar expressions concerning matters that are not historical facts. You can identify these forward-looking statements by the use of words such as "outlook," "believe," “think,” "expect," "potential," "continue," "may," "should," "seek," "approximately," "predict," "intend," "will," "plan," "estimate,“ "anticipate," the negative version of these words, other comparable words or other statements that do not relate strictly to historical or factual matters. These forward-looking statements are based on KKR’s beliefs, assumptions and expectations, but these beliefs, assumptions and expectations can change as a result of many possible events or factors, not all of which are known to KKR or within its control. Due to various risks and uncertainties, actual events or results may differ materially from those reflected or contemplated in such forward-looking statements. Past performance is no guarantee of future results. All forward-looking statements speak only as of the date of this presentation. KKR does not undertake any obligation to update any forward-looking statements to reflect circumstances or events that occur after the date of this presentation except as required by law. Please see the Appendix for additional important information about forward looking statements, including the assumptions and risks concerning projections and estimates of future performance.
This presentation includes certain non-GAAP financial measures. These non-GAAP measures are in addition to, and not a substitute for, measures of financial performance prepared in accordance with U.S. GAAP and may have important limitations as analytical tools, because they may exclude items that may be significant in understanding and analyzing our financial results. In addition, these measures are defined or calculated differently by different companies in our industry and, accordingly, investors should use caution when considering the measures used in this presentation compared to similarly titled measures of other companies. Please see the Appendix for additional important information about the non-GAAP measures presented herein and a reconciliation of non-GAAP measures to comparable GAAP measures.
Please see the Appendix for other important information. In addition, information about factors affecting KKR, including a description of risks that should be considered when making a decision to purchase or sell any securities of KKR & Co. Inc., can be found in KKR & Co. Inc.’s Annual Report on Form 10-K for the fiscal year ended December 31, 2020, filed with the SEC on February 19, 2021 and its other filings with the SEC, which are available at www.sec.gov.
Contact InformationInvestor RelationsCraig LarsonPhone: +1 (877) 610-4910 in U.S. / +1 (212) [email protected]
MediaKristi HullerPhone: +1 (212) [email protected]
KKR Reports Third Quarter 2021 Financial Results

KKR & Co. Inc. Third Quarter Earnings

1
• GAAP Net Income Attributable to KKR & Co. Inc. Common Stockholders was $1.1 billion in the quarter. GAAP Stockholders’ Equity Per Outstanding Share of Common Stock was $27.13 at quarter end
Note: All figures in this presentation are as of September 30, 2021, unless otherwise specifically indicated. Results for the nine months ended September 30, 2021 only include the results of Global Atlantic for the eight months beginning on February 1, 2021; comparability to prior and future periods may be limited. See Appendix for GAAP income statement and GAAP balance sheet. Totals may not add due to rounding.
($ in thousands, except per share data) 3Q'20 3Q'21 3Q'20 YTD 3Q'21 YTD
Revenues
Asset Management $ 1,895,238 $ 2,245,635 $ 2,225,727 $ 7,624,512
Insurance — 2,237,730 — 4,558,040
Total Revenues $ 1,895,238 $ 4,483,365 $ 2,225,727 $ 12,182,552
Expenses
Asset Management 1,093,699 1,234,252 1,754,075 4,078,616
Insurance — 1,950,990 — 4,194,883
Total Expenses $ 1,093,699 $ 3,185,242 $ 1,754,075 $ 8,273,499
Total Investment Income (Loss) - Asset Management $ 2,532,137 $ 2,362,804 $ 430,821 $ 8,712,521
Income Tax Expense (Benefit) 359,375 379,282 204,960 1,161,688
Redeemable Noncontrolling Interests — 1,519 — 2,856
Noncontrolling Interests 1,909,458 2,123,569 206,225 7,315,362
Preferred Stock Dividends 8,341 25,203 25,023 88,397
Net Income - KKR Common Stockholders $ 1,056,502 $ — $ 1,131,354 $ 466,265 $ 4,053,271
Net Income (Loss) Attributable to KKR & Co. Inc. Per Share of Common Stock
Basic $ 1.86 $ 1.94 $ 0.82 $ 6.98
Diluted $ 1.79 $ 1.80 $ 0.80 $ 6.52
Weighted Average Shares of Common Stock Outstanding
Basic 562,425,576 583,030,506 560,124,947 580,742,033
Diluted 589,116,387 637,416,100 569,910,981 629,620,055
4Q'20 3Q'21
KKR & Co. Inc. Stockholders' Equity Per Outstanding Share of Common Stock $ 21.15 $ 27.13
KKR’s Third Quarter 2021 GAAP Results (Unaudited)

2
Note: LTM refers to last twelve months. See the Appendix for GAAP reconciliations and other important information. See page 24 for record and payment dates for common and preferred stock.
Financial Measures
• Fee Related Earnings (“FRE”) of $530 million ($0.60/adj. share) in the quarter, up 63% year-over-year • FRE was $1.8 billion in the LTM ($2.02/adj. share), up 59% year-over-year
• After-tax Distributable Earnings (“DE”) of $925 million ($1.05/adj. share) in the quarter, up 104% year-over-year• DE was $3.1 billion in the LTM ($3.47/adj. share), up 85% year-over-year
• Book Value Per Adjusted Share (“BVPS”) of $28.06 at quarter end including $18.53 per adjusted share of Net Cash and Investments
Capital Metrics
• Assets Under Management (“AUM”) of $459 billion, up 96% year-over-year
• Fee Paying Assets Under Management (“FPAUM”) of $349 billion, up 97% year-over-year
• Uncalled Commitments of $111 billion, up 65% year-over-year
• New Capital Raised of $28 billion in the quarter and $113 billion in the LTM
• Capital Invested of $24 billion in the quarter and $60 billion in the LTM
Corporate
• Regular dividend of $0.145 per share of common stock was declared for the quarter
• Leadership and Governance Update Joe Bae and Scott Nuttall were appointed Co-Chief Executive Officers; Co-Founders Henry Kravis and George Roberts remain actively involved as Co-Executive Chairmen of KKR's Board of Directors. In addition, KKR announced a series of structural and governance changes expected to increase the rights of its common stockholders, further align the interests of KKR's leadership with its common stockholders, enhance corporate governance, and simplify KKR’s corporate structure
KKR’s Third Quarter 2021 Highlights

3Note: See Appendix for GAAP reconciliations, endnotes about taxes affecting After-tax Distributable Earnings and other important information.
($ in thousands, except per share data) 3Q'20 3Q'21 3Q'20 YTD 3Q'21 YTD
Management Fees $ 369,442 $ 559,016 $ 1,042,634 $ 1,478,878
Transaction and Monitoring Fees, Net 201,086 249,670 380,415 645,108
Fee Related Performance Revenues 10,181 9,897 27,869 34,760
Fee Related Compensation (170,220) (184,224) (342,417) (485,760)
Other Operating Expenses (86,472) (104,772) (247,046) (309,483)
Fee Related Earnings $ 324,017 $ 529,587 $ 861,455 $ 1,363,503
Realized Performance Income 224,020 432,784 934,018 1,222,403
Realized Performance Income Compensation (157,885) (274,955) (599,753) (797,965)
Realized Investment Income 260,415 447,565 495,904 1,277,701
Realized Investment Income Compensation (56,803) (67,142) (85,646) (191,663)
Asset Management Segment Operating Earnings 593,764 1,067,839 1,605,978 2,873,979
Insurance Segment Operating Earnings — 114,989 — 305,774
Distributable Operating Earnings 593,764 1,182,828 1,605,978 3,179,753
Interest Expense, Preferred Dividends and Other (65,508) (72,037) (182,499) (218,979)
Income Taxes Paid (75,413) (185,645) (198,763) (449,814)
After-tax Distributable Earnings $ 452,843 $ 925,146 $ 1,224,716 $ 2,510,960
Additional Metrics:
FRE per Adjusted Share $ 0.38 $ 0.60 $ 1.01 $ 1.55
After-tax DE per Adjusted Share $ 0.53 $ 1.05 $ 1.44 $ 2.85
Total Asset Management Segment Revenues $ 1,065,144 $ 1,698,932 $ 2,880,840 $ 4,658,850
Assets Under Management $ 233,808,800 $ 459,081,000 $ 233,808,800 $ 459,081,000
Fee Paying Assets Under Management $ 177,290,200 $ 349,079,000 $ 177,290,200 $ 349,079,000
KKR’s Third Quarter 2021 Segment Earnings

4
Management Fees and Fee Related Earnings
Fee Related Earnings Per Adjusted Share
• Increased by 38% to $1.9 billion in the LTM
• Growth has been driven by record fundraising activity as organic AUM new capital raised over the LTM was $113 billion, compared to $40 billion on an LTM basis one year ago
Management Fees
($ in millions)
• Grew 54% over the LTM comparable period while margins increased from 58% to 63%
• Management fee growth and strong performance in Capital Markets drove the increase in FRE per adjusted share
$1,093
$1,249
$1,442
$1,362
$1,878
2018 2019 2020 LTM3Q'20
LTM3Q'21
58%
61%$1.32
$2.02
58%
63%
FRE per adjusted share FRE margin
LTM 3Q'20 LTM 3Q'21
5
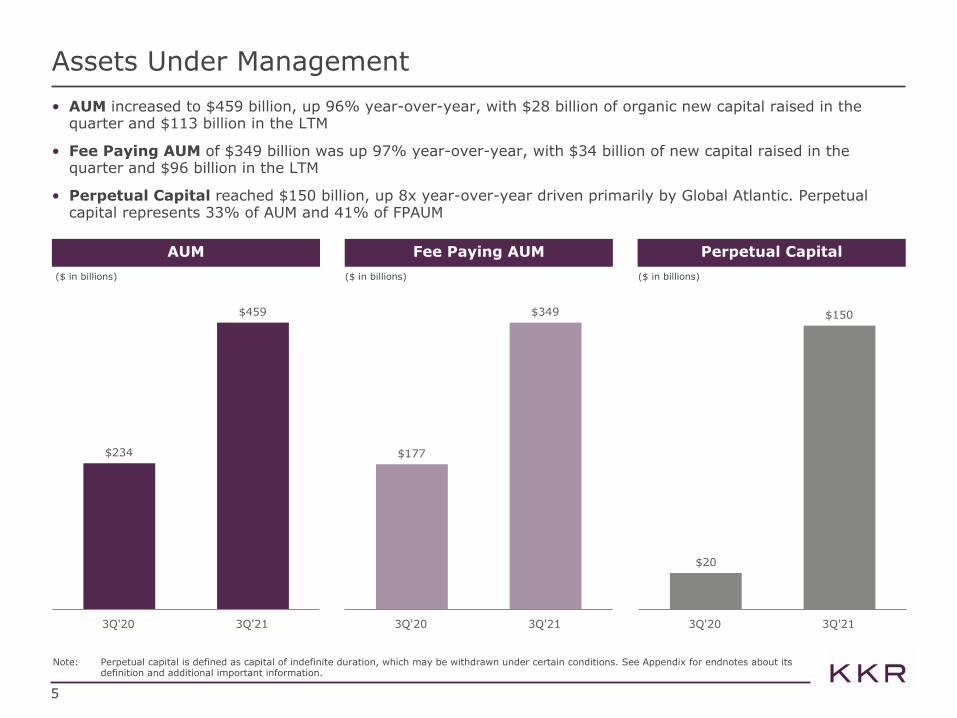
Assets Under Management• AUM increased to $459 billion, up 96% year-over-year, with $28 billion of organic new capital raised in the
quarter and $113 billion in the LTM
• Fee Paying AUM of $349 billion was up 97% year-over-year, with $34 billion of new capital raised in the quarter and $96 billion in the LTM
• Perpetual Capital reached $150 billion, up 8x year-over-year driven primarily by Global Atlantic. Perpetual capital represents 33% of AUM and 41% of FPAUM
AUM Fee Paying AUM Perpetual Capital($ in billions) ($ in billions) ($ in billions)
Note: Perpetual capital is defined as capital of indefinite duration, which may be withdrawn under certain conditions. See Appendix for endnotes about its definition and additional important information.
$234
$459
3Q'20 3Q'21
$177
$349
3Q'20 3Q'21
$20
$150
3Q'20 3Q'21

6
Additional Capital Detail
Uncalled Commitments($ in billions)
• Dry Powder: Uncalled commitments of $111 billion are diversified across the firm’s strategies and are up 65% year-over-year
• AUM Not Yet Paying Fees: At quarter end, there was $38 billion of committed capital with a weighted average management fee rate of over 100bps that becomes payable when the capital is invested or enters its investment period, up 91% year-over-year
• Carry Eligible AUM: Of the $243 billion of carried interest eligible AUM, $161 billion or 66% is above cost and accruing carry
• Performance Fee Eligible AUM: $296 billion, up 53% year-over-year
Note: See Appendix for endnotes for additional information.
$67
$111
3Q'20 3Q'21
Total Performance Fee Eligible AUM($ in billions)
$193
$296
3Q'20 3Q'21

7
QTD
19%
79%
Private Equity
Real Assets
Private Equity Flagship Funds
Opportunistic Real Estate Portfolio
Infrastructure Portfolio
Credit
Alternative Credit Composite
• Strong unrealized appreciation across strategies led to a 11% increase in gross unrealized carried interest to $8.5 billion quarter-over-quarter
Private Equity Portfolio
LTM
Gross Return
11%
4%
52%9%
26%2%
29%14%
Note: Private equity for this presentation excludes growth equity (including impact) and core investments, except where the context otherwise requires. See Appendix for endnotes explaining composition of the portfolios, funds and composites presented on this page and for other important information. Past performance is no guarantee of future results.
Leveraged Credit Composite 11%1%
Fund Investment Performance

Segment Detail

9
Asset Management Segment − Private Markets• AUM: Increased 6% quarter-over-quarter and 82% year-over-year to $248 billion with new capital raised of
$11 billion in the quarter and $70 billion YTD• Fundraising across the Real Estate platform contributed 40% of new capital raised in 3Q• Real Estate Partners Americas III's final close brought the total fund size to over $4 billion
• Realizations: Carried Interest in 3Q driven by the exits of Bountiful, Ingersoll Rand and Academy Sports• Capital Invested: $15 billion in the quarter and $27 billion YTD. In 3Q, capital invested across our
Infrastructure and Real Estate platforms exceeded $8 billion • Appreciation: Driven by strong performance in both public and private holdings, the Private Equity portfolio
appreciated 52% in the LTM, with the Private Equity flagship funds up 79%
($ in thousands) 3Q'20 3Q'21 3Q'20 YTD 3Q'21 YTD
Management Fees $ 250,124 $ 385,692 $ 696,076 $ 990,956
Transaction Fees 133,943 207,604 236,289 376,622
Monitoring Fees 28,824 29,823 86,875 98,164
Fee Credits (120,201) (188,216) (232,691) (365,447)
Fee Related Performance Revenues 701 1,568 2,723 4,821
Fee Related Revenues $ 293,391 $ 436,471 $ 789,272 $ 1,105,116
Carried Interest $ 217,978 $ 413,114 $ 889,334 $ 1,168,490
Incentive Fees — — — 1,276
Realized Performance Income $ 217,978 $ 413,114 $ 889,334 $ 1,169,766
Operating Metrics:
Assets Under Management $ 135,758,500 $ 247,582,000 $ 135,758,500 $ 247,582,000
Fee Paying Assets Under Management $ 90,351,000 $ 148,060,000 $ 90,351,000 $ 148,060,000
Capital Invested $ 6,232,000 $ 14,737,000 $ 13,172,000 $ 26,985,000
Uncalled Commitments $ 56,202,000 $ 101,281,000 $ 56,202,000 $ 101,281,000
10
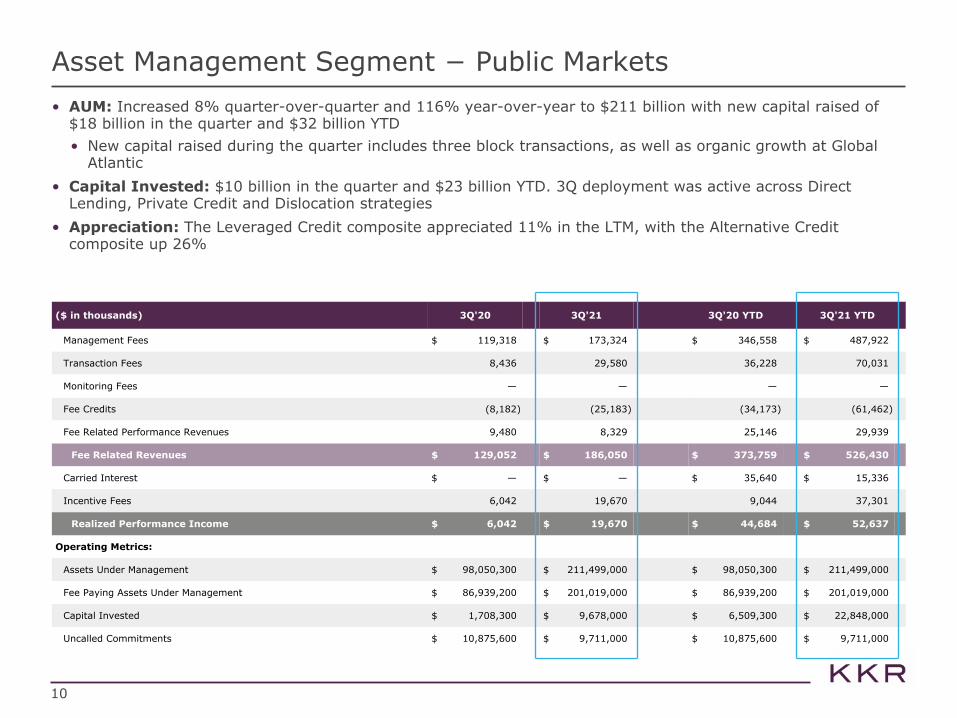
• AUM: Increased 8% quarter-over-quarter and 116% year-over-year to $211 billion with new capital raised of $18 billion in the quarter and $32 billion YTD• New capital raised during the quarter includes three block transactions, as well as organic growth at Global
Atlantic• Capital Invested: $10 billion in the quarter and $23 billion YTD. 3Q deployment was active across Direct
Lending, Private Credit and Dislocation strategies• Appreciation: The Leveraged Credit composite appreciated 11% in the LTM, with the Alternative Credit
composite up 26%
Asset Management Segment − Public Markets
($ in thousands) 3Q'20 3Q'21 3Q'20 YTD 3Q'21 YTD
Management Fees $ 119,318 $ 173,324 $ 346,558 $ 487,922
Transaction Fees 8,436 29,580 36,228 70,031
Monitoring Fees — — — —
Fee Credits (8,182) (25,183) (34,173) (61,462)
Fee Related Performance Revenues 9,480 8,329 25,146 29,939
Fee Related Revenues $ 129,052 $ 186,050 $ 373,759 $ 526,430
Carried Interest $ — $ — $ 35,640 $ 15,336
Incentive Fees 6,042 19,670 9,044 37,301
Realized Performance Income $ 6,042 $ 19,670 $ 44,684 $ 52,637
Operating Metrics:
Assets Under Management $ 98,050,300 $ 211,499,000 $ 98,050,300 $ 211,499,000
Fee Paying Assets Under Management $ 86,939,200 $ 201,019,000 $ 86,939,200 $ 201,019,000
Capital Invested $ 1,708,300 $ 9,678,000 $ 6,509,300 $ 22,848,000
Uncalled Commitments $ 10,875,600 $ 9,711,000 $ 10,875,600 $ 9,711,000

11
• Transaction Fees: Totaled $196 million in the quarter and $527 million YTD• Q3 fees were diversified by transaction type
• 68% came from debt transactions• Private Equity, Core PE and Infrastructure were the largest fee generating strategies • Fees paid by third parties generated 23% of total transaction fees
Asset Management Segment − Capital Markets
• Realizations: Realized Investment Income of $448 million in the quarter and $1,278 million YTD• Realizations in the quarter primarily driven by the exits of Mr. Cooper, Bountiful and Flutter
• Balance Sheet Investment Return: Strong performance of balance sheet investments, up 6% in the quarter and 28% YTD
• Embedded Gains: $7.1 billion of embedded gains on the balance sheet at quarter end
Asset Management Segment − Principal Activities
($ in thousands) 3Q'20 3Q'21 3Q'20 YTD 3Q'21 YTD
Transaction Fees $ 158,266 $ 196,062 $ 287,887 $ 527,200
($ in thousands) 3Q'20 3Q'21 3Q'20 YTD 3Q'21 YTD
Net Realized Gains (Losses) $ 172,224 $ 389,837 $ 215,430 $ 1,026,310
Interest Income and Dividends 88,191 57,728 280,474 251,391
Realized Investment Income $ 260,415 $ 447,565 $ 495,904 $ 1,277,701

12
Note: KKR’s 3Q’21 YTD results only include the results of Global Atlantic for the eight months beginning on February 1, 2021; comparability to prior and future periods may be limited. See Appendix for endnotes explaining certain terms. 3Q'21 and 3Q'21 YTD Net Investment Income includes $51 million and $99 million, respectively, of realized gains and losses not related to asset/liability matching investments strategies.
• Net Investment Income: Net Investment Income of $772 million in the quarter was driven primarily by income from assets under management, and variable investment income derived from net realized gains on the sale of equity investments• Growth in assets under management was primarily driven by three block reinsurance transactions totaling $14
billion
• Net Cost of Insurance: Net Cost of Insurance totaled $436 million in the quarter, driven primarily by stable liability performance across in-force and new business, and favorable assumption review results
Insurance Segment
($ in thousands) 3Q'20 3Q'21 3Q'20 YTD 3Q'21 YTD
Net Investment Income $ — $ 771,982 $ — $ 1,977,383
Net Cost of Insurance — (436,415) — (1,076,566)
General, Administrative and Other — (139,489) — (338,325)
Pre-tax Insurance Operating Earnings — 196,078 — 562,492
Income Taxes — (9,046) — (63,148)
Net Income Attributable to Noncontrolling Interests — (72,043) — (193,570)
Insurance Segment Operating Earnings $ — $ 114,989 $ — $ 305,774
Additional Metrics:
Global Atlantic Book Value — 3,260,464 — 3,260,464

13
• Book Value Per Adjusted Share: Increased 38% year-over-year and 22% since 4Q’20 driven primarily by strong investment performance• Net cash and investments of $18.53 per adjusted share at quarter end, compared to $14.75 at 3Q'20
• Cash and Investments: $22 billion at quarter end
• Global Atlantic Book Value: Reflects our ~61% economic ownership
Book Value
Book Value Per Adjusted Share
Note: See Appendix for GAAP reconciliations, endnotes and other important information. Tax liabilities, net has been amended this quarter to include the recognition of deferred tax liabilities relating to certain assets of KKR Group Partnership L.P. that is expected to occur upon the completion of the mergers contemplated by the previously announced Reorganization Agreement.
($ in millions, except per share data) 4Q'20 3Q'21
(+) Cash and Short-term Investments $ 5,961 $ 4,863
(+) Investments 14,992 17,550
(+) Net Unrealized Carried Interest 2,626 4,866
(+) Other Assets 4,199 4,575
(+) Global Atlantic Book Value — 3,260
(-) Debt Obligations - KKR 4,688 5,118
(-) Debt Obligations - KFN 949 949
(-) Tax Liabilities, Net 486 2,831
(-) Other Liabilities 858 1,433
(-) Noncontrolling Interests 30 29
(-) Preferred Stock 500 —
Book Value $ 20,267 $ 24,754
Book Value Per Adjusted Share $ 23.09 $ 28.06
$12.15$14.20
$15.57
$19.24
$23.09
$20.26
$28.06
4Q'16 4Q'17 4Q'18 4Q'19 4Q'20 3Q'20 3Q'21

14
Investments Detail
Investment Holdings by Asset Class
Note: Investments is a term used solely for purposes of financial presentation of a portion of KKR’s balance sheet. See Appendix for endnotes and other important information.
($ in millions) 3Q'21
Investments Fair Value
Private Equity $ 4,591
Core Private Equity 4,848
Growth 1,417
Private Equity, Core & Growth Total 10,856
Energy 898
Real Estate 1,767
Infrastructure 742
Real Assets Total 3,408
Leveraged Credit 998
Alternative Credit 847
Credit Total 1,845
Other 1,441
Total Investments $ 17,550
($ in millions) 3Q'21
Significant Investments Fair Value Fair Value as % of Total Investments
PetVet Care Centers, LLC $ 1,094 6%
USI, Inc. 1,094 6%
Fiserv, Inc. 992 6%
Heartland Dental, LLC 770 4%
BridgeBio Pharma, Inc. 562 3%
Top Significant Investments 4,512 26%
Other Investments 13,038 74%
Total Investments $ 17,550 100%
Private Equity26%
Core Private Equity28%
Growth8%
Energy5%
Real Estate10%
Infrastructure4%
Leveraged Credit6% Alternative Credit
5%Other8%

Capital Detail

16
Strategic Investor Partnership and Perpetual Capital
Strategic Partnership & Perpetual Capital($ in billions)
Duration of Capital
45% of AUM is perpetual capital or
long-dated
Note: Perpetual capital is defined as capital of indefinite duration, which may be withdrawn under certain conditions. See Appendix for endnotes about its definition and other important information.
$10 $11
$27
$42$49
$55
$205
$21 $23 $27 $33
$55
$5 $5
$6$18
$22$22
$30
$120
2015 2016 2017 2018 2019 2020 3Q'21
89% of AUM with a duration of at least
8+ years at inception
Perpetual CapitalLong-Dated Strategic Investor Partnerships8+ Year Duration at InceptionCapital Subject to Periodic Redemption
Long-Dated Strategic Investor PartnershipsPerpetual CapitalGlobal Atlantic (Perpetual)
33%
12%
44%
11%

17
Nine Months Ended September 30, 2021
($ in millions) Private Markets Public Markets Total
Beginning Balance $ 148,689 $ 102,990 $ 251,679
New Capital Raised 69,932 31,767 101,698
Acquisition of Global Atlantic(2) 12,012 85,491 97,503
Distributions and Other(3) (14,218) (14,916) (29,134)
Change in Value 31,167 6,168 37,334
Ending Balance $ 247,582 $ 211,499 $ 459,081
Assets Under Management Rollforward
(1) Includes $1,646 million of redemptions by fund investors in Public Markets.(2) Reflects the AUM of Global Atlantic at February 1, 2021.(3) Includes $7,114 million of redemptions by fund investors in Public Markets.
Three Months Ended September 30, 2021
($ in millions) Private Markets Public Markets Total
Beginning Balance $ 233,575 $ 195,372 $ 428,947
New Capital Raised 10,616 17,655 28,271
Distributions and Other(1) (5,411) (3,817) (9,228)
Change in Value 8,802 2,289 11,091
Ending Balance $ 247,582 $ 211,499 $ 459,081

18
Fee Paying Assets Under Management Rollforward
(1) Includes $1,646 million of redemptions by fund investors in Public Markets.(2) Reflects the FPAUM of Global Atlantic at February 1, 2021.(3) Includes net changes in fee base of certain Private Markets funds of $5,398 million. Includes $5,515 million of redemptions by fund investors in Public
Markets.
Three Months Ended September 30, 2021
($ in millions) Private Markets Public Markets Total
Beginning Balance $ 134,936 $ 184,408 $ 319,344
New Capital Raised 15,008 19,096 34,104
Distributions and Other(1) (1,924) (4,473) (6,397)
Change in Value 39 1,988 2,028
Ending Balance $ 148,060 $ 201,019 $ 349,079
Nine Months Ended September 30, 2021
($ in millions) Private Markets Public Markets Total
Beginning Balance $ 94,196 $ 92,021 $ 186,217
New Capital Raised 52,442 33,572 86,014
Acquisition of Global Atlantic(2) 12,012 85,491 97,503
Distributions and Other(3) (11,057) (14,619) (25,676)
Change in Value 467 4,554 5,021
Ending Balance $ 148,060 $ 201,019 $ 349,079

Supplemental Information

20
Investment Vehicle Summary
(1) The “Invested” and “Realized” columns do not include the amounts of any realized investments that restored the unused capital commitments of the fund investors, if any.
($ in millions)
Investment Period Amount
Start Date
End Date Commitment Uncalled
Commitments
Percentage Committed by General
Partner
Invested Realized Remaining Cost
Remaining Fair Value
PRIVATE MARKETS BUSINESS LINE
Private Equity and Growth Funds
North America Fund XIII 6/2021 6/2027 $ 16,788 $ 16,788 7% $ — $ — $ — $ —
Americas Fund XII 1/2017 6/2021 13,500 3,959 6% 10,016 3,432 8,910 21,859
North America Fund XI 9/2012 1/2017 8,718 432 3% 9,733 15,529 3,747 8,373
2006 Fund(1) 9/2006 9/2012 17,642 247 2% 17,309 34,287 1,825 3,280
Millennium Fund(1) 12/2002 12/2008 6,000 — 3% 6,000 14,123 — 6
European Fund V 3/2019 7/2025 6,398 2,695 2% 3,772 350 3,585 5,054
European Fund IV 12/2014 3/2019 3,517 67 6% 3,577 3,407 2,279 4,257
European Fund III(1) 3/2008 3/2014 5,513 153 5% 5,360 10,602 253 235
European Fund II(1) 11/2005 10/2008 5,751 — 2% 5,751 8,507 — 34
Asian Fund IV 7/2020 7/2026 14,735 12,630 7% 2,105 — 2,105 2,382
Asian Fund III 4/2017 7/2020 9,000 2,332 6% 7,059 1,778 6,586 14,565
Asian Fund II 4/2013 4/2017 5,825 34 1% 6,839 5,680 3,184 5,017
Asian Fund(1) 7/2007 4/2013 3,983 — 3% 3,974 8,723 17 30
China Growth Fund(1) 11/2010 11/2016 1,010 — 1% 1,010 1,056 330 242
Next Generation Technology Growth Fund II 12/2019 12/2025 2,088 898 7% 1,272 82 1,242 2,262
Next Generation Technology Growth Fund 3/2016 12/2019 659 4 22% 663 652 375 1,854
Health Care Strategic Growth Fund II 5/2021 5/2027 3,744 3,744 7% — — — —
Health Care Strategic Growth Fund 12/2016 5/2021 1,331 565 11% 896 196 791 1,352
Global Impact Fund 2/2019 2/2025 1,242 416 8% 904 77 851 1,263
Private Equity and Growth Funds 127,444 44,964 86,240 108,481 36,080 72,065
Co-Investment Vehicles and Other Various Various 12,470 3,874 Various 8,979 6,791 5,865 8,951
Core Investment Vehicles Various Various 23,384 12,865 32% 10,519 31 10,519 16,944
Total Private Equity, Growth, Core and Other 163,298 61,703 105,738 115,303 52,464 97,960
21
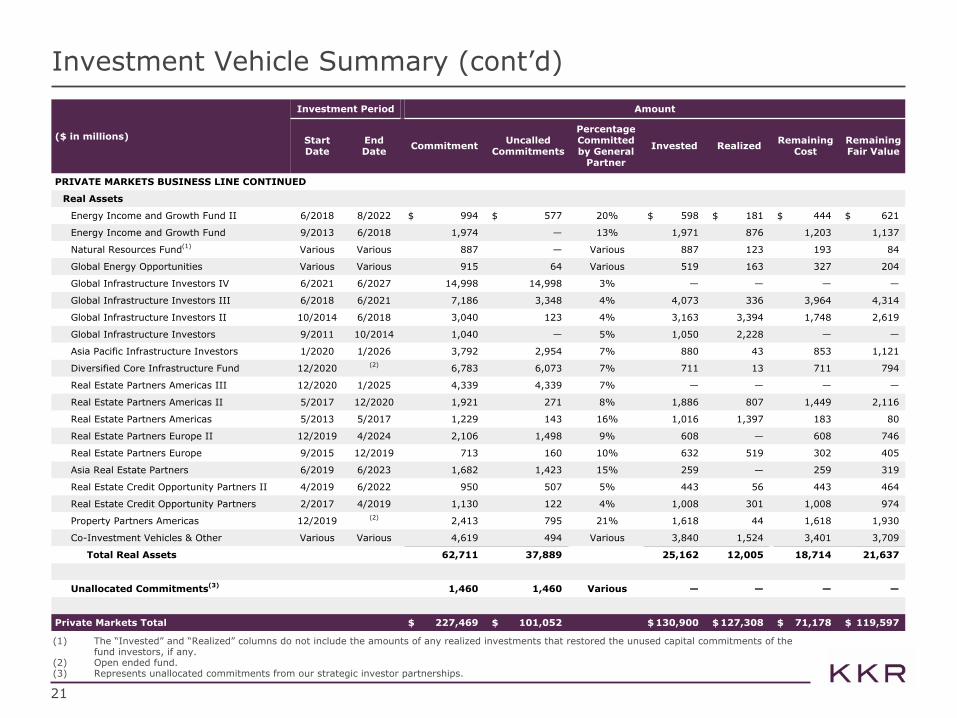
Investment Vehicle Summary (cont’d)
(1) The “Invested” and “Realized” columns do not include the amounts of any realized investments that restored the unused capital commitments of the fund investors, if any.
(2) Open ended fund.(3) Represents unallocated commitments from our strategic investor partnerships.
($ in millions)
Investment Period Amount
Start Date
End Date Commitment Uncalled
Commitments
Percentage Committed by General
Partner
Invested Realized Remaining Cost
Remaining Fair Value
PRIVATE MARKETS BUSINESS LINE CONTINUED
Real Assets
Energy Income and Growth Fund II 6/2018 8/2022 $ 994 $ 577 20% $ 598 $ 181 $ 444 $ 621
Energy Income and Growth Fund 9/2013 6/2018 1,974 — 13% 1,971 876 1,203 1,137
Natural Resources Fund(1) Various Various 887 — Various 887 123 193 84
Global Energy Opportunities Various Various 915 64 Various 519 163 327 204
Global Infrastructure Investors IV 6/2021 6/2027 14,998 14,998 3% — — — —
Global Infrastructure Investors III 6/2018 6/2021 7,186 3,348 4% 4,073 336 3,964 4,314
Global Infrastructure Investors II 10/2014 6/2018 3,040 123 4% 3,163 3,394 1,748 2,619
Global Infrastructure Investors 9/2011 10/2014 1,040 — 5% 1,050 2,228 — —
Asia Pacific Infrastructure Investors 1/2020 1/2026 3,792 2,954 7% 880 43 853 1,121
Diversified Core Infrastructure Fund 12/2020 (2) 6,783 6,073 7% 711 13 711 794
Real Estate Partners Americas III 12/2020 1/2025 4,339 4,339 7% — — — —
Real Estate Partners Americas II 5/2017 12/2020 1,921 271 8% 1,886 807 1,449 2,116
Real Estate Partners Americas 5/2013 5/2017 1,229 143 16% 1,016 1,397 183 80
Real Estate Partners Europe II 12/2019 4/2024 2,106 1,498 9% 608 — 608 746
Real Estate Partners Europe 9/2015 12/2019 713 160 10% 632 519 302 405
Asia Real Estate Partners 6/2019 6/2023 1,682 1,423 15% 259 — 259 319
Real Estate Credit Opportunity Partners II 4/2019 6/2022 950 507 5% 443 56 443 464
Real Estate Credit Opportunity Partners 2/2017 4/2019 1,130 122 4% 1,008 301 1,008 974
Property Partners Americas 12/2019 (2) 2,413 795 21% 1,618 44 1,618 1,930
Co-Investment Vehicles & Other Various Various 4,619 494 Various 3,840 1,524 3,401 3,709
Total Real Assets 62,711 37,889 25,162 12,005 18,714 21,637
Unallocated Commitments(3) 1,460 1,460 Various — — — —
Private Markets Total $ 227,469 $ 101,052 $ 130,900 $ 127,308 $ 71,178 $ 119,597

22
Investment Vehicle Summary (cont’d) & Additional AUM Detail
(1) The "Commitment" and "Uncalled Commitments" columns include income that is eligible to be reinvested if permitted under the terms of the investment vehicle agreements.
($ in millions)
Investment Period Amount
Start Date
End Date Commitment Uncalled
Commitments
Percentage Committed by General
Partner
Invested Realized Remaining Cost
Remaining Fair Value
PUBLIC MARKETS BUSINESS LINE(1)
Alternative Credit
Dislocation Opportunities Fund 5/2020 11/2021 $ 2,910 $ 1,395 14% $ 1,515 $ 119 $ 1,514 $ 1,704
Special Situations Fund II 2/2015 3/2019 3,525 284 9% 3,241 1,333 2,182 2,690
Special Situations Fund 1/2013 1/2016 2,274 1 12% 2,273 1,598 887 606
Mezzanine Partners 7/2010 3/2015 1,023 33 4% 990 1,097 324 245
Private Credit Opportunities Partners II 12/2015 12/2020 2,245 762 2% 1,483 546 1,205 1,295
Lending Partners III 4/2017 11/2021 1,498 757 2% 741 264 741 810
Lending Partners II 6/2014 6/2017 1,336 157 4% 1,179 1,143 355 179
Lending Partners 12/2011 12/2014 460 41 15% 419 451 86 21
Lending Partners Europe II 6/2019 9/2023 837 491 7% 346 34 346 383
Lending Partners Europe 3/2015 3/2019 848 184 5% 664 354 332 302
16,956 4,105 12,851 6,939 7,972 8,235
Other Alternative Credit Vehicles Various Various 11,744 5,596 Various 6,147 4,292 3,767 4,097
Public Markets Total $ 28,700 $ 9,701 $ 18,998 $ 11,231 $ 11,739 $ 12,332
Total Eligible To Receive Carried Interest $ 256,169 $ 110,753 $ 149,898 $ 138,539 $ 82,917 $ 131,929
($ in millions) Uncalled Commitments Remaining Fair Value Total
Carried Interest Eligible $ 110,753 $ 131,929 $ 242,682 Incentive Fee Eligible — 52,874 52,874
Total Performance Fee Eligible 110,753 184,803 295,556 Private Markets 229 22,606 22,835 Credit 10 138,926 138,936 Hedge Fund Partnerships — 1,754 1,754
Total Assets Under Management $ 110,992 $ 348,089 $ 459,081

23
Stock Summary
(1) KKR & Co. Inc.'s initial repurchase authorization was announced on October 27, 2015. Information is through October 29, 2021.(2) Refers to the retirement of equity awards issued pursuant to KKR & Co. Inc.’s equity incentive plans.(3) Shares that may be issued by KKR & Co. Inc. upon exchange of KKR Holdings units and other securities that are exchangeable for KKR common stock.(4) Assumes that all shares of Series C Mandatory Convertible Preferred Stock have been converted to shares of KKR & Co. Inc. common stock for the
periods presented.(5) Amounts exclude unvested shares granted under the equity incentive plans.
From December 31, 2020 through October 29, 2021, KKR used a total of approximately $302 million to repurchase 2.7 million shares in the open market and to retire equity awards representing 3.4 million shares that otherwise would have been issued to participants under KKR’s equity incentive plans. During this period, open market purchases and retirements were made at an average cost of $50.12 per share.
Common Stock Repurchase Activity
(Amounts in millions, except per share amounts) Inception to Date(1)
Open Market Share Repurchases 55.0
Reduction of Shares for Retired Equity Awards(2) 22.5
Total Repurchased Shares and Retired Equity Awards 77.5
Total Capital Used $1,659
Average Price Paid Per Share $21.42
Remaining Availability under Current Share Repurchase Plan $160
Adjusted Shares 4Q'20 1Q'21 2Q'21 3Q'21
Common Stock 572,893,738 578,269,039 583,030,973 583,026,679
KKR Holdings Units and Other Exchangeable Securities(3) 275,626,493 274,590,201 272,250,240 272,250,240
Common Stock - Series C Mandatory Convertible Preferred Stock(4) 29,092,933 26,822,600 26,822,600 26,822,600
Adjusted Shares(5) 877,613,164 879,681,840 882,103,813 882,099,519

24
DividendsThe declaration and payment of any future dividends on preferred or common stock will be subject to the discretion of the board of directors of KKR & Co. Inc. based on a number of factors, including KKR’s future financial performance and other considerations that the board deems relevant, the terms of KKR & Co. Inc.'s certificate of incorporation and applicable law. There can be no assurance that future dividends will be made as intended or at all or that any particular dividend policy for common stock will be maintained.
Common Stock
A dividend of $0.145 per share of common stock has been declared for the third quarter of 2021, which will be paid on November 30, 2021 to holders of record of common stock as of the close of business on November 15, 2021.
Series C Mandatory Convertible Preferred Stock
A dividend of $0.75 per share of Series C Mandatory Convertible Preferred Stock has been declared and set aside for payment on December 15, 2021 to holders of record of Series C Mandatory Convertible Preferred Stock as of the close of business on December 1, 2021.
Joe Bae and Scott Nuttall were appointed Co-Chief Executive Officers; Co-Founders Henry Kravis and George Roberts remain actively involved as Co-Executive Chairmen of KKR's Board of Directors. In addition, KKR announced a series of structural and governance changes expected to increase the rights of its common stockholders, further align the interests of KKR's leadership with its common stockholders, enhance corporate governance, and simplify KKR’s corporate structure. For additional information, please see the Current Report on Form 8-K filed by KKR & Co. Inc. on October 12, 2021.
Other Corporate Information

Appendix

26
GAAP Condensed Consolidated Income Statement (Unaudited)($ in thousands) 3Q'20 3Q'21 3Q'20 YTD 3Q'21 YTD
RevenuesAsset Management
Fees and Other $ 563,340 $ 718,968 $ 1,337,385 $ 1,887,805 Capital Allocation-Based Income (Loss) 1,331,898 1,526,667 888,342 5,736,707
1,895,238 2,245,635 2,225,727 7,624,512 Insurance
Net Premiums — 974,903 — 1,698,912 Policy Fees — 310,381 — 824,326 Net Investment Income — 758,381 — 1,919,659 Net Investment Gains (Losses) — 162,127 — 32,983 Other Income — 31,938 — 82,160
— 2,237,730 — 4,558,040 Total Revenues $ 1,895,238 $ 4,483,365 $ 2,225,727 $ 12,182,552
ExpensesAsset Management
Compensation and Benefits 882,339 1,012,837 1,211,526 3,419,057 Occupancy and Related Charges 17,321 17,438 51,222 51,289 General, Administrative and Other 194,039 203,977 491,327 608,270
1,093,699 1,234,252 1,754,075 4,078,616 Insurance
Policy Benefits and Claims — 1,697,046 — 3,593,563 Amortization of Policy Acquisition Costs — (16,900) — (57,409) Interest Expense — 22,437 — 44,482 Insurance Expenses — 89,534 — 242,591 General, Administrative and Other — 158,873 — 371,656
— 1,950,990 — 4,194,883 Total Expenses $ 1,093,699 $ 3,185,242 $ 1,754,075 $ 8,273,499
Investment Income (Loss) - Asset ManagementNet Gains (Losses) from Investment Activities 2,284,602 2,116,647 (179,033) 8,032,900 Dividend Income 116,379 121,484 295,047 323,051 Interest Income 354,865 402,839 1,040,052 1,151,548 Interest Expense (223,709) (278,166) (725,245) (794,978)
Total Investment Income (Loss) $ 2,532,137 $ 2,362,804 $ 430,821 $ 8,712,521 Income Tax Expense (Benefit) 359,375 379,282 204,960 1,161,688 Redeemable Noncontrolling Interests — 1,519 — 2,856 Noncontrolling Interests 1,909,458 2,123,569 206,225 7,315,362 Preferred Stock Dividends 8,341 25,203 25,023 88,397
Net Income - KKR Common Stockholders $ 1,056,502 $ 1,131,354 $ 466,265 $ 4,053,271

27
GAAP Condensed Consolidated Balance Sheet (Unaudited)
($ in millions) 4Q'20 3Q'21
AssetsAsset ManagementCash and Cash Equivalents $ 6,508 $ 7,256 Investments 69,275 89,909 Other Assets 4,024 4,198
79,807 101,363 InsuranceCash and Cash Equivalents — 4,717 Investments — 121,215 Other Assets — 38,505
— 164,437
Total Assets $ 79,807 $ 265,800
Liabilities and EquityAsset ManagementDebt Obligations 33,424 38,989 Other Liabilities 5,583 9,214
39,007 48,203 InsuranceDebt Obligations — 2,163 Other Liabilities — 158,377
— 160,540
Total Liabilities $ 39,007 $ 208,743
Redeemable Noncontrolling Interests — 93 Stockholders' Equity
Stockholders' Equity - Series A & B Preferred Stock 483 — Stockholders' Equity - Series C Mandatory Convertible Preferred Stock 1,116 1,116 Stockholders' Equity - Series I and II Preferred Stock, Common Stock 12,118 15,817 Noncontrolling Interests 27,083 40,031
Total Equity $ 40,800 $ 56,964
Total Liabilities and Equity $ 79,807 $ 265,800

28
Reconciliation of GAAP to Non-GAAP Measures (Unaudited)
4Q'20 1Q'21 2Q'21 3Q'21
GAAP Shares of Common Stock Outstanding 572,893,738 578,269,039 583,030,973 583,026,679
Adjustments:
KKR Holdings Units 275,626,493 273,367,712 271,027,751 271,027,751
Other Exchangeable Securities — 1,222,489 1,222,489 1,222,489
Common Stock - Series C Mandatory Convertible Preferred Stock 29,092,933 26,822,600 26,822,600 26,822,600
Adjusted Shares 877,613,164 879,681,840 882,103,813 882,099,519
Unvested Shares of Common Stock and Other Exchangeable Securities 23,892,201 26,687,308 30,110,513 36,140,502
3Q'20 3Q'21 3Q'20 YTD 3Q'21 YTD
Weighted Average GAAP Shares of Common Stock Outstanding - Basic 562,425,576 583,030,506 560,124,947 580,742,033
Adjustments:
Weighted Average KKR Holdings Units 282,692,900 271,027,751 285,757,397 272,674,225
Weighted Average Other Exchangeable Securities — 1,222,489 — 1,128,451
Weighted Average Common Stock - Series C Mandatory Convertible Preferred Stock 16,736,309 26,822,600 5,619,491 26,822,600
Weighted Average Adjusted Shares 861,854,785 882,103,346 851,501,835 881,367,309

29
Reconciliation of GAAP to Non-GAAP Measures (Unaudited)
(1) Represents equity-based compensation expense in connection with non-dilutive share grants from outstanding but previously unallocated units of KKR Holdings.
($ in thousands) 3Q'20 3Q'21 3Q'20 YTD 3Q'21 YTD 3Q'20 LTM 3Q'21 LTM
Net Income (Loss) Attributable to KKR & Co. Inc. Common Stockholders (GAAP) $ 1,056,502 $ 1,131,354 $ 466,265 $ 4,053,271 $ 981,366 $ 5,532,960
Preferred Stock Dividends 8,341 25,203 25,023 88,397 33,364 119,929
Net Income (Loss) Attributable to Noncontrolling Interests 1,909,458 2,125,088 206,225 7,318,218 996,935 10,227,082
Income Tax Expense (Benefit) 359,375 379,282 204,960 1,161,688 347,586 1,565,825
Income (Loss) Before Tax (GAAP) $ 3,333,676 $ 3,660,927 $ 902,473 $ 12,621,574 $ 2,359,251 $ 17,445,796
Impact of Consolidation and Other (1,206,517) (1,478,384) 191,497 (5,000,537) (152,139) (6,896,773)
Equity-based Compensation - KKR Holdings(1) 21,802 8,764 63,596 35,734 86,432 52,877
Preferred Stock Dividends (8,341) (2,519) (25,023) (19,201) (33,364) (27,542)
Income Taxes Paid (75,413) (185,645) (198,763) (449,814) (251,005) (517,001)
Asset Management Adjustments:
Unrealized Carried Interest (995,376) (911,156) 186,537 (3,872,150) (151,883) (5,129,490)
Net Unrealized Gains (Losses) (1,088,901) (598,304) 18,049 (2,890,326) (484,637) (4,606,115)
Unrealized Carried Interest Compensation 418,728 397,449 (57,771) 1,667,447 83,081 2,192,703
Strategic Corporate Transaction-Related Charges 10,697 7,362 10,697 17,497 10,697 26,873
Equity-based Compensation 40,801 44,488 128,399 138,196 176,610 245,996
Equity-based Compensation - Performance based 1,687 18,022 5,025 50,073 6,712 55,244
Non-Recurring Items — — — — — —
Insurance Adjustments:
Net Gains (Losses) from Investments and Derivatives — (75,241) — 183,842 — 183,842
Strategic Corporate Transaction-Related Charges — 3,931 — 15,947 — 15,947
Equity-based and Other Compensation — 40,086 — 64,061 — 64,061
Amortization of Acquired Intangibles — 4,412 — 11,765 — 11,765
Income Taxes — (9,046) — (63,148) — (63,148)
After-tax Distributable Earnings $ 452,843 $ 925,146 $ 1,224,716 $ 2,510,960 $ 1,649,755 $ 3,055,035
Interest Expense 54,458 63,446 152,676 185,100 197,043 243,461
Preferred Stock Dividends 8,341 2,519 25,023 19,201 33,364 27,542
Net Income Attributable to Noncontrolling Interests 2,709 6,072 4,800 14,678 6,603 17,720
Income Taxes Paid 75,413 185,645 198,763 449,814 251,005 517,001
Distributable Operating Earnings $ 593,764 $ 1,182,828 $ 1,605,978 $ 3,179,753 $ 2,137,770 $ 3,860,759
Insurance Segment Operating Earnings — (114,989) — (305,774) — (305,774)
Realized Performance Income (224,020) (432,784) (934,018) (1,222,403) (1,175,561) (1,454,084)
Realized Performance Income Compensation 157,885 274,955 599,753 797,965 756,385 895,283
Realized Investment Income (260,415) (447,565) (495,904) (1,277,701) (722,374) (1,426,456)
Realized Investment Income Compensation 56,803 67,142 85,646 191,663 122,616 212,847
Fee Related Earnings $ 324,017 $ 529,587 $ 861,455 $ 1,363,503 $ 1,118,836 $ 1,782,575

30
Reconciliation of GAAP to Non-GAAP Measures (Unaudited)
($ in thousands) 3Q'20 3Q'21 3Q'20 YTD 3Q'21 YTD
After-tax Distributable Earnings $ 452,843 $ 925,146 $ 1,224,716 $ 2,510,960
Interest Expense 54,458 63,446 152,676 185,100
Preferred Stock Dividends 8,341 2,519 25,023 19,201
Net Income Attributable to Noncontrolling Interests 2,709 6,072 4,800 14,678
Income Taxes Paid 75,413 185,645 198,763 449,814
Distributable Operating Earnings $ 593,764 $ 1,182,828 $ 1,605,978 $ 3,179,753
Insurance Segment Operating Earnings — (114,989) — (305,774)
Realized Performance Income (224,020) (432,784) (934,018) (1,222,403)
Realized Performance Income Compensation 157,885 274,955 599,753 797,965
Realized Investment Income (260,415) (447,565) (495,904) (1,277,701)
Realized Investment Income Compensation 56,803 67,142 85,646 191,663
Fee Related Earnings $ 324,017 $ 529,587 $ 861,455 $ 1,363,503
Insurance Segment Operating Earnings — 114,989 — 305,774
Realized Performance Income 224,020 432,784 934,018 1,222,403
Realized Performance Income Compensation (157,885) (274,955) (599,753) (797,965)
Realized Investment Income 260,415 447,565 495,904 1,277,701
Realized Investment Income Compensation (56,803) (67,142) (85,646) (191,663)
Depreciation and Amortization 4,568 6,064 14,189 18,257
Adjusted EBITDA $ 598,332 $ 1,188,892 $ 1,620,167 $ 3,198,010

31
Reconciliation of GAAP to Non-GAAP Measures (Unaudited)
($ in thousands) 3Q'20 3Q'21 3Q'20 YTD 3Q'21 YTD
Total GAAP Revenues $ 1,895,238 $ 4,483,365 $ 2,225,727 $ 12,182,552
Insurance GAAP Revenues — (2,237,730) — (4,558,040)
Impact of Consolidation and Other 85,393 132,658 278,898 389,946
Capital Allocation-Based Income (Loss) (GAAP) (1,331,898) (1,526,667) (888,342) (5,736,707)
Realized Carried Interest 217,978 413,114 924,974 1,183,826
Realized Investment Income 260,415 447,565 495,904 1,277,701
Insurance Segment Management Fees — 46,662 — 108,500
Capstone Fees (17,429) (25,178) (55,542) (66,286)
Expense Reimbursements (44,553) (34,857) (100,779) (122,642)
Total Asset Management Segment Revenues $ 1,065,144 $ 1,698,932 $ 2,880,840 $ 4,658,850

32
Reconciliation of GAAP to Non-GAAP Measures (Unaudited)
4Q'16 4Q'17 4Q'18 4Q'19 4Q'20 3Q'20 3Q'21
KKR & Co. Inc. Stockholders' Equity - Series I and II Preferred Stock, Common Stock $ 5,457,279 $ 6,703,382 $ 8,167,056 $ 10,324,936 $ 12,118,472 $ 10,599,310 $ 15,817,178
Series C Mandatory Convertible Preferred Stock — — — — 1,115,792 1,115,792 1,115,792
Impact of Consolidation and Other 101,189 196,742 188,056 310,380 520,710 381,203 (1,058,182)
KKR Holdings and Other Exchangeable Securities 4,389,285 4,844,271 4,625,448 5,728,634 6,512,382 5,692,718 8,665,693
Accumulated Other Comprehensive Income (AOCI) and Other (Insurance) — — — — — — 214,002
Equity Impact of KKR Management Holdings Corp. (151,162) (70,486) — — — — —
Book Value $ 9,796,591 $ 11,673,909 $ 12,980,560 $ 16,363,950 $ 20,267,356 $ 17,789,023 $ 24,754,483
Adjusted Shares 806,137,733 822,146,070 833,938,476 850,388,924 877,613,164 877,876,658 882,099,519
Book Value per Adjusted Share $ 12.15 $ 14.20 $ 15.57 $ 19.24 $ 23.09 $ 20.26 $ 28.06

33
KKR’s Third Quarter 2021 Segment Earnings – Detailed View
Note: KKR’s 3Q’21 YTD results only include the results of Global Atlantic for the eight months beginning on February 1, 2021.
($ in thousands) 3Q'20 3Q'21 3Q'20 YTD 3Q'21 YTD
Management Fees $ 369,442 $ 559,016 $ 1,042,634 $ 1,478,878
Transaction Fees 300,645 433,246 560,404 973,853
Monitoring Fees 28,824 29,823 86,875 98,164
Fee Credits (128,383) (213,399) (266,864) (426,909)
Fee Related Performance Revenues 10,181 9,897 27,869 34,760
Fee Related Compensation (170,220) (184,224) (342,417) (485,760)
Other Operating Expenses (86,472) (104,772) (247,046) (309,483)
Fee Related Earnings $ 324,017 $ 529,587 $ 861,455 $ 1,363,503
Realized Carried Interest 217,978 413,114 924,974 1,183,826
Incentive Fees 6,042 19,670 9,044 38,577
Realized Performance Income Compensation (157,885) (274,955) (599,753) (797,965)
$ 66,135 $ 157,829 $ 334,265 $ 424,438
Net Realized Gains (Losses) 172,224 389,837 215,430 1,026,310
Interest Income and Dividends 88,191 57,728 280,474 251,391
Realized Investment Income Compensation (56,803) (67,142) (85,646) (191,663)
$ 203,612 $ 380,423 $ 410,258 $ 1,086,038
Asset Management Segment Operating Earnings $ 593,764 $ 1,067,839 $ 1,605,978 $ 2,873,979
Insurance Segment Operating Earnings $ — $ 114,989 $ — $ 305,774
Distributable Operating Earnings $ 593,764 $ 1,182,828 $ 1,605,978 $ 3,179,753
Interest Expense (54,458) (63,446) (152,676) (185,100)
Preferred Dividends (8,341) (2,519) (25,023) (19,201)
Net Income Attributable to Noncontrolling Interests (2,709) (6,072) (4,800) (14,678)
Income Taxes Paid (75,413) (185,645) (198,763) (449,814)
After-tax Distributable Earnings $ 452,843 $ 925,146 $ 1,224,716 $ 2,510,960

34
Notes to page 3 – KKR’s Third Quarter 2021 Segment Earnings
• The amount of tax benefit from equity-based compensation for 3Q’21 and 3Q’20 was $9.5 million and $9.7 million, respectively, and for 3Q'21 YTD and 3Q'20 YTD was $89.2 million and $36.2 million, respectively. Its inclusion in After-tax Distributable Earnings had the effect of increasing this metric for 3Q'21 and 3Q'20 by 1% and 2%, respectively, and for 3Q'21 YTD and 3Q'20 YTD by 4% and 3%, respectively.
Notes to pages 5 and 16 – Assets Under Management and Strategic Investor Partnership and Perpetual Capital
• Perpetual capital refers to a component of AUM that has an indefinite term and for which there is no immediate requirement to return invested capital to investors upon the realization of investments. Perpetual capital includes the AUM of our registered funds, certain unregistered funds, listed companies, and insurance companies and excludes our hedge fund partnerships. Perpetual capital may be withdrawn by or paid to investors, clients and policyholders under certain conditions, including through an election to redeem an investor’s fund investment, the termination or failure to renew a client’s investment management agreement with KKR, and the payment obligations under insurance policy terms.
Notes to page 6 – Additional Capital Detail
• KKR’s portion of Uncalled Commitments to its investment funds includes $10.2 billion and $0.8 billion to its Private Markets and Public Markets business lines, respectively.
Notes to page 7 – Fund Investment Performance
• Private Equity Portfolio refers to the portfolio of investments held by all KKR’s private equity flagship funds that have been investing for at least two years. This portfolio does not include investments from KKR’s growth equity (including impact) funds or core investments.
• Private Equity Flagship Funds refers to Americas Fund XII, European Fund V and Asian Fund III, which represent the most recently raised flagship private equity funds within each of KKR's major geographic regions that have been investing for at least two years.
• Opportunistic Real Estate Portfolio refers to the portfolio of investments held by KKR’s flagship opportunistic real estate equity funds that have been investing for at least two years, including KKR Real Estate Partners Americas II, KKR Real Estate Partners Europe and Asia Real Estate Partners. This portfolio does not include investments from KKR's core plus real estate fund or real estate credit funds.
• Infrastructure Portfolio refers to the portfolio of investments held by KKR’s flagship core plus infrastructure equity funds that have been investing for at least two years. This portfolio does not include investments from KKR’s core infrastructure fund, KKR Diversified Core Infrastructure.
• The Leveraged Credit Composite refers to the composite of certain investment portfolios made in KKR’s U.S. and European leveraged credit strategies including leveraged loans, high-yield bonds and opportunistic credit.
• The Alternative Credit Composite refers to the composite of investment returns across KKR’s flagship investment funds that have called capital from their investors in KKR’s special situations, dislocation and private credit strategies, including direct lending, mezzanine and private opportunistic credit funds.
• For a list of our carry paying funds, see the Investment Vehicle Summary on pages 20 to 22. See also “Important Information – Other Legal Disclosures” regarding past performance and investment returns.
Notes to page 12 – Insurance Segment
• Net investment income represents income earned on invested assets, net of investment-related expenses, including investment management fees paid to KKR.
• Net cost of insurance represents the net cost of funding institutional and individual products – interest credited or incurred, benefits incurred, the associated insurance expenses, net of any premiums, fees and other income earned.
Important Information − Endnotes

35
Notes to page 13 – Book Value
• KKR owns 61.5% of Global Atlantic.
• Assuming for the 2021 year that we had paid (i) 65% of the unrealized carried interest earned by the funds that allocate 40% and 43% to the carry pool and (ii) 15% of the unrealized gains in our Principal Activities business line (in each case at the mid-point of the ranges above), our book value as of September 30, 2021 would have been reduced by approximately $2.61 per adjusted share, compared to our reported book value of $28.06 per adjusted share on such date.
Notes to page 14 – Investments Detail
• Investments is a term used solely for purposes of financial presentation of a portion of KKR’s balance sheet and includes majority ownership of subsidiaries that operate KKR’s asset management, broker-dealer and other businesses, including the general partner interests of KKR’s investment funds and the Global Atlantic insurance companies. Investments presented are principally the assets measured at fair value that are held by KKR's asset management segment, which, among other things, does not include the underlying investments held by Global Atlantic and Marshall Wace.
• Private Equity includes KKR private equity funds, co-investments alongside such KKR sponsored private equity funds, and other opportunistic investments. Equity investments in other asset classes, such as core, growth, energy, real estate, infrastructure, leveraged credit and private & opportunistic credit appear in these other asset classes.
• Significant Investments include the top five investments based on their fair values as of September 30, 2021. Significant Investments exclude (i) investments expected to be syndicated, (ii) investments expected to be transferred in connection with a new fundraising, and (iii) investments in funds and other entities that are owned by one or more third parties and established for the purpose of making investments. Accordingly, this list of Significant Investments should not be relied upon as a substitute for the “Investment Holdings by Asset Class" pie chart on page 14 for information about the asset class exposure of KKR's balance sheet. The fair value figures include the co-investment and the limited partner and/or general partner interests held by KKR in the underlying investment, if applicable.
Important Information − Endnotes (cont’d)

36
Important Information – Non-GAAP and Other MeasuresNon-GAAP and Segment Measures
The key non-GAAP and other operating and performance measures that follow are used by management in making operational and resource deployment decisions as well as assessing the performance of KKR's businesses. They include certain financial measures that are calculated and presented using methodologies other than in accordance with GAAP. These non-GAAP measures, including after-tax distributable earnings (or DE), distributable operating earnings, fee related earnings (or FRE), total asset management segment revenues and book value, are presented prior to giving effect to the allocation of income (loss) between KKR & Co. Inc. and KKR Holdings L.P. and as such represent the entire KKR business in total. In addition, these non-GAAP measures are presented without giving effect to the consolidation of the investment funds and collateralized financing entities (“CFEs”) that KKR manages.
We believe that providing these non-GAAP measures on a supplemental basis to our GAAP results is helpful to stockholders in assessing the overall performance of KKR's business. These non-GAAP measures should not be considered as a substitute for financial measures calculated in accordance with GAAP. Reconciliations of these non-GAAP measures to the most directly comparable financial measures calculated and presented in accordance with GAAP, where applicable, are included under the “Reconciliation of GAAP to Non-GAAP Measures" section of this Appendix.
We also caution readers that these non-GAAP financial measures may differ from the calculations made by other investment managers, and as a result, may not be directly comparable to similarly titled measures presented by other investment managers.
• After-tax Distributable Earnings is a non-GAAP performance measure of KKR’s earnings, which is derived from KKR’s reported segment results. After-tax distributable earnings is used to assess the performance of KKR’s business operations and measures the earnings potentially available for distribution to its equity holders or reinvestment into its business. After-tax distributable earnings is equal to Distributable Operating Earnings less Interest Expense, Series A and B Preferred Stock dividends, Net Income Attributable to Noncontrolling Interests and Income Taxes Paid. Series C Mandatory Convertible Preferred Stock dividends have been excluded from After-tax Distributable Earnings, because the definition of Adjusted Shares used to calculate After-tax Distributable Earnings per Adjusted Share assumes that all shares of Series C Mandatory Convertible Preferred Stock have been converted to shares of common stock. Income Taxes Paid represents the implied amount of income taxes that would be paid assuming that all pre-tax distributable earnings were allocated to KKR & Co. Inc. and taxed at the same effective rate, which assumes that all units in KKR Holdings L.P. and other exchangeable securities were exchanged for common stock of KKR & Co. Inc. Income Taxes Paid includes amounts paid pursuant to the tax receivable agreement and the benefit of tax deductions arising from equity-based compensation, which reduces income taxes paid or payable during the period. Equity based compensation expense is excluded from After-tax Distributable Earnings, because (i) KKR believes that the cost of equity awards granted to employees does not contribute to the earnings potentially available for distributions to its equity holders or reinvestment into its business and (ii) excluding this expense makes KKR’s reporting metric more comparable to the corresponding metric presented by other publicly traded companies in KKR’s industry, which KKR believes enhances an investor’s ability to compare KKR’s performance to these other companies. If tax deductions from equity-based compensation were to be excluded from Income Taxes Paid, KKR’s After-tax Distributable Earnings would be lower and KKR’s effective tax rate would appear to be higher, even though a lower amount of income taxes would have actually been paid or payable during the period. KKR separately discloses the amount of tax deduction from equity-based compensation for the period reported and the effect of its inclusion in After-tax Distributable Earnings for the period. KKR makes these adjustments when calculating After-tax Distributable Earnings in order to more accurately reflect the net realized earnings that are expected to be or become available for distribution to KKR’s equity holders or reinvestment into KKR’s business. However, After-tax Distributable Earnings does not represent and is not used to calculate actual dividends under KKR’s dividend policy, which is a fixed amount per period, and After-tax Distributable Earnings should not be viewed as a measure of KKR’s liquidity.

37
Important Information – Non-GAAP and Other Measures (cont’d)Non-GAAP and Segment Measures (cont’d)
• Book Value is a non-GAAP performance measure of the net assets of KKR and is used by management primarily in assessing the unrealized value of KKR’s net assets presented on a basis that (i) deconsolidates KKR’s investment funds and CFEs that KKR manages, (ii) includes the net assets that are attributable to KKR Holdings L.P., and (iii) includes KKR’s ownership of the net assets of Global Atlantic. We believe this measure is useful to stockholders as it provides additional insight into the net assets of KKR excluding those net assets that are allocated to investors in KKR’s funds and other noncontrolling interest holders and to the holders of Preferred Stock. KKR's book value includes (x) the net impact of KKR's tax assets and liabilities as prepared under GAAP and (y) the implied amount of (1) tax assets and liabilities attributable to KKR Holdings L.P. as if it was subject to corporate income taxes and (2) the recognition of deferred tax liabilities relating to certain assets of KKR Group Partnership L.P. that is expected to occur upon the completion of the mergers contemplated by the previously announced Reorganization Agreement, dated October 8, 2021, by and among KKR & Co. Inc., KKR Holdings L.P. and the other parties thereto. Series C Mandatory Convertible Preferred Stock has been included in book value, because the definition of adjusted shares used to calculate book value per adjusted share assumes that all shares of Series C Mandatory Convertible Preferred Stock have been converted to shares of common stock. To calculate Global Atlantic book value and to make it more comparable with the corresponding metric presented by other publicly traded companies in Global Atlantic’s industry, Global Atlantic book value excludes (i) accumulated other comprehensive income and (ii) accumulated change in fair value of reinsurance balances and related assets, net of deferred acquisition costs and income tax.
• Distributable Operating Earnings is a non-GAAP performance measure that KKR believes is useful to stockholders as it provides a supplemental measure of our operating performance without taking into account items that KKR does not believe arise from or relate directly to KKR's operations. Distributable Operating Earnings is presented prior to giving effect to the allocation of income (loss) among KKR & Co. Inc., KKR Holdings L.P. and other exchangeable securities, and the consolidation of the investment funds, vehicles and accounts that KKR advises, manages or sponsors (including collateralized financing entities). Distributable Operating Earnings excludes: (i) equity-based compensation charges, (ii) amortization of acquired intangibles, (iii) strategic corporate transaction-related charges and (iv) non-recurring items, if any. Strategic corporate transaction-related items arise from corporate actions and consist primarily of (i) impairments, (ii) non-monetary gains or losses on divestitures, (iii) transaction costs from strategic acquisitions, and (iv) depreciation on real estate that KKR owns and occupies. Inter-segment transactions are not eliminated from segment results when management considers those transactions in assessing the results of the respective segments. These transactions include (i) management fees earned by KKR as the investment adviser for Global Atlantic insurance companies and (ii) interest income and expense based on lending arrangements where one or more KKR subsidiaries borrow from a Global Atlantic insurance subsidiary. Inter-segment transactions are recorded by each segment based on the definitive documents that contain arms' length terms and comply with applicable regulatory requirements. Distributable Operating Earnings represents operating earnings of KKR’s Asset Management and Insurance segments, which are comprised of the following:
• Asset Management Segment Operating Earnings is the segment profitability measure used to make operating decisions and to assess the performance of the Asset Management segment and is comprised of: (i) Fee Related Earnings, (ii) Realized Performance Income, (iii) Realized Performance Income Compensation, (iv) Realized Investment Income, and (v) Realized Investment Income Compensation. Asset Management Segment Operating Earnings excludes (i) unrealized carried interest, (ii) net unrealized gains (losses) on investments, and (iii) related unrealized performance income compensation. Management fees earned by KKR as the adviser, manager or sponsor for its investment funds, vehicles and accounts, including its Global Atlantic insurance companies, are included in Asset Management Segment Operating Earnings.
• Insurance Segment Operating Earnings is the segment profitability measure used to make operating decisions and to assess the performance of the Insurance segment and is comprised of: (i) Net Investment Income, (ii) Net Cost of Insurance, (iii) General, Administrative, and Other Expenses, (iv) Income Taxes, and (v) Net Income Attributable to Noncontrolling Interests. The non-operating adjustments made to derive Insurance Segment Operating Earnings eliminate the impact of: (i) realized (gains) losses related to asset/liability matching investments strategies, (ii) unrealized investment (gains) losses, (iii) changes in the fair value of derivatives, embedded derivatives, and fair value liabilities for fixed-indexed annuities, indexed universal life contracts and variable annuities, and (iv) the associated income tax effects of all exclusions from Insurance Segment Operating Earnings except for equity-based compensation expense. Insurance Segment Operating Earnings includes (i) realized gains and losses not related to asset/liability matching investments strategies and (ii) the investment management fee expenses that are earned by KKR as the investment adviser of the Global Atlantic insurance companies.

38
Important Information – Non-GAAP and Other Measures (cont’d)Non-GAAP and Segment Measures (cont’d)
• Fee Related Earnings (“FRE”) is a performance measure used to assess the Asset Management segment’s generation of profits from revenues that are measured and received on a recurring basis and are not dependent on future realization events. KKR believes this measure is useful to stockholders as it provides additional insight into the profitability of KKR’s fee generating asset management and capital markets businesses and other recurring revenue streams. FRE equals (i) Management Fees, including fees paid by the Insurance segment to the Asset Management segment and fees paid by certain insurance co-investment vehicles, (ii) Transaction and Monitoring Fees, Net and (iii) Fee Related Performance Revenues, less (x) Fee Related Compensation, and (y) Other Operating Expenses.
• Fee Related Performance Revenues refers to the realized portion of Incentive Fees from certain AUM that has an indefinite term and for which there is no immediate requirement to return invested capital to investors upon the realization of investments. Fee-related performance revenues consists of performance fees (i) to be received from our investment funds, vehicles and accounts on a recurring basis, and (ii) that are not dependent on a realization event involving investments held by the investment fund, vehicle or account.
• Fee Related Compensation refers to the compensation expense, excluding equity-based compensation, paid from (i) Management Fees, (ii) Transaction and Monitoring Fees, Net, and (iii) Fee Related Performance Revenues.
• Other Operating Expenses represents the sum of (i) occupancy and related charges and (ii) other operating expenses.
Total Asset Management Segment Revenues is a performance measure that represents the realized revenues of the Asset Management segment (which excludes unrealized carried interest and unrealized net gains (losses) on investments) and is the sum of (i) Management Fees, (ii) Transaction and Monitoring Fees, Net, (iii) Fee Related Performance Revenues, (iv) Realized Performance Income, and (v) Realized Investment Income. KKR believes that this performance measure is useful to stockholders as it provides additional insight into the realized revenues generated by KKR's asset management segment.
Other Measures and Terms
• Adjusted shares represents shares of common stock of KKR & Co. Inc. outstanding under GAAP adjusted to include shares issuable upon exchange of all units of KKR Holdings L.P. and other exchangeable securities and the number of shares of common stock assumed to be issuable upon conversion of the Series C Mandatory Convertible Preferred Stock. Weighted average adjusted shares is used in the calculation of After-tax Distributable Earnings per Adjusted Share, and Adjusted Shares is used in the calculation of Book Value per Adjusted Share.
• Assets Under Management (“AUM”) represent the assets managed, advised or sponsored by KKR from which KKR is entitled to receive management fees or performance income (currently or upon a future event), general partner capital, and assets managed, advised or sponsored by our strategic BDC partnership and the hedge fund and other managers in which KKR holds an ownership interest. We believe this measure is useful to stockholders as it provides additional insight into the capital raising activities of KKR and its hedge fund and other managers and the overall activity in their investment funds and other managed or sponsored capital. KKR calculates the amount of AUM as of any date as the sum of: (i) the fair value of the investments of KKR's investment funds and the Global Atlantic insurance companies; (ii) uncalled capital commitments from these funds, including uncalled capital commitments from which KKR is currently not earning management fees or performance income; (iii) the fair value of investments in KKR's co-investment vehicles; (iv) the par value of outstanding CLOs; (v) KKR's pro rata portion of the AUM of hedge fund and other managers in which KKR holds an ownership interest; (vi) all AUM of KKR's strategic BDC partnership; and (vii) the fair value of other assets managed or sponsored by KKR. The pro rata portion of the AUM of hedge fund and other managers is calculated based on KKR’s percentage ownership interest in such entities multiplied by such entity’s respective AUM. KKR's definition of AUM (i) is not based on any definition of AUM that may be set forth in the governing documents of the investment funds, vehicles, accounts or other entities whose capital is included in this definition, (ii) includes assets for which KKR does not act as an investment adviser, and (iii) is not calculated pursuant to any regulatory definitions.

39
Important Information – Non-GAAP and Other Measures (cont’d)Other Measures and Terms (cont’d)
• Capital Invested is the aggregate amount of capital invested by (i) KKR’s investment funds and Global Atlantic insurance companies, (ii) KKR's Principal Activities business line as a co-investment, if any, alongside KKR’s investment funds, and (iii) KKR's Principal Activities business line in connection with a syndication transaction conducted by KKR's Capital Markets business line, if any. Capital invested is used as a measure of investment activity at KKR during a given period. We believe this measure is useful to stockholders as it provides a measure of capital deployment across KKR’s business lines. Capital invested includes investments made using investment financing arrangements like credit facilities, as applicable. Capital invested excludes (i) investments in certain leveraged credit strategies, (ii) capital invested by KKR’s Principal Activities business line that is not a co-investment alongside KKR’s investment funds, and (iii) capital invested by KKR’s Principal Activities business line that is not invested in connection with a syndication transaction by KKR’s Capital Markets business line. Capital syndicated by KKR's Capital Markets business line to third parties other than KKR’s investment funds or Principal Activities business line is not included in capital invested.
• Fee Paying AUM (“FPAUM”) represents only the AUM from which KKR is entitled to receive management fees. We believe this measure is useful to stockholders as it provides additional insight into the capital base upon which KKR earns management fees. FPAUM is the sum of all of the individual fee bases that are used to calculate KKR's and its hedge fund and BDC partnership management fees and differs from AUM in the following respects: (i) assets and commitments from which KKR is not entitled to receive a management fee are excluded (e.g., assets and commitments with respect to which it is entitled to receive only performance income or is otherwise not currently entitled to receive a management fee) and (ii) certain assets, primarily in its private equity funds, are reflected based on capital commitments and invested capital as opposed to fair value because fees are not impacted by changes in the fair value of underlying investments.
• Uncalled Commitments is the aggregate amount of unfunded capital commitments that KKR’s investment funds and carry-paying co-investment vehicles have received from partners to contribute capital to fund future investments. We believe this measure is useful to stockholders as it provides additional insight into the amount of capital that is available to KKR’s investment funds and carry paying co-investment vehicles to make future investments. Uncalled commitments are not reduced for investments completed using fund-level investment financing arrangements or investments we have committed to make but remain unfunded at the reporting date.

40
Important Information – Other Legal DisclosuresWebsite
From time to time, KKR may use its website as a channel of distribution of material company information. Financial and other important information regarding KKR is routinely posted and accessible on the Investor Center for KKR & Co. Inc. at https://ir.kkr.com/. In addition, you may automatically receive email alerts and other information about KKR by enrolling your email address at the “Email Alerts” area of the Investor Center on the website.
KKR Entities
Any discussion of specific KKR entities other than KKR & Co. Inc. is provided solely to demonstrate such entities’ role within the KKR organization and their contributions to the business, operations and financial results of KKR & Co. Inc. Each KKR entity is responsible for its own financial, contractual and legal obligations.
Nothing in this presentation is intended to constitute, and shall not be construed as constituting, the provision of any tax, accounting, financial, investment, insurance, regulatory, legal or other advice by KKR or its representatives. Without limiting the foregoing, this presentation is not and shall not be construed as an offer to purchase or sell, or the solicitation of an offer to purchase or sell, any security, service or product of or by any KKR entity, including but not limited to any investment advice, any investment fund, vehicle or account, any capital markets service, or any insurance product, including but not limited to (i) any investment funds, vehicles or accounts sponsored, advised or managed by (or any investment advice from) Kohlberg Kravis Roberts & Co. L.P., KKR Credit Advisors (US) LLC, KKR Credit Advisors (Ireland) or other subsidiary, (ii) any capital markets services by KKR Capital Markets LLC (“KCM”) or any KCM affiliate outside the United States, or (iii) any insurance product offered by, or other insurance-related vehicle sponsored or managed by, Accordia Life and Annuity Company, Commonwealth Annuity and Life Insurance Company, Forethought Life Insurance Company, Global Atlantic Re Limited or any Global Atlantic insurance company.
Past Performance and Investment Returns
Past performance is not a guarantee of future results. Information about any fund or strategy and investments made by such fund or strategy, including past performance of such fund, strategy or investment, is provided solely to illustrate KKR’s investment experience, and processes and strategies used by KKR in the past with respect to such funds or strategies. The performance information relating to KKR’s historical investments is not intended to be indicative of any fund’s or strategy’s future results or the future results of KKR. Certain funds or strategies are also relatively new and their limited historical results may not be indicative of results they will experience over a longer period of time. There can be no assurance that any KKR entity (including any KKR investment fund, vehicle or account, the KKR balance sheet or Global Atlantic insurance company) will achieve results comparable to any results included in this presentation, or that any investments made by KKR entity now, in the past or in the future will be profitable, or that KKR entities will find investment opportunities similar to any presented in connection with this presentation. Actual realized value of currently unrealized investments will depend on, among other factors, the value of the investments and market conditions at the time of disposition, related transaction costs, and the timing and manner of sale, all of which may differ from the assumptions and circumstances on which the currently unrealized valuations are based. Accordingly, the actual realized values of unrealized investments may differ materially from the values indicated herein.
Estimates and Assumptions
Target, goal, hypothetical or estimated results, projections and other comparable phrases and concepts are hypothetical in nature and are shown for illustrative, informational purposes only. Except as otherwise specifically stated, this information is not intended to forecast or predict future events, but rather to show the hypothetical estimates calculated using the specific assumptions presented herein. It does not reflect any actual results, which may differ materially. Certain of the information has been made for illustrative purposes and may not materialize. No representation or warranty is made as to the reasonableness of the assumptions made or that all assumptions used in calculating the target, goal, hypothetical or estimated results have been stated or fully considered. Changes in the assumptions may have a material impact on the target, goal, hypothetical or estimated results presented. Target, goal, hypothetical or estimated results or projections may not materialize.

41
Forward Looking Statements
This presentation contains certain forward-looking statements pertaining to KKR (including Global Atlantic), including investment funds, vehicles and accounts managed by KKR and the insurance companies managed by Global Atlantic. You can identify these forward-looking statements by the use of words such as “outlook,” “believe,” “think,” “expect,” “potential,” “continue,” “may,” “should,” “seek,” “approximately,” “predict,” “intend,” “will,” “plan,” “estimate,” “anticipate,” the negative version of these words, other comparable words or other statements that do not relate strictly to historical or factual matters. Forward-looking statements relate to expectations, estimates, beliefs, projections, future plans and strategies, anticipated events or trends and similar expressions concerning matters that are not historical facts, including but not limited to the statements with respect to: the declaration and payment of dividends in future quarters; the timing, manner and volume of repurchase of common stock; the timing, manner and pricing of redemptions of preferred stock; future expectations related to Fee Related Earnings, After-tax Distributable Earnings, Book Value, Distributable Operating Earnings, and other measures and performance metrics; KKR’s ability to grow its AUM, to deploy its capital, to realize currently unrealized investment returns and the time period over which such events may occur; KKR’s ability to manage Global Atlantic’s investments; operation of Global Atlantic following the closing of KKR’s acquisition of Global Atlantic; the Global Atlantic acquisition’s effects on KKR’s operating results; expansion and growth opportunities and other synergies resulting from the Global Atlantic acquisition and other acquisitions, reorganizations or strategic partnerships.
These forward-looking statements are based on KKR’s (including Global Atlantic’s) beliefs, assumptions and expectations, taking into account all information currently available to it. These beliefs, assumptions and expectations can change as a result of many possible events or factors, not all of which are known to KKR (including Global Atlantic) or are within its control. If a change occurs, KKR’s business, financial condition, liquidity and results of operations, including but not limited to dividends, tax assets, tax liabilities, AUM, FPAUM, After-tax Distributable Earnings, capital invested, syndicated capital, uncalled commitments, cash and short-term investments, Fee Related Earnings, adjusted EBITDA, core interest expense and book value, debt levels, outstanding shares of common stock and capital structure may vary materially from those expressed in the forward-looking statements.
The following factors, among others, could cause actual results to vary from the forward-looking statements: failure to realize the anticipated benefits within the expected timeframes from the acquisition of Global Atlantic; unforeseen liabilities or integration and other costs of the Global Atlantic acquisition and timing related thereto; changes in Global Atlantic’s business; distraction of KKR’s or Global Atlantic’s management or other diversion of resources within each company caused by the Global Atlantic acquisition; retention of key Global Atlantic employees; Global Atlantic’s ability to maintain business relationships following the acquisition; the severity and duration of the COVID-19 pandemic; the pandemic’s impact on the U.S. and global economies; foreign, federal, state and local governmental responses to the pandemic; whether KKR realizes all or any of the anticipated benefits from converting to a corporation and the timing of realizing such benefits; whether there are increased or unforeseen costs associated with the conversion, including any adverse change in tax law; the volatility of the capital markets; failure to realize the benefits of or changes in KKR’s or Global Atlantic’s business strategies including the ability to realize the anticipated synergies from acquisitions (including the Global Atlantic acquisition), strategic partnerships or other transactions; availability, terms and deployment of capital; availability of qualified personnel and expense of recruiting and retaining such personnel; changes in the asset management or insurance industry, interest rates, credit spreads, currency exchange rates or the general economy; underperformance of KKR’s or Global Atlantic’s investments and decreased ability to raise funds; KKR’s and Global Atlantic’s compliance with laws applicable to their respective businesses; changes to Global Atlantic as a consolidated subsidiary of KKR; ability of KKR to manage Global Atlantic’s investments; KKR’s control of Global Atlantic; changes in Global Atlantic policyholders’ behaviors; any disruption in servicing Global Atlantic’s insurance policies; the use of estimates and risk management in KKR’s or Global Atlantic’s business; outcome of KKR’s or Global Atlantic’s litigation and regulatory matters; and the degree and nature of KKR’s and Global Atlantic’s competition.
These statements are subject to numerous risks, uncertainties and assumptions, including those listed in this Appendix and described under the section entitled “Risk Factors” in KKR & Co. Inc.’s Annual Report on Form 10‑K for the year ended December 31, 2020, filed with the SEC on February 19, 2021, as such factors may be updated from time to time in our periodic filings with the SEC, which are accessible on the SEC’s website at www.sec.gov. These factors should not be construed as being exhaustive and should be read in conjunction with the other cautionary statements that are included in this presentation and in KKR’s filings with the SEC.
All forward-looking statements speak only as of the date of this presentation. KKR does not undertake any obligation to update any forward-looking statements to reflect circumstances or events that occur after the date on which such statements were made except as required by law.
Important Information – Other Legal Disclosures (cont'd)