Embed Size (px)
Citation preview

Towards Sustainable Irrigation Practices: Understanding the Irrigator A case study in the Riverland – South Australia Zoe Leviston, Natasha B. Porter, Bradley S. Jorgensen, Blair E. Nancarrow and Lorraine E. Bates September 2005

Copyright and Disclaimer © 2005 CSIRO To the extent permitted by law, all rights are reserved and no part of this publication covered by copyright may be reproduced or copied in any form or by any means except with the written permission of CSIRO Land and Water.
Important Disclaimer: CSIRO advises that the information contained in this publication comprises general statements based on scientific research. The reader is advised and needs to be aware that such information may be incomplete or unable to be used in any specific situation. No reliance or actions must therefore be made on that information without seeking prior expert professional, scientific and technical advice. To the extent permitted by law, CSIRO (including its employees and consultants) excludes all liability to any person for any consequences, including but not limited to all losses, damages, costs, expenses and any other compensation, arising directly or indirectly from using this publication (in part or in whole) and any information or material contained in it.
Cover Photograph: Description: Flooded Murray River at Mildura, VIC Photographer: Willem van Aken © 2005 CSIRO

Towards Sustainable Irrigation Practices: Understanding the Irrigator A case study in the Riverland – South Australia Zoe Leviston, Natasha B. Porter, Bradley S. Jorgensen, Blair E. Nancarrow and Lorraine E. Bates Australian Research Centre for Water in Society
CSIRO Land and Water Client Report September 2005

Acknowledgements
This work was commissioned and funded by the Department of Water, Land and Biodiversity Conservation (DWLBC), and the River Murray Catchment Water Management Board, South Australia. The authors gratefully acknowledge the ongoing advice and assistance of the following people: John Rolls, Lisa Stribley and Ingrid Franssen - Department of Water, Land and Biodiversity Conservation Dan Meldrum - River Murray Catchment Water Management Board Jeff Parish, Gavin McMahon and Jim Atsaves - Central Irrigation Trust David Morris and Mirco De Col - Renmark Irrigation Trust

Table of Contents
1.0 INTRODUCTION ..................................................................................... 1
2.0 RESEARCH METHODOLOGY ............................................................... 2 2.1 AJZEN’S THEORY OF PLANNED BEHAVIOUR ....................................................... 2 2.2 SCOPING INTERVIEWS....................................................................................... 3 2.2.1 Methodology............................................................................................................ 3
2.3 THE HYPOTHESISED MODEL.............................................................................. 4 2.3.1 Behaviour................................................................................................................. 5 2.3.2 Attitudes.................................................................................................................. 5 2.3.3 Subjective Norm...................................................................................................... 5 2.3.4 Perceived Control .................................................................................................... 5 2.3.5 Risk.......................................................................................................................... 6 2.3.6 Trust........................................................................................................................ 6 2.3.7 Responsibility .......................................................................................................... 6 2.3.8 Values ...................................................................................................................... 6
2.4 TESTING THE MODEL ........................................................................................ 7 2.4.1 Study Area and Participants................................................................................... 7 2.4.2 The Questionnaire ................................................................................................... 8
3.0 RESULTS................................................................................................ 8 3.1 PRELIMINARY ANALYSIS .................................................................................... 9 3.1.1 Pressure to use less water........................................................................................ 9 3.1.2 Influencing water use for irrigation ...................................................................... 10 3.1.3 Using less water .................................................................................................... 12 3.1.4 Risk........................................................................................................................ 14 3.1.5 Trust..................................................................................................................... 18 3.1.6 Attitudinal Statements......................................................................................... 21 3.1.7 Demographics........................................................................................................ 24
3.2 THE STRUCTURAL EQUATION MODEL ............................................................. 31 3.2.1 Constructing the Behaviour Measure ................................................................... 31 3.2.2 Running the Model ............................................................................................... 37 3.2.3 Socio‐Demographic Analyses ................................................................................ 45
4.0 DISCUSSION AND RECOMMENDATIONS ......................................... 46
5.0 REFERENCES ...................................................................................... 50
APPENDIX 1 .................................................................................................... 53
APPENDIX 2 .................................................................................................... 57
APPENDIX 3 .................................................................................................... 61
APPENDIX 4 .................................................................................................... 73
APPENDIX 5 .................................................................................................... 77


1
1.0 INTRODUCTION Since the advent of COAG’s water reform agenda, and concerns associated with the possible effects of climate change, the use of Australia’s water resources has come under increasing scrutiny. This is particularly the case in rural areas, where irrigators are now being questioned over the proportion of the nation’s water being consumed by that industry. Catchment managers are faced with the environmental effects of increasing contaminants (salt, nutrients, pesticides etc) in the waterways from runoff or drainage associated with excessive irrigation water. Both rivers and groundwater aquifers are suffering environmental degradation through lowering water levels. Irrigators themselves are feeling increasingly under scrutiny and unappreciated by urban Australia. In the past, much has been tried to encourage the uptake of innovative technology and practices from extension and education, through participatory approaches and management plans to economic incentives and disincentives. These have generally not resulted in the widespread changes that were hoped for. However, what is not known is how irrigators make their decisions to take up technologies and incentives, and whether these initiatives are meeting the needs of irrigators. Issues such as the role of local knowledge, lifestyle, trust in authorities, and risk in irrigators’ decision‐making are generally not considered in programs aimed at promoting water efficient practices and technologies. Until it is understood what values, beliefs and attitudes underpin irrigators’ decisions to accept or reject water efficient practices, it is unlikely that the desired sustainability targets will be achieved. It is essential for governments, industry and science to better understand the irrigators and their particular needs so they can better design technologies and communication programs that will provide mutual benefit. This study aimed to identify the key individual psychological and social factors in irrigators’ decisions to adopt or reject improved irrigation practices in the South Australian Riverland. Once these factors are established, it will be possible to identify and recommend available measures to better align irrigation efficiency developments, investigations and communications with the circumstances and needs of the irrigator, to encourage greater uptake of sustainable practices. This research was conducted by the CSIRO Australian Research Centre for Water in Society (ARCWIS) for the Department of Water, Land and Biodiversity Conservation (DWLBC) South Australia, and the River Murray Catchment Water Management Board.

2
2.0 RESEARCH METHODOLOGY To date, most studies dealing with the irrigation behaviour of farmers in Australia have dealt with the impacts of particular programs, policies and initiatives by investigating broad‐scale social and community factors that may influence generalised ‘pro‐environmental’ behaviour (eg. Crean, Shaw, Singh & Mullen, 2004; Burrows & Boland, 2002; Prior, 2003; Grasby, Lockie & McAllister, 2000; Kraak, 2000). This study aims to investigate the specific psychological factors that predict the adoption of a specific behaviour. A small number of studies have tried to pinpoint predictive factors for the adoption of sustainable practices by Australian farmers, most notably Crase and Maybery (2002). They hypothesised that farmers’ personalities, values, attitudes to conservation and a range of demographic variables would be important contributors to land stewardship decisions. While they found that certain attitudinal and lifestyle factors played a part, personality had little to no influence over adoption, and where influence was exerted it was acknowledged that personality was beyond the realm of resource management programs to alter. Notably absent from these studies has been the components of perceived control and subjective norms, which a large and growing body of research suggests are critical in predicting the adoption of ‘pro‐environmental’ behaviours (eg. Terry, Hogg & White, 1999; Harland, Staats & Wilke, 1999; Kalafatis, Pollard, East & Tsogas, 1999; Bamberg 2002; Lam, 1999). 2.1 Ajzen’s Theory of Planned Behaviour Ajzen’s Theory of Planned Behaviour (1985), see Figure 1 below, proposes that a person’s actual behaviour can be predicted from their behavioural intention. This intention is in turn determined by a person’s attitudes towards performing that particular behaviour; subjective norm (whether or not most people important to the person think the behaviour should be complied with); and perceived behavioural control (the perceived ease or difficulty of performing the action).
Attitudes
SubjectiveNorms
PerceivedControl
IntendedBehaviour BEHAVIOUR
Control beliefsPersonal power
Normative beliefsMotivation to comply
Behavioural beliefsOutcome evaluations
Figure 1: Ajzen’s Theory of Planned Behaviour

3
This theory has been used effectively to predict behaviour in a wide variety of contexts (eg. physical activities, quitting cigarette smoking, blood donating, internet use and so on). Ajzen’s theory has also been used overseas to predict the irrigation behaviour of farmers (eg. Lynne, Casey, Hodges & Rahamni, 1995). The Theory of Planned Behaviour has been chosen as a base model in this study as it is a well‐tested and widely acknowledged robust basic framework for building more context‐relevant models relating to the determinants of performing a specific behaviour (East, 1997; Manstead & Parker, 1995). Also, ARCWIS has used the Theory of Planned Behaviour as a theoretical basis to successfully model the prediction of community behaviour in relation to wastewater reuse (Po, Nancarrow, Leviston, Porter, Syme & Kaercher, 2005). 2.2 Scoping Interviews A series of semi‐structured interviews were conducted by the study team with a range of local irrigators and key stakeholders in the Riverland to gain an understanding of the local context. The interviews, undertaken in November 2004, were designed to elicit irrigator attitudes, beliefs and values in relation to water use, as well as identifying other possible psychologically‐ or socially‐based variables that may influence their decisions and behaviours. The findings of these interviews were used to better define the variables in Ajzen’s model and identify additional variables that may influence decision‐making and behaviour. 2.2.1 Methodology Names of key stakeholders and a representative range of irrigators were compiled through discussions with local contacts and through recommendations received over the course of the interviews. The aim was to cover a broad range of perspectives. Interviews were arranged in advance and a confirmation letter sent to briefly explain the purpose of the visit (see Appendix 1 for an example letter). Two teams of two study personnel visited interviewees in their preferred locations (frequently on their properties) and conducted interviews in a relaxed and informal manner. Many were single interviews, but a number were in pairs or small groups of no more than five people. The semi‐structured interviews followed a checklist as shown in Appendix 2. Conversations were allowed to flow freely, while ensuring that all topics had been covered by the conclusion of the interview. Discussions ranged from forty‐five minutes to two hours in duration. A total of thirty‐nine people were interviewed in the Riverland during thirty separate interviews. A brief summary of these interviews is included as Appendix 3. As the interviews progressed, a number of themes emerged that were to inform the structure of the hypothesised model.

4
2.3 The Hypothesised Model After consideration of the findings from the scoping interviews, an assessment of similar studies (both national and international), and a review of findings from previous water‐use research carried out by ARCWIS, the variables for the hypothesised model were determined. As issues of perceived control and personal power were cited frequently (and unprompted) throughout the scoping interviews, Ajzen’s model remained to form the theoretical basis of this work. In addition, a number of further variables were incorporated. Risk and responsibility were two factors that emerged strongly from the scoping interviews, as did lifestyle and value issues. Previous research supports the notion that lifestyle and values are important predictors of pro‐environmental behaviour among Australian irrigators (Crase & Maybery, 2002; Kraak, 2000). Trust in irrigation information from a variety of sources (notably government agencies and private consultants) was a topic touched on by a number of those interviewed. The importance of trust has been established in previous research undertaken by ARCWIS with regards to urban water services, and is an emerging issue rurally (Porter, Nancarrow & Syme, 2004; Porter, Leviston, Nancarrow, Po & Syme, 2005; Po et al., 2005). Figure 2 below outlines the hypothesised model which formed the basis of the irrigator questionnaire.
Figure 2: Hypothesised Model – Understanding the Irrigator
Behaviour
AttitudesOutcome Evaluations Behavioural Beliefs
RiskRisk Perception
Risk Behaviour
Subjective Norm
Normative Beliefs
Motivation to comply
TrustTrust in authorities,technology and information
ResponsibilityIndividual, community and authorities’ responsibility for water security
Perceived Control
Control Beliefs
Personal Power
ValuesLifestyle
Anthropocentric Beliefs
© 2004 CSIRO – Commercial - in- confidence

5
The following sections provide an overview of the hypothesised model’s components. 2.3.1 Behaviour The Behaviour component refers to the individual irrigator’s water using behaviour. It is measured by comparing recommended levels of water use for the individual’s crop with their actual water consumption.1 This is referred to as the “water use index”2 throughout the report. The target behaviour referred to in the model components below is ‘using less water for irrigation purposes’. 2.3.2 Attitudes The Attitudes component refers to the favourableness of the irrigator’s evaluations of the behaviour. It is measured by:
• behavioural beliefs: what the irrigator thinks the outcomes of adopting the behaviour will be; and
• outcome evaluations: how favourable these outcomes are to the irrigator. 2.3.3 Subjective Norm The Subjective Norm component refers to the extent to which people and groups important to the irrigator think the behaviour should be adopted. It is measured by:
• normative beliefs: the irrigator’s perception of whether others think the behaviour should be adopted; and
• motivation to comply: how influential these others are in decision‐making processes surrounding the adoption of the behaviour.
2.3.4 Perceived Control The Perceived Control component refers to the perception of how easy or difficult it is for the irrigator to adopt the behaviour. It is measured by:
• control beliefs: the perceived control over the decision to adopt the behaviour; and • personal power: the perceived power to overcome factors that may hinder the
adoption of the behaviour.
1 For this study, as we were able to obtain actual data for the target behaviour, we were able to dispense with the ‘Intended Behaviour’ variable from Ajzen’s original model. Thus, links between predictor variables and the target behaviour can be made directly. 2 While it is admitted that there are problems associated with the calculation of recommended water use for each crop (eg. soil types, etc), the water use index was considered to be the best way of allowing comparison and analysis across crop types.

6
2.3.5 Risk The Risk component refers to the perceived risk associated with adopting the behaviour. It is measured by:
• risk perception: the perceived likelihood and seriousness of negative consequences associated with the adoption of the behaviour; and
• risk behaviour: the irrigator’s propensity to view risks as acceptable 2.3.6 Trust The Trust component refers to the amount of trust the irrigator places in authorities, information and technology to promote water use efficiency. It is measured by assessing trust in relation to information regarding the behaviour provided by specific organisations and groups. 2.3.7 Responsibility The Responsibility component refers to the irrigator’s belief in the relative responsibilities of the individual, community and authorities in relation to the behaviour. It is measured by assessing the responsibility of the irrigator, the community and government for water security in the region. 2.3.8 Values The Values component refers to the irrigator’s personal values that influence the behaviour. It is measured by:
• lifestyle: the place farming occupies in the irrigator’s lifestyle preferences; and • anthropocentric beliefs: the irrigator’s beliefs in the existence of water primarily for
human use.
7
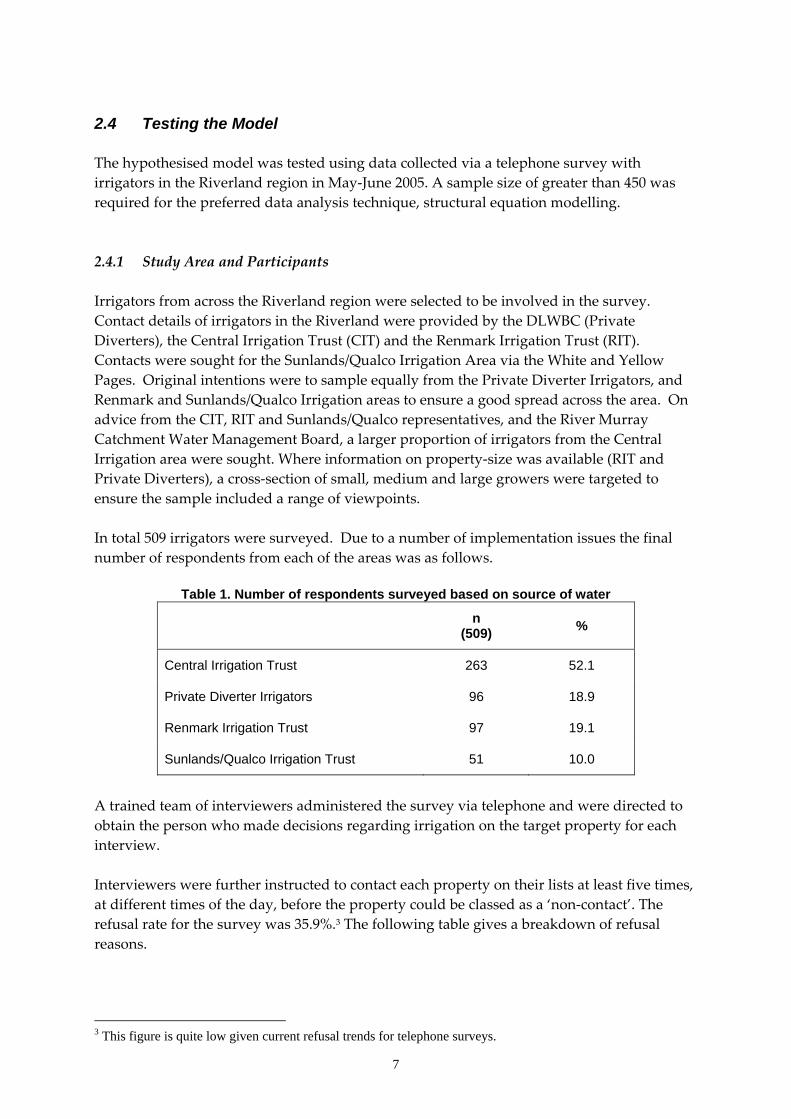
2.4 Testing the Model The hypothesised model was tested using data collected via a telephone survey with irrigators in the Riverland region in May‐June 2005. A sample size of greater than 450 was required for the preferred data analysis technique, structural equation modelling. 2.4.1 Study Area and Participants Irrigators from across the Riverland region were selected to be involved in the survey. Contact details of irrigators in the Riverland were provided by the DLWBC (Private Diverters), the Central Irrigation Trust (CIT) and the Renmark Irrigation Trust (RIT). Contacts were sought for the Sunlands/Qualco Irrigation Area via the White and Yellow Pages. Original intentions were to sample equally from the Private Diverter Irrigators, and Renmark and Sunlands/Qualco Irrigation areas to ensure a good spread across the area. On advice from the CIT, RIT and Sunlands/Qualco representatives, and the River Murray Catchment Water Management Board, a larger proportion of irrigators from the Central Irrigation area were sought. Where information on property‐size was available (RIT and Private Diverters), a cross‐section of small, medium and large growers were targeted to ensure the sample included a range of viewpoints. In total 509 irrigators were surveyed. Due to a number of implementation issues the final number of respondents from each of the areas was as follows.
Table 1. Number of respondents surveyed based on source of water
n (509) %
Central Irrigation Trust 263 52.1
Private Diverter Irrigators 96 18.9
Renmark Irrigation Trust 97 19.1
Sunlands/Qualco Irrigation Trust 51 10.0
A trained team of interviewers administered the survey via telephone and were directed to obtain the person who made decisions regarding irrigation on the target property for each interview. Interviewers were further instructed to contact each property on their lists at least five times, at different times of the day, before the property could be classed as a ‘non‐contact’. The refusal rate for the survey was 35.9%.3 The following table gives a breakdown of refusal reasons.
3 This figure is quite low given current refusal trends for telephone surveys.

8
Table 2. Refusal details
Reason n (273)
Not Interested 108
Too Busy 81
Limited English 62
Hung Up 11
Unwell 9
Elderly 2
2.4.2 The Questionnaire Based on the hypothesised model, the literature and the information and language provided in the scoping interviews, a draft questionnaire was developed and pre‐tested. As a result of pre‐testing, a number of minor changes were made to the questionnaire before being finalised. 3.0 RESULTS Preliminary analyses were undertaken using correlation, analysis of variance (ANOVA), factor analysis and reliability analysis. This was followed by investigation of the causal relationships between the components of the model using the robust maximum likelihood estimation method in LISREL 8.72 (Joreskorg, Sorbom, du Toit & du Toit, 2000). For the preliminary analyses, a significance level of p < .01 is applied. Differences labelled “significant” in the results section refer to statistical significance. The number of respondents answering a question is shown and denoted as “n” and/or as a percentage of the whole sample. For open‐ended questions, up to three answers were recorded for each case (where a respondent was deemed to have stated multiple concepts), thus percentages do not always add up to 100%. Results of open‐ended questions are presented with the number of people stating the response (n) and as a percentage of the number of people responding. The presentation of results in the preliminary section does not reflect the order in which the questions were asked. Rather the results have been ordered to maximise continuity and ease of reading.

9
3.1 Preliminary Analysis 3.1.1 Pressure to use less water Respondents were asked whether they ever felt pressured to use less water with which to irrigate their crops. The majority (69.2%) of respondents replied yes, 3.9% replied maybe, and a further 26.9% replied no. Those respondents who replied yes or maybe were asked to rate the amount of pressure they felt from various groups to use less water on a five‐point scale. The responses are outlined in the table below. Table 3. Rating of pressure felt by respondents from various groups to irrigate with less water
Group 1
No Pressure
(%)
2
(%)
3 Some
Pressure (%)
4
(%)
5 Extreme Pressure
(%) Mean
Government Departments (n=371)
16.7 15.1 29.1 20.2 18.9 3.09
Water Suppliers* (n=308) 26.9 14.9 30.3 14.3 13.6 2.73
The Catchment Board (n=370) 25.7 16.5 29.7 17.6 10.5 2.71
Industry (eg. Wineries) (n=365) 35.6 15.9 27.7 15.6 5.2 2.39
The Media (n=371) 38.0 18.9 21.0 12.7 9.4 2.37
Grower Groups (eg. Grower Associations) (n=364)
42.4 23.9 23.6 8.5 1.6 2.03
Scientists (n=364) 50.5 18.4 16.8 9.6 4.7 1.99
City Communities (n=367) 54.5 16.9 14.2 6.3 8.2 1.97
Other Growers and Farmers (n=372)
58.3 16.1 17.2 6.5 1.9 1.77
Family Members (n=371) 73.9 10.8 11.3 3.5 0.5 1.46
* Respondents who were solely private diverters answered n/a for Water Suppliers

10
As a group, respondents rated feeling most pressured from government departments, water suppliers and catchment boards, with city communities, other growers and farmers, and family members being rated lowest. Government departments were rated significantly higher than all other groups, while family members were rated significantly lower than all other groups. A One‐way Analysis of Variance (ANOVA) was performed to identify whether significant differences existed between respondents in the Irrigation Trust areas and Private Diverters. Significant differences identified were as follows.
• Grower Groups (eg. Associations) o Respondents from the CIT and RIT groups said they felt significantly more
pressure (CIT – mean = 2.17; RIT – mean = 2.17) from the Grower Groups when compared with respondents from the Sunlands/Qualco (mean = 1.68) and Private Diverter (mean = 1.64) groups.
• Industry (eg. Wineries)
o Respondents from the RIT group said they felt significantly more pressure (mean = 2.77) from Industry when compared with respondents from the Sunlands/Qualco (mean = 2.11) and Private Diverter (mean = 2.05) groups.
3.1.2 Influencing water use for irrigation All respondents were then asked to rate how influential the aforementioned groups were in the way the respondent did things in their irrigation businesses. Responses are summarised in the table below.

11
Table 4. Respondents’ ratings of the influence of various groups over irrigation practices
Group 1
No influence
(%)
2
(%)
3 Some
influence (%)
4
(%)
5 Extreme influence
(%) Mean
Water Suppliers* (n=420) 28.1 14.5 29.1 16.4 11.9 2.70
Industry (eg. Wineries) (n=501) 35.3 13.0 27.9 16.6 7.2 2.47
Government Departments (n=504)
34.7 15.9 27.0 12.9 9.5 2.47
The Catchment Board (n=502) 38.2 16.1 28.5 11.0 6.2 2.31
Grower Groups (eg. Grower Associations) (n=497)
40.5 20.3 28.2 7.4 3.6 2.13
Other Growers and Farmers (n=506)
45.4 19.0 25.5 8.5 1.6 2.02
Scientists (n=493) 51.8 19.9 17.8 7.9 2.6 1.90
The Media (n=504) 62.6 18.3 13.1 4.0 2.0 1.64
Family Members (n=503) 66.4 13.3 14.7 3.4 2.2 1.62
City Communities (n=500) 75.0 13.8 7.0 3.0 1.2 1.42
* Respondents who were solely private diverters answered n/a for Water Suppliers Respondents rated water suppliers as having significantly more influence over their decisions than all other groups, while city communities had significantly less influence over respondents than all other groups. One significant difference existed between respondents in the Irrigation Trust areas and Private Diverters.
• The Catchment Board o Respondents from the RIT and Private Diverter groups said they were
influenced significantly more (RIT – mean = 2.58; Private Diverter – mean = 2.57) by the Catchment Board when compared with respondents from the Sunlands/Qualco (mean = 2.22) and CIT (mean = 2.13) groups.

12
3.1.3 Outcome Evaluations of using less water Problems with using less water Respondents were asked whether they thought there were any possible problems associated with trying to use less water when irrigating. The majority (73.9%) of respondents replied yes, 8.8% replied maybe, and 17.3% replied no. No significant differences existed between the respondents in the Irrigation Trust and Private Diverter groups. Respondents who replied yes or maybe were further asked to state what the problems might be. The following table summarises the most popular responses.
Table 5. Most frequent responses for possible problems with trying to use less water
Reason n (421) %
Increased salinity/salt build-up 219 52.0
Reduced production/yield 135 32.1
Reduced health of crop 116 27.6
Reduced quality of produce 51 12.1
Loss of income 35 8.3
Loss of crop 30 7.2
Benefits from using less water Respondents were asked whether they thought there were any possible benefits associated with using less water when irrigating. More than half (59.3%) of respondents replied yes, 12.6% replied maybe, and 28.1% replied no. Chi‐square analyses indicated a significant difference in responses between the Irrigation Trust and Private Diverter groups. Respondents in the Private Diverter group were more likely to say they did not think there were any benefits from using less water when compared with the respondents in the Irrigation Trust groups, while respondents from the CIT group were more likely to say maybe, when compared with the other three groups. Respondents who replied yes or maybe were further asked to state what the benefits might be. The following table summarises the most popular responses.

13
Table 6. Most frequent responses for possible benefits with trying to use less water
Reason n (364) %
Financial benefits 141 38.7
Better for the environment 103 28.3
Improved quality of produce 77 21.2
Improved health of the river 37 10.2
More water for the river 54 14.8
Less drainage 31 8.5
Less salinity 23 6.3
Subjective Assessment After considering the potential problems and benefits associated with using less water, respondents were asked whether they thought the benefits of using less water for irrigating outweighed the problems, or whether the problems outweighed the benefits. They were asked to rate which of the five statements in the table below they most agreed with.
Table 7. Respondents’ Subjective Assessment of using less water for irrigation
Statement: n (503) %
The benefits obviously outweigh the problems 19 3.8
The benefits outweigh the problems 122 24.3
The benefits and problems are equal 159 31.6
The problems outweigh the benefits 158 31.4
The problems obviously outweigh the benefits 45 8.9
Of the 503 respondents who replied, 40.3% thought that the problems of using less water to irrigate outweighed the benefits, compared to 28.1% who thought that the benefits outweighed the problems. The remaining 31.6% of respondents thought that the benefits and problems were equal. An ANOVA showed that the Private Diverter group assessed using less water significantly less positively (mean = 1.96) when compared with respondents in the RIT group (mean = 3.44). This indicates that private diverters considered using less water to be less of a problem overall than did irrigators from RIT.

14
3.1.4 Risk Likelihood of unknown effects Respondents were asked to rate on a five‐point scale how likely they thought it was that there would be unknown future effects as a result of using less water when irrigating.
Table 8. Respondents’ rating of the likelihood of unknown effects resulting from using less water when irrigating
Option n (509) %
1 – highly likely 198 38.9
2 140 27.5
3 – neither likely nor unlikely 89 17.5
4 48 9.4
5 – highly unlikely 34 6.7
Mean = 2.17
The majority of respondents (66.4%) thought that the possibility of unknown effects occurring was at least likely, with the CIT and RIT groups rating the likelihood significantly greater (CIT – mean = 2.01; RIT – mean = 2.04) than the Private Diverter (mean = 2.68) group. Possibility of something going wrong Respondents were asked a series of questions relating to the possibility of something going wrong as a result of using less water to irrigate their crops. The first question asked whether they thought it a possibility that something might go wrong with using less water for irrigation. The majority of respondents (77.2%) thought there was a possibility (yes), while 10% were not sure, and 12.8% did not think it was a possibility (no). Chi‐square analysis indicated that the Private Diverter group was significantly more likely to say they did not think there a possibility of something going wrong than the three Irrigation Trust groups. Respondents who either thought it possible that something could go wrong (yes), or were not sure, were asked what they thought might happen. The most frequent reasons given by these respondents were as follows.

15
Table 9. Most frequent responses for what might go wrong due to using less water for irrigation
Reason n (444) %
Increased salinity 245 55.2
Reduced health of crop 146 32.9
Reduced production/yield 110 24.8
Business may become unviable 27 6.1
Those respondents who thought there was, or might be, a possibility of something going wrong were then asked about the likelihood of this happening, the seriousness it would pose, and the amount of control they would have to prevent it happening. Results are summarised in Tables 10 to 12.
Table 10. Respondents’ rating of the likelihood of something going wrong
Option n (442) %
1 – highly likely 197 44.5
2 156 35.3
3 – neither likely nor unlikely 63 14.3
4 15 3.4
5 – highly unlikely 11 2.5
Mean = 1.84
A large majority of respondents (79.8%) thought that the likelihood of something going wrong was either likely or highly likely.
Table 11. Respondents’ rating of how serious something going wrong would be
Option n (441) %
1 – extremely serious 234 53.1
2 102 23.1
3 – serious 96 21.8
4 8 1.8
5 – not at all serious 1 0.2
Mean = 1.73

16
The vast majority (98.0%) of respondents thought that something going wrong would be at least serious through to extremely serious. Eight people thought it would not be serious and only one respondent believed it would not be at all serious.
Table 12. Respondents’ rating of how much control they would have over preventing something going wrong
Option n (441) %
1 – no control at all 115 26.1
2 78 17.7
3 – some control 160 36.3
4 42 9.5
5 – high level of control 46 10.4
Mean = 2.61
More than a quarter of respondents (26.1%) thought that they would have no control at all, while only 10.4% thought that they would have a high level of control. No significant differences were identified between the Irrigation Trust and Private Diverter groups in terms of perceptions of the likelihood, seriousness and level of control in regards to something going wrong as a result of using less water for irrigation. Possibility of using less water Participants were asked whether they thought they could use less water for irrigation than they currently use. Just under one‐quarter (23.6%) of respondents replied yes, 14.1% replied maybe, and 62.3% of participants replied no. No significant differences were identified between the Irrigation Trust and Private Diverter groups. Participants were asked to provide reasons for their response. For participants who replied yes (n=119), the most common reasons given are listed in the table below.
Table 13. Most frequent reasons given for being able to reduce current water usage
Reason n (119) %
Could convert to drippers 44 37.0
Could change my irrigation system 18 15.1
Improve soil moisture monitoring 14 11.8
Can reduce if we really have to 8 6.7
Depends on weather 6 5.0
If I could afford a better irrigation system 6 5.0

17
For participants who replied maybe (n=72), the most common reasons given were as follows.
Table 14. Most frequent reasons given for maybe being able to reduce current water usage
Reason n (72) %
Could convert to drippers 18 25
Could change my irrigation system 10 13.9
Depends on weather 9 12.5
Improve soil moisture monitoring 8 11.1
Could reduce, but health of crop would suffer 6 8.3
If I could afford a better irrigation system 6 8.3
Already using as little as possible 5 6.9
Can reduce if we really have to 5 6.9
For participants who stated that they could not use any less water on their crops than currently (n=299), the most frequent reasons given are outlined in the table below.
Table 15. Most frequent reasons given for not being able to reduce current water usage
Reason n (299) %
Already using as little as possible 103 34.4
Have already maximised efficiency 41 13.7
Would reduce health of the crop 33 11.0
Would reduce productivity 29 9.7
Already use soil moisture monitors 27 9.0
Would not get a crop 16 5.4
Would become dependent on weather 15 5.0

18
3.1.5 Trust Water use requirements Respondents were asked to rate on a five‐point scale how much they trusted information regarding water use requirements for their crop/s provided by a number of groups. The following table provides a summary of responses.
Table 16. Respondents’ level of trust in information regarding water use requirements for their crops from different groups*
Agency 1
No trust at all (%)
2
(%)
3 Some trust (%)
4
(%)
5 Complete
trust (%)
Mean
Your Water Supplier** (n=393)
12.0 11.5 31.7 27.5 17.3 3.27
Other Growers and Farmers (n=491)
8.6 10.0 41.3 30.1 10.0 3.23
PIRSA (n=473) 11.2 12.7 33.2 30.0 12.9 3.21
Your Industry Association(s) (n=463)
10.8 13.0 39.9 26.6 9.7 3.11
Agribusiness (n=474) 14.6 12.7 38.9 24.3 9.5 3.01
Scientists (n=464) 17.5 16.4 41.3 19.0 5.8 2.79
Consultants (n=444) 20.0 16.2 36.8 22.3 4.7 2.75
The Catchment Board (n=472)
18.4 20.3 38.2 17.2 5.9 2.72
DWLBC (n=395) 21.8 21.8 38.1 13.7 4.6 2.57
Community Groups (n=456) 26.3 23.0 32.7 13.2 4.8 2.47
* A number of respondents stated they did not have contact with individual groups and therefore answered n/a for these groups. ** Respondents who were solely private diverters answered n/a for Your Water Supplier

19
As can be seen in the table above, the respondents rated information from their water supplier as most trustworthy, followed closely by information from other growers and farmers, and from PIRSA. Trust in information from DWLBC and Community Groups was rated significantly lower than for all other groups. An ANOVA indicated the following significant difference in the trust ratings.
• Other Growers and Farmers o Respondents in the Sunlands/Qualco Irrigation Trust group rated their trust
in information on crop water requirements from other growers and farmers significantly higher (mean = 3.67) when compared with the CIT group (mean = 3.11) and the Private Diverter group (mean = 3.17).
In addition, respondents were asked to rate their trust in information regarding water use requirements for their crop/s overall.
Table 17. Respondents’ level of Trust in information regarding water use requirements for crops overall
Option n (498) %
1 – no trust at all 23 4.6
2 56 11.2
3 – some trust 262 52.6
4 139 28.0
5 – complete trust 18 3.6
Mean = 3.15
The majority of respondents (84.2%) said they had at least some trust in information regarding water use requirements.

20
Water use efficiency Respondents were asked to rate on a five‐point scale how much they trusted information regarding water use efficiency provided by a number of groups. The following table provides a summary of responses.
Table 18. Respondents’ level of trust in information regarding water use efficiency from different groups*
Agency 1
No trust at all (%)
2
(%)
3 Some trust (%)
4
(%)
5 Complete
trust (%)
Mean
Your Water Supplier** (n=399)
9.3 11.8 36.1 28.8 14.0 3.27
Other Growers and Farmers (n=486)
6.8 13.2 38.2 32.5 9.3 3.24
PIRSA (n=469) 10.4 13.2 35.7 29.4 11.3 3.18
Your Industry Association(s) (n=461)
9.8 12.8 41.8 28.4 7.2 3.10
Agribusiness (n=467) 14.1 17.3 35.2 26.1 7.3 2.95
Scientists (n=458) 14.4 18.3 41.1 20.5 5.7 2.85
Consultants (n=440) 17.7 17.7 33.9 23.0 7.7 2.85
The Catchment Board (n=469)
16.4 19.4 39.9 18.3 6.0 2.78
DWLBC (n=405) 19.5 23.2 37.5 15.8 4.0 2.61
Community Groups (n=454) 24.4 24.2 34.7 13.0 3.7 2.47
* A number of respondents stated they did not have contact with individual groups and therefore answered n/a for these groups. ** Respondents who were solely private diverters answered n/a for Your Water Supplier
21
Respondents rated their trust in information regarding water use efficiency highest for their water supplier, other growers and farmers, and PIRSA. Once again, respondents rated their trust in information from community groups and DWLBC significantly lower than for all other groups. An ANOVA showed the following significant differences in ratings between the Irrigation Trust and Private Diverter groups.
• Your Industry Association o The Sunlands/Qualco and RIT groups rated their trust in information on
water use efficiency from their industry association significantly higher (Sunlands/Qualco – mean = 3.43; RIT – mean = 3.31) when compared with the Private Diverter (mean = 3.08) and CIT (mean = 2.97) groups.
• Agribusiness (eg. local irrigation designers and suppliers)
o The Sunlands/Qualco Irrigation Trust group rated their trust in Agribusiness significantly higher (mean = 3.41) when compared with the CIT group (mean = 2.78).
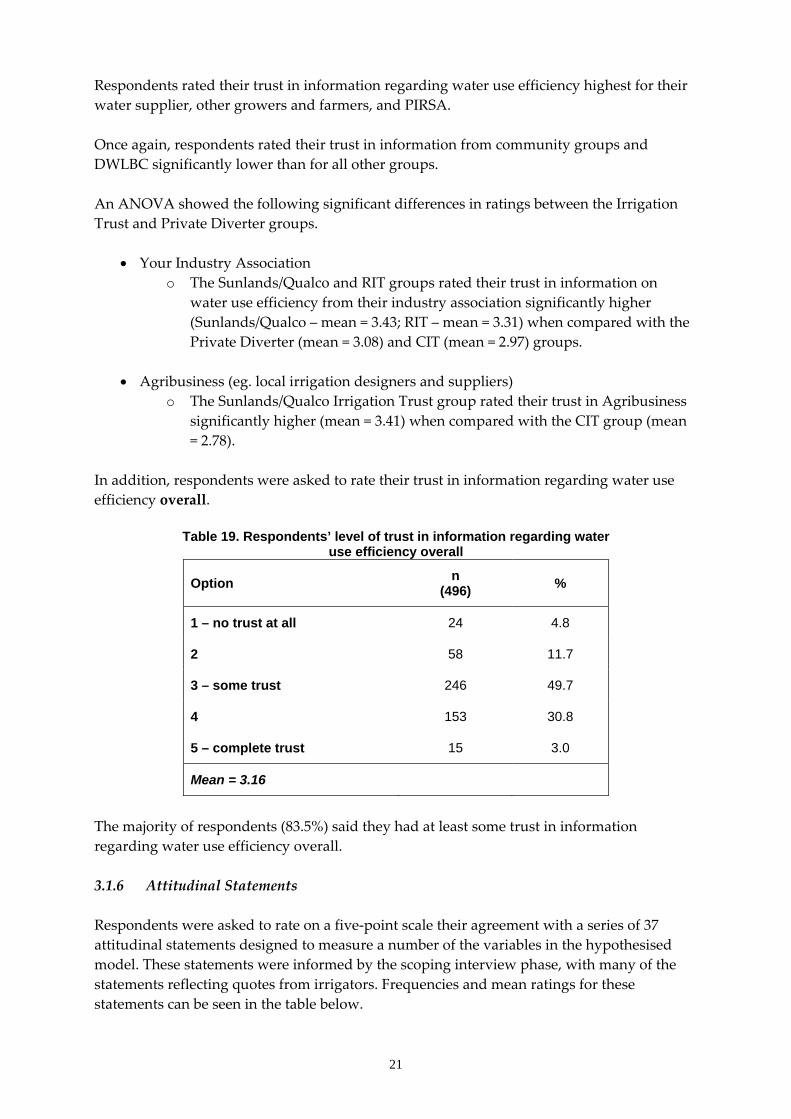
In addition, respondents were asked to rate their trust in information regarding water use efficiency overall.
Table 19. Respondents’ level of trust in information regarding water use efficiency overall
Option n (496) %
1 – no trust at all 24 4.8
2 58 11.7
3 – some trust 246 49.7
4 153 30.8
5 – complete trust 15 3.0
Mean = 3.16
The majority of respondents (83.5%) said they had at least some trust in information regarding water use efficiency overall. 3.1.6 Attitudinal Statements Respondents were asked to rate on a five‐point scale their agreement with a series of 37 attitudinal statements designed to measure a number of the variables in the hypothesised model. These statements were informed by the scoping interview phase, with many of the statements reflecting quotes from irrigators. Frequencies and mean ratings for these statements can be seen in the table below.

22
Table 20. Responses to Attitudinal Statements
Statement 1
Strongly disagree
(%)
2 Disagree
(%)
3 Neither
(%)
4 Agree
(%)
5 Strongly
agree (%)
Mean
We all should take responsibility for the environment around us (n=509) 0.2 0.4 1.8 55.4 42.2 4.39
The farming community is really important to me (n=507) 0.4 2.2 5.1 58.2 34.1 4.23
I farm because I enjoy the lifestyle (n=509) 1.4 5.1 9.4 59.1 25.0 4.01
I have a personal responsibility for making sure the region has enough water for the future (n=509)
0.8 4.1 10.8 63.1 21.2 4.00
The government is responsible for making sure the region has enough water for the future (n=509)
0.6 8.1 10.8 58.5 22.0 3.93
It is easy to get reliable information on different irrigation methods (n=507) 1.2 7.3 6.9 73.0 11.6 3.87
Sometimes you just have to go into debt if you want to succeed (n=508) 1.8 8.7 10.2 62.2 17.1 3.84
To me, farming is as much a lifestyle as it is a business (n=507) 1.4 10.7 9.5 64.0 14.4 3.79
You have to take risks to get ahead (n=509) 2.2 7.9 14.7 62.2 13.0 3.76
Improving my irrigation methods will save me money in the long run (n=509) 1.8 11.4 12.0 59.5 15.3 3.75
I’m prepared to take a chance on new technology (n=509) 0.2 10.6 16.5 64.4 8.3 3.70
The irrigation industry is affecting the health of the river (n=507) 2.0 15.8 15.2 50.3 16.8 3.64
Profit margins are too small to invest in new irrigation equipment (n=509) 3.1 18.3 13.8 44.6 20.2 3.61
Scientists often recommend things that growers have already tried (n=504) 1.2 12.3 30.0 50.9 5.6 3.47
Government agencies don’t take any notice of what locals know (n=508) 1.8 20.3 22.8 40.1 15.0 3.46
It is wholly my decision to choose the way I irrigate (n=508) 2.4 25.8 14.8 48.5 8.5 3.35
Government departments have too much say in what I can and can’t do on my property (n=509)
1.4 28.1 19.8 36.9 13.8 3.34
I am free to irrigate my crops however I want (n=509) 5.3 28.9 10.8 47.7 7.3 3.23

23
Table 20. (contd.)
Statement 1
Strongly disagree
(%)
2 Disagree
(%)
3 Neither
(%)
4 Agree
(%)
5 Strongly
agree (%)
Mean
Industry controls what I can do on my property (n=507) 3.0 32.5 18.1 42.1 4.3 3.12
I enjoy being the first to do things (n=509) 5.5 30.3 23.0 35.7 5.5 3.06
Using less water for irrigation means less salt in the river (n=509) 9.0 29.7 15.9 39.5 5.9 3.04
A lot of new procedures take too much of my time (n=508) 7.1 35.2 16.5 34.1 7.1 2.99
I prefer to wait and see what works on other properties (n=509) 7.1 36.6 20.2 32.8 3.3 2.89
Using less water for irrigation means I waste less fertiliser (n=508) 6.9 42.3 14.2 32.3 4.3 2.85
For me, farming is a hard-nosed business only (n=508) 6.1 51.6 15.2 23.2 3.9 2.67
No-one else knows how much water my crop needs (n=509) 8.1 52.2 11.6 22.2 5.9 2.66
Farming gives me the time to do all the other things I enjoy (n=506) 21.5 31.0 15.4 28.3 3.8 2.62
If I use more water, I make more money (n=508) 8.7 48.4 18.7 20.5 3.7 2.62
If everyone else changed their irrigation methods, I would too (n=508) 10.8 46.9 19.1 19.5 3.7 2.58
Scientists always listen to what growers know (n=504) 10.5 37.9 34.7 16.7 0.2 2.58
Even if I use irrigation technology, it won’t reduce my water use (n=509) 11.2 54.3 11.2 20.0 3.3 2.50
It is too difficult to change irrigation methods on a large property (n=506) 15.4 50.8 13.4 18.8 1.6 2.40
It is not worth the extra time it would take for me to become more water efficient (n=503) 18.9 50.3 10.9 17.1 2.8 2.35
I intend to use all the water I’ve paid for (n=506) 19.2 49.2 14.0 15.2 2.4 2.32
It is too difficult to change irrigation methods on a small property (n=505) 17.2 56.6 8.7 14.5 3.0 2.29
Irrigation workshops are a waste of my time (n=507) 18.9 51.8 16.2 10.3 2.8 2.26
I have a right to use an unlimited amount of water (n=509) 41.5 51.3 3.3 2.9 1.0 1.71

24
A number of significant differences in mean ratings were identified between the Irrigation Trust and Private Diverter groups. The specific differences were as follows.
• I farm because I enjoy the lifestyle o The Private Diverter group (mean = 4.24) were more likely to agree with this
statement when compared with the RIT group (mean = 3.81).
• I have a right to use an unlimited amount of water o The Private Diverter group (mean = 1.40) were more likely to disagree more
strongly with this statement when compared with the CIT (mean = 1.80) and RIT (mean = 1.80) groups.
• I intend to use all the water I’ve paid for
o The RIT (mean = 2.66) group was more likely to agree with this statement when compared with the Sunlands/Qualco Irrigation Trust (mean = 2.14) and Private Diverter (mean = 2.01) groups.
• No‐one else knows how much water my crops need
o The Sunlands/Qualco Irrigation Trust group (mean = 2.25) were more likely to disagree with this statement when compared with the Private Diverter group (mean = 3.02).
• It is too difficult to change irrigation methods on a small property
o The Private Diverter (mean = 2.11) and Sunlands/Qualco Irrigation Trust (mean = 2.12) groups were more likely to disagree with this statement when compared with the RIT group (mean = 2.61).
3.1.7 Demographics Respondents were asked a series of demographic questions towards the end of the questionnaire.

25
Crop type Respondents were asked to list what type of crop/s they grew on their properties. Many respondents (40.3%) had more than one type of crop. The most common, as reported by respondents, are listed below.
Table 21. Most common crops grown on properties as reported by respondents
Crop type n (509) %
Wine Grapes 322 63.26
Citrus 151 29.67
Grapes 37 7.27
Lucern 18 3.54
Oranges 30 5.89
Almonds 22 4.32
Apricots 27 5.31
Stone Fruit 65 12.77
Vegetables 14 2.75
Avocados 15 2.95
A full list of crop‐types can be seen in Appendix 4. Water allocations Respondents were asked for how many years they had had their water allocation. Responses are summarised in the table below.
Table 22. Years respondents have had their allocation
Allocation group n (509) %
1 – 10 years 113 22.4
11 – 20 years 154 30.6
21 – 30 years 112 22.2
31 – 40 years 59 11.7
41 – 50 years 29 5.8
> 50 years 37 7.3
Mean = 24.25 years

26
Reported current water allocation Respondents were asked what their current water allocation was. Responses are summarised in the table below.
Table 23. Respondents’ current water allocation (ML)
Allocation (ML) n (509) %
4 – 50 110 21.6
51 – 150 178 35.0
151 – 350 129 25.3
351 – 700 40 7.9
701 – 2000 19 3.7
2001 - 7000 7 1.4
Unknown 26 5.1
Mean = 268.15
Reported average annual water use Respondents were asked how much water they used on average per year for irrigation. Their responses are summarised in the table below.
Table 24. Respondents’ reported annual average water use (ML)
Annual Water Use (ML) n (509) %
1 – 50 153 30.1
51 – 150 181 35.6
151 – 350 104 20.4
351 – 700 24 4.7
701 – 2000 10 2.0
2001 - 7000 7 1.4
Unknown 30 5.9
Mean = 210.29

27
Size of crop under irrigation Respondents were asked the size of their various crops under irrigation. Their responses are summarised in the table below.
Table 25. Respondents’ reported size of crops (Ha)
Hectares n (506) %
0.4 – 5 95 18.8
5 – 10 115 22.7
10 – 20 127 25.1
20 – 50 120 23.7
50 – 150 34 6.7
150 – 500 13 2.6
500 – 1280 2 0.4
Mean = 28.87
Irrigation methods Respondents were asked what irrigation methods they used on each of their crops. Many respondents (41.9%) had multiple irrigation methods. The most common, as reported by respondents, are listed below.
Table 26. Most common irrigation methods used on crops as reported by respondents
Irrigation Method n (509) %
Drip 160 31.4
Overhead Sprinklers 149 29.3
Under tree Sprinklers 131 25.7
Under vine Sprinklers 85 16.7
Low throw Sprinklers 83 16.3
Waterbird Sprinklers 56 11.0
Micro – Jet 46 9.0
A full list of irrigation methods can be seen in Appendix 5.

28
Source of income Respondents were asked whether farming was their main source of income. The majority (78.8%) of respondents replied yes, compared to 21.4% who replied no. For those whose main source of income was not farming, the most common sources of income are listed in the table below.
Table 27. Most common sources of income other than farming
Income n (113) %
Irrigation Sales and Consultancy 9 8.0
Truck Driver 6 5.3
Contracting 7 6.2
Fruit Packer/Picker 6 5.3
Teacher 5 4.4
Winery 5 4.4
Role on Property Respondents were asked which of three options best described their role on the property, owner, manager or other.
Table 28. Role respondents play on the property
Role* n (509) %
Owner 484 95.1
Manager 24 4.7
Other – Foreman 1 0.2
* If the respondent was both Owner and Manager, Owner took precedence. Respondents were also asked how long they planned to continue in this role.

29
Table 29. Length of time respondents planned to continue in current role
Number of years n (505) %
Get out as soon as possible 14 2.8
1 – 5 years 59 11.7
6 – 10 years 49 9.7
11 – 20 years 46 9.1
21 – 30 years 10 2.0
More than 30 years 6 1.2
Forever 263 52.1
Don’t know 58 11.5
Country of birth Respondents were asked which country they were born in. Responses are listed below.
Table 30. Respondents’ Country of Birth
Country n (503) %
Australia 440 87.5
Greece 12 2.4
England 12 2.4
India 10 2.0
Germany 7 1.4
Croatia 3 0.6
Cypress 3 0.6
Italy 3 0.6
Netherlands 3 0.6
New Zealand 2 0.4
Spain 2 0.4
Turkey 2 0.4
Hungary 1 0.2
South Africa 1 0.2
USA 1 0.2
Vietnam 1 0.2

30
Age The following table provides a breakdown of respondents’ age groups.
Table 31. Number of respondents in each age group
Age Group n (509) %
18 to 24 years 3 0.6
25 to 39 years 96 18.9
40 to 55 years 256 50.2
56 to 65 years 123 24.2
66 to 75 years 26 5.1
More than 75 years 5 1.0
Education Table 32 provides a breakdown of respondents’ highest completed levels of formal education.
Table 32. Details of respondents’ highest levels of formal education
Education n (509) %
All or some of primary school 28 5.5
All or some of secondary school 304 59.7
Trade or technical qualification 91 17.9
Agricultural Qualification 42 8.3
University qualification 44 8.6
Respondents with an Agricultural Qualification were asked for details regarding their qualification. Of the forty‐two respondents who said they had Agricultural Qualifications, thirty‐three provided details.

31
Table 33. Details of respondents’ agricultural qualification
Agricultural Qualification n (42)
Diploma of Horticulture 9
Short Agricultural Courses 5
Horticultural Management Practices 4
Advanced Diploma of Horticulture 3
Diploma of Agriculture 3
Vine and Citrus Diploma 2
Rural Business 1
Bachelor of Agriculture 1
Associate Diploma in Wine-making 1
Viticulture/crop Management 1
Water Management 1
Diploma Parks and Wildlife Management 1
Farm Management 1
3.2 The Structural Equation Model Structural equation modelling with latent variables was used to develop a model using as its theoretical basis the hypothesised model described in Section 2.3. Structural equation modelling allows for both latent and observed variables to be represented. This allowance for the simultaneous and holistic analysis of the entire system of variables makes structural equation modelling the preferred method of analysis at this stage of the research program. 3.2.1 Constructing the Behaviour Measure To construct a behaviour measure, respondents were asked to provide their average annual Mega litre (ML) usage in association with the size of their crops under irrigation. Due to anticipated inaccuracies with self‐reporting, actual usage was sought for as many respondents as possible. Actual usage was received for most respondents in the CIT and RIT areas, as well as for a majority of private diverter respondents.4 In all, actual usage was obtained for 73.7% of respondents (n=375). To check the accuracy of self‐reporting, a ‘discrepancy percentage’ was established by calculating the percentage of difference between self‐reported usage figures and actual usage figures received from the trusts (for the cases where both figures were available). The median discrepancy percentage was 6.7%, indicating that more people overestimated their
4 Respondents provided written permission to obtain this usage data for 2003/04.

32
water use than underestimated. Forty‐two percent of respondents estimated their water‐usage to within 10% of the figure provided by the trusts. These respondents were identified as “accurate reporters” for the purposes of analyses, while the remaining 58% were classified as “inaccurate reporters”.5 Of the inaccurate reporters, 74.6% overestimated their water usage, while only 25.3% underestimated their water usage. Chi‐square tests and independent samples t‐tests were performed to identify any significant relationships between accuracy of reporting and the following variables:
• Crop type • Size of crop under irrigation • Years the respondent had had their water allocations • Whether the respondents thought that they could use less water than currently • Perceived problems with trying to use less water • Perceived possibility of something going wrong as a result of using less water • Whether the respondents thought that the problems of using less water outweighed
the benefits, or vice versa • ‘Water Use Index’ (see below)
No significant relationships were found, suggesting that any discrepancy between reported and actual usage was not associated with any particular demographic group or particular view. Further comparison between respondents’ reported usage and their actual usage revealed a correlation of .98. Due to the strength of this correlation, it was decided that reported usage could be used in place of real usage, thereby increasing the sample size and with it, the robustness of any model produced.6 Where the respondents did not know their usage, actual usage figures were substituted. There were 20 cases where neither reported usage nor actual usage figures were available. These cases were omitted in the modelling analyses, leaving a sample size of 489. To arrive at a behaviour measure that would take into account the differing water needs of different crops, an “optimal” usage figure was calculated by applying crop water usage factors provided by the Department of Land, Water and Biodiversity Conservation to each crop of the respondents. In this manner, an overall “optimal” amount of water was calculated for each respondent based on crop type/s and the area under irrigation. The respondents’ reported usage was then divided by their “optimal” usage to arrive at a ‘water use index’. Here, a score of more than 1 signified that the respondent was using “more” water, and a score of less than 1 signified that the respondent was using “less” water.7
5 A number of these discrepancies may be accounted for by different time-frame references. While annual usage figures received from the trusts referred specifically to the ‘03/’04 financial year, respondents were asked to report their “average annual usage”. Additionally, it is plausible that in some cases the grower was referring to multiple properties, while usage figures received from the trust may have referred to only one or some of these properties. 6 This strong correlation tells us that the ranking order of nearly all the cases would be the same whether using ‘actual’ or ‘reported’ usage as the dependent variable, and hence would make no difference to the structural equation modelling. 7 It is recognized that the “optimal” crop water use figures are highly controversial with many considering that they do not account for the range of variables involved in crop water requirements. However, they provide the only means to be able to analyse water use behaviours of growers of different crops and crop combinations. For

33
Reported usage results and water use index results for all respondents can be seen in Figures 3 and 4.
0
20
40
60
80
100
120
140
160
0-2
2-4
4-6
6-8
8-10
10-1
2
12-1
4
14-1
6
16-1
8
18-2
0
20-2
2
22-2
4
24-2
6
26-2
8
28-3
0
>30
ML per hectare
Num
ber o
f res
pond
ents
Figure 3: Water use per hectare for all respondents across crop types
0
10
20
30
40
50
60
70
80
0.1
0.2
0.3
0.4
0.5
0.6
0.7
0.8
0.9 1
1.1
1.2
1.3
1.4
1.5
1.6
1.7
1.8
1.9 2
2.1
3.2 4
4.1
Water use index
Num
ber o
f res
pond
ents
Figure 4: Water use index for all respondents across crop types
this reason, the calculation is referred to as a ‘water use index’ and provides a range of water use (from lesser to greater) for consideration in the analysis. No judgment is made about what indicates favourable water using behaviour.

34
In addition to whole group analyses, separate analyses were performed on each of the major crop types. Here, only those cases where one type of crop was grown was selected for inclusion (thereby excluding those respondents with multiple crop types) as water use data was only available for the whole property and not for individual crop areas. Figures 5 and 6 give water usage and water use index results for those who grew grapes exclusively8 (n=196).
0
10
20
30
40
50
60
70
80
0-2 2-4 4-6 6-8 8-10
10-12
12-14
14-16
16-18
80-20
20-22
ML per Hectare
Num
ber o
f res
pond
ents
Figure 5: Water use per hectare for grape growers
0
5
10
15
20
25
30
35
40
0.1
0.2
0.3
0.4
0.5
0.6
0.7
0.8
0.9
1.0
1.1
1.2
1.3
1.4
1.5
1.6
1.7
1.8
1.9
2.0
2.1
2.2
Water use index
Num
ber o
f res
pond
ents
Figure 6: Water use index for grape growers
8 No discerning data was available for different water requirements for grapes for bulk wine, grapes for quality wines, table grapes and so on.

35
Figures 7 and 8 give water usage and water use index results for those who grew citrus exclusively (n=44).
0
2
4
6
8
10
12
14
16
0-2 2-4 4-6 6-8 8-10
10-12
12-14
14-16
16-18
18-20
20-22
22-24
24-26 >26
ML per Hectare
Num
ber
of r
espo
nden
ts
Figure 7: Water use per hectare for citrus growers
0
1
2
3
4
5
6
7
8
9
0.1
0.2
0.3
0.4
0.5
0.6
0.7
0.8
0.9
1.0
1.1
1.2
1.3
1.7
2.1
Water use index
Num
ber o
f res
pond
ents
Figure 8: Water use index for citrus growers

36
Figures 9 and 10 give water usage and water use index results for those who grew stonefruit exclusively (n=21).
0
1
2
3
4
5
6
0-2 2-4 4-6 6-8 8-10
10-12
12-14
14-16
16-18
ML per Hectare
Num
ber
of r
espo
nden
ts
Figure 9: Water use per hectare for stonefruit growers
0
0.5
1
1.5
2
2.5
3
3.5
4
4.5
0.1
0.2
0.3
0.4
0.5
0.6
0.7
0.8
0.9
1.0
1.1
1.2
Water use index
Num
ber o
f res
pond
ents
Figure 10: Water use index for stonefruit growers

37
Outliers The final data set contained a number of outliers for the water use and water use index variables. That is, a small handful of scores appeared to deviate markedly from the bulk of the scores in these variables. In these cases, individual questionnaires were checked to ensure no error had occurred during the coding or data entry phases. As a number of outliers remained after this process, water usage and water use index figures were mathematically modified by applying a logarithm to normalise their distributions. In this way, genuine outliers were able to be retained without violating the assumptions of normality that are inherent in some of the statistical analyses that were applied. 3.2.2 Running the Model The structural equation model in Figure 11 was estimated using LISREL 8.72 software and Robust Maximum Likelihood estimation (Joreskog et al, 2000). The model can be interpreted by referring to its two main parts. The first part of the model refers to the relationships between the latent variables (shown in the model as ellipses) and their respective indicators 9 (shown in the model as rectangles). Put simply, this aspect of the model answers the question ‘How well do the indicators measure the latent variables of interest?’ Coefficients on these paths can range from ‐1.0 (i.e., a strong negative relationship between the latent variable and the indicator) and +1.0 (i.e., a strong positive relationship between the latent variable and the indicator. Figure 11 shows that all indicators in the model have strong positive relationships with the latent variables they were hypothesised to measure. In fact, all of these relationships are statistically significant at the .001 level. Note, however, that it was necessary in the case of latent variables measured with only one indicator to fix these paths to a pre‐specified value. In most cases, single indicators were assumed to correlate 0.84 with their respective latent variables. The two exceptions were the indicators for Age (AGE1) and whether Farming was the respondent’s main source of income (FARMINC). These indicators were assumed to have been reliably measured given that they were unlikely to have been difficult to answer for respondents. The second part of the structural equation model refers to the relationships between the independent latent variables and the dependent variable (i.e., Water‐use Behaviour, measured here by the water use index). The coefficients on these paths are free to range from ‐1.0 (i.e., a strong negative relationship between the predictor and Water‐use Behaviour) and +1.0 (i.e., a strong positive relationship between the predictor and Water‐use Behaviour). Note, however, that the path between Trust in Water Efficiencies and Water‐use Behaviour was not estimated in the model as it was highly correlated (.89, p<.001) with Trust in Water Requirements ‐ creating instability in the model estimates when paths from both trust variables were estimated. The path between Trust in Water Requirements was retained in the model because of its higher level of prediction.
9 These were determined through factor analyses and reliability testing.

38
The following table provides an overview of the variables contained in the model.
Table 35. Descriptions of the variables in the hypothesised model
Model Variables Descriptions
Water Use Behaviour Higher scores on the water use index greater water used per hectare by crop(s).
Attitudes Comprised of Behavioural Beliefs - Using Less Water and Outcome Evaluation - Using Less Water.
o Behavioural Beliefs - Using Less Water
Higher scores indicate a greater degree of agreement with favourable results from using less water to irrigate.
o Outcome Evaluation - Using Less Water
Higher scores indicate a greater degree of agreement that problems will be associated with using less water to irrigate.
Subjective Norm Comprised of Normative Beliefs about Industry and Non-Industry and Motivation to Comply with Industry and Non-Industry.
o Normative Beliefs about Industry
Higher scores indicate a greater perception of pressure by industry groups (grower associations, other growers and industries) to use less water to irrigate.
o Normative Beliefs about Non-Industry
Higher scores indicate a greater perception of pressure by non-industry groups (media, city communities and scientists) to use less water to irrigate.
o Motivation to Comply with Industry
Higher scores indicate greater influence of industry groups (grower associations, other growers and industries) over irrigation decisions.
o Motivation to Comply with Non-Industry
Higher scores indicate greater influence of non-industry groups (media, city communities and government departments) over irrigation decisions.
Perceived Control Comprised of Control Beliefs about Irrigation Methods and Personal Power to Change Irrigation.
o Control Beliefs about Irrigation Methods
Higher scores indicate a greater perceived level of personal control over the decision to use less water to irrigate.
o Personal Power to Change Irrigation
Higher scores indicate a higher perceived level of ease of overcoming problems associated with using less water to irrigate.
Risk Comprised of Risk Perception of Using Less Water and Risk Behaviour for New Methods.
o Risk Perception of Using Less Water
Higher scores indicate a higher perceived likelihood of something going wrong as a result of using less water to irrigate, greater perceived seriousness of these negative events, and greater lack of control over preventing these negative consequences.
o Risk Behaviour for New Methods Higher scores indicate higher agreement with risk-taking behaviour.
Trust Comprised of Trust in Water Efficiency and Trust in Water Requirements
o Trust in Water Efficiency
Higher scores indicate a greater deal of trust in information regarding water use efficiency.
o Trust in Water Requirements
Higher scores indicate a greater deal of trust in information regarding water use requirements.

39
Table 35. (contd.)
Responsibility Made up of Personal Responsibility, Collective Responsibility, and Government Responsibility
o Personal Responsibility
Higher scores indicate a higher investment of responsibility in the individual for water conservation in the region.
o Collective Responsibility
Higher scores indicate a higher investment of responsibility in the collective for water conservation in the region.
o Government Responsibility
Higher scores indicate a higher investment of responsibility in government for water conservation in the region.
Values Comprised of Lifestyle Values and Anthropocentric Values.
o Lifestyle Values Higher scores indicate a heavier emphasis placed on lifestyle aspects of farming.
o Anthropocentric Values
Higher scores indicate a stronger agreement that water exists primarily for human use.
Demographics10 Comprised of Farming is Main Source of Income and Age.
o Farming is Main Source of Income
Higher scores indicate that farming is the main source of income.
o Age Higher scores indicate higher age levels.
Figure 11 shows that three latent variables had significant relationships with Water‐use Behaviour after controlling for the effects of all other predictors in the model. These variables were Trust in Water Requirements, Outcome Evaluation of Using Less Water, and Motivation to Comply with Non‐Industry. The statistical significance of these paths is indicated in the model by asterixis, where significance levels of .05, .01, and .001 are denoted by one, two and three asterixis respectively. Similarly, large effects are shown as thick red arrows, moderate ones are shown by thinner purple arrows, and weak paths are shown as green arrows.
The model results indicated that higher levels of Water‐use Behaviour were associated with respondents who (1) believed that problems were likely to occur from attempts to use less water for irrigation; (2) felt lower levels of influence from groups outside of the grower industry (i.e., the media, communities in large cities, and government departments); and, (3) had more trust in the information on water requirements when it was provided by the DWLBC, PIRSA, the catchment board, and agribusiness.
10 The two demographic features of farming income and age are commonly cited in rural research literature, hence their inclusion in the model analyses.

40
Trust in WaterRequirements
Trust in Water Efficiency
Normative BeliefsAbout Non-industry
Motivation to Complywith Non-industry
Normative Beliefsabout Industry
Motivation to Complywith Industry
Control Beliefs aboutIrrigation Methods
Personal Power toChange Irrigation
Outcome EvaluationUsing Less Water
Behavioural BeliefsUsing Less Water
Risk Perception ofUsing Less Water
Risk Behaviour forNew Methods
Water-use BehaviourR2 = .13
Government ResponsibilityPersonal Responsibility
Farming is Main Source of Income
Collective Responsibility
Lifestyle Values
Anthropocentric Values
Age AGE1
FARMINC
ATT21
ATT8
ATT12
ATT6
ATT33
ATT34
ATT28
ATT31
INFLU5
INFLU6
INFLU9
PRESS5
PRESS6
PRESS7
ATT37
ATT36ATT35
TRUSTR9
LIKELY
TRUSTR7
PROBLE1
ATT2
ATT4
ATT14
ATT19
INFLU2
INFLU3
INFLU4
PRESS2
PRESS3
PRESS4
TRUSTR3
TRUSTR2
TRUSTE9
TRUSTE7TRUSTE3
TRUSTE2
.10
-.05
-.29*
-.02
.06
.07
-.05
.03
-.05
-.05
-.11
.00
.06
-.28***
.00
-.09
.17**
.12
.70
.69
.81
.58
.76
.71
.77
.65
.84 .84
.84
.84
.73
.80
.62
.84
.71
.63
.58
.41
.34
.49
.68
.83
.74
.66
.58
.82
.76
.78
.65
.59
.69
.75
.38
.80
.57
1.00
1.00
Strong Contribution Moderate Contribution Weak Contribution
INDEX
.97
SERIOUS
CONTROL
.85
.67
Figure 11: Estimated Structural Equation Model The model accounted for 13 percent of the variance in Water‐use Behaviour and its overall goodness‐of‐fit indices were satisfactory (see Table 34). The Satorra‐Bentler Scaled Chi‐square was marginally significant at the .05 level indicating that the model could not reproduce the relationships among the indicators observed in the sample within a .05 level of significance. However, the chi‐square statistic is known to be upwardly biased in samples of 200 or more cases (Hair et al., 1995). Due to the unreliability of the chi‐square statistic, a number of other goodness‐of‐fit measures are available to test the overall fit of structural equation models. These additional measures were well within recommended values (Kline, 1998).
Table 34. Model fit indices for the structural equation model Fit statistics Obtained value Recommended value
Chi-square (df) 705.94 (629), p = .018 p >.05
SRMR .033 ≤ .08
TLI .99 ≥ .90
GFI .93 ≥ .90
RMSEA .016 (90%CI = .007, .022) ≤ .08

41
Not shown in Figure 11 are the zero‐order correlations among the predictors and Water‐use Behaviour. These correlations revealed that few variables in the model had significant relationships with Water‐use Behaviour. The largest correlations were for Outcome Evaluation of Using Less Water (‐.19, p<.01), Trust in Water Requirements (.10, p<.05), and Motivation to Comply with Non‐industry (‐.13, p<.01). However, there were some correlations among the independent variables that were significant at .001. The largest of these were between the two Trust variables (.89), the Normative Belief variables (.71), and the Motivation to Comply variables (.60). Moreover, the Normative Belief and Motivation to Comply variables were significantly correlated with one another. These correlations ranged from .39 (between Motivation to Comply with Industry and Normative Beliefs about Non‐industry) to .54 (between Motivations to Comply with Non‐industry and Normative beliefs about Non‐industry). Predicting Variables in the Theory of Planned Behaviour A second latent variable model was estimated to ascertain the extent to which the variables from the Theory of Planned Behaviour (TPB) (ie. attitudes, subjective norm, and perceived control) could be predicted by Lifestyle and Anthropocentric Values, Responsibility, Risk and Trust (see Figure 12). This was done to ascertain whether the TPB variables had a basis in more general things such as perceptions of trust and risk, and to identify whether any of these variables had effects on Water‐use Behaviour that operated through the TPB variables. However, only the significant paths are shown in Figure 12 so as to enhance the simplicity of the diagram. Figure 12 shows that Trust in Water Requirements, Age, Risk Perception of Using Less Water, and Anthropocentric values had the strongest relationships with the TPB variables. Respondents who trusted information on water requirements (delivered by the DWLBC, PIRSA, the catchment board and agribusiness) were more motivated to comply with industry and non‐industry groups and agencies. Individuals who perceived greater risk associated with using less water for irrigation were more inclined to evaluate the outcomes of using less water in a negative light. Respondents who held anthropocentric values (e.g., those who intended to use all the water they had paid for) were more likely to feel that it was too difficult to change irrigation methods. Finally, younger respondents were more likely to be motivated to comply with industry and non‐industry groups and agencies as well as more likely to feel pressure from these sources of influence. However, only the effect of age on Normative Beliefs about Non‐industry (i.e., perceptions of pressure from the media, communities in large cities, and government departments) was a large effect. Other moderate relationships were observed for Farming as the Main Source of Income, Collective Responsibility, Risk Behaviour for New Methods and Risk Perceptions of Using Less Water. Individuals who reported farming as their main source of income believed that problems would arise from efforts to use less water for irrigation. In contrast, respondents who believed that every one should be responsible for the environment were more likely to perceive problems with trying to use less water for irrigation. Individuals who reported being more willing to take chances with new farming practices felt that the method of irrigation practices they chose to use was completely subject to their discretion. Finally, respondents who perceived greater risks associated with using less water were more likely to hold negative beliefs about the behaviour.

42
Finally, there was little evidence of indirect effects of the general variables (i.e., those variables which are not TPB variables) on Water‐use Behaviour. The only evidence was a weak positive indirect effect involving Collective Responsibility. In this case, Collective Responsibility had an effect on Water‐use Behaviour that operated through the effect of Outcome Evaluations, such that part of the effect of Outcome Evaluations on Water‐use Behaviour was due to its relationship with Collective Responsibility. In other words, those individuals who perceived a collective responsibility for the environment (i.e., felt everyone should be responsible) were more likely to view the outcomes associated with using less water negatively and to use relatively more water. This conclusion should be interpreted conservatively since the effect was marginal with respect to its level of statistical significance.
Trust in WaterRequirements
Trust in Water Efficiency
Motivation to Complywith Industry
R2 = .14
Motivation to Complywith Non-industry
R2 = .18
Normative Beliefsabout Industry
R2 = .12
Normative Beliefsabout Non-industry
R2 = .07
Control Beliefs aboutIrrigation Methods
R2 = .13
Personal Power toChange Irrigation
R2 = .15
Outcome EvaluationUsing Less Water
R2 = .21
Behavioural BeliefsUsing Less Water
R2 = .23
Risk Perception ofUsing Less Water
Risk Behaviour forNew Methods
Water-use BehaviourR2 = .13
Government Responsibility
Personal Responsibility
Farming is Main Source of Income
Collective Responsibility
Lifestyle Values
Anthropocentric Values
Age
Strong Contribution
Moderate Contribution
Weak Contribution
.17**
.22*
.24***.30***
.29**.22*
-.14***-.17***
-.13***-.17***
.15** -.12*-.13*
-.12*
.26*
-.23*
-.23**
.13*
-.25***
-.17*-.16*
-.27***
-.29*
-.28**-.35***
.13*
.19*
.18*
.15*
Figure 12: Predicting TPB variables

43
The Theory of Planned Behaviour (TPB) model in different crop groups In order to test the generality of the TPB model for Water‐use Behaviour, it was estimated in four crop groups: grapes, citrus, stonefruit, and all other crops and crop combinations. That is, respondents were grouped on the basis of the type of crop they were growing (i.e., only grapes, citrus or stonefruit. See page 34 and figures 5 to 10). Respondents who were engaged in farming other types of crops, or combinations of crops (e.g., wine grapes and citrus) were included in a separate group. The analysis involved regressing the TPB variables (ie. attitudes, subjective norm, and perceived control) on the natural log of reported water‐use expressed as mega litres per hectare, and then testing for differences in the intercept and regression coefficients over the four crop groups. Trust in Water Requirements was also included given its predictive power in the structural equation model. This analysis answers the question ‘Is the model the same in different crop groups?’ The model can differ in a number of ways. First, the intercept may differ across the groups, indicating that the mean of the dependent variable is different in each group. Second, one or more of the regression coefficients may differ across groups, suggesting that different variables explain Reported Water‐use depending upon the type of crop under consideration. Finally, the level of prediction of the model may vary over groups as a result of either different patterns of significant and non‐significant regression coefficients, or different Water‐use variances across crop groups. The results of the regression analyses indicated that only the intercept and the regression coefficient for Trust in Water Requirements varied over crop groups (see Table 36). As in the structural equation model, the significant predictors were Outcome Evaluation of Using Less Water, Motivation to Comply with Non‐industry and Trust in Water Requirements. However, this latter variable did not have a consistent level of prediction across the four crop groups. Rather, the positive coefficient on the Trust variable was significant in only the citrus group. The fit statistics for this model were satisfactory although the small number of cases in the Citrus and Stonefruit groups suggest that the results should be interpreted with caution. The chi‐square statistic (degrees of freedom) was 36.77(24) marginally significant at the .05 level. Other measures of overall fit were within statistical conventions for good fitting models (SRMR = .023; TLI = .92; GFI = .99; RMSEA = .059).

44
Table 36. Tests of equal regression equations across crop type
Predictors Reported Water-use
Grapes
N=196
Citrus
N=44
Stonefruit
N=21
Others
N=228
Intercept 2.06*** 1.34** 2.39*** 2.50***
Behavioural Beliefs about Using Less Water
.02 .02 .02 .02
Outcome Evaluation of Using Less Water
-.09*** -.09*** -.09*** -.09***
Normative Beliefs about Industry
-.11 -.11 -.11 -.11
Normative Beliefs about Non-Industry
.09 .09 .09 .09
Motivation to Comply with Industry
.01 .01 .01 .01
Motivation to Comply with Non-industry
-.07* -.07* -.07* -.07*
Control Beliefs about Irrigation Methods
-.02 -.02 -.02 -.02
Personal Power to Change Irrigation Methods
.00 .00 .00 .00
Trust in Water Requirements .06 .35** -.06 -.03
Error Variance .17*** .49*** .28** .23***
R2 .07 .15 .06 .05
* p < .05 ** p < .01 *** p < .001 Given the above difference between citrus growers and others, a discriminant analysis was run to ascertain what socio‐economic characteristics predicted membership of this group. The main discriminating variables that correctly classified 71% of cases ( =0.929; p<.001) were as follows. Compared with other respondents, citrus growers were:
• More likely to have another main source of income (other than farming) • Less likely to have had another type of crop in the past • More likely to have had a higher level of education • More likely to have a smaller crop • More likely to have been born in Australia.

45
3.2.3 Socio‐Demographic Analyses Analytical comparisons were performed with the key predictor variables emerging from the model:
• Trust in Water Requirements • Motivation to Comply (Non‐Industry groups) • Outcome Evaluation
and the following demographic variables:
• Level of Education • Crop Size • Country of Birth • Irrigation Area • Years of Allocation Ownership.
Analytical comparisons were also performed with the aforementioned demographic variables and the water use index. There was a significant but weak relationship [r=‐.12, n=489, p<.01] between total crop size under irrigation and the water use index. Here, larger crop sizes were linked to using less water (per hectare) on crops. No other significant differences or relationships were found.

46
4.0 DISCUSSION AND RECOMMENDATIONS The results of the preliminary analysis provided some interesting insights. Firstly, about one‐third of irrigator respondents thought that they could or might be able to use less water than they currently use. Over a quarter of respondents stated that the benefits of using less water would outweigh the problems, while a further third thought the problems and benefits were equal. More than a quarter of all respondents cited financial benefits as one of the positives that would come from using less water, as well as resulting environmental benefits. Respondents could also provide options for ways of reducing water use through changing to a more efficient irrigation system. Of the respondents who stated that they could reduce their water usage, over half said, unprompted, they could do this by modifying their irrigation system (mostly to drippers). As a whole, this represents 18% of all irrigators taking part in the study. So it appears that almost one‐fifth of irrigators not only consider that more water could be saved, there is also an understanding of how this could be achieved. While a number of irrigators indicated that they were in the process of gradually installing more efficient systems, there was considerable concern among all irrigators about the possibility that something might go wrong if they used less water. The majority of these irrigators thought it would be likely or highly likely to happen, and the majority thought the consequences would be extremely serious. While increased salinity topped the list of possible things that might go wrong, loss of crop production, quality and health were also major concerns. In many cases these concerns may be well justified, where water use efficiency may already be optimal. However, addressing these concerns for others will not be easy as they threaten their livelihoods. The structural equation modelling to test the hypothesised model to provide holistic prediction of water using behaviours (in this case the water‐use index) tended to support the above insights from the preliminary analysis. The model proved to be quite robust, especially considering its size, and this tended to hold both for the overall sample across crops and for samples of individual crops. The major predictors were:
• the outcome evaluation of using less water irrigators who were more likely to perceive there to be problems with using less water were higher water users
• motivation to comply with non‐industry groups irrigators whose irrigation management was more influenced by the media, communities in large cities and government departments were more likely to use less water
• trust in information about crop water requirements irrigators who had greater trust in information on crop water requirements provided by DWLBC, PIRSA, Catchment Board and agribusiness were more likely to use more water.
The second latent variable model provided a deeper understanding of these predictor variables. The outcome evaluation (perceptions of problems from using less water) could, understandably, be predicted by risk perceptions (considerations of likelihood, seriousness and levels of control of the possible risks), as well as farming as a main source of income. That is, those irrigators who gained their main source of income from farming, and who thought they would have limited control over risks that were likely and serious, judged the outcome of using less

47
water more negatively. This may seem to be self evident, however, statistically it is an important predictor of water use behaviour (p<.001), and it does provide an indicator of the direction for future education and communication programs. Understanding the nature of these fears will be important, especially as the preliminary analysis showed that many respondents thought they could use less water. Whether specific concerns associated with crops need to be addressed, or just a generalised concern about the risk to their livelihood, is something that should be discussed with growers. It is, however, possible that the concern is more general in nature, as the outcome evaluation was an important predictor of water use behaviour both overall across crops, and for growers of individual crops. Motivation to comply with non‐industry groups is perhaps unexpected, but a highly interesting predictor of water using behaviours. Age was an important predictor of this variable in that younger irrigators were more likely to be influenced by communities in large cities, the media and government, as well as more likely to feel pressured by these groups. This may indicate that the new generation of irrigators will be more responsive to social norms than the older generation, and while it is important this pressure does not degenerate to feelings of blame, a new social responsiveness may be developing in the irrigator community, which will grow as younger irrigators come through. The other predictor of motivation to comply was trust in the information on crop water requirements that is provided by DWLBC, PIRSA, Catchment Board, and agribusiness. That is, those with greater trust in these sources of water use information were also more likely to be influenced by non‐industry groups. Therefore, the fostering of trusting relationships with these sources of information, and particularly in relation to young growers, should lead to lower water using behaviours. There was also an indirect effect on water using behaviours by those who believed that the environment was everyone’s responsibility, as opposed to being a personal responsibility. This occurred through the outcome evaluation variable, and indicates that fostering attitudes of personal responsibility in any communication program, would assist in lesser water using behaviours. Finally the direct prediction of the effect on water using behaviour of trust in the information on crop water requirements that is provided by DWLBC, PIRSA, Catchment Board, and agribusiness is somewhat difficult to explain. That is, unlike its effect described above, the direct prediction indicates that the greater the trust, the higher the water use. There are two possible explanations here. The first is that this seems to be related purely to citrus growers as was shown through the regression analyses on the individual crop growers. An examination of the variables that discriminated between citrus growers and other growers showed a group that gained its main source of income from areas other than farming, were more highly educated, were Australian born, had smaller crops and generally had always grown citrus. This indicates that these people are “secondary farmers”. Their main source of income may come from working relationships with people from these sources of information (and perhaps even work for some of them). This could explain the greater trust. Their higher water using behaviours are also indicative of the secondary nature of their farming. Another explanation is that trust can be multi‐faceted. Couch (1997) suggests a tripartite division of trust: (a) partner trust formed through specific relationship partners; (b) network

48
trust through family and friends; and (c) generalised trust through people in general. Partner trust is more likely to result in commitment than would generalised trust. It is possible therefore, that the trust measurement in this study was of the more generalised trust, and that the development of closer partner trust may be required to result in lesser water using behaviours. In any case, Blomqvist (1997) suggests that trust is context‐ and situation‐specific, which also may explain why this trust relationship with water using behaviour is specific to citrus growers. Finally, the relatively low prediction of the variance (13%) by such a robust model requires some discussion. There are no doubt a range of reasons why this predictive ability was not higher. An obvious one may have been that the sample of irrigators that agreed to be surveyed provided limited variability in available water using behaviours. However, given the low refusal rate, and the range of irrigation technology used by the respondents (ie. ranging from drip through to flood) this seems unlikely. Also, Figures 3 to 10 show a sufficient range in the water use index overall, and for the actual water use for growers of individual crops. Another reason for the analytical difficulties may have been that the behavioural measure was inadequate given the lack of confidence in the optimum usage calculation and hence the water use index (see Section 3.2.1). Similar results though were achieved within individual crop groups where actual water use was used as the dependent variable. So this too is unlikely to have been a major factor. The most obvious explanation is that there are a wide range of random factors that could govern water using behaviours, both human and physical. On the human side, there are many individual differences and circumstances within properties and families that govern behaviour at any given time. The fact that no one demographic variable was related to water use behaviour (other than crop size) indicates that human‐drivers are likely to be many and varied. Physical factors governing water use can also be many and varied, and are well known. These factors include within crop differences (eg. grapes for bulk or premium wine, or for table grapes or dried fruit) and across crop differences, soil types, climate, and many more. These cannot be easily quantified. In view of all these factors, the predictive ability of 13% can be considered to be highly useful in helping to understand the irrigators. It must be recognised though that changes in water using behaviours will be a long term and gradual process and that there can be no “one size fits all” education and communication program. The following recommendations are made to address the major predictor variables that have been discussed above.

49
It is recommended that:
1. Discussions be held with irrigators across all crop types to better understand the nature of their risk concerns associated with using less water, and what they would need to be able to confidently reduce their water use. Education, communication and extension programs should therefore be designed around these requirements. Bio-physical research and demonstration projects are likely to be the most effective activities in addressing the specifics of irrigators’ concerns.
2. Future communication programs should foster the attitude of personal responsibility for the environment and the water future for the region.
3. Opportunities to take advantage of and foster the positive influence of the government and media on water using behaviours, particularly in the younger growers, should be sought. Care should be taken that this is done in a positive manner and not include implications of blame or “them and us” divisions.
4. Communication with citrus growers should address their specific circumstances and attempt to develop partnership trust rather than merely a generalised trust.

50
5.0 REFERENCES Ajzen, I. (1985). “From intentions to actions: A theory of planned behaviour” in J. Kuhl & J.
Beckmann (eds) Action control: from cognition to behaviour, Springer, Berlin, 11‐39. Bamberg, S. (2002). “Effects of Implementation Intentions on the Actual Performance of New
Environmentally Friendly Behaviours – Results of two field experiments”, Journal of Environmental Psychology, 22, 399‐411.
Blomqvist, K. (1997). “The Major Facts of Trust”, Scandinavian Journal of Management, 13, 3,
271‐286. Burrows, D.M. & Boland, A. (2002). “Review of adoption models, extension programs and
methods: A report to assist extension to improve water use efficiency in viticulture”, Cooperative Research Centre for Viticulture: Australia.
Couch, L. & Jones, W. (1997). “Measuring Levels of Trust”, Journal of Research in Personality,
31, 319‐336. Crase, L. & Maybery, D.J. (2002). “Social research to underpin the regional catchment plan
implementation for the NSW Murray part one: Understanding the status quo”, Department of Land and Water Conservation, NSW.
Crase, L. & Maybery, D.J. (2002). “Social research to underpin the regional catchment plan
implementation for the NSW Murray part two: Investigating triggers for change”, Department of Land and Water Conservation, NSW.
Crean, J., Shaw, A., Singh, R. & Mullen, J. (2004). “An assessment of the economic,
environmental and social impacts of NSW Agriculture’s advisory programs in water use efficiency”, Economic Research Report No. 21, NSW Department of Primary Industries, Orange.
East, R. (1997), Consumer Behaviour: Advances and Applications in Marketing, Prentice‐Hall,
Hemel Hampstead. Grasby, D., Lockie, S. & McAllister, J. (2000). “The social basis of sustainable sugarcane
production in Australia”, Cooperative Research Centre for Sustainable Sugar Production, Townsville, Queensland.
Hair, J., Anderson, R., Tatham, R. & Black, W. (1995). Multivariate Data Analysis, 4th ed.
Prentice Hall, New Jersey. Harland, P., Staats, H. & Wilke, H.A. (1999). “Explaining Proenvironmental Intention and
Behaviour by Personal Norms and the Theory of Planned Behaviour”, Journal of Applied Social Psychology, 29, 2505‐2528.
Joreskog, K., Sorbom, D., du Toit., & du Toit. (2000). LISREL 8: New Statistical Features,
Scientific Software International, Chicago.

51
Kalafatis, S.P., Pollard, M., East, R. & Tsogas, M.H. (1999). “Green Marketing and Ajzen’s
Theory of Planned Behaviour: A cross‐market examination”, Journal of Consumer Marketing, 16, 5, 441‐460.
Kline, R. (1998). Principles and Practice of Structural Equation Modeling, The Guilford
Press, New York. Kraak, A. (2000). “Why do growers do what they do? Farming behaviour and attitudes in
relation to crop, soil and water management”, Cooperative Research Centre for Sustainable Sugar Production, Townsville, Queensland.
Lam, S.‐P. (1999). “Predicting Intentions to Conserve Water from the Theory of Planned
Behaviour, Perceived Moral Obligation, and Perceived Water Right”, Journal of Applied Social Psychology, 29, 1058‐1071.
Lynne, G.D., Casey, C.F., Hodges, A. & Rahmani, M. (1995). “Conservation Technology,
Adoption Decisions and the Theory of Planned Behaviour”, Journal of Economic Psychology, 16, 581‐598.
Manstead, A. and Parker, D. (1995). ʺEvaluating and Extending the Theory of Planned
Behaviourʺ in W. Stroebe & M. Hewstone (eds) European Review of Social Psychology, 6, 69‐95. John Wiley and Sons, Chichester.
Po, M., Nancarrow, B.E., Leviston. Z., Porter, N.B., Syme, G.J. & Kaercher, J.D. (2005).
“Predicting Community Behaviour in Relation to Wastewater Reuse: What drives decisions to accept or reject?”, Water for a Healthy Country National Research Flagship. CSIRO Land and Water, Perth.
Porter, N.B., Nancarrow, B.E. & Syme, G.J. (2004). “Drinking Water Aesthetics: An
evaluation of the introduction of improved scheme waters. Wanneroo groundwater treatment plant”, A Confidential Final Report to the Water Corporation, WA. CSIRO Land and Water Consultancy Report, April, 2004.
Porter, N.B., Leviston, Z., Nancarrow, B.E., Po, M. & Syme, G.J. (2005). “Interpreting
Householder Preferences to Evaluate Water Supply Systems: An attitudinal model”, CSIRO Water for a Healthy Country National Research Flagship, Land and Water, Perth.
Prior, T. (2003). “Is it all in the past? The importance of landholder experiences from natural
resource management programs”, Unpublished Masters Dissertation, James Cook University, Queensland.
Terry, D.J., Hogg, M.A. & White, K.M. (1999). “The theory of planned behaviour: Self‐
identity, social identity and group norms”, British Journal of Social Psychology, 38, 225‐244.

52

53
APPENDIX 1
Scoping Interviews: Confirmatory Letter

54

55
Australian Research Centre for Water in Society CSIRO land & Water Private Bag 5 WEMBLEY WA 6913 Ph: +61 8 9333 6265 Fax: +61 8 9383 7193 Email: [email protected]
Name Address Fax: Dear Thank you for agreeing to talk with the CSIRO on Monday the 8th of November 2004 at 11.30am at your office, 149 Murray Ave, Renmark. The CSIRO staff members you will be meeting with are Lorraine Bates and Zoe Leviston. As mentioned before, we are working with growers to find out what things are important in their decisions about irrigation. It is obvious that scientists haven’t always provided the information that growers need to make their decisions on how to irrigate and how much to irrigate etc. So we want to talk to growers, industry groups and others with a wide range of issues and points of view on irrigation to find out what things are important in their decisions about irrigation. If you wish to talk to us about your appointment arrangements, please do not hesitate to contact us on 08 9333 6265. We look forward to meeting you. Yours sincerely
Blair Nancarrow Director 4 November 2004

56

57
APPENDIX 2
Scoping Interviews: Interview Checklist (Growers)

58

59
INTERVIEW CHECKLIST – GROWERS, RIVERLAND
INTRODUCTION How long have you lived in the Riverland area? Why did you become a farmer/grower? What do you irrigate? How do you irrigate? What is the size of your property? How much is under irrigation?
INFORMATION Where do you get your information on irrigation issues from? How useful is this information? Have you acted on any suggestions as to how you may go about reducing your water consumption? If yes, was that easy to do? If no, why not? What information do you need that you don’t get at the moment? Do you belong to or interact with any industry groups?
• If yes, how useful are they; what sort of interaction do you have with them?
COMMUNITY How close is the irrigator community in the Riverland? How much is water something that you think about/talk about? Is it a ‘hot topic’ among growers or the broader community? Are there particular people who are respected and lead the way in terms of farming (technology and farming methods)? If yes, why and how?
BARRIERS What has changed in irrigation over time? What sort of things haven’t changed?
• We are talking about personally and for the region Has the environment changed at all over the years?
• Good changes/bad changes; changes related to farming practices. Is it easy to change the ways people do things on their property?
• Keeping up with modern technology
WATER USE What do you think that you do really well on your farm? Are there things you would like to do on your farm that you can’t? Why? How could we fix this?
• Start off generally, but can get into specifics ie. irrigation

60
WATER USE How often do you irrigate? Is there any pressure on you to reduce the amount of water you use for irrigation? Who by? Is this useful or does it just cause problems? Is it anybody else’s business how much water you use?
FUTURE What is the future for the irrigation industry in the Riverland?
• Also the Riverland community Where do you want to be in the future? What needs to occur to make sure the things you want to happen, will and the things you don’t want to happen, wont?
• Encouraging the ‘positives’ and avoiding the ‘negatives’
SCIENCE What is the single most important thing that science should be doing for you and the irrigation community?
Final prompts • Responsibility • Habits • Industry Pressures

61
APPENDIX 3
Scoping Interviews: Interview Summary

62

63
SUSTAINABLE IRRIGATION PRACTICES RIVERLAND SCOPING INTERVIEWS
Major Findings
*NB: Comments either from growers alone or growers and agency representatives are
presented in black; comments from agency representatives alone are presented in blue.
INTRODUCTION Who did we speak to?
• 39 people in all (30 separate interviews) from Paringa, Murtho, Berri, Renmark, Loxton, Barmera, Waikerie, Moorook, Lyrup and New Residence
• People representing various local agencies such as the Irrigation Trusts, DWLBC and catchment boards
• Growers representing various irrigation and horticultural associations • Individual growers who were irrigating one or a mix of wine grapes, almonds, citrus,
potatoes, olives and stone-fruits • Private diverters as well as irrigators on Trust water
INFORMATION Where do growers get information on irrigation from?
• Information courses, seminars and field trips run by a variety of organisations including DWLBC, PIRSA, and growers associations (some say a high proportion of growers attend others not so much – mainly the usual people attend)
• Directly from Industry Associations such as the Berri Agricultural Bureau, Consolidated Co-op Wineries, the Almond Board of Australia, SAMI (South Australian Murray Irrigators)
• Other growers (networking over the fence; talking on field trips; “best source of information is to go see someone who is already doing it”)
• Suppliers and sellers of irrigation equipment • Government agencies such as DWLBC, PIRSA and the Dept of Environment and
Heritage • Other regions, overseas, interstate • Irrigation Trusts • Private consultants and specialists • The internet • Family • Previous experiences • Industry publications (eg. National Grape Grower) • Technical monitoring equipment (eg enviroscans) • Local Action Plan Committees • Trial and error; own research (what is best for own property) • Agribusiness • DLWBC talk to the Trusts more than the growers • For some varieties there is no-one in the agency in the Riverland area that has any
knowledge or experience to talk to • Best information is from your own land • Internal R&D

64
Issues relating to the information
• Competition between growers often dictates how much information is shared • The relevant information is out there, provided you know where to look; you can sit on
the net and get thousands of sites relating to one topic – where do you start? • Information is often not so useful for individual growers, as it is too generalised • Always the same people attending meetings, and the information never changes,
hence a point of saturation is reached, where those who want to know will know, so attendance starts to fall.
• Industry trials tend to be too scientific, not practical – growers would rather see a practical display than a salesman
• Courses are generally more useful for new growers • The Trust is out of touch with new advances in technology • Easy to get information if you want • Problem with staff turnover in agencies • Data we produce is far more comprehensive than DWLBC’s data, yet they dictate our
water use • Growers would rather see a grower from another country or another area with the
new equipment than just go to an irrigation company and ask for new technology • The almond industry has ownership of trials, it is the grower’s trials • Would be good if someone involved in the irrigation industry was there to look at all
the information and tell us what’s good and what’s not • Money paid in annual levy not spent on research relevant to our area • Hard to find the right department that can give you the information you are after • The growers are not just sitting there waiting for the information to come to them • Different growers need different levels of information • When interacting with smaller groups or one-on-one they realise they can do better;
many think they are good until they do a system audit Is the source of the information trusted?
• The Central Irrigation Trust is well-respected • Growers trust each other • PIRSA is trusted as they have the technical knowledge • Don’t trust anyone who comes from a “Department” • Don’t trust politicians in general – too much “politicising” going on • Information from independent sources is more valued than that from government
agencies • Yandilla Park. Successful and progressive • Berri Agricultural Bureau is trusted • Slight trust concerns over irrigation suppliers • We should be able to trust MDBC • Would think the government is trusted for information (seminars were well attended) • Government has changed it’s approach and the growers now listen but are still
cautious • Trust in new practices/technologies comes down to what you see in the trees • Growers don’t trust the govt in general • AgriBusiness gets good respect • Don’t trust visiting scientists (or anyone coming in to the area they don’t know) • Growers don’t trust the Marketing Departments Some Reasons cited for Trust
• Well-managed organisation • What you have to pay for is generally better information • Information from sources you pay a levee to as the growers control the research

65
• More respect for someone who comes to speak to you on your block • Seen as removed from government • Has a professional approach • Easy to get information from
Some Reasons for not Trusting • Vested interests in pushing certain information • Growers remember the bad things and become wary of new information from the
source • People who come out to the property sometimes don’t know what they are doing • SA Government has ruined the dairy industry • Resent government’s attitude towards irrigators after irrigators have spent so
much money on irrigation • A lot of technology out there is not up to standard and some growers have been
burnt by this • Would be better if agencies came out to farms rather than three people attend a
presentation with only one of them talking – why were the other two there? • Governments have taken away a lot of resources • Information provided is not useful • Can lose trust if funding of a project falls through • No response to contact with agencies (example given was licensing – lacked
direction, agency stuffed around so much, growers didn’t get a response to letters for 4 months)
COMMUNITY
• Close community • Growers are always talking over the fence as they are neighbours; communicate well • Not a very close community • Interaction mostly between growers with common financial interests/same crop types • Cliquey, difficult for people coming into area • Competitive • Tend to put on a united front when times are tough • Growers are generally interested in looking after the river • Self-sufficient • Self-centred • Associate mainly through courses • Often based on ethnic ties • Supportive • Growers struggle for an organised voice • Growers know if the over irrigate and cause problems they have to deal with it
themselves, no-one is going to come in and dig a drain for them • Bigger growers – on paid committee, own packing sheds (they employ others to work
in the orchard and as a result have more time for these activities); Mid sized growers – only work on their farm, don’t have another income; Smaller growers – can’t afford not to have an outside income
• There is help available in the community if someone wants to change their irrigation system
• People group themselves according to type of produce grown, not so much by geographic proximity
• Growers like independence, do not like sharing • Growers want to see the top growers and what they’ve done • Affluent community • Most growers in the area are “serious” growers (not hobby farmers)

66
Why did you get into farming/why do you stay/why did you come to the Riverland? • Lifestyle – what you grew up with, what you’ve always done • Love it – most of us wouldn’t do it if we didn’t like it • Gamble • River water was more secure than groundwater (can see the river, can’t see the
aquifer to know when it is going to dry up) • Farming is a business – only a little bit is lifestyle • Not sure people are her for the lifestyle or the income (it’s probably both) • The mindset is to become more efficient, not to stop farming • Good lifestyle – I’m semi-retired
BARRIERS AND CHANGES What has changed in irrigation over time?
• Has been a significant move from flood and overhead irrigation to drip irrigation • More grower awareness – water was not an issue in the area 6 years ago (may not
mean they are more educated); they can see the floodplains are not getting wet and are looking shabby
• More computer-based (monitoring programs etc) • More Corporate companies have moved into the area • More wine-grape growers in the area • More big farms, monopolies • More regulation – paperwork, quality control and so on • Grower can order water as they need it (pumping on demand), more control • Move to mechanical harvesting • Irrigation technology • Loss of extension officers/field people • Now using requirement application of water rather than recommended application;
period of irrigation reduced – growers used to irrigated all day everyday • Ability to buy and sell water…seeing water as an ASSET • Move to metered water supply • Growers have become stronger lobbyers • Most oranges and stone-fruits have gone • Need a bigger farm to be viable nowadays • Less money spent on drainage infrastructure • Shifting of responsibility from government to the irrigator • More jobs • Better water management • Towns have more money • Water that is saved through decrease in loss from evaporation is now being
transferred to Clare and the Barossa • More efficient and accurate irrigation • More information available on vegetable crops than 15 years ago • Grapes are becoming a more technical industry • No longer the strong grower groups of the past the drove changes • Most drains don’t run any longer due to changes in irrigation practices • Some of the bigger growers are diversifying to get other sources of income – eg.
Setting up spraying companies • Secure flow of water • Change from govt management to private management • Channel to drain • Attitudes

67
• Increased media attention • Increase in corporate farming • Greater focus on water use efficiency • In the past there was a quasi environmental flows system where generally a portion
of all allocations were not used and flowed passed the gate into the river, with expansion this is no more
• Irrigators are now asking for more specialised courses • More record keeping • There are no more co-operatives in the area • No longer the attitude get bigger or get out
What environmental changes have you seen?
• Decline in plant health • Rising Salt-levels • Lack of floods • Less yabbies/less fish variety/more carp • Less water coming down the river • Not many changes seen • Decline in river water quality (could see toes in water when young, can’t now) • More silting
What stops people from using less water?
• Cost – monitoring, changing irrigation methods; newer properties less likely to be able to afford changes; loss of income when change irrigation method; small properties (up to 20 acres) are constrained by the cost of infrastructure to change to drip irrigation
• Increased yield due to more water used. “Efficiency” • Habit – growers are set in their ways (“It is a Friday, we water all day every Friday”;
“my Dad did it that way”) • No financial pressure to change • No legislative/regulation pressure (“why should I do it when you’re not going to come
after me if I don’t”) • No interest; any advances in technology requires an increase in knowledge and some
growers are not interested in this • No-one builds “leeway” into their systems; some growers are running that close to the
edge that if something goes wrong they are going to lose everything • No time to devote to it; changes to drip irrigation requires a step up in management • In some industries it requires more work, more knowledge • No need to develop • Belief that it is my right to use my full allocation in any way I see fit • Difficult for smaller irrigators to do meaningful trials • Cautious that long-term problems associated with new technologies have not
surfaced yet • Too risky using drip for stone-fruit • Not enough compensation • Perceived lack of skills to implement suggested changes • Hard to sell the $ savings made through water efficiency • How they choose to spend their dollar • No after market support for new technologies (ie monitoring technology) • No true cost of water • No drivers

68
What is the difference between good irrigators and bad irrigators?
• Age – the older farmers tend to be bad irrigators • Ethnicity – ethnic farmers (esp. Greeks, Italians) are more likely to be bad irrigators;
ESL issues • Lifestyle – hobby farmers are more likely to be bad irrigators, and those that see it as
a business are more likely to be better irrigators; some are comfortable with the lifestyle they have.
• Cannot generalise – hard to pick who will change; don’t know everyone’s story so hard to categorise people
• Lack of desire, laziness, attitude; they are in their own world • Farm Size – the smaller farms are more likely to have bad irrigation practices • Personality – conservative people less likely to change, risk-takers more likely;
competitive growers more likely to find new technology • Interest – some just can’t be bothered changing/don’t like change • Better farmers come from outside the region • Farm Size – the smaller farms are more likely to have good irrigation practices; it is
not always economically viable to install monitoring on very large properties • Financial viability – for some it does not cost them any more to stay the way they are
even if they are using more water • Lack of understanding – some people may not realise what the river was like in the
past • Education – knowing what you are doing • How do you classify a “bad” irrigator – some may over use their allocation but are
very efficient; best technology may not result in efficiency (eg. poor distribution of irrigation systems)
• Accountability and responsibility for budgeting – The corporate style of farming changes the decision-making process
• Corporate farms are generally better; more receptive to new information/changes • Not age related • Old technology on the farm • The growers on 50-100acre farms that are the main source of income are more
willing to go out an educate themselves; it is more important • Some are now coming around and can see both the environmental and economic
benefits • Some growers don’t know that they can be more efficient • Often the leaders were called ‘crazy’ (it’ll never work), but 4-5 years later they are the
gods when it has worked • Those who became more efficient 3 years ago are suffering now as everyone is told
again to use less water, it is easier now for those who did nothing before, but for us it is hard to cut down any further
• Young farmers are the ones to attend the courses, but are not the decision-makers (slowly changing)
• Not dependent on ethnicity • Ability or lack of ability to manage irrigation on the property
What makes people change?
• Social Norms and Peer Pressure (eg. floating flags) – feel a need to justify our water use
• Pressure from processors/market demand – vine growers are more up-to-date due to this pressure; pressure to get into the European market
• Water restrictions – but in some cases people just bought more water • Opportunity – through expansion/development/redevelopment/new crops/varieties • Drip irrigation easier to manage, more control, lifestyle

69
• Cost of using too much water • Competitive about what their neighbours are doing • Social responsibility • Enjoy innovation and cutting edge stuff (Intrinsic motivation) • Want to be sustainable • Pride in doing things well • Awareness of issues – limited water supply • “Courses don’t drive the change, they don’t go deep enough” • Sufficient economic gains/savings will be made – foremost in growers’ minds is best $
for the water • A good financial position – “can only have an environmental conscious if you’ve got
money” • Regulatory requirements • Recreational connection with the river makes them more aware • Community expectations • Strong grower groups/support
What could be done to encourage people to use less water?
• Government needs to provide more of an incentive to change. More attention/reward for good practice
• Need extension people – not just those who present seminars, but come out to the property and work with you one-on-one
• Deny furrow irrigators access to water • Restrict access to water to dissuade people planting water-intensive crops
LOCAL KNOWLEDGE
• Not taken into account enough • Experience is just as important as technology if not more so • Work experience is often used rather than knowledge associated with credentials
FUTURE
• Good/very good • Limits to what the future will bring as there is a limit to the amount of water available;
cap on development is needed unless we can get more water • More salt interception schemes would be good; need to manage the salinity of the
river and area • Community will suffer if small growers aren’t protected • Biggest problems will be lack of rainfall in catchment areas and storage of water for
the area • Restrictions need to be here to stay • Need to keep slowly changing • Need to keep bringing young people into the area • The Riverland is ahead of other areas in terms of better technology • Current drought is just a cycle, will be over soon • Need education of the general labour force to get capable people into irrigation • Too important to GDP for the govt not to protect us • Less regulation needed • Need to stop wastage in NSW associated with open channels • Water needs to be metered from the river, not from the property • Farmers need to be compensated to move into less water-intensive crops • Have to limit development • Need to reduce barriers to entry for small players

70
• Would like to see more re-veg • Return of extension officers • Will need to bring in water for the area to grow • Continued growth of the wine, almond and olive industries • Much the same as now – the area will survive if not on grapes something else will
move in • Small growers will disappear and larger ones will consolidate further • Future depends on wine industry • More industries will be using waste water • Salinity zoning will restrict further development • Entitlements will become more and more important • Good as long as water is flowing in river and is good quality • If water is lost the area will lose some of it’s vibrancy • Need to manage reliability of supply to the area
SCIENCE
• Not sure how much more can be done – there is a lot of information out there • Reports are written and shelved and growers don’t know where to find them (big
issue with horticulture research); need to get it out there • Updating of crop factors • 3 year funding is a problem – what has been accrued in the 3 years is lost as soon as
the funding dries up; no continuity of service; inexperienced people used; don’t get a good product in only 3 years; no-one will fund continuing work
• Has to be practical/relevant to the area – getting science into isolated areas takes a different method
• Messages from science are conflicting – it’s a healthy debate for science but not useful for growers – give us the straight information
• More work on the effect of placing polymers in water • Locked up inside labs – no account of the real world • Doesn’t get back to educating people in the city (about what irrigators do) • A lot of research done does not actually apply to the Riverland – we risk stressing our
crops if we follow the recommendations • Fashionable science and research topics – depending what’s “in fashion” will
determine what focus the science and research takes – ie one year it’s pests, another year it’s water efficiency. Once the 3 year funding finishes and the topic is no longer in fashion it is dropped for something new.
• Look into plants/varieties that use less water and are still financially viable • More environmental monitoring • Hydro modelling • Should be more holistic • Big money invested into one or two projects rather than small money invested into
lots • Don’t think the industry is big enough in Aus to justify spending money on R&D,
should be pilfering OS research instead • More research into salinity • Aimed at the top end of the market • Could have a targeted wetlands scheme that shows potential local benefits – that
may encourage efficiency if they can see the problems and the solutions • Almond Board trial into pulse irrigation is bringing large yields • Changes in staff results in some research being done over and over again every time
a new person starts • Only looking at high end products – okay while government is funding it • Growers have enough probs in their own businesses without taking on new
experiments to test for science

71
• Looking for better ways to measure irrigation • How to better get the water to the root zone • There is already a lot of research done by private industry that science is now trying
to reinvent • Good information is being provided at the moment, which could be compromised if
funding is pulled out in the future • If growers want to break into the European market they need to show the science
behind their practices
GENERAL
• Too much paperwork, and reporting requirements – farming is getting harder. • Efficiency issue – some mechanisms for measuring are not right/questionable; cannot
lump all varieties and all areas together • General goodwill by irrigators to be good water users; they are keen to adopt
technology/practices, work through problems and are aware of the links between the environment, floodplains and water quality
• Cost of land is nothing compared to the cost of water, water infrastructure and cost of pumping
• The majority of growers don’t take an active role in the health of the river • Too many restrictions, not enough reward for people who have already made
advances in efficiency • Restrictions should have stayed heavy as now growers don’t believe how serious it is
(the idea is “oh well, we’ll get it all back before long”) • There is a limit to how efficient you can become • Hopefully the bad practices will not be handed down to the next generation • Property managers may want to change the type of irrigation used, however, the
property owner may not yet be convinced • Technology is good – you need to try it before you know if it is good for your property • The urban community think the growers have created all the problems so they can
deal with it, they don’t see the efforts put in by the rural communities • Vastly different returns between crops • The push for efficiency has a limit – you still need to grow a product that you can sell • Based on the past few years, how do you make decisions when restrictions are
introduced; there was no mention of lifting the restrictions at group meetings held a few days before the restrictions were lifted so people were still going out and buying or leasing water
• The wineries keep changing the goalposts – one minute it is quality, the next quantity; and they keep changing the varieties they want
• Common frustration between SA and other States as they appear to have different rules
• “We do everything they want and hope it will pay off for us in the future” • In the past have not been able to measure assessment of progress to efficiency • Often children fill in forms, attend meetings, but they are not the decision-makers • No mechanism for investing back into the river • Efficiency is due half to technology and half to attitude • There is a lag period of about 5 years in the area between release of new
technology/practice and uptake • Some people just look over the border and blame growers in other states • Not a low income area – finances should not be an impediment in this area • There appears to be an anti-irrigation feeling growing in urban Australia

72

73
APPENDIX 4
Reported Crop Types

74

75
Respondents’ Reported Crop Types Crop Type n. % Wine grapes 322 63.3 Citrus 151 29. 7 Stone Fruit 65 12.8 Grapes 37 7.3 Oranges 30 5. 9 Apricots 27 5.3 Almonds 22 4.3 Lucerne 18 3.5 Avocado 15 3.0 Vegetables 14 2.8 Pistachios 8 1.6 Peaches 8 1.6 Olives 7 1.4 Pomegranate 7 1.4 Pears 6 1.2 Figs 6 1.2 Dried Fruit 6 1.2 Apples 5 1.0 Potatoes 5 1.0 Cherries 4 0.8 Pasture 4 0.8 Pumpkin 4 0.8 Wax Flower 3 0.6 Plums 3 0.6 Persimmons 3 0.6 Oates 3 0.6 Pommes 3 0.6 Fruit Trees 3 0.6 Grapes-Chardonnay 2 0.4 Native Plants 2 0.4 Grapes-Shiraz 1 0.2 Fruit Trees 1 0.2 Native Trees 1 0.2 Mandarins 1 0.2 Quinces 1 0.2 Grapefruit 1 0.2 Rock Melons 1 0.2 Garlic 1 0.2 Melon 1 0.2 Mangos 1 0.2 Tomatoes 1 0.2 Zucchinis 1 0.2 Watermelon 1 0.2 Eucalyptus Trees 1 0.2 Roses 1 0.2 Flowers 1 0.2 Cucumbers 1 0.2 Lemons 1 0.2 Viticulture 1 0.2 Potatoes 1 0.2 Pecans 1 0.2

76

77
APPENDIX 5
Reported Irrigation Methods

78

79
Respondents’ Reported Irrigation Methods Irrigation Method n % Drip 160 31.4 Overhead Sprinklers 149 29.3 Undertree Sprinklers 131 25.7 Undervine Sprinklers 85 16.7 Low Throw Sprinklers 83 16.3 Waterbird Sprinklers 56 11.0 Micro - Jet 46 9.0 Flood/Furrow 35 6.9 Ray Jet 11 2.2 Sprinklers 11 2.2 Under Canopy 8 1.6 Pivots 7 1.4 Micro Spray 4 0.8 Undervine Micro 4 0.8 Undervine Water Bird 4 0.8 Inline Drippers 3 0.6 Vine Jet 3 0.6 Whirly Birds 3 0.6 Gravity 2 0.4 Low Level Drip 2 0.4 G Bug Monitors 1 0.2 Gutter Irrigation 1 0.2 Undervine Birds 1 0.2 Low Spray Underneath 1 0.2 3 Point Change Sprinklers 1 0.2 Under Canopy Water Birds 1 0.2 Micro Bird 1 0.2