Embed Size (px)
Citation preview

Launch of the Draft 2013 Household
Survey: A story of rapid
change but often in both LIFT and
Control villagesMandalay Room
26 May 2014Simon Baker (ICF)

Summary of the talk• Methodological issues• Awareness of LIFT• Household income• Food• Land ownership and usage• Crop yields and constraints• Credit• Assets• Training• Water supply• Nutrition survey• Expenditure/Consumption survey

Data tools and number of cases
Tool LIFT Villages
LIFT Households per village
Control Villages
ControlHouseholds per village
Total
Round 1
Village Profile 150 NA 50 NA 200*
Household questionnaire 150 16 50 16 3,200
FGD 12 4 NA NA 48
Round 2
Village Profile 150 NA 50 NA 200
Household questionnaire 150 16 50 16 3,200
FGD 9 4 NA NA 36
Nutrition and anthropometry Survey
150 32 50 32 6,400
Expenditure survey 150 5 50 5 1,000

Methodology issues• It was planned that 150 LIFT and 50 Control
villages would be visited in rounds 1 and 2• Due to problems, in both rounds only:
o 68 LIFT and 36 Control villages were visitedo 17 LIFT villages in the Hilly zoneo 16 LIFT villages in Dry zoneo 36 LIFT villages in the Coastal/Delta zoneo Only in the Coastal/Delta zone was the sample size large enough to
demonstrate significant statistical differences between the zones – 385 households
• Can not make comparisons between zones with any certaintyo Two exceptions – awareness of LIFT and drinking-water

Difference in Differences
• Estimates difference between outcome at two time points for Intervention and control households
• Then comparing difference between the groups LIFT 2011
LIFT 2013
Change in LIFT villages
Control 2011
Control 2013
Change in
Control villages
Difference in differences
Sale of rice 1.4 .5 -.9* 2.4 .3 -2.1** 1.2Sale of paddy 16.8 23.3 6.5*** 11.6 16.8 5.2* 1.3Sale of other cereals 13.2 15.3 2.1 16.8 18.8 2 .1
Sale of beans, pulses and peanuts
17.1 17 -.1 23.1 17.7 -5.4* 5.3
Sale of tubers and root crops
2.8 1.7 -1.1 4.7 7.5 2.8* -3.9**
Cash for work 0 2.4 2.4*** 0 .2 .2 2.2**

Indicators of significance
• *p-value < 0.05• **p-value <0.005• ***p-value <0.001

Awareness of LIFT#
Hilly Dry Coastal LIFT0
20
40
60
80
100
79.4
97.692.8 89.9

Participation in trainings# (%)
Hilly Dry Coastal LIFT
Training related to crops and crop production 11.7***
5.1*** 19.5*** 12
Training in livestock 7.9* 4* 5.4* 5.6
Training in skills for small business management 13.2***
5.4*** 11.2*** 9.7
Provision of inputs for agriculture 6.9* 4* 7.4* 6
Savings and credit groups and provision of credit 24.1***
14.5*** 20.2*** 19.3
Formation/strengthening of groups in the village 5.4*** 12.4*** 14.2*** 10.9
Cash for work activities 1.3*** 31.9*** 4.7*** 13.5

Villagers’ perceptions (FGDs)
• Improvement in village unity:o The village has become more united. Before that, the head of
the villager made all the decisions. Since the last one or two years, people have worked together for social affairs and they have come to understand teamwork. Nowadays the villagers can support the monastery and the teachers from the school by collecting the money from the villagers (Hilly zone).
o … there was no teamwork before. Now the villagers work together. The villagers listen to the leaders and then get involved in activities together such as digging the canals and clearing the road (Hilly zone).
o … the villagers are becoming united as they gather so often to attend meetings. Everyone gets involved in activities such as repairing of roads, community social occasions of joy and grief, etc. (Dry zone).
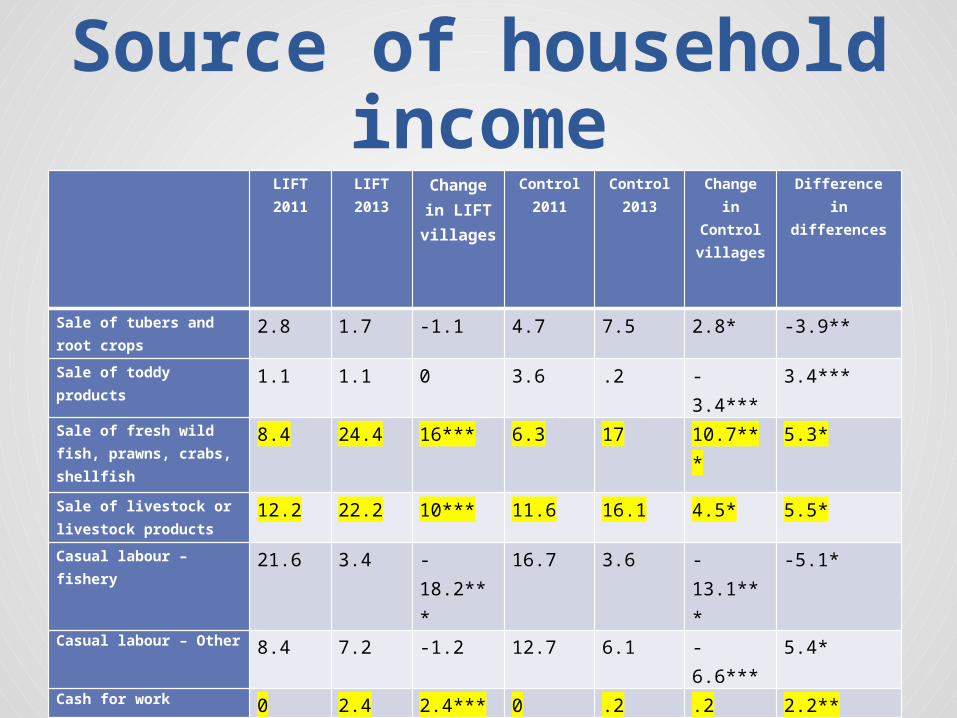
Source of household income
LIFT 2011
LIFT 2013
Change in LIFT villages
Control 2011
Control 2013
Change in
Control villages
Difference in differences
Sale of tubers and root crops
2.8 1.7 -1.1 4.7 7.5 2.8* -3.9**
Sale of toddy products 1.1 1.1 0 3.6 .2 -3.4*** 3.4***
Sale of fresh wild fish, prawns, crabs, shellfish
8.4 24.4 16*** 6.3 17 10.7*** 5.3*
Sale of livestock or livestock products
12.2 22.2 10*** 11.6 16.1 4.5* 5.5*
Casual labour – fishery
21.6 3.4 -18.2*** 16.7 3.6 -13.1*** -5.1*
Casual labour – Other 8.4 7.2 -1.2 12.7 6.1 -6.6*** 5.4*
Cash for work 0 2.4 2.4*** 0 .2 .2 2.2**
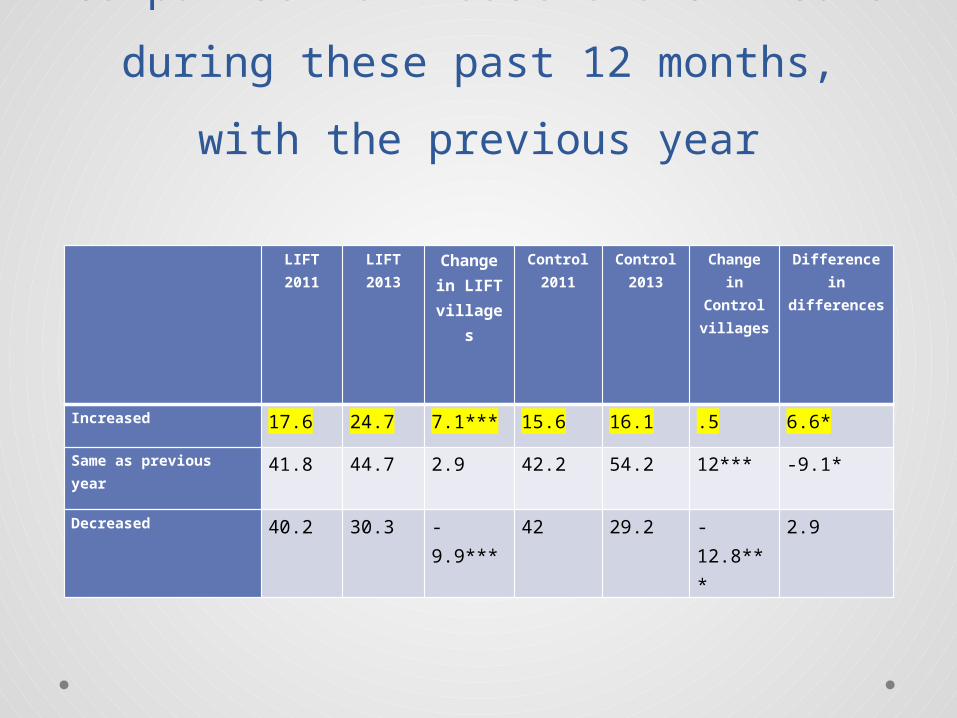
Comparison of household’s income
during these past 12 months, with the
previous year
LIFT 2011
LIFT 2013
Change in LIFT villages
Control 2011
Control 2013
Change in
Control villages
Difference in
differences
Increased 17.6 24.7 7.1*** 15.6 16.1 .5 6.6*
Same as previous year
41.8 44.7 2.9 42.2 54.2 12*** -9.1*
Decreased 40.2 30.3 -9.9*** 42 29.2 -12.8***
2.9
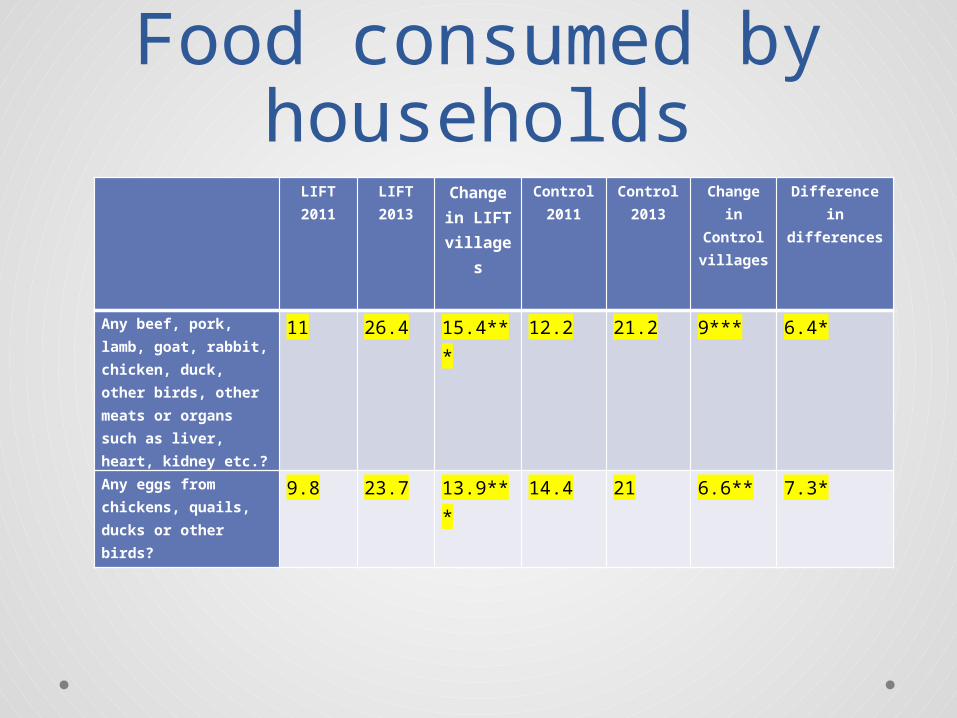
Food consumed by households
LIFT 2011
LIFT 2013
Change in LIFT villages
Control 2011
Control 2013
Change in
Control villages
Difference in
differences
Any beef, pork, lamb, goat, rabbit, chicken, duck, other birds, other meats or organs such as liver, heart, kidney etc.?
11 26.4 15.4*** 12.2 21.2 9*** 6.4*
Any eggs from chickens, quails, ducks or other birds?
9.8 23.7 13.9*** 14.4 21 6.6** 7.3*
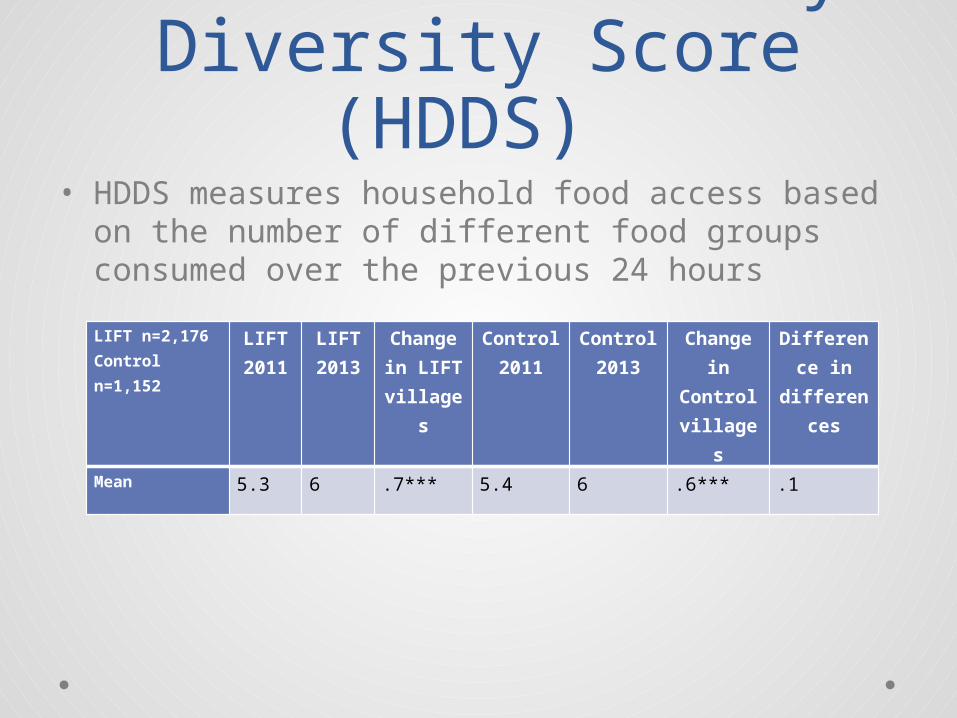
Household Dietary Diversity Score
(HDDS) • HDDS measures household food access based on
the number of different food groups consumed over the previous 24 hours
LIFT n=2,176Control n=1,152
LIFT 2011
LIFT 2013
Change in LIFT villages
Control 2011
Control 2013
Change in
Control villages
Difference in
differences
Mean 5.3 6 .7*** 5.4 6 .6*** .1

Months of adequate household food provision
(MAHFP) LIFT
2011LIFT 2013
Change in LIFT villages
Control
2011
Control 2013
Change in Control villages
Difference in
differences
Had months in the past 12 months with not enough food
75 10.1 -64.9***
71.7 12 -59.7*** -5.2*
How many months0 months 25 89.9 63.3**
*28.3 88 56.6*** 6.7*
1 month 3.8 1.8 -1.9* 5.4 1.2 -4.5*** 2.6
2 months 26.1 5.8 -20.2***
27.8 7.3 -19.7*** -.5

Household Hunger Scale
LIFT 2011
LIFT 2013
Change in LIFT villages
Control 2011
Control 2013
Change in
Control villages
Difference in
differences
Little to no hunger in the household
92.6 99.1 6.5*** 94.2 99.3 5.1*** 1.4
Moderate hunger in the household
6.3 .7 -5.6*** 4.6 .7 -3.9*** -1.7
Severe hunger in the household
1.1 .2 -.9* 1.2 0 -1.2* .3

Coping strategies by changing the diet
In the past 4 weeks LIFT 2011
LIFT 2013
Change in LIFT villages
Control 2011
Control 2013
Change in
Control villages
Difference in
differences
Did your family reduce the size and/or number of meals eaten in a day because there was not enough food to eat?
Never 74.4 94.2 19.8*** 81.6 93.9 12.3*** 7.5*
Did your family change the family diet to cheaper or less-preferred foods, in order to have enough food to eat?
Never 38.2 66.1 27.9*** 52.3 66.1 13.8*** 14.1***

Comparison of household food availability
from all sources in the past 12 months with
the previous year
LIFT 2011
LIFT 2013
Change in LIFT villages
Control 2011
Control 2013
Change in
Control villages
Difference in
differences
Increased 13.6 23 9.4*** 12.2 13.5 1.3 8.1**
Same as previous year
52.3 53 -.7 59.9 60.4 -.5 .2
Decreased 33.4 23.3 -10.1***
27.6 25.9 1.7 -8.4**
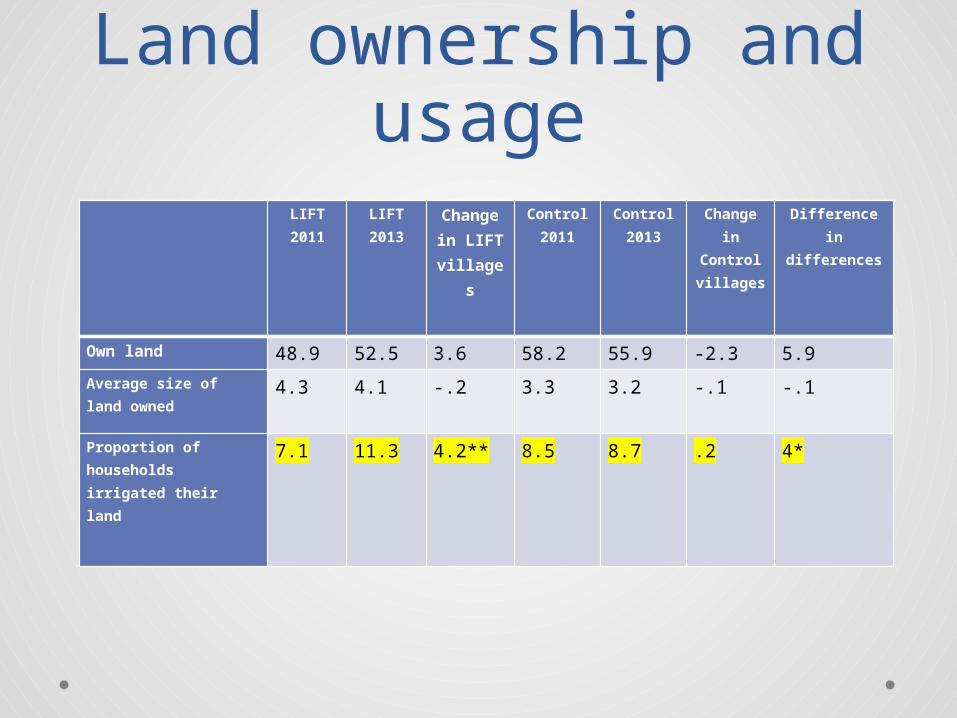
Land ownership and usage
LIFT 2011
LIFT 2013
Change in LIFT villages
Control 2011
Control 2013
Change in
Control villages
Difference in
differences
Own land 48.9 52.5 3.6 58.2 55.9 -2.3 5.9
Average size of land owned
4.3 4.1 -.2 3.3 3.2 -.1 -.1
Proportion of households irrigated their land
7.1 11.3 4.2** 8.5 8.7 .2 4*

Crop yield comparisons
LIFT 2011
LIFT 2013
Change in LIFT villages
Control 2011
Control 2013
Change in
Control villages
Difference in
differences
Crop yield compared with your average monsoon season (n=1,634)
Better 21.9 24 2.1 17.5 20.6 3.1 -1Same 40.9 34.9 -6* 42.3 28.5 -13.8** 7.8Worse 37.2 41 3.8 40.2 50.9 10.7* -6.9*

Constraints to crop production
LIFT 2011
LIFT 2013
Change in LIFT
villages
Control 2011
Control 2013
Change in
Control villages
Difference in
differences
Lack of money to buy the necessary inputs (or lack of credit)
27 12.1 -14.9***
26.6 13.9 -12.7***
-2.2
Lack of land 5.3 9.2 3.9*** 8.3 7.6 -.7 4.6*Lack of household labour
8.1 9.4 1.3 5.9 11.6 5.7** -4.4*
Lack of pesticides in the village
6.3 .6 -5.7*** 8.5 1 -7.5*** 1.8
Low prices for the agricultural crops grown
1.5 4.2 2.7*** 2.3 2.8 -.5 2.2**
Bad/unreliable weather
16.7 26.3 9.6*** 19.4 26 6.6* 3
Soil acidity 0 .2 .2 0 1.2 1.2* -1*

Credit LIFT
2011LIFT 2013
Change in LIFT villages
Control 2011
Control 2013
Change in
Control villages
Difference in
differences
Proportion of households that took out a loan in the last 12 months
85 84.4 -.6 83.3 79 -4.3 3.7
The money came from
Micro-credit provider (interest, 2.5% or less)
19.6 35.3 15.7***
18.3 20.7 2.4 13.3***
Village Savings and Loans Association
8.4 3.4 -5*** 7.9 4.8 -3.1 -1.9*
Farmers Association/Cooperative
1.5 2.5 1 2.7 .9 -1.8* 2.8*
Government 14.7 26.3 11.6***
16.5 22 5.5* 6.1*
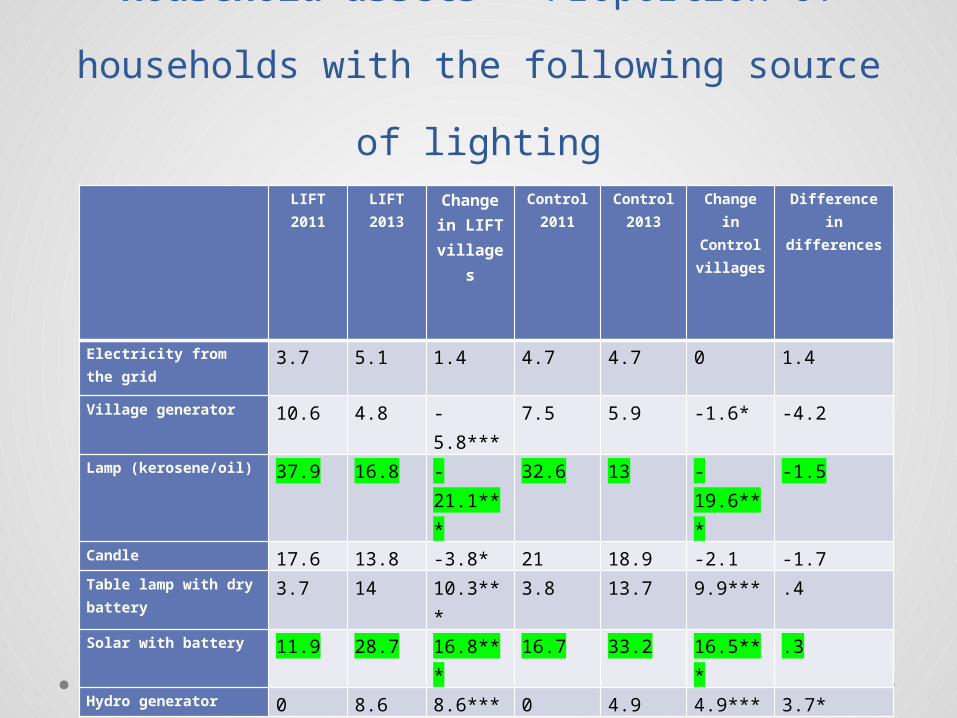
Household assets - Proportion of
households with the following source of
lighting LIFT
2011LIFT 2013
Change in LIFT villages
Control 2011
Control 2013
Change in
Control villages
Difference in
differences
Electricity from the grid
3.7 5.1 1.4 4.7 4.7 0 1.4
Village generator 10.6 4.8 -5.8*** 7.5 5.9 -1.6* -4.2Lamp (kerosene/oil) 37.9 16.8 -
21.1***32.6 13 -
19.6***-1.5
Candle 17.6 13.8 -3.8* 21 18.9 -2.1 -1.7Table lamp with dry battery
3.7 14 10.3*** 3.8 13.7 9.9*** .4
Solar with battery 11.9 28.7 16.8*** 16.7 33.2 16.5*** .3Hydro generator 0 8.6 8.6*** 0 4.9 4.9*** 3.7*

Proportion of households being trained
LIFT 2011
LIFT 2013
Change in LIFT villages
Control 2011
Control 2013
Change in
Control villages
Difference in
differences
Crop production 8.9 15.6 6.7*** 3 .5 -2.5** 9.2***
Livestock 6.5 7.4 .9 4.5 .7 -3.8*** 4.7*
Fisheries .7 .7 0 1.6 .2 -1.4* 1.4*
Other vocational/livelihood skill
4.3 6.7 2.4* 2.8 .2 -2.6*** 5**

Household water supply rainy season#
Hilly Dry Coastal LIFT Control Total
Piped water into dwelling 10.9***
.5*** .1*** 4.4* 2.3* 3.8
Piped water to yard/plot 9.7*** 1.9*** 0*** 3.4* 5.3* 3.9
Tube well/borehole 4.7*** 42.4***
0*** 17.2***
11.5*** 15.8
Protected dug well 20.6***
13.6***
7.2*** 13.4 15.1 13.8
Unprotected dug well 5.2*** 2.1*** .5*** 2.3* 3.6* 2.6
Protected spring 25.7***
2.6*** .3*** 9.3 10.5 9.6
Unprotected spring 9*** .6*** .2*** 4*** 1.3*** 3.3
Rainwater collection 6.2*** 8.1*** 82.5*** 31.8 32.8 32
Surface water 2.8*** 25.9***
9.3*** 11.8* 15.5* 12.7

Cleaning the water# Hilly Dry Coastal LIFT Control Total
Proportion of households treating water to make it drinkable (n=3,200)
74*** 97.9***
99.1*** 91.3** 87.5** 90.3
How they clean the water (n=2,890)
Boil 76.9***
75.5***
47.9*** 65.5 67 65.9
Add bleach/chlorine/iodine .1*** .3*** 1.5*** .9* .1* .7
Strain it through a cloth 33.2***
71.2***
88.1*** 64.1***
75.6*** 66.9
Use a water filter 1.3*** 22.9***
6.8*** 12.6***
6.4*** 11.1
Let it stand and settle 23.2***
4.3*** 24.5*** 17.1 15.7 16.8
Aluminium 0*** .8*** 3.9*** 2.1** .3** 1.7

Proportion of villages by zone facing water
shortages by month
Jan Feb March Apr May June July Aug Sep Oct Nov Dec0
20
40
60
80
100
6
14.9
59.7
77.6
65.7
28.4
4.5 3 1.5 0 0 1.5
9
23.9
41.8
50.7
44.8
26.9
6 4.50 0 0
30
6.1
47
56.1
36.4
4.50 0 0 0 0 0
Hilly
Dry
Coastal/Delta

Prevalence of underweight children aged 0-60 months by age
groups (22% were moderately or severely underweight)
(0-5) (6-11) (12-23) (24-35) (36-47) (48-60)0
5
10
15
20
25
30
35
7.9
14.5
25.527.1
21.8
24
5
11.4
19.9
24.5
27.5
33.3
6.5
13.1
22.7
25.824.6
28.3
Males
Females
Total
Age in months
%
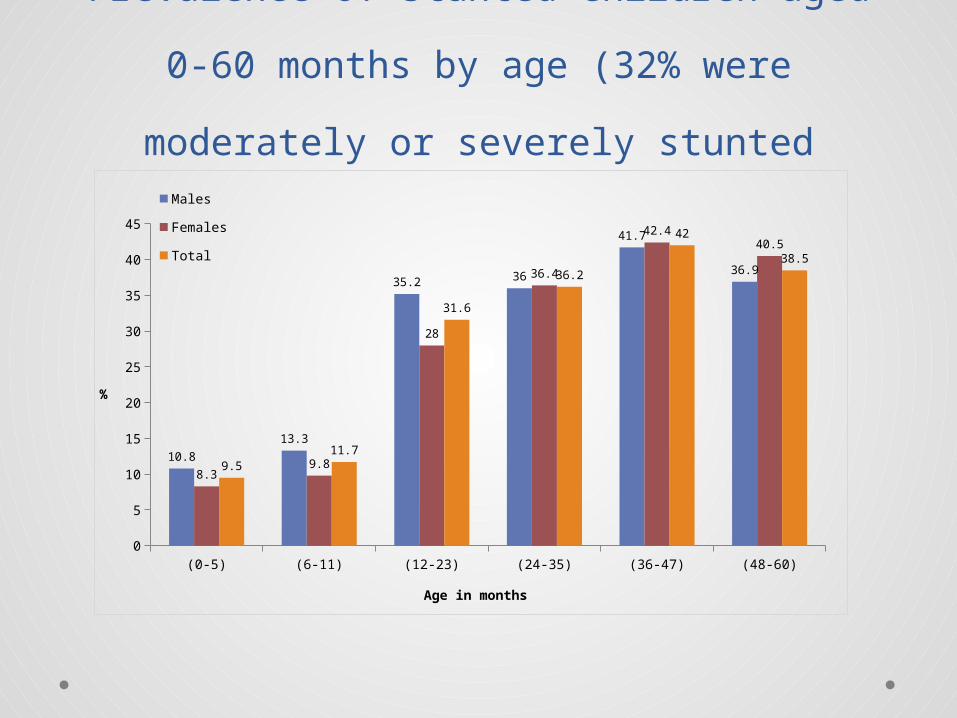
Prevalence of stunted children aged 0-60
months by age (32% were moderately or
severely stunted
(0-5) (6-11) (12-23) (24-35) (36-47) (48-60)0
5
10
15
20
25
30
35
40
45
10.8
13.3
35.2 36
41.7
36.9
8.39.8
28
36.4
42.440.5
9.511.7
31.6
36.2
42
38.5
Males
Females
Total
Age in months
%

Prevalence of wasted children (weight for
height)• 7 per cent of children under 5 years of age
showed signs of moderate and severe wasting• Defined as less than 2 SDs below the median

Children 6 months and under being breastfed
(n=489) Hilly Dry Coastal LIFT Control Total
Is being breast fed 98.5 100 97.2 99.4* 96.2* 98.6
Breastfeeding with no solids
0 months 95.7 100 100 97.4 100 97.9
1 month 88 90.9 92 96* 77.3* 90.3
2 months 89.5 78.3 82.6 86.7 75 83.1
3 months 80 76 88.9 78.9 85.7 80.8
4 months 54.1 54.2 78.6 64.2 45.5 58.7
5 months 52.8 42.9 63.6 55.4 42.9 53.2
6 months 40 30.4 20.8 32 27.3 30.6
Total proportion of babies 0-6 months being breastfed without solids
68.7 64.6 73.2 71.1 62.6 68.8

Proportion of children with
diarrhoea in the last two weeks
(n=4,067)
Hilly Dry Coastal LIFT Control Total
Children with diarrhoea in the last two weeks
19.8*** 12*** 11.9*** 15.1 15.2 15.1
Children with diarrhoea in households which did clean their water
19.6 11.8 11.9 14.6** 14.5 14.5**
Children in households which did NOT clean their water
20.4 16.3 12.5 19.8** 19.4 19.7**

Individual dietary diversity, minimum dietary diversity
score for 6-23 month children
Number of food groups Hilly Dry Coastal LIFT Control Total
Poor (3 or less) 73.6*** 63.7*** 57.1*** 66.9* 61.8* 65.6
Acceptable (greater than 4) 26.4*** 36.3*** 42.9*** 33.1* 38.2* 34.4
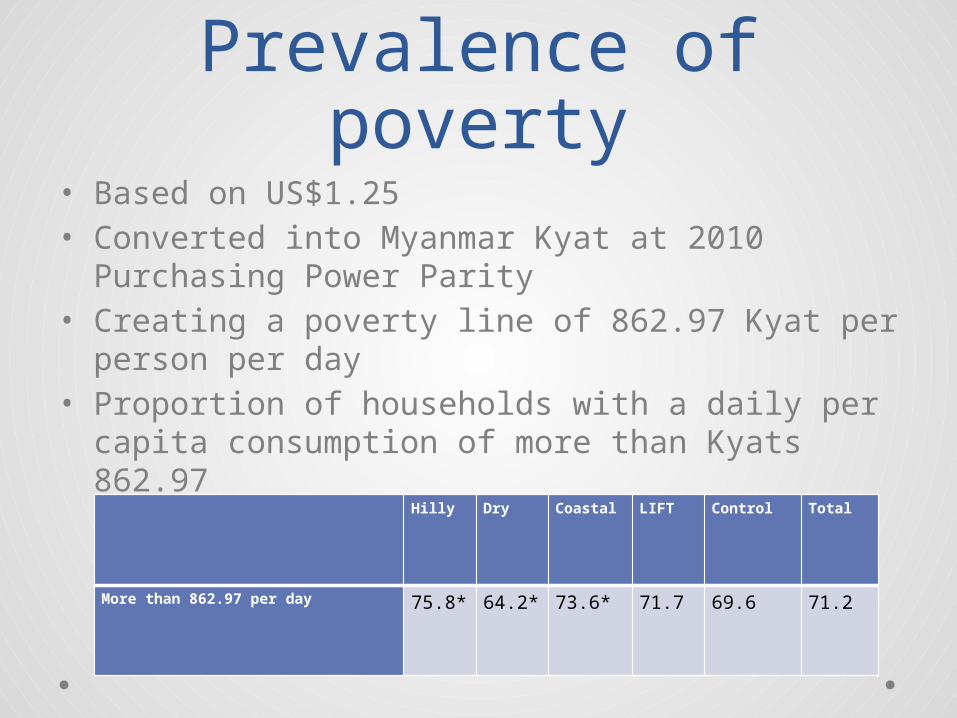
Prevalence of poverty• Based on US$1.25• Converted into Myanmar Kyat at 2010 Purchasing
Power Parity• Creating a poverty line of 862.97 Kyat per person
per day• Proportion of households with a daily per capita
consumption of more than Kyats 862.97
Hilly Dry Coastal LIFT Control Total
More than 862.97 per day 75.8* 64.2* 73.6* 71.7 69.6 71.2

LIFT Control Hilly Dry Coastal Total
Total (Kyat) 1379.93 1340.37 1500.82 1157.4 1453.13 1370.04
Pulses, beans, nuts and seeds 3.2 3.1 3.4 4.8 1.7 3.2Meat, dairy, eggs 7.5 6.8 7.4 6.4 7.9 7.3Fish and other seafood 5.6 7.3 2.7 4.7 10.5 6.0Roots and tubers 1.0 1.1 1.5 0.6 0.9 1.0Vegetables 6.8 6.5 7.9 7.9 4.5 6.7Fruits 1.9 2.0 1.5 2.1 2.2 2.0Spices and condiments 4.7 5.3 4.4 5.1 5.1 4.8Other food products 1.7 1.6 1.7 1.1 2.1 1.7Alcoholic beverages 1.1 1.5 1.8 1.0 0.7 1.2Food and beverages 1.4 1.0 1.0 0.4 2.4 1.3Rice and cereals 14.5 16.0 14.8 16.5 13.6 14.9Oil and fats 3.4 3.1 2.9 5.0 2.3 3.3Milk products 0.8 0.2 1.4 0.0 0.2 0.6Other food items 2.2 2.3 1.6 1.5 3.5 2.2Energy for household use 5.5 4.9 5.7 3.1 6.7 5.3Water 0.6 0.4 0.2 0.7 0.9 0.6Personal apparel 2.9 2.8 2.6 3.2 2.9 2.9Medicines 3.5 3.4 1.9 3.9 4.8 3.5Local transport 1.7 2.0 1.7 1.3 2.3 1.8Other non-food items 2.0 1.8 1.3 1.6 3.0 2.0Clothing and other apparel 3.7 2.4 3.0 3.8 3.4 3.3Home equipment 0.5 0.3 0.3 0.4 0.5 0.4Housing 7.7 8.4 10.3 9.2 4.2 7.9Health 2.6 3.0 2.0 3.7 2.7 2.7Education 1.9 2.1 2.5 1.5 1.7 1.9Travel/trips 0.5 0.3 0.3 0.3 0.8 0.5Other 1.3 1.5 0.4 2.8 1.1 1.3Assets 9.9 8.8 13.6 7.4 7.3 9.7