Embed Size (px)
DESCRIPTION
FR AN CE vs EN GLA ND : match of observer data. What does it tell us about fishing selectivity at the community scale ?. Laurence Fauconnet PhD student - Ifremer Nantes Amédée – Rennes – 27 mars 2014. PhD supervisor: Marie-Joëlle Rochet, Verena Trenkel CEFAS supervisor: Tom Catchpole. - PowerPoint PPT Presentation
Citation preview

Laurence FauconnetLaurence Fauconnet
PhD student - Ifremer Nantes
Amédée – Rennes – 27 mars 2014Amédée – Rennes – 27 mars 2014PhD supervisor: Marie-Joëlle Rochet, Verena Trenkel
CEFAS supervisor: Tom Catchpole
FRFRANANCECE vsvs ENENGLAGLANDND: : match of observer data. match of observer data.
What does it tell us about fishing What does it tell us about fishing selectivity at the community scale?selectivity at the community scale?

OutlineOutline
1. France VS England: match of observer data
2. Objectives: what can it tell us on fishing selectivity at the community level?
3. Example in the Bay of Biscay

1.1. France VS England:France VS England:match of observer datamatch of observer data
A. Comparison of the English and French observer programmes: Can we combine data? What are the assumptions?
B. How to combine the English and French observer data?

A.A. Comparison of Comparison of observerobserver programmesprogrammes
Observer programmes
Samplingplan
Vessellists
Contacts monitoring
Data collected onboard
Database
Data collected onboard
Raising
procedure

Main differences: Main differences: sampling plansampling plan
Sampling plan
Technical stratification
Groups of gear type and vessel size
Groups of métiers level 5 DCF
Observer effort allocation
(no of trips)
Given no of days converted to no of trips
Compromise precision - regulations - resources
Vessel list
Stratification 1 per quarter 1 per year
Vessel allocation 1 vessel per strata1 vessel can be in
several strata

Main differences: Main differences: contacts with fisherscontacts with fishers
Contact monitoring
Selection of vessel Random Opportunistic
Financial indemnification
Yes No
Possible to use for enforcement
Yes No
Feedback to fishers
No, only if asked after trip
After trip, quarterly + annually

Main differences: Main differences: datadata
Data collected onboard
Target species Trip level Haul level
Sampling coverageBetween 70 and 75% of
fishing operationsBetween 35 and 50% of
fishing operations
Non-sampled fishing operations
No dataLandings: species,
number, weight
Sampled fishing operations
Landings and discards: numbers, volumes and
lengths
Landings and discards: numbers, weights and
lengths
Biological samplesOtholiths + maturity on
discards of listed commercial species
None

Main differences: Main differences: data qualitydata quality
Observers
Type of contract Mainly staff of institute Mainly contractants
Staff turnover Low High
Training 6+ weeks 2 weeks
Quality control trips
Yes No
Database
Species 3 letters codes Scientific names
Quality checks No procedure Several ongoing

B.B. How to combine How to combine both datasets?both datasets?
Formating under common format (COST)
For English data, numbers at length to be converted in weight using length-weight relationships
For French data, convert target species from haul to trip level to compare with English data
Check for uniformity in species identification and grouping when necessary ; check for uniformity of measurement types and conversion when necessary
Under progress…Under progress…

2.2. ObjectivesObjectives
In the English Channel,
i. What are the total fishing pressures at the community scale?
ii. How to characterize /measure the fishing selectivity?
Total catch = landings + DISCARDS
All species (fish + commercial invertebrates)
By a combination of fishing gears deployed in an area

The contact-selection curve is the probability that a fish of length l is captured given that it contacted the gear.
Millar & Fryer, 1999 => 3 definitions of size selection each differing in the population being selected from:
Selectivity: Selectivity: a matter of referencea matter of reference
The available-selection curve is the probability that a fish of length l is captured given that it was available to (but possibly avoided) the gear.
The population-selection curve is the probability that a fish of length l from the population is captured.

Population Available individuals
Unavailable individuals
Contact with gear
Avoidance of gear
Catch
Escapment from gear
Landings
Discards
Size selectionSize selection

Population 2
Population 3…
UTILIZATION
CONTACT
AVAILABLE
POPULATION
COMMUNITY
Community
Available species:
Unavailable species
Population 1 Available
individualsContact
with gearCatch Landings
Unavailable individuals
Avoidance of gear Discards
Escapment from gear
Different extentsDifferent extents

Three perspectivesThree perspectives Ecosystem = probability of catching individuals of length l of
one species s (population) or all species (community) by all gears deployed in a given area
Technology = probability of catching individuals of length l of one species s by a gear, in the surrounding environment of the gear (available) or once it contacted the gear (contact)
Utilization = decision of keeping and landing or discarding the catch once onboard
ScaleEcosystem perspective
Technology perspective
Utilization perspective
Organi-sation
ecosystem fishing operation fishing sector
Spatialregion
(103 – 106 km²)swept/soak area (10–3 – 10–1 km²)
local to global
Temporal decade hour – day week – month

More or less selective? More or less selective?
Targeting efficiency:
match the catch with the target
avoid bycatch
Bundy et al., 2005
Extraction from community:
achieve a dominated catch
avoid a diverse catch
Years
Dis
card
ed f
ract
ion
Dubé et al., 2012
Optimization of utilization:
match the landings with the catch
avoid what is not suitable to land
Depend on focusDepend on focus

3.3. Example Example in the Bay of Biscayin the Bay of Biscay
Comparison of
selectivity:– Between gears– Between sites
LOCAL scale
Bay of Biscay

Southern Bay of Biscay
Gironde river
Adour riverCapbreton canyon
Case studyCase study

Selectivity metricsSelectivity metrics
Focus Type Metric Description
What is extracted
from community
Species
Richness (S) Number of species
Evenness (E1/D) Abundance distribution across species (Simpson)
What is extracted
from community
Length
Mean length (Ḹ)Typical length of individuals
in the catch
Length range width (ΔL)
Interpercentile range 5-95% of length structure
What is used from catch
Utiliza-tion
Discard weight ratio (DWR)
Proportion of the catch unused
Discard number ratio (DNR)
Comp DWR - are discards smaller than landings?
Mea
n le
ngth
Sample size (no of hauls)
Med
ian
no o
f ind
. per
hau
l
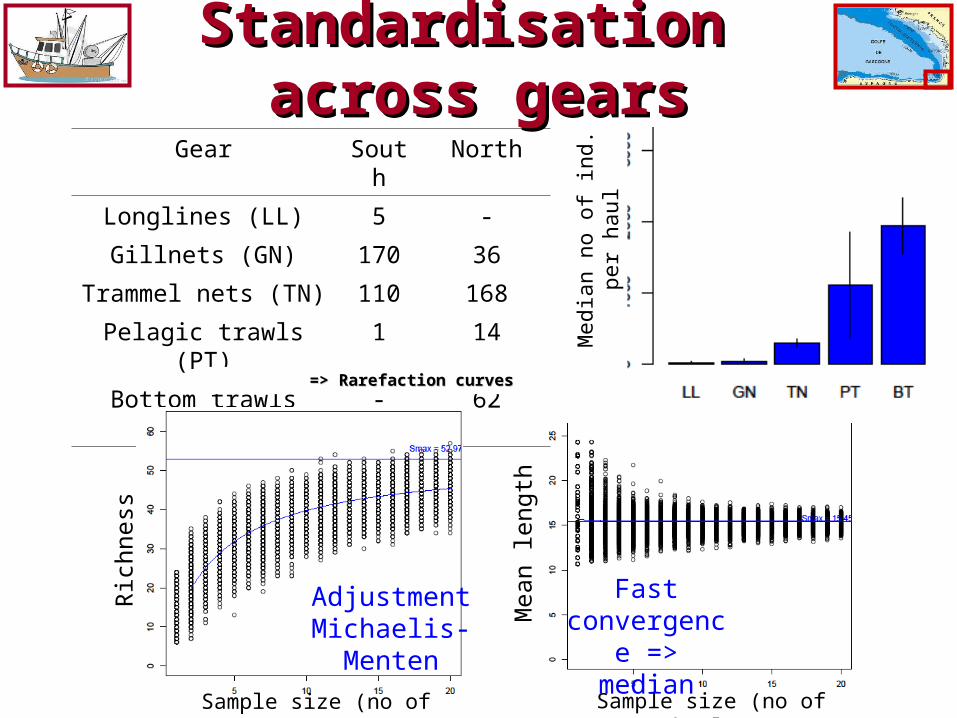
Standardisation Standardisation across gearsacross gears
Fast convergence => median
Gear South North
Longlines (LL) 5 -
Gillnets (GN) 170 36
Trammel nets (TN) 110 168
Pelagic trawls (PT) 1 14
Bottom trawls (BT) - 62
Sample size (no of hauls)
Ric
hnes
s
Adjustment Michaelis-
Menten
=> Rarefaction curves=> Rarefaction curves

South
North
Dis
card
wei
ght
rat
io (
%)
Metric % variance gear % variance site
Richness 69 8
Evenness 52 2
Mean length 92 2
Length range width 76 15
Discard weight ratio 83 7
Discard number ratio 90 0.2
Gear / site effectsGear / site effects

between gears
Passive
Active
Comparison of selectivityComparison of selectivity
specie
s
length
between sites

Conclusions Conclusions Selectivity metricsA few samples are enough to estimate length and utilization metricsLength and utilization metrics more sensitive to gear than species metrics
Gear comparisonSignificant differences in selectivity between gearsPassive vs active not the gear characteristic that influences selectivity the
most
Site comparisonDifferences in selectivity between sites, especially in length
Depend on focus…

PerspectivesPerspectives
Apply to regional scale in the English Channel
More precise stratification– Quarter – Gear + target species
Add metrics to better characterize extraction from ecosystem, in trophic chain for example
Raising to the fleet level to get the whole pressures

Acknowledgements
Contact: [email protected]
All observers and fishers who participate in both observer programmes
Any questionsAny questions??