Embed Size (px)
Citation preview

Lawrence Berkeley National LaboratoryLawrence Berkeley National LaboratoryEnvironmental Energy Technologies DivisionEnvironmental Energy Technologies Division
(EETD)(EETD)
Saving Energy and Improving Saving Energy and Improving Environmental QualityEnvironmental Quality
William J. FiskWilliam J. FiskActing Division DirectorActing Division Director

US Department of Energy
National Laboratory System
Lawrence Berkeley National Laboratory~4000 Employees
Managed by the University of California
Environmental Energy Technologies Division~400 Employees, 5 Departments
Energy and Environment ResearchPrimary Sponsors: Federal and State Agencies
What is the Environmental Energy Technologies Division?

Berkeley Lab’s New Scientific
Directions Scientific Computing Advanced Scientific Computing Research
Ultrafast ScienceBasic Energy
Sciences
Matter and Energy in the Universe
High Energy Physics
Nano-Bio FrontierBasic Energy SciencesSolar to Chemical
EnergyBasic Energy Sciences
-1000 -500 0 500 1000 0
.2
.4
.6
.8
1.0
01234
-4-3-2-1
time (fs)
x/ x
-1000 -500 0 500 1000 0
.2
.4
.6
.8
1.0
01234
-4-3-2-1
time (fs)
x/ x
Quantitative Biology Biological and
Environmental Research
New Energy Systems and Environmental Solutions
Energy Efficiency and Environmental Research

Prior Impacts of EETD’s Efficiency R&DPrior Impacts of EETD’s Efficiency R&DFrom National Academy of Sciences ReportFrom National Academy of Sciences Report
• Primary energy savings = 9% of 2025 residential energy use
• Carbon reductions in 2025= 132 million metric tons CO2/year
NAS estimate of economic benefits of EE R&D assigns $23 of $30 billion in savings to LBNL - derived technologies
Additional $48 billion in savings from energy efficiency standards for 9 residential products

Aerosol duct sealer
An energy- efficient and safe torchiére lighting
fixtureBerkeley Lamp
Low- emission burner for heating and power
Low energy fume hood
Improved Energy TechnologiesImproved Energy Technologies

Assisted China in: • Transformation of refrigeration
and lighting industries• Appliance standards• Building energy standards• Iron & steel industry efficiency• Motor systems
Intergovernmental Panel on Climate Change• Significant contributions to
reports
• Real time monitoring tools
Electricity reliability
Reducing standby power losses• U.S. executive order• International 1-watt
guideline
China energy efficiency policies
• Energy Efficiency in Federal Acquisition Regulations
• Federal Energy Management guidelines
Federal procurement
“OFF” – 17 Watts ON - 21 Watts
Energy Impacts Energy Impacts (cont.)(cont.)

Widely Used EETD-Developed Simulation ToolsWidely Used EETD-Developed Simulation Tools
• DOE-2— Building energy simulation program widely used
for building design and energy performance compliance with standards
• EnergyPlus— Next generation of building energy simulation
program with expanded capabilities and flexibility• Radiance
— Program for predicting and rendering lighting environments, used for lighting system design
• Window— WINDOW 5.2 is a publicly available computer
program for calculating total window thermal performance indices
• Home Energy Saver— Web-based tool to guide selection of energy
efficiency technologies by homeowners• CalTOX
— a risk assessment model that calculates chemical emissions and concentrations and the risk of an adverse health effects

Understanding and Improving Understanding and Improving Indoor Air Quality (IAQ)Indoor Air Quality (IAQ)
Source: Fisk Annual Rev. E&E 2000
LBNL’s leadership role in IAQ Research
• Characterizing indoor pollutant sources
• Identifying risk factors and health effects
• Evaluating and demonstrating energy efficient technologies and practices for improving IAQ
Potential Health Improvements from Better IAQ

Affordable Energy-Efficient Provision of Affordable Energy-Efficient Provision of Clean Water for The Developing World Clean Water for The Developing World
• Appropriate low-cost technology provides water for less than $2 per person per year
• Now serving populations in Mexico, India, Philippines, Ghana, South Africa and elsewhere
UV Waterworks
• 25% of the world’s population lacks access to safe water
• 60 million children suffer from stunted growth or development due to water borne disease
• 4 million deaths/year in developing world from polluted drinking water

Examples of EETD’s Ongoing Examples of EETD’s Ongoing Energy Research Energy Research
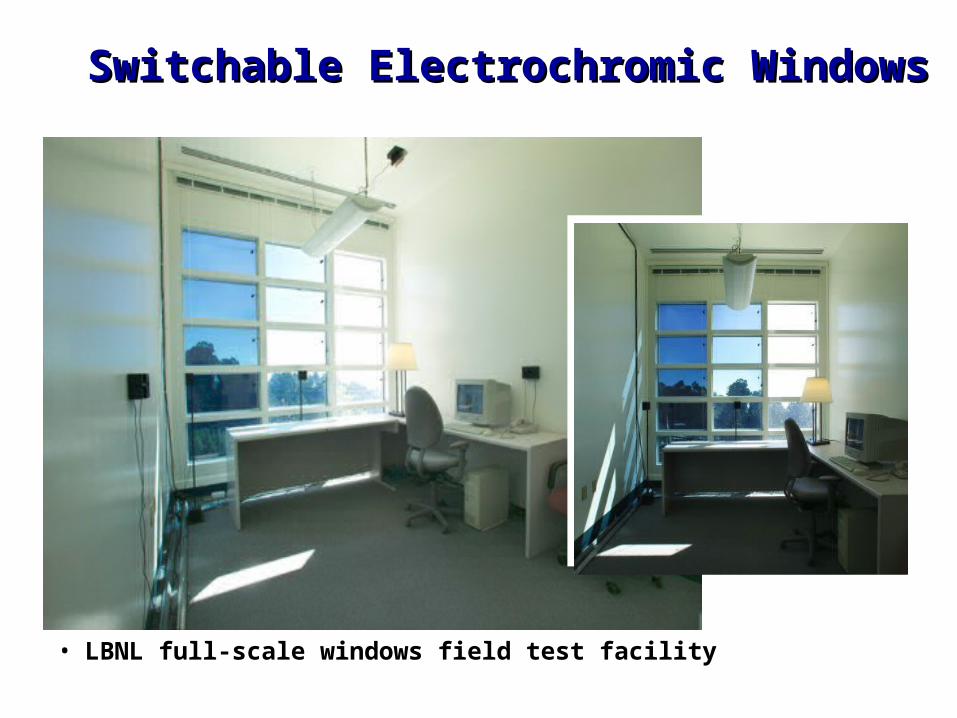
Switchable Electrochromic WindowsSwitchable Electrochromic Windows
• LBNL full-scale windows field test facility

Solid State Lighting: The Next Generation of Solid State Lighting: The Next Generation of Energy Efficient Lighting ProductsEnergy Efficient Lighting Products
• Goal:—Contribute unique expertise to
development of solid state lighting technology
• Significance:—Lighting represents 30% of the total
electric energy used within residential and commercial buildings.
—Solid state lighting could cut lighting energy use in half
Luminous woven materials

High Power Lithium-Ion BatteriesHigh Power Lithium-Ion Batteries
Microscopic images of electrodesMicroscopic images of electrodes
• Color-coded images reveal how electrode surface chemistry changes during battery tests
Loss of conductive carbon contributes to unwanted battery power loss
Discovering causes of battery power loss in hybrid electric vehiclesDiscovering causes of battery power loss in hybrid electric vehicles
10 m LiNi0.8Co0.15Al0.05O2 graphite acetylene black
Fresh cathode Failed cathode
• Hybrid EVs are entering the market, and lithium-ion is poised to become the preferred battery technology
Higher power & energy, longer life, and similar cost, compared to Ni/MH
• EETD researchers are addressing key issues to advance lithium-ion technology

Fuel Cells for Transportation Fuel Cells for Transportation ApplicationsApplications
• Research Areas:— Novel catalyst layer:
microstructures to reduce Pt loading (cost issue)
— Nanostructured membranes
— New diagnostic methods to help develop advanced hydride materials
— Modeling of fuel cell components
• Proton-exchange membrane fuel cells are favored for future transportation— Benign emissions, non-petroleum fuel, good performance, rapid refueling— Require lower cost, greater durability, hydrogen storage, infrastructure, and
production

Zero-Energy Commercial BuildingsZero-Energy Commercial BuildingsBackground
• The buildings sector accounts for about 40% of total U.S. energy consumption
• Approximately half of that is from commercial buildings.
• The commercial sector is the fastest growing energy end-use sector
Goals• EETD is partnering with Alliance to Save Energy, AIA, ASHRAE, World
Business Council for Sustainable Development to define and propose a major initiative to:
Stimulate measurement and disclosure of the energy performance of buildings
Develop and demonstrate scaleable and replicable building energy system solution packages
Develop a strategy for sector-wide building transformation

Water and EnergyWater and Energy
• Goals: identify cost-effective ways to: — Increase energy efficiency of water delivery
— Reduce waste of water
• Significance:— 7% of world energy is for delivering water
• 50-60% of some municipal electricity bills is for water
— U.S. freshwater withdrawals:• 38% thermoelectric power (recycled and reused)• 39% irrigation • 19% commercial, industrial, residential
— Serious and growing water availability problems – in U.S. and worldwide
• As in energy efficiency, technology can play a major role in reducing water use; behavior may be more important for water
EnergyEnergy
WaterWater

Reducing Data Center Energy ConsumptionReducing Data Center Energy Consumption
• Google warns “Power could cost more than servers”
• LBNL’s supercomputer center expects 7 fold increase in electricity demand over 10 years
Research areas• Understanding how energy is
used in data centers
• Efficient power supplies
• Efficient computer cooling strategies
• Real time monitoring and control
• Use of outdoor air for free cooling
• Power efficient algorithms
Energy Demands at Data Centers and Super Computer Centers are Growing Rapidly

• Demonstrates large electricity sheds can take place without complaints
• Demonstrates range of strategies to produce electricity sheds and capabilities needed
• Provides knowledge and experience needed for related policies and building codes
Fully Automated Electricity Demand ResponseFully Automated Electricity Demand Response
0
200
400
600
800
1000
1200
30
0 C
Ma
ll
Alb
ert
sons
B o
f A
Ca
l EP
A
CIS
CO
50 D
ou
gla
s
Su
mm
it C
tr
Ech
elon
450
GG
NA
RA
OF
B
OS
Isof
t
Ro
che
UC
SB
US
PS
Ma
x S
he
d k
W o
f Te
st P
eri
od
(3
Ho
urs
)
8-Sep 21-Sep 13-Oct 5-Nov
0
500
1000
1500
2000
2500
3000
3500
4000
4500
To
tal
Ma
xim
um
Aggregated Demand Saving, Sept 8th
0
1000
2000
3000
4000
5000
6000
7000
0:00
1:00
2:00
3:00
4:00
5:00
6:00
7:00
8:00
9:00
10:0
0
11:0
0
12:0
0
13:0
0
14:0
0
15:0
0
16:0
0
17:0
0
18:0
0
19:0
0
20:0
0
21:0
0
22:0
0
23:0
0
Dem
and
[kW
]
Albertsons B of A (B) OFB Roche USCB Total Savings Baseline
LBNL’s Demand Response Center

Monitoring the Electricity Grid to Reduce FailuresMonitoring the Electricity Grid to Reduce Failures
• Problem:—Operators of electricity grid were
unable to analyze the data in close to real time
• Achievements—Created visualization tool to
analyze and display data in real time
—Tool being adopted by all 23 National Electricity Reliability Council Coordinators (covering nation) and by several Independent System Operators
*
*
* Achievements by the Consortium for Electricity Reliability Technology Solutions (CERTS) led by LBNL
• Background: —Massive amounts of real time data collected about electricity
flows on U.S. transmission grids

Climate Effects of AerosolsClimate Effects of Aerosols
• Using the Goddard Institute for Space Studies climate model
• Simulations revealed that the heating effects of black carbon result in lower level heating, changes in vertical motions, circulation, and thus cloud cover and rainfall. (Menon et al. Science, 2002)
• Results show that the regional climate effects of BC particles can be quite significant.
With black carbon Precipitation mm/d
Without black carbon Precipitation mm/d

For More InformationFor More Information
http://eetd.lbl.gov/http://eetd.lbl.gov/