Embed Size (px)
Citation preview

Paper ID #34174
Leadership and Communication Network Identification and Analysis withDependency Structure Matrices in Senior Design Teams
Dr. James Righter, The Citadel
James Righter is an Assistant Professor of Mechanical Engineering in the School of Engineering (SOE) atThe Citadel. He earned his BS in Mechanical Engineering at the U.S. Naval Academy, his MS in MilitaryStudies from the Marine Corps University Command and Staff College, and his PhD in Mechanical Engi-neering from Clemson University. His research interests include design methods, engineering leadership,collaborative design, and engineering education.
Prof. Joshua D. Summers, Clemson University
c©American Society for Engineering Education, 2021

Leadership and communication network identification and analysis with
Dependency Structure Matrices in student design teams
Abstract
A case study is presented that explores informal leadership emergence within capstone student
design teams. The study focused on a ten-person, multi-university, multi-disciplinary, two-
semester design project focused on unmanned aircraft solution design and build. This study uses
a sociometric survey instrument to determine perceived leadership and communication
relationships between team members. These relationships are modeled through dependency
structure matrices (DSM) that are then analyzed against various complexity and similarity metrics.
The network analysis illustrates that relationship leadership networks are less dense than the
transitional and action leadership networks. Moreover, communication networks were aligned
more with the transition or action leadership networks at corresponding thresholds. This illustrates
that not all aspects of leadership can be inferred from the communication processes within a design
team.
Introduction
Design is an activity that is routinely conducted within teams. As a result, design is recognized as
a social, a scientific, and a creative process [1], [2]. Teamwork processes are an integral part of
engineering design that affect the development of the product within the context of collaborative
design teams [3]–[5]. Leadership and communication, which are two of these processes, are both
integral parts of the collaborative design environment [6]–[8].
Leadership is of interest in a variety of fields including psychology, management, military studies,
athletics, and engineering [9]–[15]. Leadership can be defined as the characteristics and processes
that enable non-coercive influence [16]. This paper explores these processes through the
performance of specific functions within the design team in order to identify the emergence of
informal leadership networks.
Leadership models have been proposed as early as 2000 years ago [17], [18], however, authors
argue that modern leadership theory development can be traced to the mid-nineteenth century
[18]–[20]. Early theories assumed that leadership was a characteristic endowed in individuals at
birth. Later theories espouse the idea that leadership can be developed and examine this through
various lenses including behavioral and interactional. Table 1 provides a brief overview of
selected leadership theories and their evolution.

Table 1. Leadership theory overview
Theory Reference Contribution
Trait [18], [20] Explored connection of personal
characteristics to leadership
Behavioral [18], [21] Established primary categories or
factors of leadership behaviors
Contingent [20], [22]–[24] Leadership behaviors are not
equally effective in different
situations
Functional [25]–[28] Established specific functions for
leadership
Study leadership vice leaders
Leader-Member
Exchange
[13], [20], [29], [30] Leadership activity is a
relationship between leader and
follower/member
Transformational
Transactional
[12], [31], [32] Explores charismatic leadership
Table 2 provides a summary of the literature related to leadership in engineering design.
Leadership is a part of the collaborative design taxonomy [6], [33] as it is widely recognized as a
main contributor to success (or failure) of product development projects.
Transformational and transactional leadership has been researched in undergraduate engineering
design teams in a case study. The case study used observation to identify the occurrence of
transformational and transactional leaders within the team. Design reviews were used as the
environment for observations. The authors concluded that student novice engineer leadership was
primarily transactional [35]. By observing the activities of team members within design review
meetings, the researchers focused on internal team leadership.
Leadership external to the student design team has been considered in addition to internal
leadership studies. One study investigated the centrality of faculty coaches and graduate advisors
in undergraduate teams [41]. The coaches and advisors are in formally appointed leadership roles,
however, they are not members of the team performing team tasks. The leadership was evaluated
using statements from the multi-factor leadership questionnaire. This questionnaire was developed
to evaluate leaders from the perspective of transformational and transactional leadership.
Communication is an important medium for leadership as much of the influence involved in
leadership must be communicated [20]. Engineering teams use multiple modes of communication
in the process of design and for a variety of intents such as informing and requesting. This team
communication is quantified by its frequency and affected by the proficiency and resources of the
team [33].

Table 2: Examples of Leadership Research in Engineering Design
Type Study Ref Subject Characteristics
Literature
Review
[6], [33] Developed taxonomy of
collaborative design
Collaboration
Case study [34] Developed survey instrument
to study collaboration in
student teams
Communication
and Leadership
Case study [35] Investigated leadership in
design teams
Transformational
and transactional
leadership
Case study [36] Investigated centrality of
faculty coaches and graduate
advisors in engineering
design teams
External
Leadership
structure
Case Study [10] Impact of position of leader
in communication network
on creativity
Communication
and leadership
Case Study and
Simulation
[29] Leadership style on complex
functioning
Leadership Style
Case Study [37] Emergence of cultural
boundary spanners
Boundary
Spanners
Case Study [38] Impact of team
context/environment in
cross-functional, distributed
teams. Suggests effective and
supportive internal and
external leadership important
to effectiveness
Collaboration
and Distributed
teams
Case Study [39] Identifies lack of common
vision as impediment to
success in globally
distributed teams
Distributed
teams
Case Study [40] Establishment of minor
program at University of TN
to address engineering
communication, leadership
and teamwork
Education
A survey instrument has been developed to investigate leadership and communication within
undergraduate design teams. The survey tool specifically identifies leadership styles within design
teams and was intended primarily to be used with undergraduate design teams [34]. This survey

instrument served as the basis of a preliminary case study to understand the leadership structures
in student design teams.
Based on a review of the literature and existing studies on leadership in engineering teams, the gap
addressed by this research follows: a requirement exists to better describe and understand the
emergence and distribution of informal leadership instances within engineering teams.
Specifically, this case study focuses on student design teams. This understanding is intended to
serve as a foundation for further research in protocol studies and for intervention techniques,
although that is beyond the scope of this study.
Establishing Leadership and Communication Networks
Social network analysis has been used to study the dynamics within populations, organizations,
and teams [42]. Networks are established based on known associations between people and
specified activities relating the network’s members, such as common memberships or
communication [43]. Leadership can be explored directly as one of these network relationships
for purposes of elucidating the influence and distribution of leadership [44]. This study uses
functional leadership theory as the basis of the analytical construct to identify leadership behaviors
in design teams. Functional leadership theory is widely used in teams research and can be used to
delineate specific functions according to their purpose within a temporal framework of transition
and action in additional to relationship oriented activities.
Transition phases generally aim to evaluate previous team actions and also to prepare for future
activities in the action phase. Specific leadership activities within transition include composing
the team, setting goals, defining the mission, and developing strategies. Action activities are
directly related to the team’s task work and include functions such as monitor and guide, manage
team boundaries, coordinate efforts and solve problems. Interpersonal or relational activities,
including consideration and empowerment, occur in transition in action phases. A team may be
engaged in transition and action phases concurrently since they are often engaged in multiple tasks
[28].
A variety of techniques and data sources are used to establish these leadership and communications
networks, which once established are used to understand the interactions of members. In this
study, Dependency Structure Matrices, DSMs [45], are used to model the leadership and
communication networks within a undergraduate student design team to better understand where
leadership functions are actually performed within teams. This increased understanding will form
the basis for network comparisons and serve to inform future observational studies and
intervention development. The DSMs are developed and analyzed using the process adapted from
the basic approach in [45], [46]. Researchers provide a construct to develop and analyze
stakeholder value networks using DSMs [46]. Iterations of the process may be used to collect
multiple samples or adjust the study population.
The first step is to identify the subject system boundaries. Even the simplest student design team
can have multiple unique boundaries. The team members alone may comprise the system, or it
may be expanded to include the faculty coach and student advisors. It may also include sponsors
and suppliers, or peer teams working on the same design challenge. In this case study, a capstone
design team with ten members was identified as the system. Capstone design projects provide an

opportunity for students to apply their engineering skills to a design problem in a team setting.
This capstone project serves as a culminating experience to the undergraduate curriculum [47].
Senior engineering students also have been used to represent novice design engineers in cases
study research [48].
The second step is to administer the survey instrument to the team members. The survey
establishes the perception of the performance of specific leadership functions (transition, action,
and interpersonal) between team members. It also establishes the reported frequency of
communication in three different modes (face-to-face), text (email, messaging), and video
conferencing.
Third, DSMs are then established from the survey responses indicating the perceived leadership
and communication networks within the design team. Matrices are established for each leadership
and communication category at each frequency level.
In the final step, matrices are analyzed for social network analysis criteria and further for
complexity comparison.
Leadership and communication case study
A case study was conducted to investigate the distribution of leadership functions in undergraduate
or novice design teams. The case study was selected as a research method because it allows the
study of the team in its natural environment thus enabling the researcher to identify challenges and
trends within this natural context [48]–[50]. A previous study undertaken to explore the impact of
project length on leadership structure, however, suggested that the leadership structures were more
complex than could be determined with the selected approach [51]. A single two-semester design
team with ten members was selected to explore these complex leadership structures with the study
leader serving as a graduate student advisor on the team with a faculty coach. The students were
distributed geographically across three universities. Geographic distribution impacts the means
and ability of teams to communicate and can increase the complexity of team dynamics; however,
distributed teams are common in industry [33], [52]. The team was required to design, build, and
test an unmanned aerial system (UAS) during the course. This is an extension of the AerosPACE
program [53].
Research Questions
The overarching research objective is to gain knowledge of the emergence and distribution of
leadership behaviors in engineering teams to benefit the development of team and leader
interventions. This may specifically benefit design education. The case study is being conducted
to develop an analytical construct to answer the following research question:
Research Question: How are leadership functions distributed in engineering design
teams?
Efforts to answer this research question will seek to determine and describe the distribution of
leadership task performance amongst members within design teams. If the distribution of
leadership functions is wide, then it is possible that the practiced behaviors for students can be
sufficient to meet the learning needs [54]. If there are gaps in the distribution, then educational
interventions might be deployed to fill these experiential gaps.

Survey development
The survey instrument must establish the leader – follower or leader – member relationship of the
respondent to each team member. This will enable the study of the leadership networks and
communication networks within the case team. The survey instrument is based on questions
developed and applied in a previous study of undergraduates [55]. It is also consistent with
network leadership measures in studies with management student participants [56].
The questions will establish each team member’s reliance on other team members for the top tier
of leadership behaviors by phase: transition behaviors, action behaviors, and relational behaviors.
This is representative of the perceived leadership network for the team [55]. The questions are
modified from the original format to limit the time required per survey while still achieving the
desired level of granularity in the data. The original questions establish responses from the
individual behaviors within each top tier or phase. However, the original survey was intended for
teams of four to six members. Given a team of ten members, the time to complete each survey
becomes prohibitive. Initial responses establish that the required survey time is approximately
nine to ten minutes, or one minute per team member evaluated. This aligns with other peer-
evaluation studies on capstone design teams [57]. The survey questions are included as Table 3.
Table 3: Case Study Survey Instrument
To what degree do you rely on John for:
5-Frequently if not always, 4-Fairly often, 3-Once in a while, 2-Sometimes, 1-Never
Planning: identifying main tasks, setting goals, developing
performance strategies for the team? ① ② ③ ④ ⑤
Team action activities: monitor goal progress, coordinating work
efforts, and providing assistance when needed with tasks? ① ② ③ ④ ⑤
Team relations: dealing with personal conflicts, encouraging team
members, keeping emotional balance? ① ② ③ ④ ⑤
How often do you interact with John:
5-Frequently if not always, 4-Fairly often, 3-Once in a while, 2-Sometimes, 1-Never
Face to Face ① ② ③ ④ ⑤
Using text and written communications ① ② ③ ④ ⑤
Using audio or visual communication (telephone, Skype…) ① ② ③ ④ ⑤
Transition activities generally involve assessing previous actions and preparing for future actions.
Action activities are directly related to the team’s task work, while relational functions include
interpersonal behaviors such as consideration [28]. This is representative of the perceived
leadership network for the team [55]. Each question is answered with a value of one through five,
with five being the highest frequency of reliance on the member for leadership. The responses for
questions one through three provide a composite leadership response for the three phases of
transition, action, and interpersonal leadership behaviors. Rather than a peer evaluation, the survey
is merely an evaluation of the performance of specific behaviors with whom the team interact
during the specified time.

Initial survey analysis explores the leadership network based on survey responses. The survey
responses are exported from Qualtrics to Microsoft Excel. An Excel spreadsheet is used to develop
an adjacency matrix that establishes the perceived leadership network for the desired category.
Figure 1 is the matrix representing the responses to survey questions one through three. Each
question is answered with a value of one through five, with five being the highest reliance on the
member for leadership. The responses for questions one through three provide a composite
leadership response for the three phases of transition, action, and interpersonal leadership
behaviors. Participants are clearly instructed that the survey is not a peer evaluation, they are
providing their evaluation of the performance of specific behaviors by team members they
interacted with during the specified time.
Overall Leadership (L1 + L2 +L3)
1 2 3 4 5 6 7 8 9 10
1 11 12 8 8 5 7 8 5 10
2 10 11 6 8 3 4 4 5 10
3 15 15 7 8 9 0 0 5 12
4 11 11 11 9 6 9 6 6 10
5 9 12 12 0 0 0 0 0 12
6 11 11 10 9 9 9 9 10 11
7 12 12 12 12 11 12 12 0 13
8 11 9 9 10 0 9 9 0 12
9 13 9 9 8 6 7 6 6 12
10 11 12 10 4 6 10 4 5 8
Figure 1: Matrix representation for team overall leadership survey responses.
Team Composition and System Boundary
The design group for this study is a distributed team of ten senior design students, which were
selected from three universities based on an algorithm with inputs of technical skills, motivation,
social skills, and leadership skills [58]. The key features of the team and the collaborative
environment using a previously established collaborative design framework are summarized in
Table 4 [33].
Communication is facilitated through a variety of modes given that this distributed construct and
project information is maintained in a central web-based system. Multiple information technology
systems are used in the project team’s communication. The design problem is a variant design,
although this is the first experience designing a UAS for many of the students who are required to
follow a systematic approach to their system design [59]. The team is distributed geographically
as the members are located in three different states. The team is distributed organizationally. Team

members are enrolled in three different universities. Due to the physical separation of the teams
and the different time zones in their institutions, there is also a temporal distribution. The project
is a one academic year project.
Table 4: Study Design Team Details
Taxon Description
Team 10 designers
Distribution
3 universities (2 public, 1 private)
Doctoral granting universities
15-30K undergraduates
Information
Information management,
Sharepoint.
Group permissions.
Communication
Video conference
Group text
Problem Nature Variant (first exposure for many team members)
Design Approach Systems engineering design process
DSM Construction
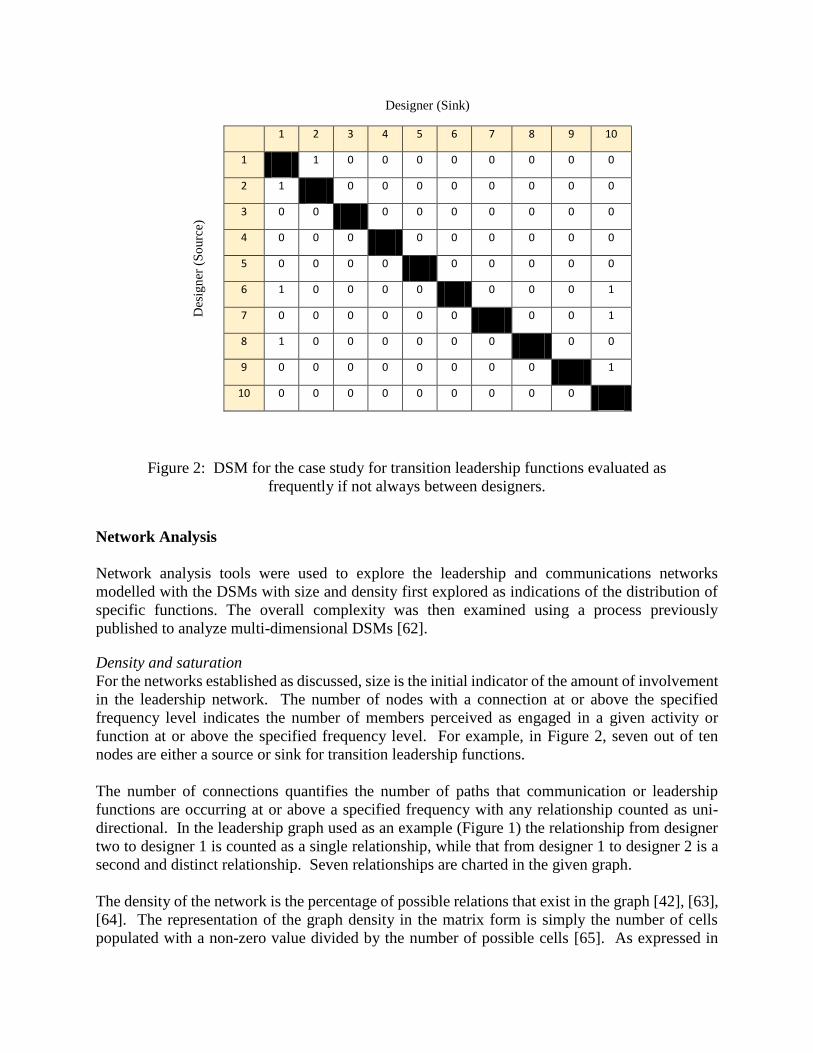
The DSM representation of the perceived leadership graph for transition phase tasks at the highest
frequency threshold (5 or “frequently”) is shown in Figure 2. The nodes are indicated on the axes
and the relations are indicated by the number “1” in a matrix cell, a format indicating the dyadic
relationships between designers [60]. In this matrix, each of the row labels indicates a respondent
or follower and each column indicates a perceived leader.
The relationship is depicted in the DSM if the survey response indicates a frequency of reliance at
or above the level specified. In this example, the number “1” in position (2,1) represents that
designer two relies on designer one “frequently if not always” for transitional tasks such as
planning, setting team goals, and developing strategies. The number “1” in the (1,2) position
depicts designer 2’s reliance on designer 1 for the same function. The relations reflect the survey
responses of the designers and are directional and of equal magnitude. The disconnect of nodes
three, four, and five to the other designers in this DSM indicates a weak connection of the network
at this particular threshold and function [61]. Twelve DSMs are constructed representing the three
leadership functions and three communications modes at two distinct frequency levels.
Designer (Sink)
Des
ign
er (
So
urc
e)
1 2 3 4 5 6 7 8 9 10
1 1 0 0 0 0 0 0 0 0
2 1 0 0 0 0 0 0 0 0
3 0 0 0 0 0 0 0 0 0
4 0 0 0 0 0 0 0 0 0
5 0 0 0 0 0 0 0 0 0
6 1 0 0 0 0 0 0 0 1
7 0 0 0 0 0 0 0 0 1
8 1 0 0 0 0 0 0 0 0
9 0 0 0 0 0 0 0 0 1
10 0 0 0 0 0 0 0 0 0
Figure 2: DSM for the case study for transition leadership functions evaluated as
frequently if not always between designers.
Network Analysis
Network analysis tools were used to explore the leadership and communications networks
modelled with the DSMs with size and density first explored as indications of the distribution of
specific functions. The overall complexity was then examined using a process previously
published to analyze multi-dimensional DSMs [62].
Density and saturation
For the networks established as discussed, size is the initial indicator of the amount of involvement
in the leadership network. The number of nodes with a connection at or above the specified
frequency level indicates the number of members perceived as engaged in a given activity or
function at or above the specified frequency level. For example, in Figure 2, seven out of ten
nodes are either a source or sink for transition leadership functions.
The number of connections quantifies the number of paths that communication or leadership
functions are occurring at or above a specified frequency with any relationship counted as uni-
directional. In the leadership graph used as an example (Figure 1) the relationship from designer
two to designer 1 is counted as a single relationship, while that from designer 1 to designer 2 is a
second and distinct relationship. Seven relationships are charted in the given graph.
The density of the network is the percentage of possible relations that exist in the graph [42], [63],
[64]. The representation of the graph density in the matrix form is simply the number of cells
populated with a non-zero value divided by the number of possible cells [65]. As expressed in

Equation (1), n is the total number of designers (10 for this example) and the density for the
example is .08, or 8%.
Density =Edges
P(n,2)=
Edges
(n∗(n−1)) (1)
The categorization of the responses for the transition phase leadership network is shown in Figure
3. Each bar in the chart indicates the relationships specifically attributed to the specified frequency
of performing transition leadership functions as a percentage of all possible relationships. For
example, approximately fifteen percent of possible relationships are attributed to responses of
“sometimes” reliant on the indicated individual for transition leadership.
Figure 3: Response frequency for perceived transition leadership functions.
Each adjacency matrix, or DSM, depicts the relationships existing at or above a specified
frequency. Also shown in Figure 4 is a representation of the density of relationships within each
graph as the cumulative density of all responses at or below the threshold frequency for that
network. “Frequently if not always (5)” is the highest threshold which has the sparsest graph as a
result. “Often (4)” holds all relationships that are perceived as occurring at least as frequently as
“often” which is the sum of all “4” and “5” responses. “Sometimes (2)” is the sum of all “3,” “4,”
and “5” relationships in this category. A response of “never (1)” is not counted as this signifies
the absence of a relationship for this category. As a result, the cumulative density at this threshold
is less than 100 percent [61].
0
0.1
0.2
0.3
2-Sometimes 3-Once in awhile
4-Often 5-Frequentlyif not always
Transition Response Frequency

Figure 4: Cumulative response distribution for perceived transition leadership relationships.
The density for all three phases of leadership functions is also shown in Figure 5, which permits
the inference of a number of observations in terms of a side-by-side comparison. The density of
relations for relational leadership was perceived as lower at every threshold frequency. Transition
and action function densities were approximately equivalent at threshold frequencies of
“sometimes” and “frequently if not always.” Although the number of designers perceived to
perform these functions was equal at these thresholds, the action density was higher at the
intermediate frequencies with values of 3 and 4. Thus a higher percentage of ties were due to the
lower value of 2 in the transitional graphs.
Figure 5: Leadership function network density for transition, action, and relationship
functions.
Note also the communication graph represented in Figure 6, in which both the text and audio-
visual communication follow similar distribution curves. The densities for all face-to-face
communications are lower than that for electronic text communication or audio-visual
communication forms such as teleconferencing. Note the highest density for face-to-face
communications at 58 percent, which is expected due to the distribution of the team members.
During this phase of the project, geographic distances kept the entire team from meeting for
0%
20%
40%
60%
80%
100%
5-Frequently ifnot always
4-Often 3-Once in awhile
2-Sometimes
Transition Leadership Cumulative Response Distribution
0
0.1
0.2
0.3
0.4
0.5
0.6
0.7
0.8
0.9
5-Frequently ifnot always
4-Often 3-Once in a while 2-Sometimes
Transition Action Relational
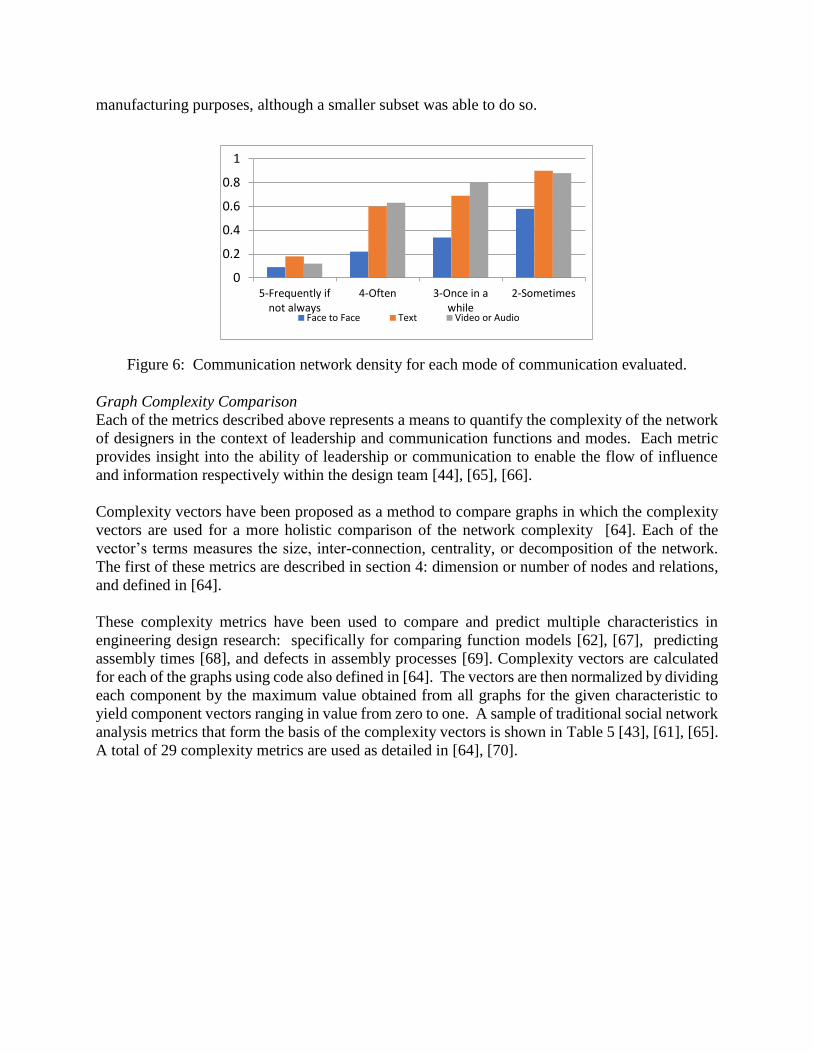
manufacturing purposes, although a smaller subset was able to do so.
Figure 6: Communication network density for each mode of communication evaluated.
Graph Complexity Comparison
Each of the metrics described above represents a means to quantify the complexity of the network
of designers in the context of leadership and communication functions and modes. Each metric
provides insight into the ability of leadership or communication to enable the flow of influence
and information respectively within the design team [44], [65], [66].
Complexity vectors have been proposed as a method to compare graphs in which the complexity
vectors are used for a more holistic comparison of the network complexity [64]. Each of the
vector’s terms measures the size, inter-connection, centrality, or decomposition of the network.
The first of these metrics are described in section 4: dimension or number of nodes and relations,
and defined in [64].
These complexity metrics have been used to compare and predict multiple characteristics in
engineering design research: specifically for comparing function models [62], [67], predicting
assembly times [68], and defects in assembly processes [69]. Complexity vectors are calculated
for each of the graphs using code also defined in [64]. The vectors are then normalized by dividing
each component by the maximum value obtained from all graphs for the given characteristic to
yield component vectors ranging in value from zero to one. A sample of traditional social network
analysis metrics that form the basis of the complexity vectors is shown in Table 5 [43], [61], [65].
A total of 29 complexity metrics are used as detailed in [64], [70].
0
0.2
0.4
0.6
0.8
1
5-Frequently ifnot always
4-Often 3-Once in awhile
2-Sometimes
Face to Face Text Video or Audio

Table 5: Social network analysis metrics selected from complexity distance comparison.
Tr 5 Act 5 Rel 5
Dimension Elements 7 7 4
Relations 7 7 3
Connection Max 1 1 1
Mean 0.17 0.17 0.25
Flow Rate Mean 0.29 0.31 0.38
Density 0.04 0.04 0.13
Betweenness Mean 0 0 0
Density 0 0 0
Clustering Coefficient Mean 0 0.10 0
Density 0 0.01 0
Distance
After characterizing each network by its complexity vector, the vectors can be compared with the
distance between the vectors serving as the means of comparison. There are multiple approaches
to calculating this distance. The cosine distance provides an indication of the angle between the
two complexity vectors and has been selected to compare the complexity vectors for the 12
adjacency matrices considered [71]. Equation (2) is used to determine cosine distance is [72].
cosine 𝑑𝑖𝑠𝑡𝑎𝑛𝑐𝑒 = 𝐴 ∙𝐵
‖𝐴‖‖𝐵‖ (2)
The cosine distance (5.2) will result in one for an angle of zero between the vectors and will result
in zero for orthogonal vectors. One minus the cosine distance (1 - cosine) is used in MATLAB as
an intuitive metric, where larger magnitudes indicate greater dissimilarity. The resulting “1 –
cosine” comparisons are provided as Figure 7.
The complexity comparison matrix, Figure 7, shows the distance between the complexity vectors
of each graph. Distances range from zero to one, with zero indicating the absence of an angle
between the two vectors. The matrix is formatted as a DSM, although with diagonal values of zero
given the iteration as one minus cosine.
The DSM is considered as four quadrants based on the ordering of the graphs in Figure 2. The
upper left quadrant is a comparison of perceived leadership complexity vectors to other perceived
leadership complexity vectors. The upper right quadrant is populated by the distance between
communication complexity vectors. The remaining two quadrants reflect comparisons between
the leadership complexity vectors and communication complexity vectors.

T5 A5 R5 T4 A4 R4 CA5 CB5 CC5 CA4 CB4 CC4
T5 .00 .17 .25 .41 .40 .32 .53 .41 .12 .52 .50 .46
A5 .17 .00 .37 .23 .31 .30 .30 .31 .06 .28 .41 .38
R5 .25 .37 .00 .63 .57 .50 .48 .48 .46 .70 .65 .62
T4 .41 .23 .63 .00 .08 .21 .27 .23 .22 .08 .09 .10
A4 .40 .31 .57 .08 .00 .06 .32 .09 .28 .17 .05 .04
R4 .32 .30 .50 .21 .06 .00 .34 .04 .28 .29 .18 .14
CA5 .53 .30 .48 .27 .32 .34 .00 .25 .45 .16 .36 .39
CB5 .41 .31 .48 .23 .09 .04 .25 .00 .35 .26 .20 .18
CC5 .12 .06 .46 .22 .28 .28 .45 .35 .00 .34 .39 .36
CA4 .52 .28 .70 .08 .17 .29 .16 .26 .34 .00 .19 .21
CB4 .50 .41 .65 .09 .05 .18 .36 .20 .39 .19 .00 .01
CC4 .46 .38 .62 .10 .04 .14 .39 .18 .36 .21 .01 .00
Figure 7: Complexity comparison based on cosine similarity (1-cosine distance).
Complexity Comparison Insights
The dark shaded cells in the comparison matrix indicate distances of less than 0.2 (1 – cosine) or
approximately 37 degrees. The only leadership-to-leadership cells that meet this threshold of
having a dissimilarity of less than 0.2, are between T5 and A5, T4 and A4, and A4 and R4.
Communication network complexity vectors are more similar to transition and action leadership
networks than to relationship vectors at the same frequency threshold. Similarities between
communication and leadership are low at the “frequently” threshold, while they exhibit more
similar complexity vectors at the denser “often” threshold. The greatest similarity between
communication vectors is between the text and video-teleconference modes at the “often”
threshold.
Discussion
The perception of student designers was used to inform the creation of leadership and
communications networks of peer roles in a capstone design project with the results used to
elucidate the distribution of transition, action, and relational leadership functions in student
engineering design teams. The size and density of leadership and communications networks
indicate the degree of participation of individual designers. The high density of perceived informal
leaders could indicate that informal leadership plays a significant role in these teams. The
maximum density or participation level was lower for relational leadership than for transitional
and action functions, as was the density of face-to-face communication, likely due to distribution
of the team designers. This lower level of relationship oriented behaviors could be related to the

specific composition of the study teams, however, it is consistent with additional case study and
protocol study observations [73].
Complexity measures provide an understanding of the network structure and its relationships.
Complexity vectors were established for each network consisting of 29 different complexity
measures addressing size, connectivity, clustering, and decomposition measures. A cosine
distance measure was then used as an indication of similarity between all developed networks.
Pairwise similarity comparisons generally indicated higher similarity between transition and action
leadership networks, and similarities between transitional and action leadership functions with all
modes of communications at the “often” threshold. At the “frequently” threshold the leadership
to communication similarities were not consistently high. These results suggest that
communication networks do not provide all of the necessary information to establish leadership,
or influence, network relationships. They also suggest that transition, action, and relationship
leadership behaviors do not consistently provide the same network complexities.
Informal leadership structures are established in these projects. The study clearly established the
perceived leader-follower relationships in the ten-member aerospace. Informal leadership
functions are distributed across the student design teams participating in this research. The density
of the structures is indicative of this distribution.
The network distributions present in this study suggests that student design team members will be
engaged in informal leadership functions during their capstone engineering projects. Faculty and
students may benefit from preparation to assume these roles that extend beyond formally defined
positions. Leadership behavior interventions may be beneficial, however, it may be necessary to
first identify where influencing behaviors are being performed within student teams. The use of
leadership networks and complexity provides insight into the students’ perceptions of where these
functions are actually being performed. These results provide avenues for future work as discussed
below.
Summary and Future Work
This case study applied network graphs, a sociometric survey, and complexity metrics to determine
and analyse the occurrence of informal leadership behaviors within an undergraduate engineering
design team. The dense networks of leadership behaviors between designers demonstrate the
prevalence of informal leadership within teams. Differences in networks of differing functional
leadership categories merit further study. Analysis of complexity metrics indicate that leadership
networks should be considered in addition to communication networks to understand team
dynamics.
Limitations include the sample size and the frequency of observation. The nature of the case
studies construct limits the ability to determine the impact of specific design stages or activities
that can be controlled in laboratory experiments. Future observational studies can address these
limitations.
Future research is recommended to determine if these networks develop or change through the
lifecycle of the project team and the role of project design team size on network characteristics.
Additional similarity measures can also be applied for additional insights. Research is also

recommended to determine if the degree (leadership) and frequency of influence involved in
leadership are similar in the perceptions of student designers. The frequency of communications
or leadership functions is also a probability of influence or information passed through these
network relations [66].
References
[1] N. Cross and A. Clayburn Cross, “Observations of teamwork and social processes in
design,” Des. Stud., vol. 16, no. 2, pp. 143–170, 1995.
[2] J. C. Tang and L. J. Leifer, “An observational methodology for studying group design
activity,” in Mechanical Design: Theory and Methodology, Springer, 1996, pp. 52–70.
[3] O. Rexfelt, L. Almefelt, D. Zackrisson, T. Hallman, J. Malmqvist, and M. Karlsson, “A
proposal for a structured approach for cross-company teamwork: A case study of
involving the customer in service innovation,” Res. Eng. Des., vol. 22, no. 3, pp. 153–171,
2011.
[4] I. K. Ehrlenspiel, A. Giapoulis, and J. Günther, “Teamwork and design methodology—
Observations about teamwork in design education,” Res. Eng. Des., vol. 9, no. 2, pp. 61–
69, 1997.
[5] M. S. Kim, “Analysis of team interaction and team creativity of student design teams
based on personal creativity modes,” in Proceedings of the ASME 2007 International
Design Engineering Technical Conferences & Computers and Information in Engineering
Conference, 2007, pp. 1–13.
[6] K. J. Ostergaard and J. D. Summers, “Resistance Based Modeling of Collaborative
Design,” in Concurrent Engineering, 2004, vol. 15, no. 1, p. DAC--57076.
[7] J. Righter, D. Chickarello, H. Stidham, S. O’Shields, A. Patel, and J. Summers,
“Literature based review of a collaborative design taxonomy,” in Proceedings of the
International Conference on Engineering Design, ICED, 2017, vol. 8, no. DS87-8.
[8] J. Hanus and J. S. Russell, “Integrating The Development Of Teamwork, Diversity,
Leadership, And Communication Skills Into A Capstone Design Course,” in ASEE Annual
Conference and Exposition, 2007.
[9] S. W. J. Kozlowski and D. R. Ilgen, “Enhancing the effectiveness of work groups and
teams 41,” Psychol. Sci., pp. 77–124, 2006.
[10] J. Kratzer, R. T. A. J. Leenders, and J. M. L. Van Engelen, “The social structure of
leadership and creativity in engineering design teams: An empirical analysis,” J. Eng.
Technol. Manag., vol. 25, no. 4, pp. 269–286, 2008.
[11] K. Montor, T. McNicholas, A. Ciotti, T. Hutchinson, and J. Wehmueller, Eds., Naval
Leadership. Annapolis, MD: Naval Institute Press, 1987.
[12] J. M. Howell and B. J. Avolio, “Transformational leadership, transactional leadership,
locus of control, and support for innovation: Key predictors of consolidated-business-unit
performance.,” J. Appl. Psychol., vol. 78, no. 6, pp. 891–902, 1993.

[13] G. A. Cranmer, “A Continuation of Sport Teams From an Organizational Perspective,”
Commun. Sport, vol. 4, no. 1, pp. 43–61, 2016.
[14] G. A. Cranmer and S. A. Myers, “Sports Teams as Organizations,” Commun. Sport, vol. 3,
no. 1, pp. 100–118, 2015.
[15] J. Gloppen, “Perspectives on Design Leadership and Design Thinking and How They
Relate to European Service Industries,” Des. Manag. J., vol. 4, no. 1, pp. 33–47, 2009.
[16] A. G. Jago, “Leadership: Perspectives in theory and research,” Manage. Sci., vol. 28, no.
3, pp. 315–336, 1982.
[17] Plato, The Republic. Sheba Blake Publishing, 2013.
[18] R. M. Stogdill, Handbook of Leadership. New York: The Free Press, 1974.
[19] A. Nahavandi, The Art and Science of Leadership, Sixth Edit. Boston: Prentice Hall, 2012.
[20] M. Z. Hackman and C. E. Johnson, Leadership: A Communication Perspective. Long
Grove, Illinois: Waveland Press, Inc., 2009.
[21] R. Likert, New Patterns of Management. New York: McGraw-Hill Book Company, 1961.
[22] F. W. Brown and K. Finstuen, “The Use of Participation in Decision Making: A
Consideration of the Vroom-Yetton and Vroom-Jago Normative Models,” J. Behav.
Decis. Mak., vol. 6, no. 3, pp. 207–219, 1993.
[23] V. H. Vroom and A. G. Jago, “Situation Effects and Levels of Analysis in the Study of
Leader Participation,” Leadersh. Q., vol. 6, no. 2, pp. 169–181, 1995.
[24] V. Vroom and A. G. Jago, The New Leadership: Managing Participation in
Organizations. Englewood Cliffs, NJ: Prentice Hall, 1988.
[25] E. Fleishman and D. Peters, “Interpersonal Values, Leadership Attitudes, and Managerial
‘Success,’” Pers. Psychol., vol. 15, no. 2, pp. 127–143, 1962.
[26] S. J. Zaccaro, A. L. Rittman, and M. A. Marks, “Team Leadership,” Leadersh. Q., vol. 12,
pp. 451–483, 2001.
[27] F. P. Morgeson, D. S. DeRue, and E. P. Karam, Leadership in Teams: A Functional
Approach to Understanding Leadership Structures and Processes, vol. 36, no. 1. 2010.
[28] M. A. Marks, J. E. Mathieu, and S. Zaccaro, “A Temporally Based Framework and
Taxonomy of Team Processes,” Acad. Manag. Rev., vol. 26, no. 3, pp. 356–376, 2016.
[29] C. Schreiber and K. M. Carley, “Leadership style as an enabler of organizational complex
functioning,” Emerg. Complex. Organ., vol. 8, no. 4, pp. 61–76, 2006.
[30] G. B. Graen and M. Uhl-Bien, “Relationship-based approach to leadership: Development
of leader–member exchange (LMX) theory of leadership over 25 years: Applying a multi
domain perspective,” Leadersh. Q., vol. 6, pp. 219–247., 1995.
[31] B. J. Avolio, B. M. Bass, and D. I. Jung, “Re-examining the components of
transformational and transactional leadership using the Multifactor Leadership,” J. Occup.

Organ. Psychol., vol. 72, no. 4, pp. 441–462, 1999.
[32] B. M. Bass, B. J. Avolio, D. I. Jung, and Y. Berson, “Predicting unit performance by
assessing transformational and transactional leadership.,” J. Appl. Psychol., vol. 88, no. 2,
pp. 207–218, 2003.
[33] K. J. Ostergaard and J. D. Summers, “Development of a systematic classification and
taxonomy of collaborative design activities,” J. Eng. Des., vol. 20, no. 1, pp. 57–81, 2009.
[34] J. Osborn, T. J. Troy, G. Smith, and J. D. Summers, “Case study instrument development
for studying collaborative design,” in Proceedings of the ASME Design Engineering
Technical Conference, 2006, vol. 2006.
[35] G. Palmer and J. D. Summers, “Characterization of Leadership Within Undergraduate
Engineering Design Teams Through Case Study Analysis,” Assessment, no. August, 2011.
[36] B. J. Novoselich, D. B. Knight, K. Kochersberger, and R. Ott, “Leadership in Capstone
Design Teams : Contrasting the Centrality of Advisors and Graduate Teaching
Assistants,” in 2016 Capstone Design Conference, 2016.
[37] M. K. Di Marco, J. E. Taylor, and P. Alin, “Emergence and role of cultural boundary
spanners in global engineering project networks,” J. Manag. Eng., vol. 26, no. 3, pp. 123–
132, 2010.
[38] R. Hitt, Michael A.Nixon, Robert D.Hoskisson, Robert F.Kochhar, “Corporate
Entrepreneurship and Cross-Functional Fertilization: Activation, Process and
Disintegration of a New Product Design Team.,” Entrep. Theory Pract., vol. 3, Spring
1999, pp. 145–167, 1999.
[39] T. Paul and S. Ahmed-Kristensen, “A Longitudinal Study of Globally Distributed Design
Teams : the Impacts on Product Development,” July, pp. 1–10, 2015.
[40] E. Seat, J. Parsons, and W. Poppen, “Enabling Engineering Performance Skills: A
Program to Teach Communication, Leadership, and Teamwork*,” J. Eng.Educ., January,
pp. 7–12, 2001.
[41] L. M. Powers and J. D. Summers, “Integrating graduate design coaches in undergraduate
design project teams,” Int. J. Mech. Eng. Educ., vol. 37, no. 1, 2009.
[42] R. Hanneman and M. Riddle, “Introduction to Social Network Methods,” Riverside, CA
Univ. California, Riverside. On-line Textb., vol. 46, no. 7, pp. 5128–30, 2005.
[43] J. Scott and P. Carrington, Eds., The SAGE Handbook of Social Network Analysis. Los
Angeles, California: SAGE Publications, 2011.
[44] L. A. DeChurch and D. R. Carter, “Leadership in Multi-team systems: A network
perspective,” in Oxford handbook of leadership, New York: Oxford University Press,
2014, pp. 483–505.
[45] S. D. Eppinger, T. R. Browning, and J. Moses, Design Structure Matrix Methods and
Applications. MIT Press, 2012.
[46] W. Feng, E. F. Crawley, O. De Weck, R. Keller, and B. Robinson, “Dependency Structure

Matrix Modelling for Stakeholder Value Networks,” 12Th Int. Depend. Struct. Model.
Conf., July, pp. 3–16, 2010.
[47] S. Howe, “Where Are We Now? Statistics on Capstone Courses,” Adv. Eng. Educ., vol.
Spring, pp. 1–27, 2010.
[48] J. D. Summers, G. M. Mocko, and S. Teegavarapu, “Case Study Method for Design
Research: A Justification,” in Design Engineering Technical Conferences 2008, 2008.
[49] R. Yin, Case Study Research: Design and Methods. Thousand Oaks, CA: Sage, 2003.
[50] B. Flyvbjerg, “Five Misunderstandings about Case Study Research,” Qual. Inq., vol. 12,
no. 2, pp. 219–245, 2006.
[51] J. Righter, A. Blanton, H. Stidham, D. Chickarello, and J. D. Summers, “A case study of
the effects of design project length on team collaboration and leadership in senior
mechanical engineering projects,” in Proceedings of the ASME Design Engineering
Technical Conference, 2017, vol. 3.
[52] K. Duehr et al., “Understanding distributed product engineering: Dealing with complexity
for situation- and demand-oriented process design,” Procedia CIRP, vol. 84, pp. 136–142,
2019.
[53] M. L. Cannon, “Looking back: A Student Review and History of AerosPACE–a Multi-
University, Multi-Disciplinary, Distributed, Industry-University Capstone Project,” Age
(Omaha)., vol. 26, p. 1, 2015.
[54] P. A. Johnson, “Problem-based, cooperative learning in the engineering classroom,” J.
Prof. issues Eng. Educ. Pract., vol. 125, no. 1, pp. 8–11, 1999.
[55] M. Shuffler, “Where’s The Boss? The Influences Of Emergent Team Leadership
Structures On Team Outcomes In Virtual And Distributed Environments,” 2013.
[56] J. B. Carson, P. E. Tesluk, and J. a Marrone, “Shared leadership in teams: An
investigation of antecednt conditions and performance,” Acad. Manag. J., vol. 50, no. 5,
pp. 1217–1234, 2007.
[57] H. Stidham and J. D. Summers, “Using the Five Factor Model to Study Personality
Convergence on Student Engineering Design Teams,” in Proceedings of International
Design Conference, DESIGN 2018, 2018, p. In Review.
[58] B. R. Stone, “Maximizing Virtual MUCAx Engineering Design Team Performance,”
Brigham Young University, 2016.
[59] S. J. Kapurch, “NASA Systems Engineering Handbook,” NASA Spec. Publ., 2007.
[60] T. R. Browning, “Applying the design structure matrix to system decomposition and
integration problems: a review and new directions,” IEEE Trans. Eng. Manag., vol. 48,
no. 3, pp. 292–306, 2001.
[61] R. K. Ahuja, T. L. Magnanti, and J. B. Orlin, Network flows: theory, algorithms and
applications, vol. 1. Upper Saddle River, New Jersey: Prentice Hall, 1993.

[62] J. L. Mathieson, A. Shanthakumar, C. Sen, R. Arlitt, J. D. Summers, and R. Stone,
“Complexity as a surrogate mapping between function models and market value,” Proc.
ASME Des. Eng. Tech. Conf., vol. 9, January, 2011.
[63] K. T. Phelan, J. D. Summers, B. Pearce, and M. E. Kurz, “Higher order interactions:
Product and configuration study on DSM saturation,” Proc. 20th Int. Conf. Eng. Des.
(ICED 15), Vol. 1 Des. Life, July, pp. 1–10, 2015.
[64] J. L. Mathieson, “Connective Complexity Methods for Analysis and Prediction in
Engineering Design,” Clemson University, 2011.
[65] K. R. Schneider, “Reliability Analysis of Social Networks,” University of Arkansas, 2013.
[66] J. T. Hamill, “Gains, losses and thresholds of influence in social networks,”
Int.J.Oper.Res., vol. 2, no. 4, pp. 357–379, 2007.
[67] A. S. Gill, A. R. Patel, J. D. Summers, M. L. Shuffler-Porter, and W. S. Kramer, “Graph
complexity analysis of function models expanded from partially completed models,” in
4th International Conference on Design Creativity, ICDC 2016, 2016.
[68] J. L. Mathieson, B. A. Wallace, S. Undergraduate, and J. D. Summers, “Assembly Time
Prediction Through Connective Complexity,” Mech. Eng., vol. 26, no. 10, pp. 955–967,
2010.
[69] A. Patel, P. Andrews, and J. D. Summers, “Evaluating the Use of Artificial Neural
Networks, Graph Theory, and Complexity Theory to Predict Automotive Assembly
Defects,” in ASME International Design Engineering Technical Conferences and
Computers and Information in Engineering Conference, 2016, August, pp. DETC2016-
59664.
[70] J. Mathieson and J. Summers, “Relational DSMs in connectivity complexity
measurement,” Proc. 11th Int. DSM Conf., October, pp. 15–26, 2009.
[71] E. A. Leicht, P. Holme, and M. E. J. Newman, “Vertex similarity in networks,” Phys. Rev.
E-Statistical, Nonlinear, Soft Matter Phys., vol. 73, no. 2, pp. 1–10, 2006.
[72] G. Salton and C. Buckley, “Term-Weighting Approaches in Automatic Text Retrieval,”
Inf. Process. Manag., vol. 24, no. 5, pp. 1–21, 1988.
[73] J. Righter, C. Wentzky, and J. D. Summers, “Application of a protocol to observe
leadership behaviors in engineering design teams,” Proc. ASME Des. Eng. Tech. Conf.,
2019.