Embed Size (px)
Citation preview

LEANing Toward
Excellence at MCCU
Kathlynn McConnell, CPLP, CRODirector of Training
Members Cooperative Credit Union218-878-3653

Six Thinking HatsDr. Edward de Bono
WHITE: facts, data, informationwhat do we know/still need to know
YELLOW: Benefits, values, positive aspects, why it could workWhat are the positive aspects
BLACK: difficulties, potential problems, why it may NOT workWhat are the reasons why it may not work
RED: feelings, hunches, gut, intuitionHow does everyone feel about the current issue/how does everyone feel now that we’ve worked on the issue
BLUE: process, next steps, action plansWhat conclusions or summaries can we make in moving forward on this issue?
GREEN: creativity, possibilities, alternatives, new ideasWhat are some creative ways to address this issue that haven’t been tried before
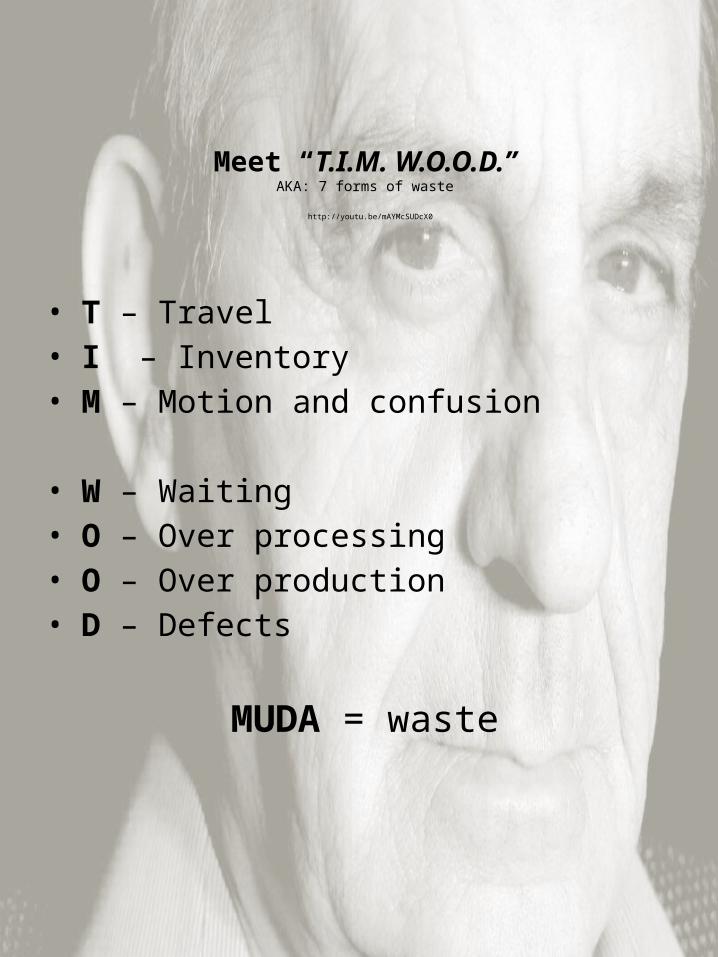
• T – Travel• I – Inventory• M – Motion and confusion
• W – Waiting• O – Over processing• O – Over production• D – Defects
MUDA = waste
Meet “T.I.M. W.O.O.D.”AKA: 7 forms of waste
http://youtu.be/mAYMcSUDcX0

P.I.C.K. ME! PICK ME!Small Impact
Easy to Implement
Hard to Implement
Big Impact
Possible Implement
Kill Challenge
Developed by Lockheed Martin, for organizing process improvement ideas and categorizing them during the Identify and Prioritize Opportunities Phase of a Lean Six Sigma project.
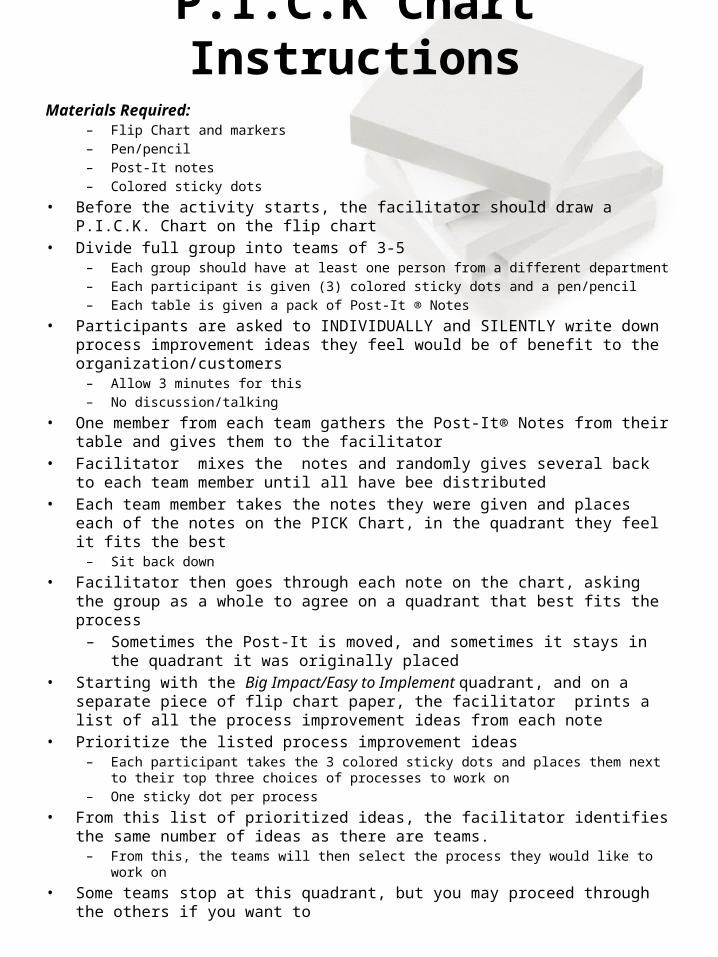
P.I.C.K Chart InstructionsMaterials Required:
– Flip Chart and markers– Pen/pencil– Post-It notes– Colored sticky dots
• Before the activity starts, the facilitator should draw a P.I.C.K. Chart on the flip chart
• Divide full group into teams of 3-5– Each group should have at least one person from a different department– Each participant is given (3) colored sticky dots and a pen/pencil– Each table is given a pack of Post-It ® Notes
• Participants are asked to INDIVIDUALLY and SILENTLY write down process improvement ideas they feel would be of benefit to the organization/customers
– Allow 3 minutes for this– No discussion/talking
• One member from each team gathers the Post-It® Notes from their table and gives them to the facilitator
• Facilitator mixes the notes and randomly gives several back to each team member until all have bee distributed
• Each team member takes the notes they were given and places each of the notes on the PICK Chart, in the quadrant they feel it fits the best
– Sit back down
• Facilitator then goes through each note on the chart, asking the group as a whole to agree on a quadrant that best fits the process
– Sometimes the Post-It is moved, and sometimes it stays in the quadrant it was originally placed
• Starting with the Big Impact/Easy to Implement quadrant, and on a separate piece of flip chart paper, the facilitator prints a list of all the process improvement ideas from each note
• Prioritize the listed process improvement ideas– Each participant takes the 3 colored sticky dots and places them next to their top three
choices of processes to work on– One sticky dot per process
• From this list of prioritized ideas, the facilitator identifies the same number of ideas as there are teams.
– From this, the teams will then select the process they would like to work on
• Some teams stop at this quadrant, but you may proceed through the others if you want to

LEAN IDEA IMPLEMENTATION
ISSUE: Department/Team Members: Date: BACKGROUND: Explain how this problem affects MCCU’s goals, is related to our values, and/or T.I.M. W.O.O.D.
T = Travel: layout, physical movement that doesn’t add value to process I = Inventory: outdated, junk drawers, unread emails M = Motion: searching for docs, moving equipment out of the way, reaching W = Waiting: idle time when schedules-people-equipment are not coordinated O = Over-processing: endless refinement, re-doing tasks O = Over-production: producing more than needed, extra forms that are outdated D = Defects in the system: missing information, wrong addresses, broken equipment
CURRENT CONDITION:
Draw a simple diagram/flow that illustrates how the current process works. Label the diagram so that anyone knowledgeable about the process can
understand.

5 WHY’s (aka: Root cause): · List the main problem · Ask appropriate “ why?” questions until you reach the root cause · List the answers to each why question SITUATION: ________________________________________________ 1. Why is this happening?
2. Why is that?
3. Why is that?
4. Why is that?
5. Why is that? ROOT CAUSE:
______________________________________________________

Please circle ALL the Stakeholders that are affected by the process improvement:
Accounting/Finance Human Resources UnderwriterBusiness Services Indirect Lending VendorsCollections IT Other: ____________Consumer Lending/FSC MarketingContact Center Members
I.E. ManagersHow will you communicate the process improvement to them?
I.E. Anyone Who is DIRECTLY Involved in the Process
How will you communicate the process improvement to them?
I.E.: Not involved in the process but would benefit from knowing
about any changesHow will you communicate the process improvement to them?
I.E.: May at some point in time have interaction with the process
How will you communicate the process improvement to them?
Higher Power
Lower Power
Lower Interest
Higher Interest

IMPLEMENTATION PLANList the actions (countermeasures) that will address the root cause(s) identified, individual responsible for the
action, due date, and follow up actions
ACTION RESPONSIBILITY DEADLINE
FOLLOW UP ACTIONS (to confirm process works) RESPONSIBILITY DEADLINE
Please indicate results of your lean idea (fill in all that apply): Cost savings (annual): _________________________________________________ Time savings: _____________________________________________________ Other : ______________________________________________________________

LEAN IDEA IMPLEMENTATION
ISSUES: Cost of Items Sent Via Courier vs. Other Available Methods Department: all of MCCU Date: 1/15/13 Team: M.S., M.A., K.S., S.F., K.M. BACKGROUND: Explain how this problem affects MCCU’s goals, is related to our values, and/or T.I.M. W.O.O.D.
T = Travel: layout, physical movement that doesn’t add value to process I = Inventory: outdated, junk drawers, unread emails M = Motion: searching for docs, moving equipment out of the way, reaching W = Waiting: idle time when schedules-people-equipment are not coordinated O = Over-processing: endless refinement, re-doing tasks O = Over-production: producing more than needed, extra forms that are outdated D = Defects in the system: missing information, wrong addresses, broken equipment
The current process involves the following wastes: travel, motion, and waiting CURRENT CONDITION: · Draw a simple diagram/flow that illustrates how the current process works. · Label the diagram so that anyone knowledgeable about the process can understand. · Note the major problems (put them in storm bursts to set them apart)
Send Wait Deliver Cost in dollars and wait time!!! Currently, items such as biz/loan/mortgage files, lien cards, member payments (CC), title cars, mortgage papers (i.e. original disclosures) are sent through the interoffice mail. At times, team members end up searching for the sent documents (due to being mistakenly sent to another branch) or waiting for the delivery date assigned to that branch. 12 x/week to Cloquet (send and receive) 9 x/week to Duluth (send and receive) 3 x/week to Aitkin/McGregor (send only)

The courier process was initially started many years ago to transport checks/bonds to the branches on a daily basis. Electronics and updated procedures have changed over the last five years, yet the courier delivery process has not. Courier service approximate annual cost: $14,000 (approx. $270/week) 5 WHY’s (aka: Root cause): List the main problem Ask appropriate “why?” questions until you reach the root cause List the answers to each why question SITUATION: Time, motion, and wait times are experienced with the current courier schedule/system 1. Why is this happening?
The schedule has worked in the past
2. Why is that? The schedule met the document transportation needs at that time but not currently
3. Why is that? Documentation and communication methods have changed, yet the courier delivery process has not
ROOT CAUSE: Documentation needs, electronics, and procedures have changed but the delivery system for the transportation of documents has not
CURRENT CONDITION (continued)

STAKEHOLDERS: Who are they in this process?
Higher Power
Lower Power
Lower Interest Higher Interest
Please circle ALL the Stakeholders that are affected by the process improvement:
Accounting/Finance Human Resources Underwriter Business Services Indirect Lending Vendors Collections IT Consumer Lending/FSC Marketing Contact Center Members Front Line/MSR Mortgage ** Project affects all listed
I.E.: Managers How will you communicate the process
improvement to them?
- Submit the Lean Idea form to VP who will then bring to/discuss with Management Team - Lean Project Team will present idea to Supervisors at meeting on 2/22/13
I.E.: May at some point in time have interaction with the process
How will you communicate the process improvement to them?
- Post document on the Intranet Lean Site under “Current Projects”
I.E.: Not involved in the process but would benefit from knowing about
any changes How will you communicate the process
improvement to them?
- Post document on the Intranet Lean Site under “Current Projects”
I.E.: Anyone who is DIRECTLY involved in the process
How will you communicate the process improvement to them?
- Supervisors will communicate “in person/face -to-face” with each team member to explain new process
- Supervisors will communicate questions and/or concerns with project team

ACTION RESPONSIBILITY DEADLINE
Compare Fed Ex and UPS delivery costs and email findings to M.A. 1/25/13
project team (M.S., S.F., M.A., K.S., K M.)
Identify annual cost savings between current courier process M. A. 1/28/13
and Fed Ex or UPS, list in document and send to project team
Send Lean Idea Form to VP, who will discuss with Mgmt Team; Lean Project Team will then present idea at the Supervisors meeting on 2/22/13
Project Team 2/11/132/22/13
Compare overnight mailing costs and email project team: 8 oz pkg from Aitkin/McGregor to Cloquet - $12.95+, one day delivery
K.S. 1/25/13
Create a list of “other sending options”; send to project team K.M. 1/15/13
Check with Accounting to confirm how checks are cut and sent S.F. 1/25/13
To branches to purchase postage stamps
Confirm confines of contract with the courier service: can cancel with 30-day notice, route changes with 1 week notice
M.A. 1/25/13
Confirm process for necessary mortgage signatures: Steve Raj stated this would not be disrupted by courier changes, as two signers have now been identified (Teri and Ryanne)
K.M. 1/25/13
Confirm Facility Managers schedules: Mondays – G.V./Duluth; Tuesdays – S.S./McGregor, Aitkin; Thursdays –G.V./Duluth
S.F. 1/25/13
Present process improvement idea to Supervisors: “test” during month of March – unless absolutely necessary all team members will use the alternative options for sending documents within MCCU
Project Team 2/21/13
FOLLOW UP ACTIONS (to confirm process works) RESPONSIBILITY DEADLINE
Test the new process All MCCU team members Month of March 2013
IMPLEMENTATION PLAN
• List the actions (countermeasures) that will address the root cause(s) identified, individual responsible for the action, due date, and follow up actions
• Goal: to utilize identified alternative methods for sending inter-office documents in place of the current courier process
TOTAL ANNUAL SAVINGS: $14,000.00

Force Field Analysis
Restraining Forces
GOAL
DRIVING FORCES
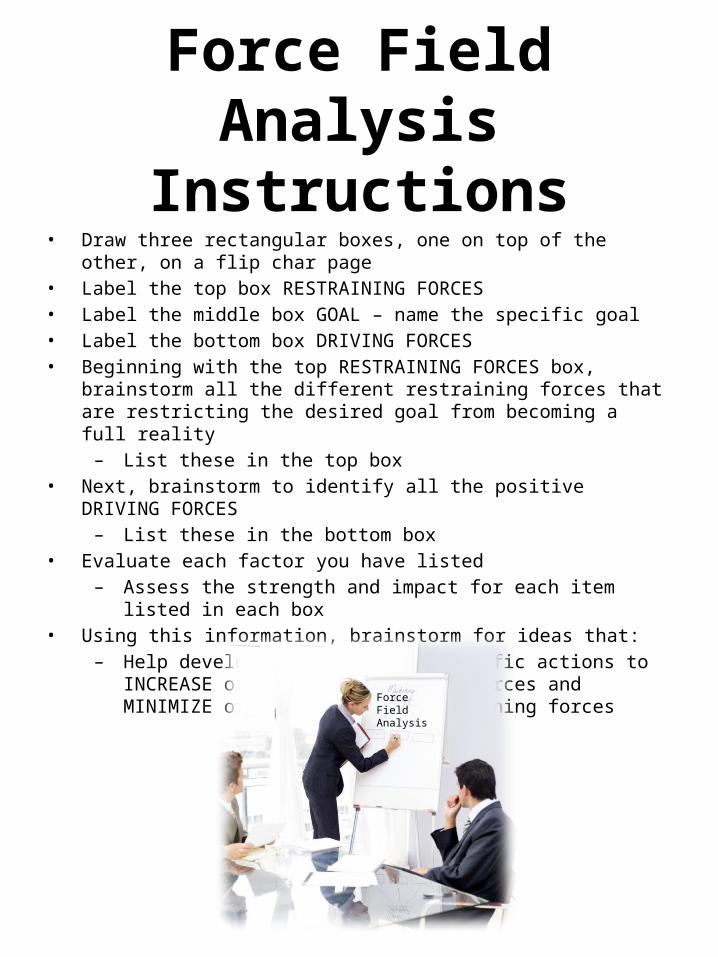
Force Field AnalysisInstructions
• Draw three rectangular boxes, one on top of the other, on a flip char page• Label the top box RESTRAINING FORCES• Label the middle box GOAL – name the specific goal• Label the bottom box DRIVING FORCES• Beginning with the top RESTRAINING FORCES box, brainstorm all the different
restraining forces that are restricting the desired goal from becoming a full reality
– List these in the top box• Next, brainstorm to identify all the positive DRIVING FORCES
– List these in the bottom box• Evaluate each factor you have listed
– Assess the strength and impact for each item listed in each box• Using this information, brainstorm for ideas that:
– Help develop and prioritize specific actions to INCREASE or ADD to the driving forces and MINIMIZE or ELIMINATE the restraining forces
Force Field Analysis


![3653 SSLD Lighting AW[4]](https://img.pdfslide.net/doc/110x75/55cf9d47550346d033acf1ba/3653-ssld-lighting-aw4.jpg)