Embed Size (px)
Citation preview
Learning by research: The project Learning by research: The project “Assessing“Assessing Deforestation in the Deforestation in the VelingradVelingrad Region of Bulgaria Region of Bulgaria Using Remote Sensing, GISUsing Remote Sensing, GIS
and Survey Techniques”and Survey Techniques”Stelian DimitrovStelian Dimitrov
Veselina KoleshevaVeselina KoleshevaSofia University “St. Sofia University “St. KlimentKliment OhridskiOhridski””
BulgariaBulgaria
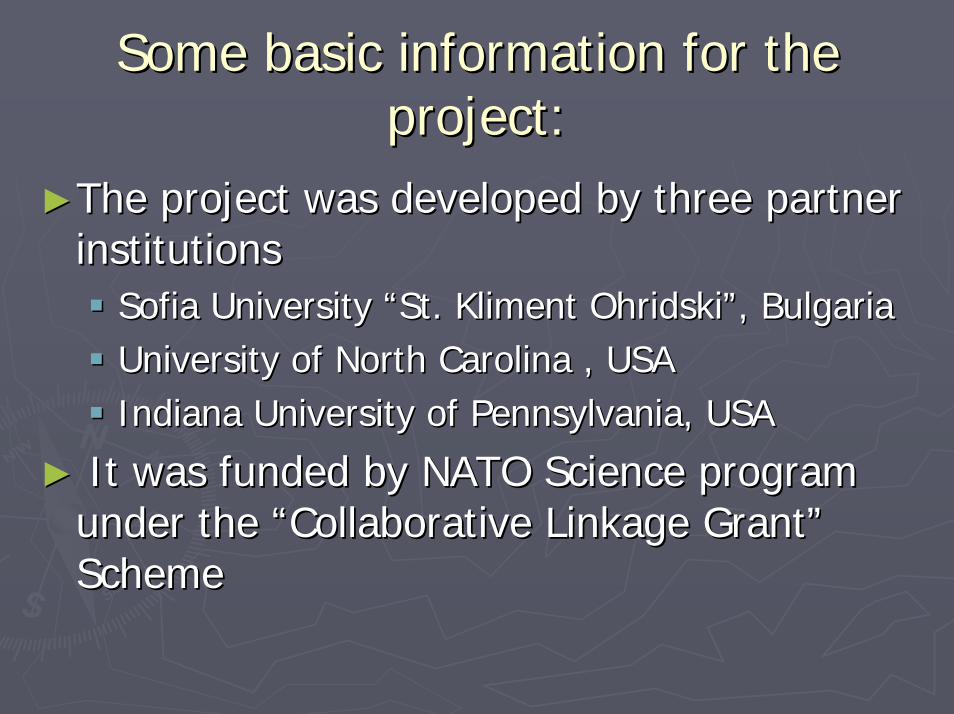
Some basic information for the Some basic information for the project:project:
►►The project was developed by three partner The project was developed by three partner institutionsinstitutions
Sofia University “St. Sofia University “St. KlimentKliment OhridskiOhridski”, Bulgaria”, BulgariaUniversity of North CarolinaUniversity of North Carolina , USA, USAIndiana University of Pennsylvania, USA Indiana University of Pennsylvania, USA
►► It was funded by NATO Science program It was funded by NATO Science program under the “Collaborative Linkage Grant” under the “Collaborative Linkage Grant” SchemeScheme
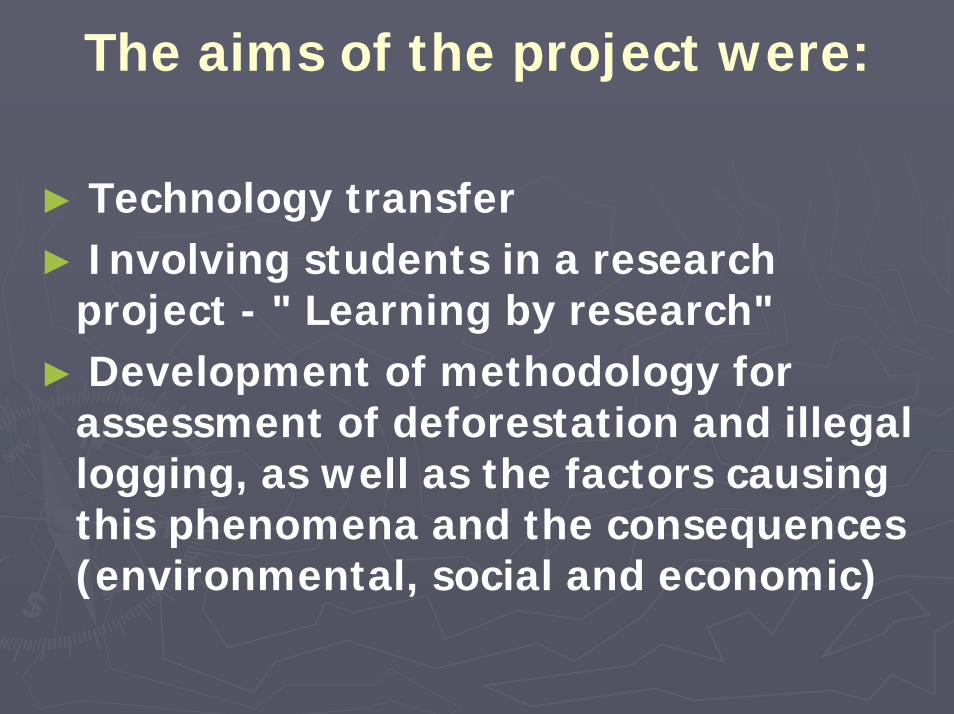
The aims of the project were:
► Technology transfer► Involving students in a research
project - " Learning by research"► Development of methodology for
assessment of deforestation and illegal logging, as well as the factors causing this phenomena and the consequences (environmental, social and economic)
►► This case study focused on the effects of wildcat This case study focused on the effects of wildcat logging on the fragile logging on the fragile RhodopeRhodope environment of environment of southwest Bulgaria within the southwest Bulgaria within the VelingradVelingrad obstinaobstina
►► The case study integrated surveys and interviews The case study integrated surveys and interviews of the wood processing enterprises and logging of the wood processing enterprises and logging teams in the region with spatial data and remotely teams in the region with spatial data and remotely sensed information sources to assess damage to sensed information sources to assess damage to riparian environments from the rapid growth of riparian environments from the rapid growth of largely unregulated private wood cutting largely unregulated private wood cutting operations. operations.
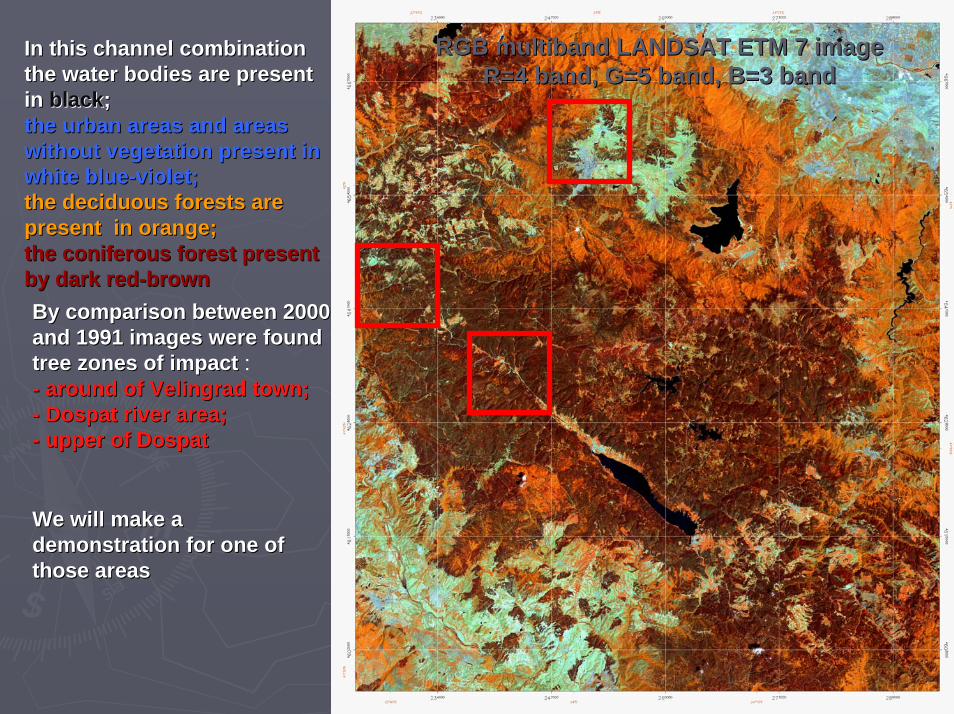
RGB RGB multibandmultiband LANDSAT ETM 7 image LANDSAT ETM 7 image R=4 band, G=5 band, B=3 bandR=4 band, G=5 band, B=3 band
In this channel combination In this channel combination the water bodies are present the water bodies are present in in blackblack; ; the urban areas and areas the urban areas and areas without vegetation present in without vegetation present in white bluewhite blue--violet;violet;the deciduous forests are the deciduous forests are present in orange; present in orange; the coniferous forest present the coniferous forest present by dark redby dark red--brownbrownBy comparison between 2000 By comparison between 2000 and 1991 images were found and 1991 images were found tree zones of impacttree zones of impact : -- around of around of VelingradVelingrad town; town; -- DospatDospat river area; river area; -- upper of upper of DospatDospat
We will make a We will make a demonstration for one of demonstration for one of those areasthose areas
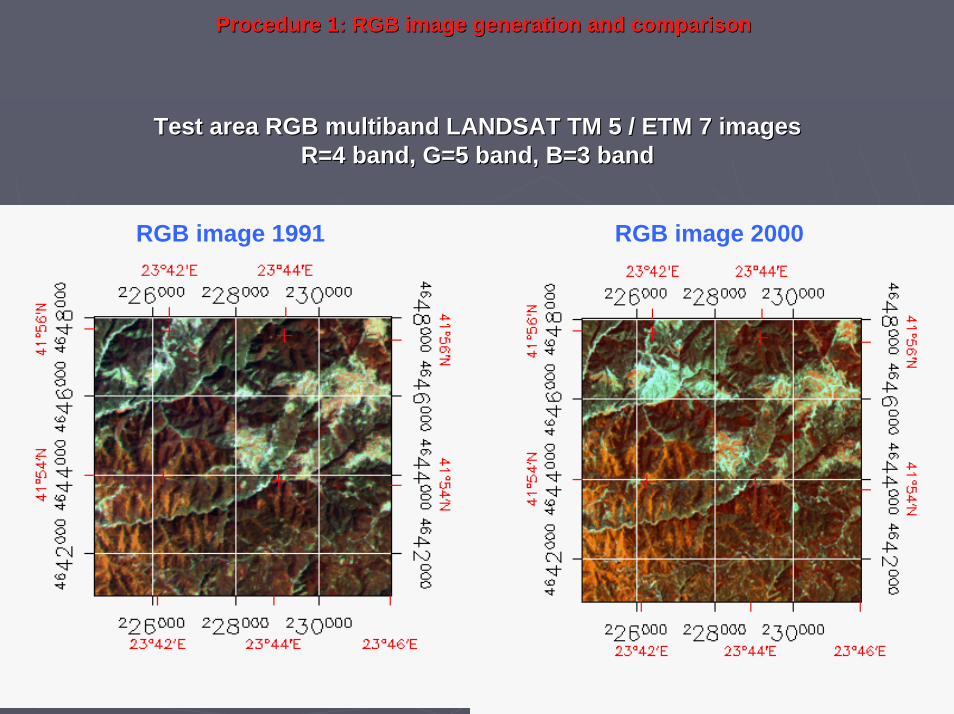
Procedure 1: RGB image generation and comparisonProcedure 1: RGB image generation and comparison
Test area RGB Test area RGB multibandmultiband LANDSAT TM 5 / ETM 7 images LANDSAT TM 5 / ETM 7 images R=4 band, G=5 band, B=3 bandR=4 band, G=5 band, B=3 band
RGB image 1991 RGB image 2000
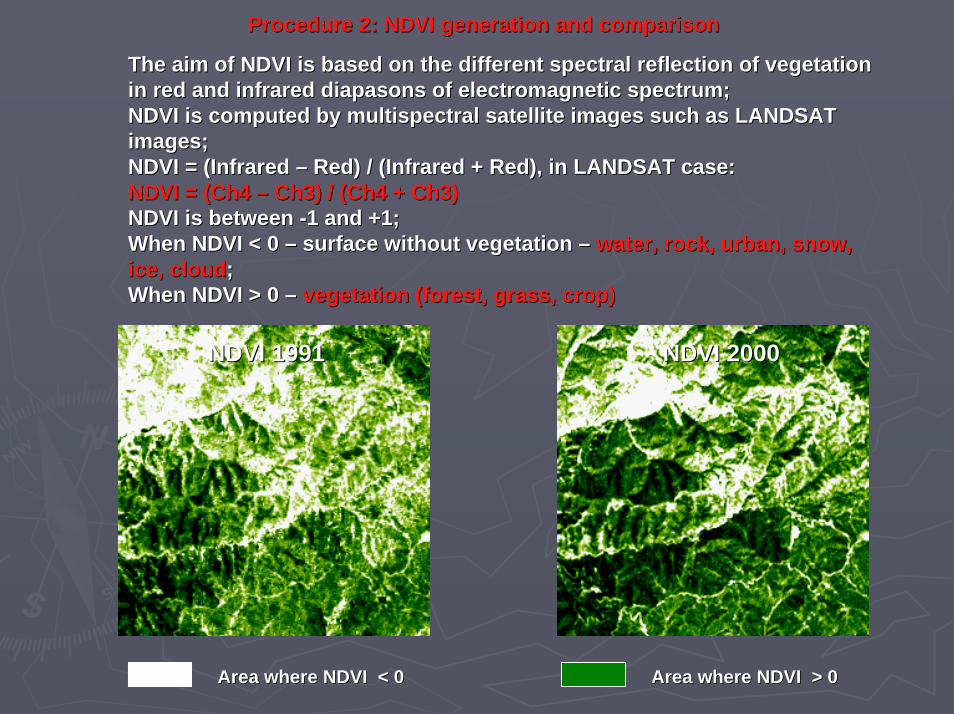
Procedure 2: NDVI generation and comparisonProcedure 2: NDVI generation and comparison
The aim of NDVI is based on the different spectral reflection ofThe aim of NDVI is based on the different spectral reflection of vegetationvegetationin red and infrared diapasons of electromagnetic spectrum;in red and infrared diapasons of electromagnetic spectrum;NDVI is computed by NDVI is computed by multispectralmultispectral satellite images such as LANDSAT satellite images such as LANDSAT images;images;NDVI = (Infrared NDVI = (Infrared –– Red) / (Infrared + Red), in LANDSAT case: Red) / (Infrared + Red), in LANDSAT case: NDVI = (Ch4 NDVI = (Ch4 –– Ch3) / (Ch4 + Ch3)Ch3) / (Ch4 + Ch3)NDVI is between NDVI is between --1 and +1; 1 and +1; When NDVI < 0 When NDVI < 0 –– surface without vegetation surface without vegetation –– water, rock, urban, snow, water, rock, urban, snow, ice, cloudice, cloud;;When NDVI > 0 When NDVI > 0 –– vegetation (forest, grass, crop)vegetation (forest, grass, crop)
RGB image 1991
Area where NDVI < 0Area where NDVI < 0 Area where NDVI > 0 Area where NDVI > 0
NDVI 1991NDVI 1991 RGB image 2000NDVI 2000NDVI 2000
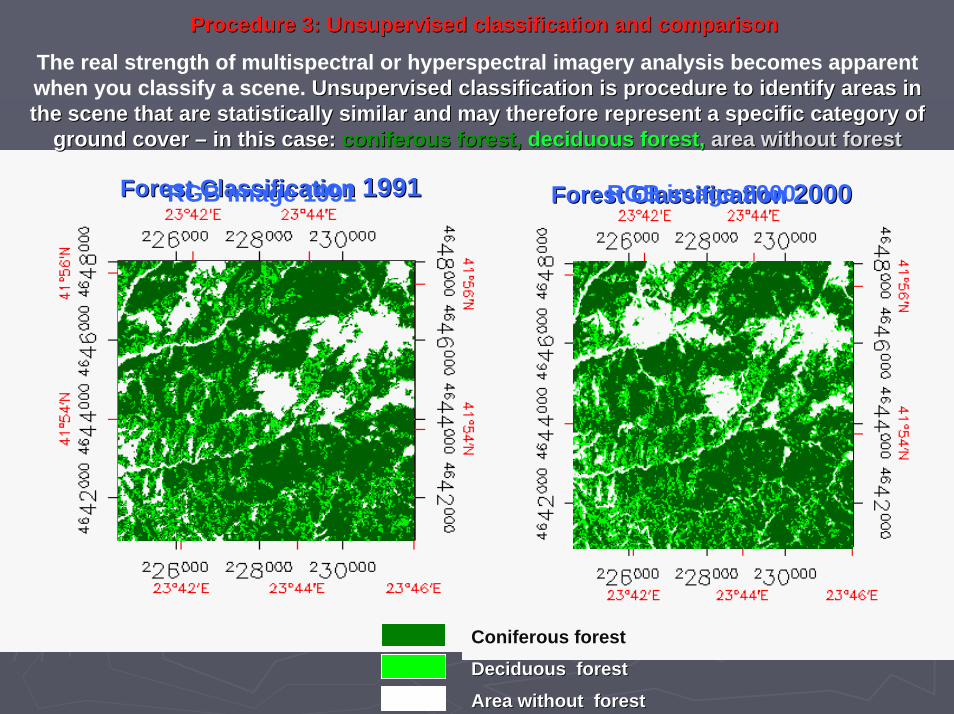
Procedure 3: Unsupervised classification and comparisonProcedure 3: Unsupervised classification and comparison
Forest Classification Forest Classification 19911991 Forest Classification Forest Classification 20002000
Coniferous forestConiferous forest
Deciduous forestDeciduous forest
Area without forestArea without forest
The real strength of multispectral or hyperspectral imagery analysis becomes apparent when you classify a scene. Unsupervised classification is procedure to identify areas in Unsupervised classification is procedure to identify areas in the scene that are statistically similar and may therefore reprethe scene that are statistically similar and may therefore represent a specific category of sent a specific category of
ground cover ground cover –– in this case: in this case: coniferous forest,coniferous forest, deciduous forest,deciduous forest, area without forestarea without forest
RGB image 1991 RGB image 2000
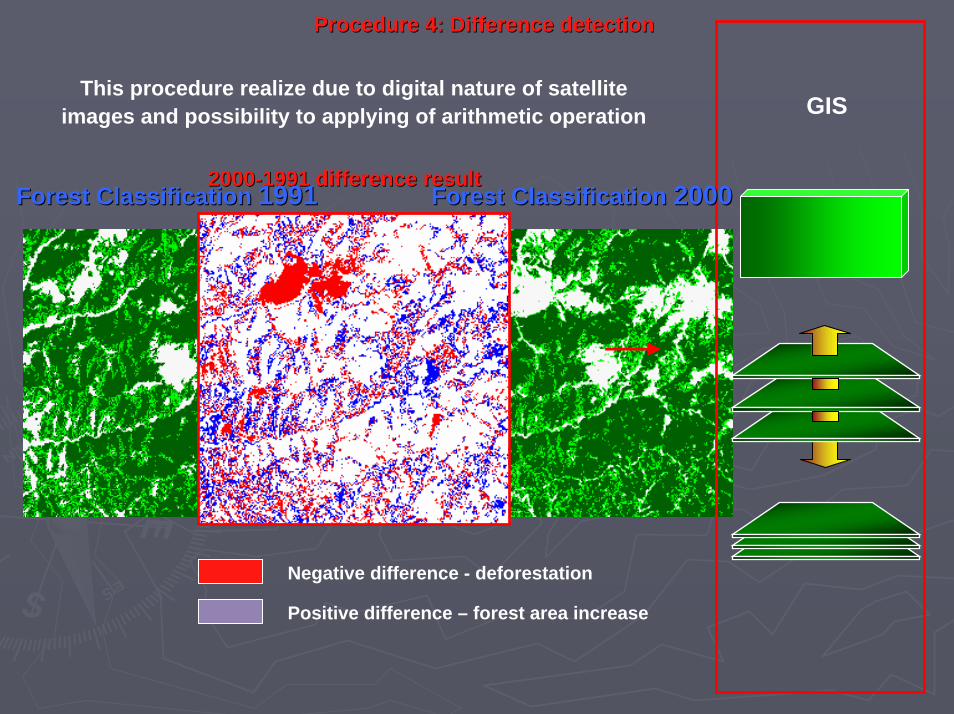
Procedure 4: Difference detectionProcedure 4: Difference detection
20002000--1991 difference result1991 difference result
Negative difference - deforestation
Positive difference – forest area increase
GISThis procedure realize due to digital nature of satellite
images and possibility to applying of arithmetic operation
Forest Classification Forest Classification 19911991 Forest Classification Forest Classification 20002000
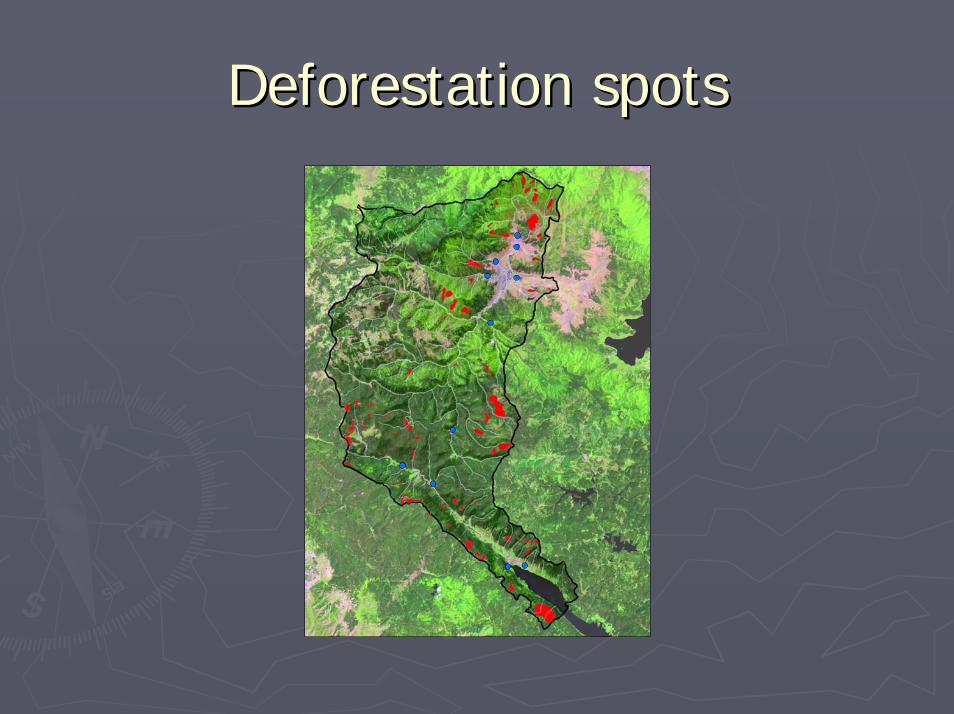
Deforestation spotsDeforestation spots
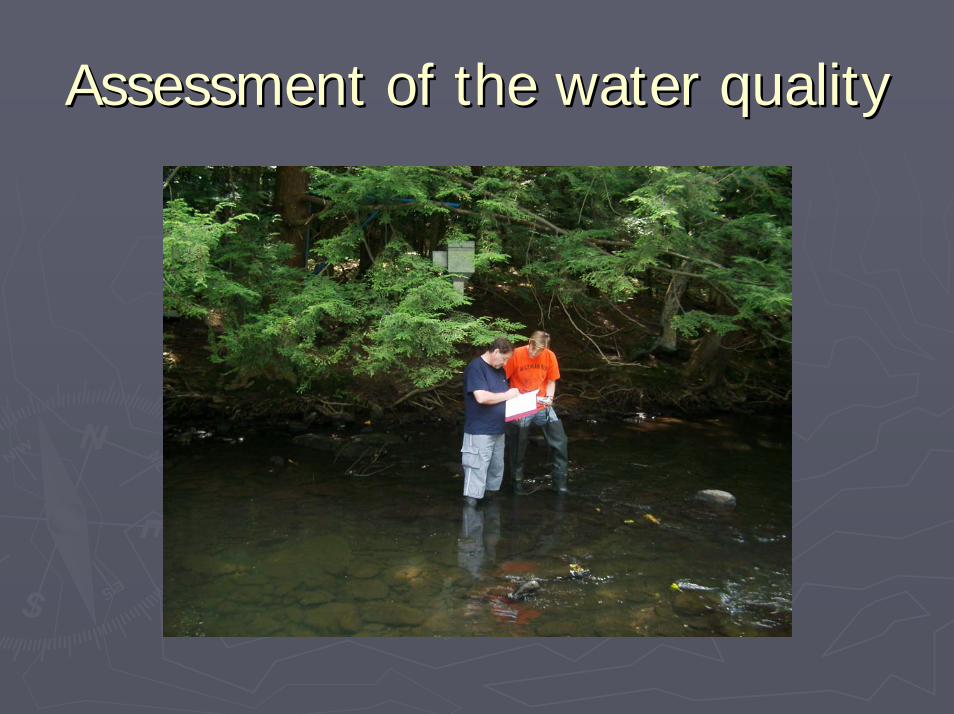
Assessment of the water qualityAssessment of the water quality
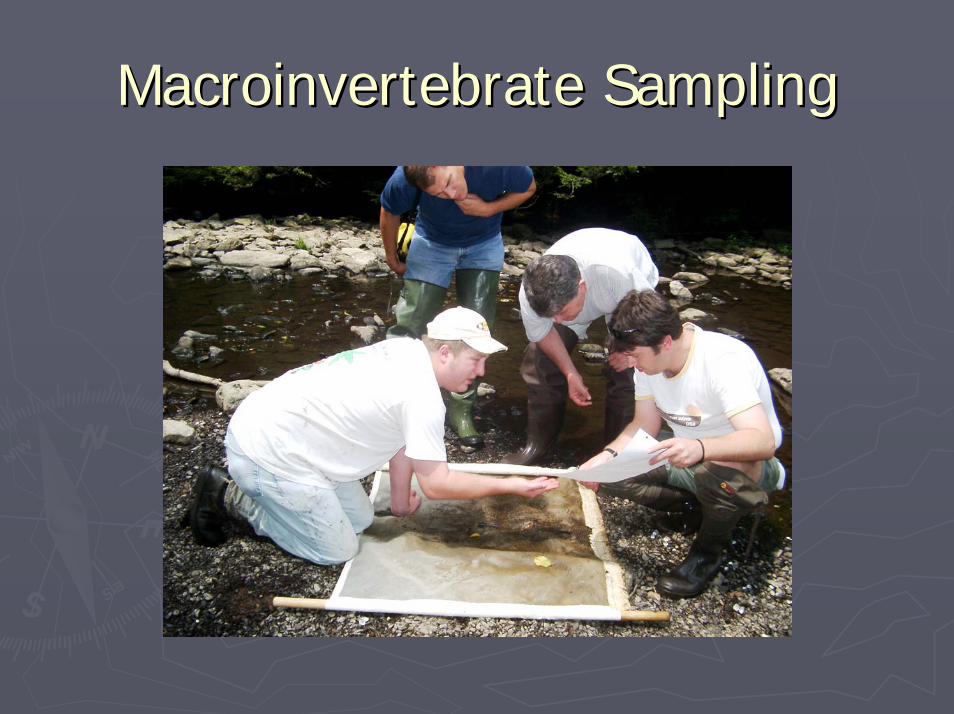
MacroinvertebrateMacroinvertebrate SamplingSampling
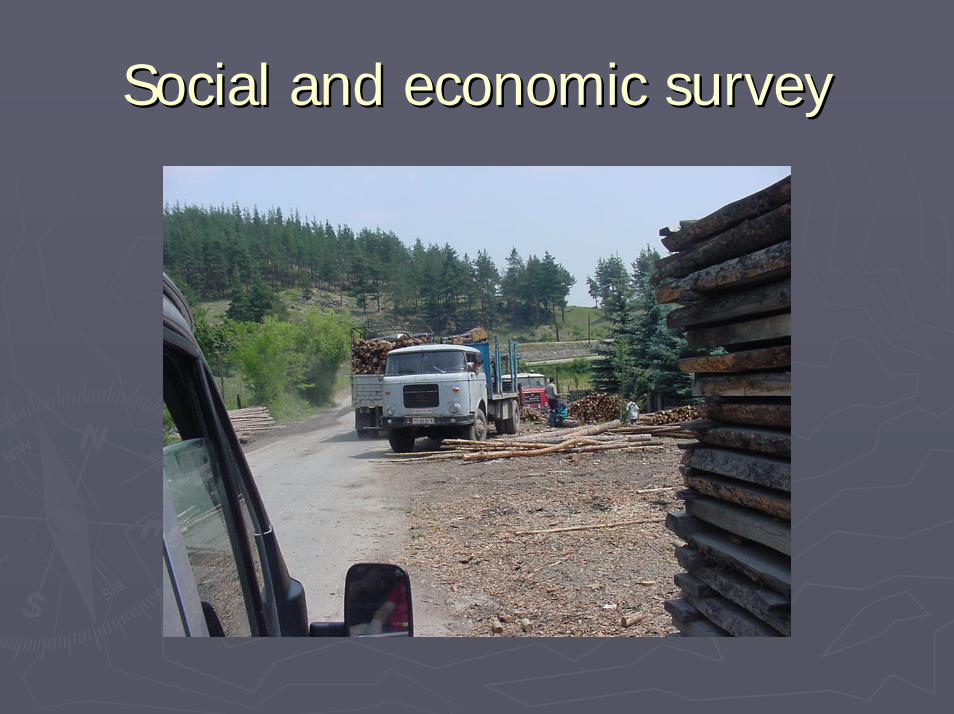
Social and economic surveySocial and economic survey
How we connected the research with How we connected the research with teaching process?teaching process?
►► Two Ph.D. students Two Ph.D. students –– one from the States one from the States and one from Bulgaria were involvedand one from Bulgaria were involved
►►Five students from our master degree Five students from our master degree participatedparticipated
►►Five undergraduate students were involvedFive undergraduate students were involved
Why students were exited?Why students were exited?
►►Because they were involved in a “real world Because they were involved in a “real world project”project”
►►Because they were able to see the Because they were able to see the “Geography” in action“Geography” in action
►►Because they realized the power of Because they realized the power of geography to integrategeography to integrate
►►They received knowledge and skills, which They received knowledge and skills, which might find them a job might find them a job