Embed Size (px)
Citation preview

Chapter 4: Health Care Providers and Professionals
Lecturer: Monika M. Wahi, MPH, CPH
Learning Objectives
Explain why health care professionals make up such a large proportion of the U.S. work force
Name three types of allied health professionals Describe the role and value of non-physician
practitioners List two differences between primary and
specialty care Understand the role of dentists, pharmacists,
and other doctoral-level health professionals
At the end of this lecture, student should be able to:

Introduction
Introduction U.S. health care industry is the largest
employer in the U.S. – 13% of the U.S. labor force
Over the years, services offered and types of health care professionals available are closely linked Remember Market Justice?
Likewise, the distribution of types of services and types of providers has evolved over time
Current imbalances Too many specialists, not enough
generalists Maldistribution of practitioners –
oversupply of the wrong type of physicians
Roles for NPPs, PA’s, and nurse midwives increasing
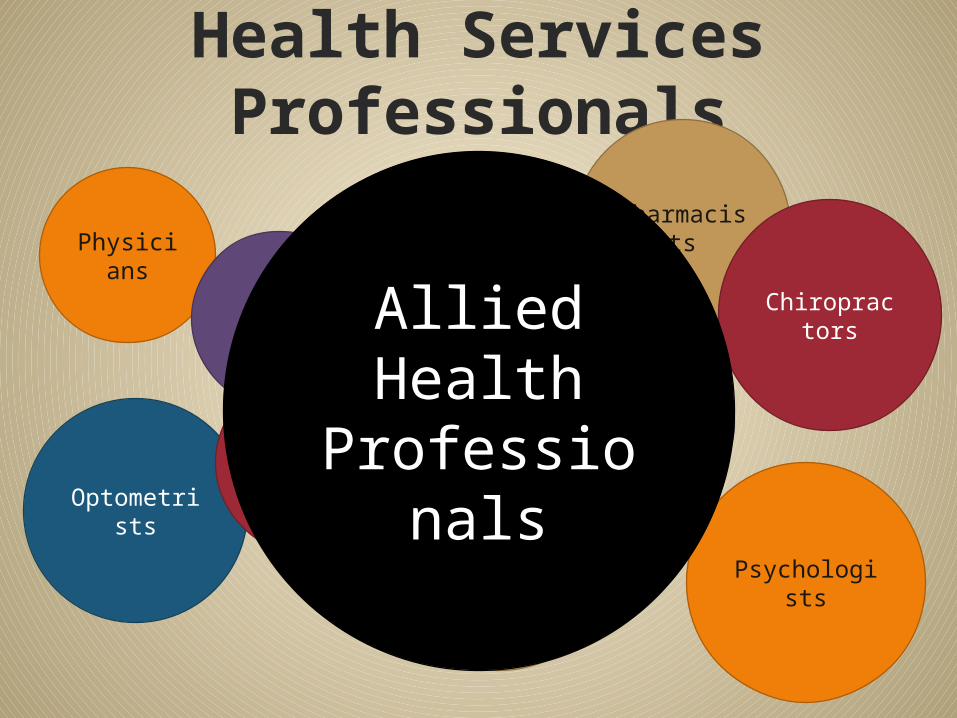
Health Services Professionals
Physicians
Dentists
Pharmacists
Optometrists
Chiropractors
Psychologists
Nurses
Podiatrists
NPPs
Health Service
Administrators
Allied Health
Professionals

Allied Health Professionals
Therapists
Lab/Rad Technicians
Social Workers
Health Educators
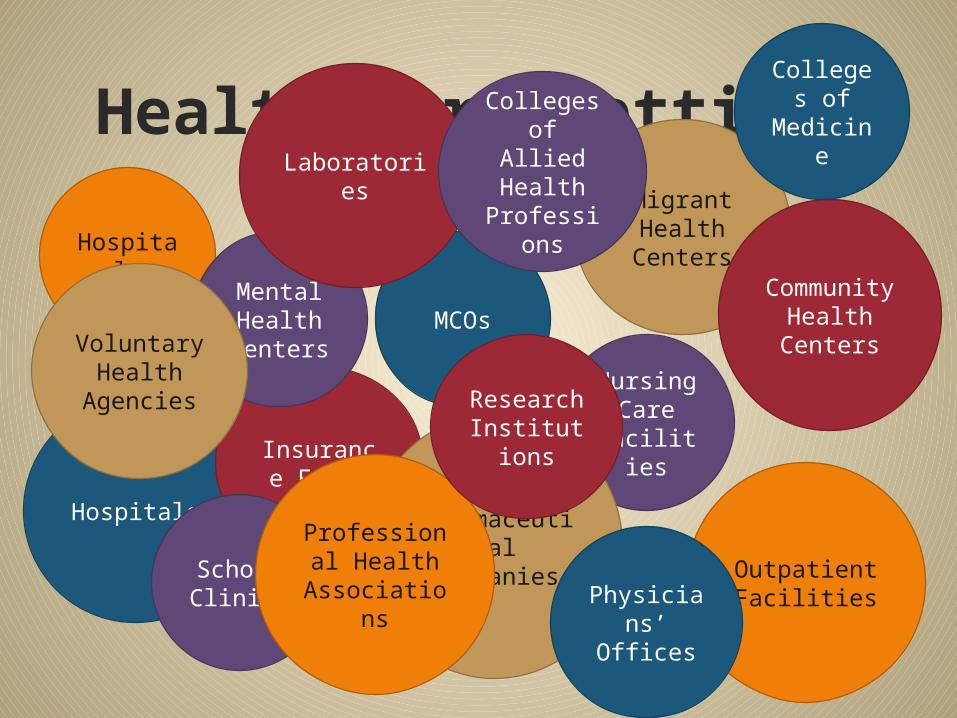
Health Care Settings
Hospitals
Nursing Care
Facilities
Migrant Health Centers
Hospitals
Community Health Centers
Outpatient Facilities
MCOs
Insurance Firms
Mental Health Centers
Pharmaceutical
CompaniesSchool Clinics Physician
s’ Offices
Laboratories
Voluntary Health
Agencies
Professional Health
Associations
Colleges of
Medicine
Colleges of Allied Health
Professions
Research Institutio
ns

Persons Employed at Health Service Sites
1994 2001 20090
1,000
2,000
3,000
4,000
5,000
6,000
7,000
Phys. Ofc's/ClinDent. Ofc's/ClinChiro. Ofc's/ClinHospitalsNurs. Care Facs.Other Svc. Sites
Nu
mb
er
of
Pers
on
s in
Th
ou
san
ds
From Table 4.1 (page 81)
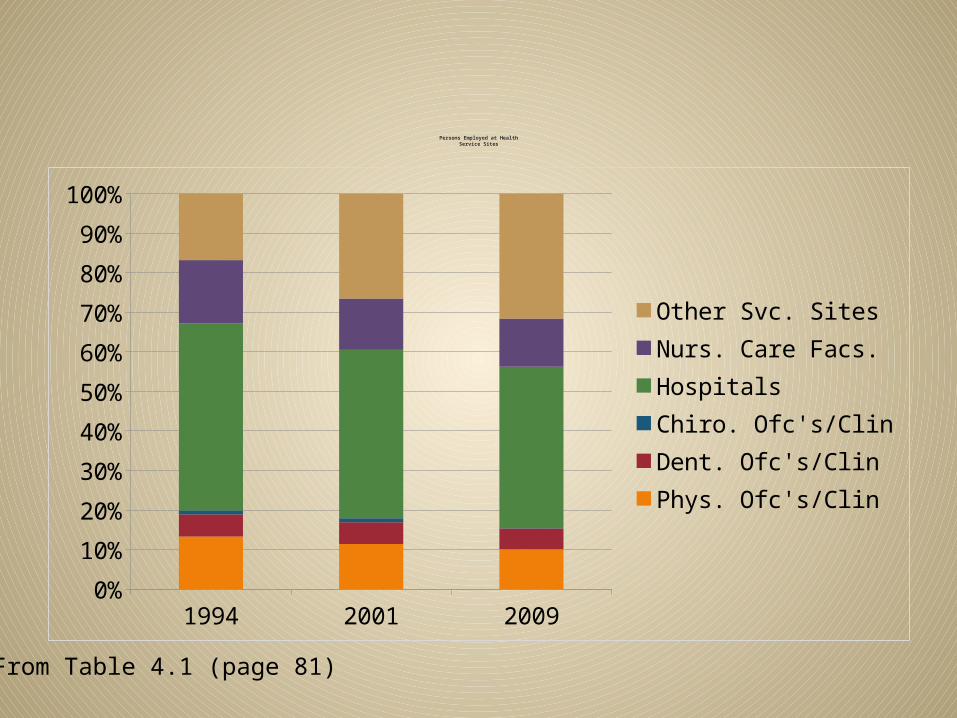
Persons Employed at HealthService Sites
1994 2001 20090%
10%
20%
30%
40%
50%
60%
70%
80%
90%
100%
Other Svc. SitesNurs. Care Facs.HospitalsChiro. Ofc's/ClinDent. Ofc's/ClinPhys. Ofc's/Clin
From Table 4.1 (page 81)

Physicians

Active Physicians per 10,000 Population
1950 1960 1970 1980 1990 1995 2000 20090
5
10
15
20
25
30
From Table 4.2 (page 83)
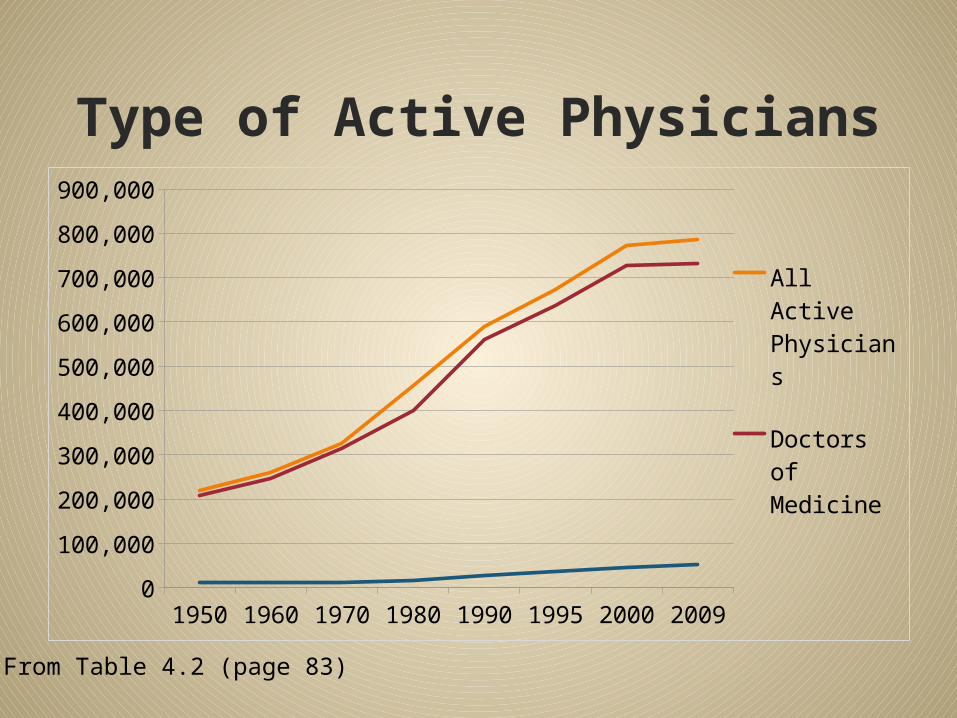
Type of Active Physicians
1950 1960 1970 1980 1990 1995 2000 20090
100,000
200,000
300,000
400,000
500,000
600,000
700,000
800,000
900,000
All Active Physicians
Doctors of Medicine
Doctors of Osteopa-thy
From Table 4.2 (page 83)
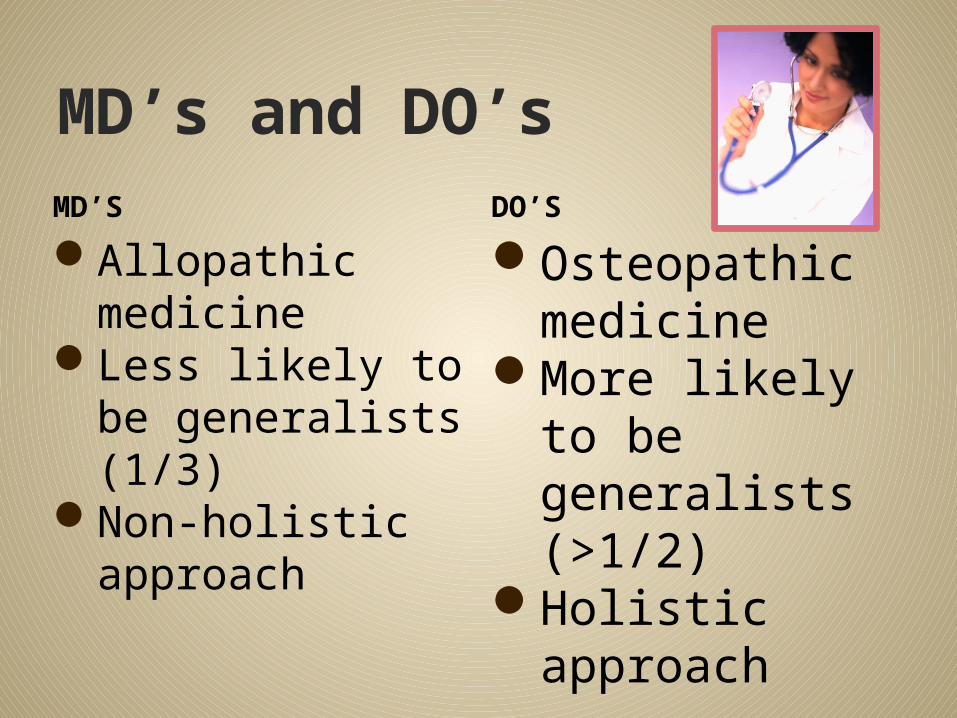
MD’s and DO’sMD’S
Allopathic medicine
Less likely to be generalists (1/3)
Non-holistic approach
DO’S
Osteopathic medicine
More likely to be generalists (>1/2)
Holistic approach
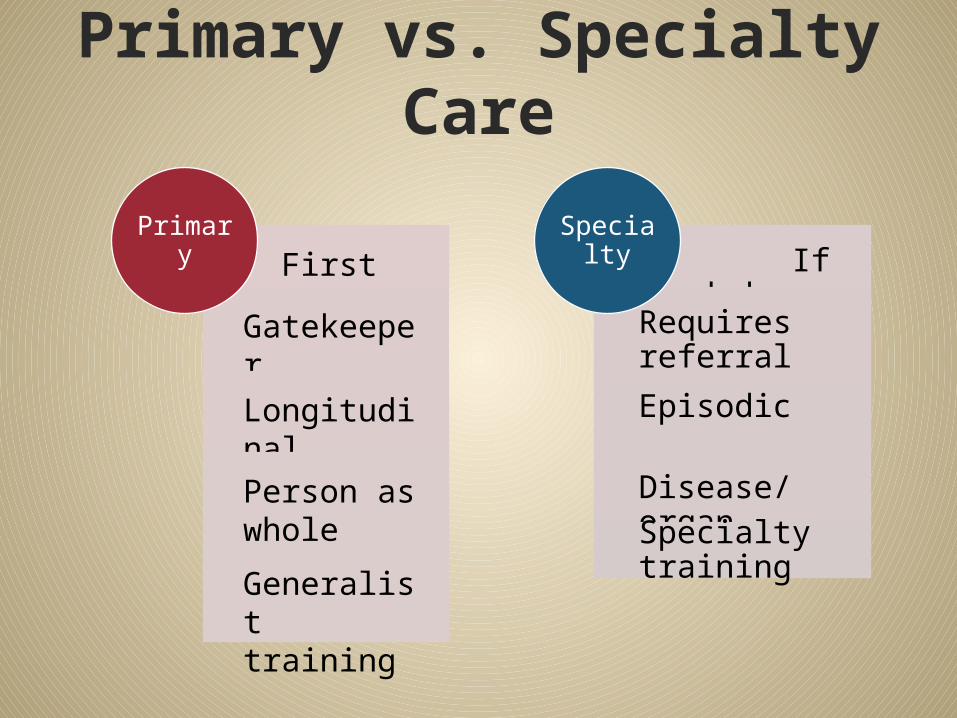
Primary vs. Specialty Care
First contactGatekeeper
LongitudinalPerson as whole
Generalist training
Primary If neededRequires referral
Episodic
Disease/organSpecialty training
Specialty

Aggregate Physician Oversupply
Too many specialists
Not enough OB/GYN, Peds, IM, Gen/Fam Practice
Shortage?
Geographic maldistributionSpecialty maldistribution
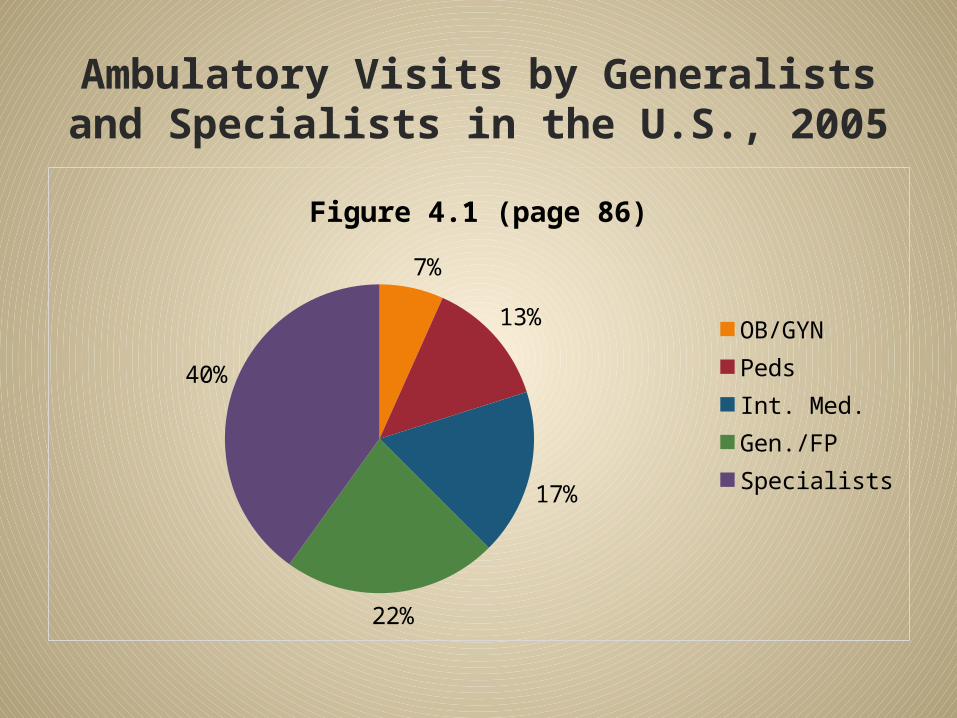
Ambulatory Visits by Generalists and Specialists in the U.S., 2005
7%
13%
17%
22%
40%
Figure 4.1 (page 86)
OB/GYNPedsInt. Med.Gen./FPSpecialists
Dentists

Distribution of Specialties for Dentists, 2008
120200; 85%
7700; 5%
6700; 5%7400; 5%Table 4.3 (page 90)
DentistsOrthodontistsOral SurgeonsDentists, all other

Pharmacists
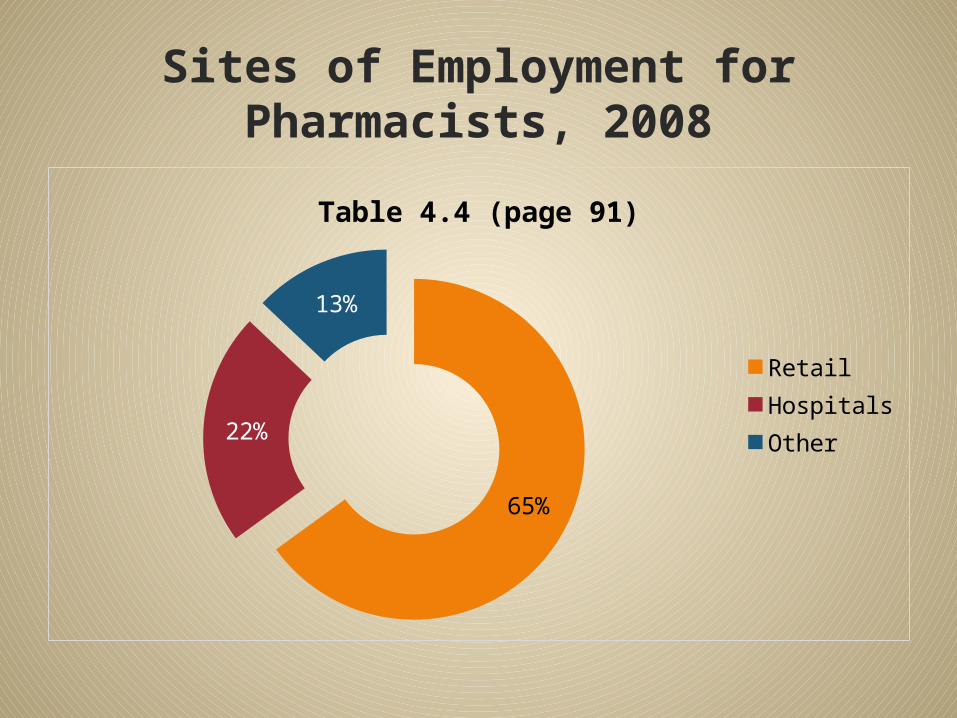
Sites of Employment for Pharmacists, 2008
65%
22%
13%
Table 4.4 (page 91)
RetailHospitalsOther
Other Doctoral-level Health Professionals

Employment Levels of Doctoral-level Health Professionals in the United States, 2008
0
20,000
40,000
60,000
80,000
100,000
120,000
140,000
160,000
180,000
34,800
170,200
12,200
49,100
OptometristsPsychologistsPodiatristsChiropractors
Nu
mb
er
of
Pro
fessio
nals
From Table 4.5 (page 92)
Nurses
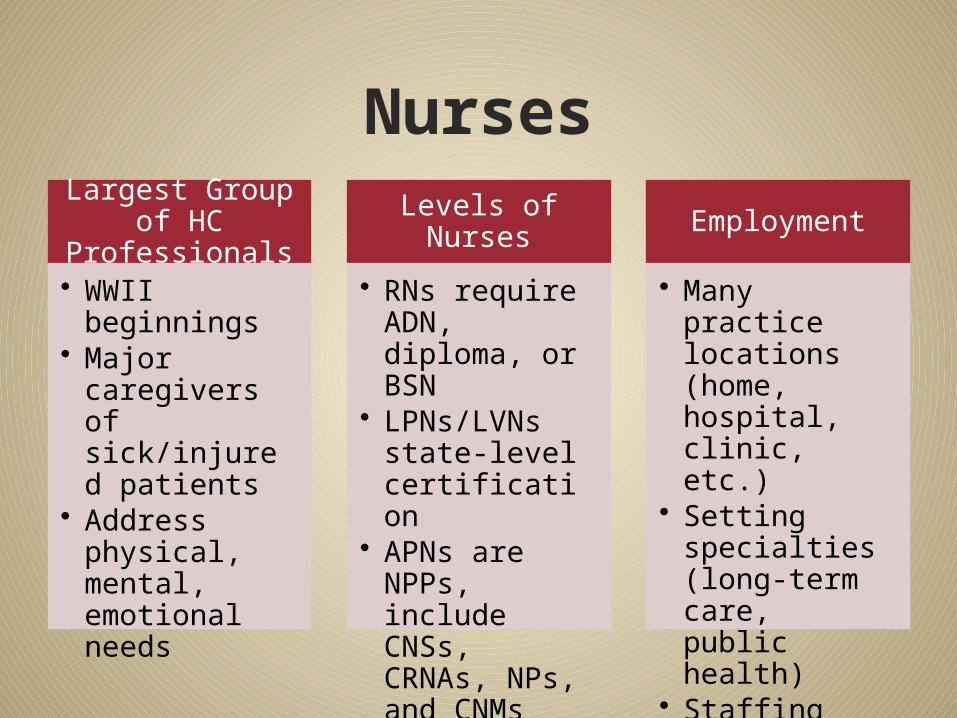
NursesLargest Group
of HC Professionals
• WWII beginnings
• Major caregivers of sick/injured patients
• Address physical, mental, emotional needs
Levels of Nurses
• RNs require ADN, diploma, or BSN
• LPNs/LVNs state-level certification
• APNs are NPPs, include CNSs, CRNAs, NPs, and CNMs
Employment
• Many practice locations (home, hospital, clinic, etc.)
• Setting specialties (long-term care, public health)
• Staffing issues, nursing shortage
Non-physician Practitioners NPP

Distribution of Most Common NPPs, 2008 Survey
158348; 67%
70383; 30%
8000; 3%
2
NP'sPA'sCNM's
50%/50% split between Primary
and Specialty Care
Work predominantly in
Primary Care
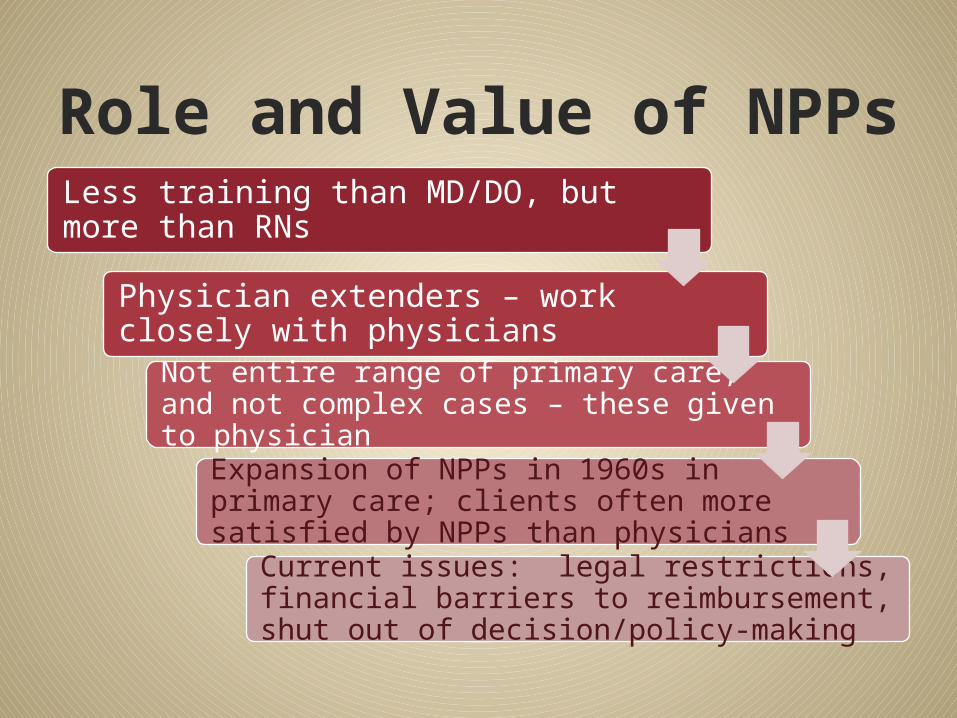
Role and Value of NPPsLess training than MD/DO, but more than RNs
Physician extenders – work closely with physicians
Not entire range of primary care, and not complex cases – these given to physician
Expansion of NPPs in 1960s in primary care; clients often more satisfied by NPPs than physicians
Current issues: legal restrictions, financial barriers to reimbursement, shut out of decision/policy-making
Allied Health Professionals
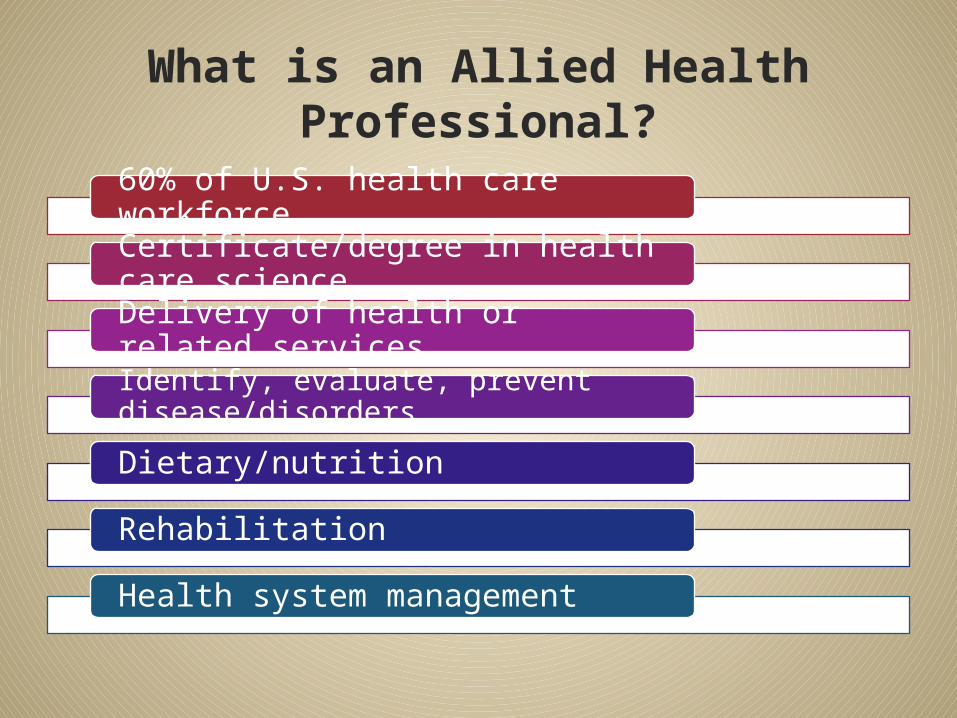
What is an Allied Health Professional?
60% of U.S. health care workforce
Certificate/degree in health care scienceDelivery of health or related servicesIdentify, evaluate, prevent disease/disorders
Dietary/nutrition
Rehabilitation
Health system management
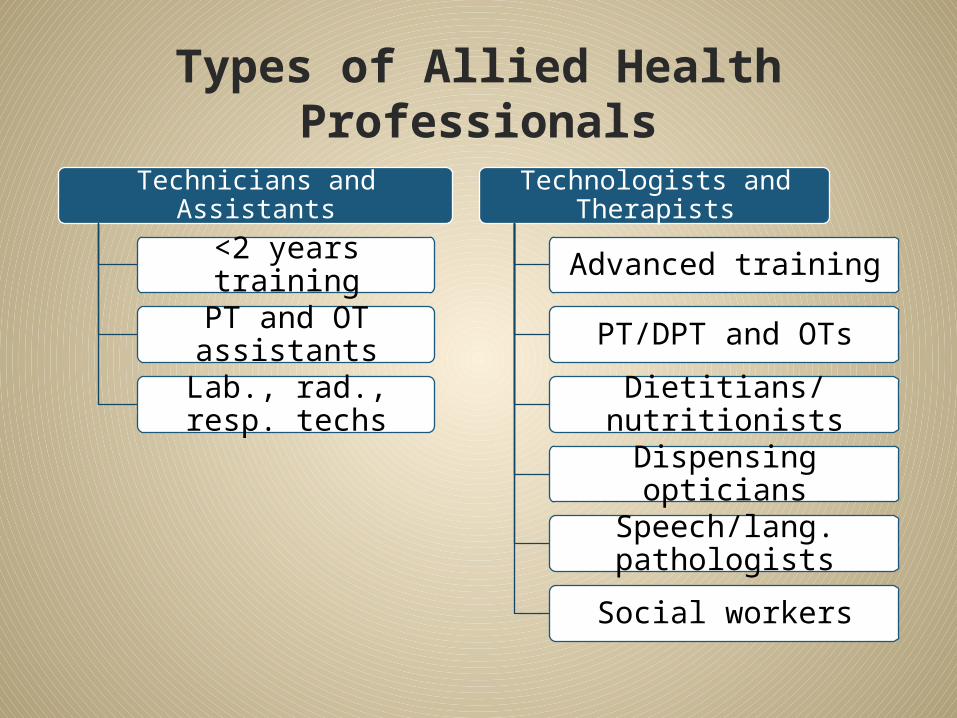
Types of Allied Health Professionals
Technicians and Assistants
<2 years training
PT and OT assistants
Lab., rad., resp. techs
Technologists and Therapists
Advanced training
PT/DPT and OTs
Dietitians/nutritionists
Dispensing opticians
Speech/lang. pathologists
Social workers
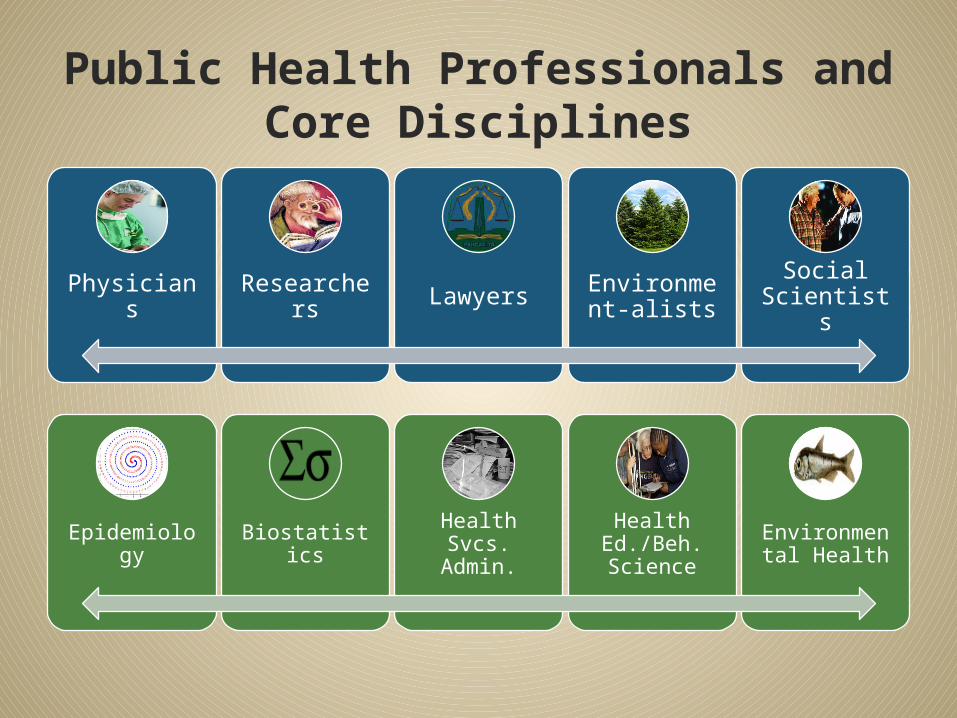
Public Health Professionals and Core Disciplines
Physicians Researchers Lawyers Environme
nt-alistsSocial
Scientists
Epidemiology Biostatistics Health Svcs. Admin.
Health Ed./Beh. Science
Environmental Health
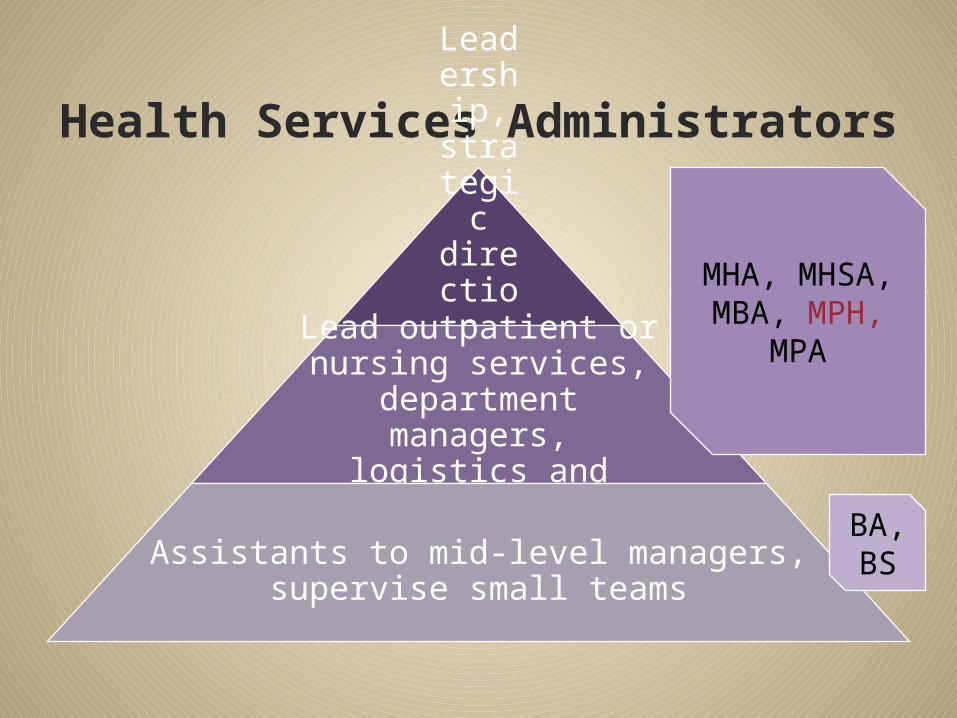
Health Services Administrators
Leadership, strategic direction, governing
boardsLead outpatient or nursing services,
department managers, logistics
and operationsAssistants to mid-level
managers, supervise small teams
BA, BS
MHA, MHSA,
MBA, MPH, MPA
Conclusion As health care evolves, we are challenged
with the maldistribution of physicians NPPs are needed to help, but there are
obstacles there as well Strong role for nurses, and many career
opportunities for nurses at different levels Other health care professionals have
various levels of training, dx/tx authority, and roles Dentists, public health professionals, health
service administrators, pharmaceuticals

Learning Objectives
Explain why health care professionals make up such a large proportion of the U.S. work force
Name three types of allied health professionals Describe the role and value of non-physician
practitioners List two differences between primary and
specialty care Understand the role of dentists, pharmacists,
and other doctoral-level health professionals
At the end of this lecture, student should be able to: