Embed Size (px)
Citation preview
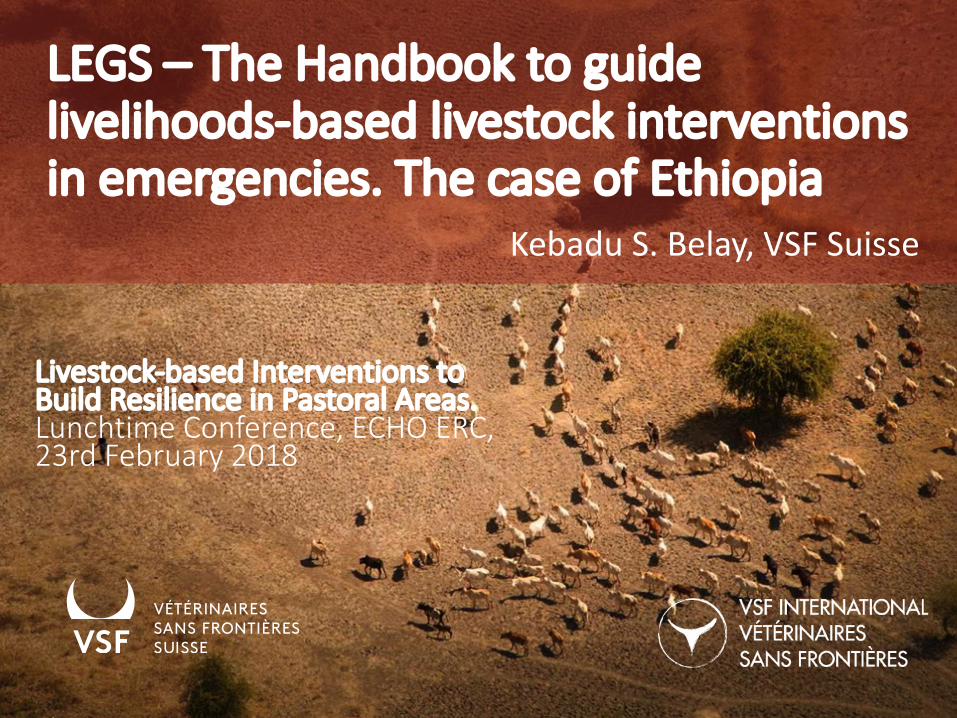
LEGS – The Handbook to guidelivelihoods-based livestock interventionsin emergencies. The case of Ethiopia
Livestock-based Interventions to Build Resilience in Pastoral Areas.Lunchtime Conference, ECHO ERC, 23rd February 2018
Kebadu S. Belay, VSF Suisse
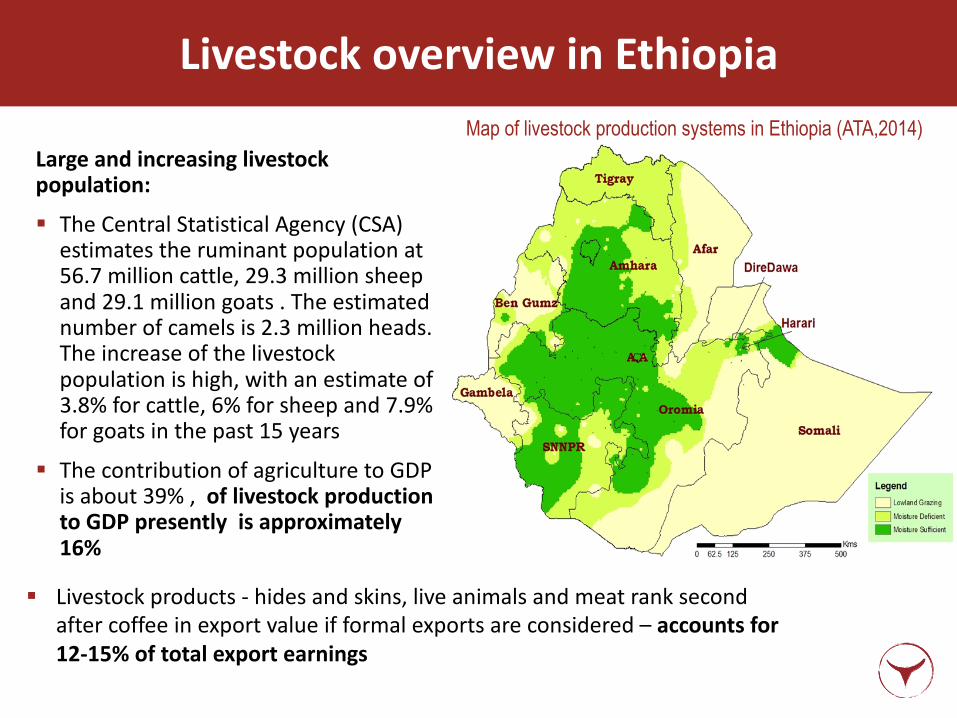
Large and increasing livestock population: § The Central Statistical Agency (CSA)
estimates the ruminant population at
56.7 million cattle, 29.3 million sheep
and 29.1 million goats . The estimated
number of camels is 2.3 million heads.
The increase of the livestock
population is high, with an estimate of
3.8% for cattle, 6% for sheep and 7.9%
for goats in the past 15 years
§ The contribution of agriculture to GDP
is about 39% , of livestock production to GDP presently is approximately 16%
Livestock overview in Ethiopia
§ Livestock products - hides and skins, live animals and meat rank second
after coffee in export value if formal exports are considered – accounts for 12-15% of total export earnings
Map of livestock production systems in Ethiopia (ATA,2014)

Income earning:
§ Contributes 37 – 87% of households income
§ Only for a limited (and predominantly wealthy) set of households, do livestock significantly contribute to monetary income, with many (predominantly poorer) people benefiting not so much from the cash derived from selling livestock or animal products, as from the other livelihoods services that livestock provides
§ Incidence of poverty, which is clearly decreasing in the past decade, is expected to continue to decrease from about 22% at present to roughly 17% in 2021 (MDG Report of Ethiopia, 2014)

Contributions to livelihoods:
§ About 80% of the 102 million population lives in rural areas and at least 80% of these depend on livestock to make a living .
§ Production of food (meat, milk, honey, egg); source of power (cultivation , transportation); and input for crop production (drought power and manure
§ The proportion of the population living in rural areas is the highest in Africa, but the rate of urbanization is 3.8% per year, compared to the overall growth of population of 2.4%. Thus the urban population may triple in 25 years, which implicates food security .
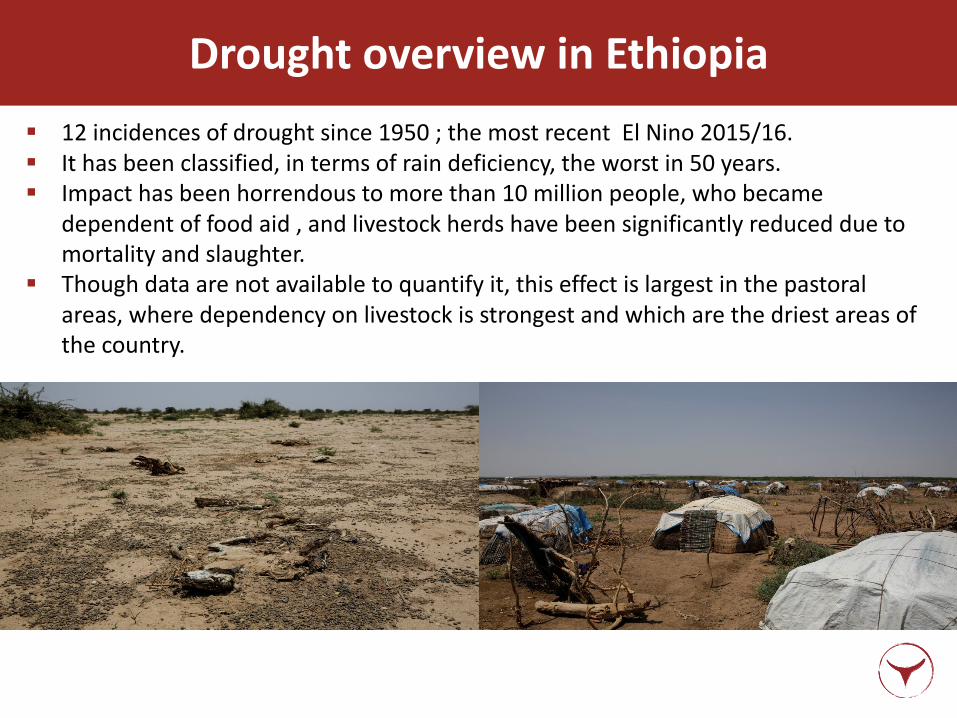
Drought overview in Ethiopia§ 12 incidences of drought since 1950 ; the most recent El Nino 2015/16. § It has been classified, in terms of rain deficiency, the worst in 50 years. § Impact has been horrendous to more than 10 million people, who became
dependent of food aid , and livestock herds have been significantly reduced due to mortality and slaughter.
§ Though data are not available to quantify it, this effect is largest in the pastoral areas, where dependency on livestock is strongest and which are the driest areas of the country.

Item
Amount (USD millions) by year
2014 2015 2016Drought
2017Drought
Total humanitarian requirement 403 386 1,400 948
Food assistance 305 282 1,100 598
Livestock 5 3 43 42
Agriculture 9 15 46 412
Food as a proportion of total requirement 76% 73% 79% 63%Livestock as a proportion of total requirement 1% 1% 3% 4%
Livestock as a proportion of agriculture 52% 19% 93% 100%
Trends in humanitarian funding requests -Ethiopia
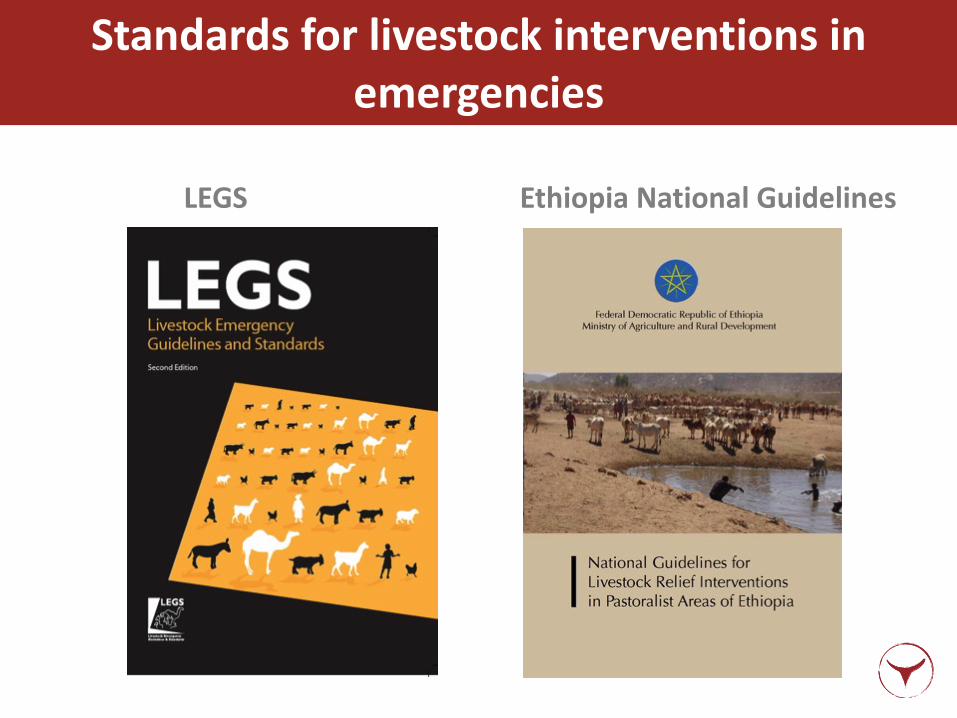
Standards for livestock interventions in emergencies
LEGS Ethiopia National Guidelines
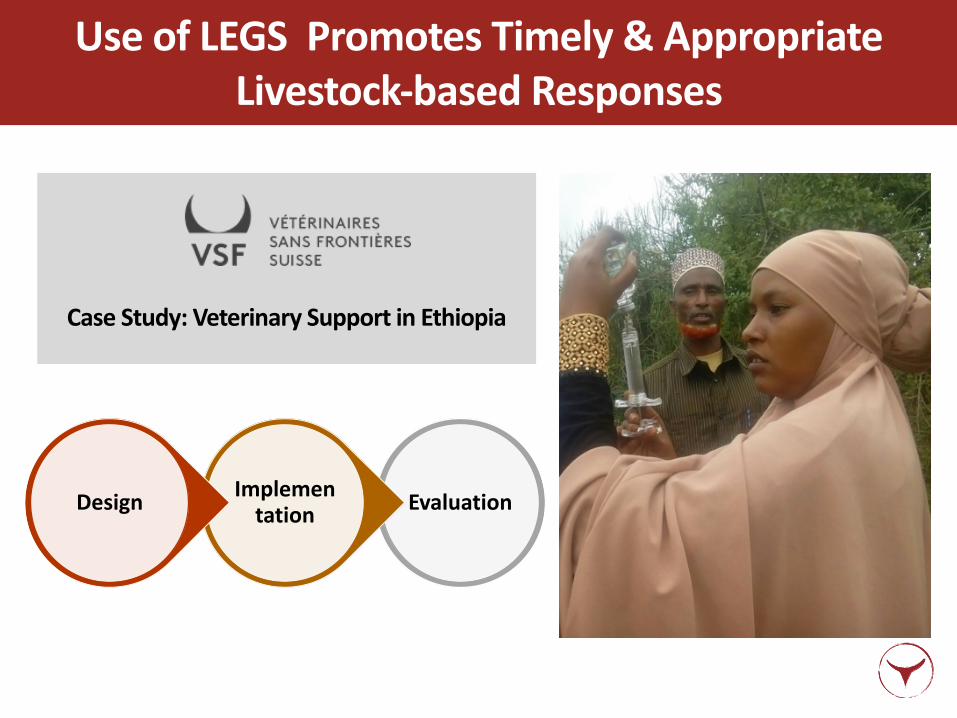
Use of LEGS Promotes Timely & Appropriate Livestock-based Responses
EvaluationImplementationDesign
Case Study: Veterinary Support in Ethiopia
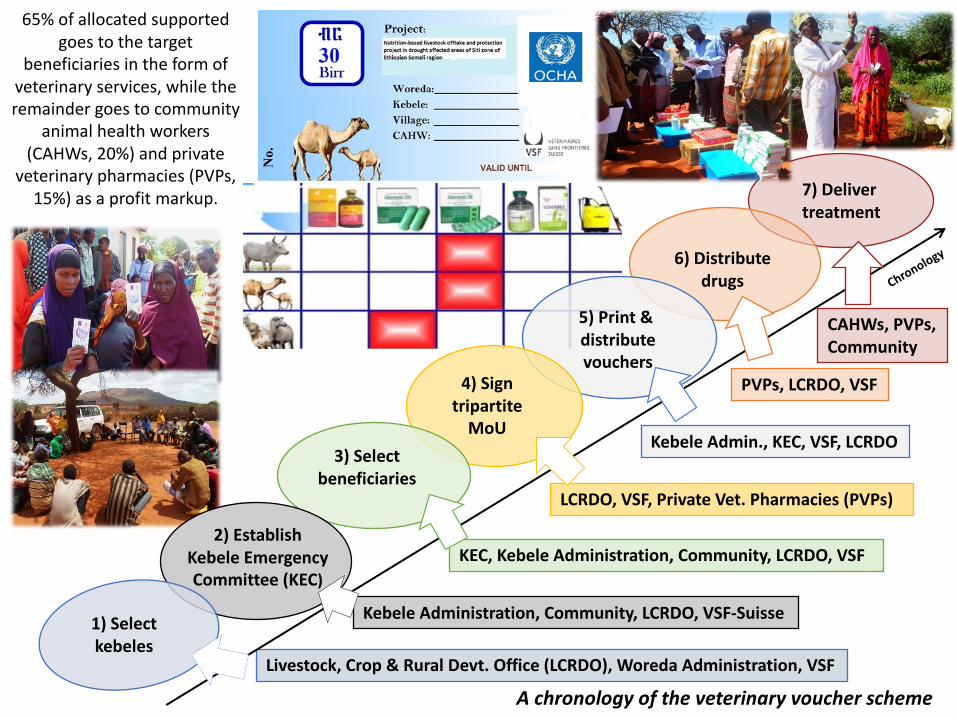
7) Deliver treatment
Livestock, Crop & Rural Devt. Office (LCRDO), Woreda Administration, VSF
Kebele Administration, Community, LCRDO, VSF-Suisse
PVPs, LCRDO, VSF
Kebele Admin., KEC, VSF, LCRDO
KEC, Kebele Administration, Community, LCRDO, VSF
LCRDO, VSF, Private Vet. Pharmacies (PVPs)
CAHWs, PVPs,Community
6) Distributedrugs
65% of allocated supported goes to the target
beneficiaries in the form of veterinary services, while the remainder goes to community
animal health workers (CAHWs, 20%) and private
veterinary pharmacies (PVPs, 15%) as a profit markup.
5) Print & distributevouchers
4) Signtripartite
MoU3) Select
beneficiaries
Chronology
A chronology of the veterinary voucher scheme
2) EstablishKebele EmergencyCommittee (KEC)
1) Selectkebeles

Benefit-cost analysis : Veterinary Vouchers
Disease: prevalence estimates, CFR estimates and value of reduced mortality due to CAHW treatment
Disease Number of animals treated by CAHWs
CFR untreated
Number of deaths, if untreated
CRF treated
Number of deaths if treated
Number of animals saved
Value of animals saved (ETB)
Value of animals saved (USD)
Benefit-cost USD
Benefit-cost
Worm 250,000.00 50.0% 125,000 10.5% 26,250.00 98,750
Mange 42,000.00 40.0% 16,800 4.9% 2,058.00 14,742
CCPP 25,000.00 63.4% 15,850 28.5% 7,125.00 8,725
TBD 40,000.00 58.3% 23,320 37.9% 15,160.00 8,160
Other 150,000.00 33.3% 49.950 19.3% 28,950.00 21,000
507,000 230,920 79,543.00 151,377 90,826,200 3,948,965.22 93,576.45 42.20

to promoteEnvironmental
Health
Our goal: Sustainable livestock based livelihoods
to supportLivestock
Health
to ensurePeople’sHealth
What we do
Thank you!
www.vsf-international.org
www.vsf-suisse.org