Embed Size (px)
Citation preview

Les statines en Belgique: évolutions de l’utilisation et impact des politiques de
remboursement
KCE reports 141B
Centre fédéral d’expertise des soins de santé Federaal Kenniscentrum voor de Gezondheidszorg
2010
Le Centre fédéral d’expertise des soins de santé
Présentation : Le Centre fédéral d’expertise des soins de santé est un parastatal, créé le 24 décembre 2002 par la loi-programme (articles 262 à 266), sous tutelle du Ministre de la Santé publique et des Affaires sociales, qui est chargé de réaliser des études éclairant la décision politique dans le domaine des soins de santé et de l’assurance maladie.
Conseil d’administration
Membres effectifs : Pierre Gillet (Président), Dirk Cuypers (Vice président), Jo De Cock (Vice président), Frank Van Massenhove (Vice président), Yolande Avondtroodt, Jean-Pierre Baeyens, Ri de Ridder, Olivier De Stexhe, Johan Pauwels, Daniel Devos, Jean-Noël Godin, Floris Goyens, Jef Maes, Pascal Mertens, Marc Moens, Marco Schetgen, Patrick Verertbruggen, Michel Foulon, Myriam Hubinon, Michael Callens, Bernard Lange, Jean-Claude Praet.
Membres suppléants : Rita Cuypers, Christiaan De Coster, Benoît Collin, Lambert Stamatakis, Karel Vermeyen, Katrien Kesteloot, Bart Ooghe, Frederic Lernoux, Anne Vanderstappen, Paul Palsterman, Geert Messiaen, Anne Remacle, Roland Lemeye, Annick Poncé, Pierre Smiets, Jan Bertels, Catherine Lucet, Ludo Meyers, Olivier Thonon, François Perl.
Commissaire du gouvernement : Yves Roger
Direction
Directeur général Raf Mertens
Directeur général adjoint: Jean-Pierre Closon
Contact
Centre fédéral d’expertise des soins de santé (KCE). Cité Administrative Botanique, Doorbuilding (10ème) Boulevard du Jardin Botanique, 55 B-1000 Bruxelles Belgium
Tel: +32 [0]2 287 33 88 Fax: +32 [0]2 287 33 85
Email : [email protected] Web : http://www.kce.fgov.be

Les statines en Belgique: évolutions de l’utilisation et
impact des politiques de remboursement
KCE reports 141B
DOMINIQUE ROBERFROID, CÉCILE DUBOIS, FRANCE VRIJENS, CÉCILE CAMBERLIN, MARIA ISABEL FARFAN
Centre fédéral d’expertise des soins de santé Federaal Kenniscentrum voor de gezondheidszorg
2010
KCE reports 141B
Titre : Les statines en Belgique: évolutions de l’utilisation et impact des politiques de remboursement
Auteurs: Dominique Roberfroid, Cécile Dubois, France Vrijens, Cécile Camberlin, Maria Isabel Farfan
Experts externes: Johan de Sutter (UZGent), Luc Hutsebaut (Christelijke Mutualiteit), Michel Boutsen (Mutualité Socialiste), Rudy De Cock (Pfizer), Marc Thomas (Astra Zeneca), David Fontaine (MSD), Veronique Halkin (Brystol-Meyers), Thierry Christiaens (Ugent & CBIP), Pierre Chevalier (INAMI / RIZIV), Virginie Peirs (FEBELGEN), Mark Lemiengre (Vakgroep Huisartsgeneeskunde en Eerstelijnsgezondheidszorg, UGent), Pierre Legat (cellule cardiologie, Société Scientifique de Médecine Générale).
Remerciements: Marc de Falleur (INAMI / RIZIV), Stephan Devriese (KCE)
Validateurs externes: Guy de Backer (UZGent), Christian Brohet (UCL), Philippe Schilliger (Prescrire)
Conflits d’intérêt: Aucun conflit déclaré
Disclaimer: Les experts externes ont été consultés sur une version (préliminaire) du rapport scientifique. Une version (finale) a ensuite été soumise aux validateurs. La validation du rapport résulte d’un consensus ou d’un vote majoritaire entre les validateurs. Ce rapport a été approuvé à l’unanimité par le Conseil d’administration Le KCE reste seul responsable des erreurs ou omissions qui pourraient subsister de même que des recommandations faites aux autorités publiques.
Mise en Page: Ine Verhulst
Bruxelles, 04 novembre 2010
Etude n° 2008-16
Domaine: Health Services Research (HSR)
MeSH: Cardiovascular Diseases ; Hydroxymethylglutaryl-CoA Reductase Inhibitors ; Primary Prevention ; Secondary Prevention ; Health Expenditures
Classification NLM: WG 120
Langage: français, anglais
Format: Adobe® PDF™ (A4)
Dépôt légal : D/2010/10.273/70
Ce document est disponible en téléchargement sur le site Web du Centre fédéral d’expertise des soins de santé.
Les rapports KCE sont publiés sous Licence Creative Commons « by/nc/nd » (http://kce.fgov.be/index_fr.aspx?SGREF=3439&CREF=15799).
Comment citer ce rapport?
Roberfroid D, Dubois C, Vrijens F, Camberlin C, Farfan MI. Les statines en Belgique: évolutions de l’utilisation et impact des politiques de remboursement. Health Services Research (HSR). Bruxelles: Centre fédéral d’expertise des soins de santé (KCE). 2010. KCE Reports 141B. D/2010/10.273/70.
KCE reports 141B Les statines en Belgique i
AVANT-PROPOS Les maladies cardiovasculaires constituent un déterminant majeur de mort prématurée et de morbidité dans notre société, et leur prévention est une priorité de santé publique. Cette prévention repose avant tout sur des changements du mode de vie : renoncement à la cigarette, exercice physique et régime alimentaire équilibré. Toutefois, si ceci ne suffit pas, il peut être indiqué de recourir à des médicaments, et notamment aux statines, qui abaissent le taux de cholestérol sanguin. Au cours des dix dernières années, cette classe de médicaments a pris une place prédominante dans ce type de prévention cardio-vasculaire, tant par le nombre d’utilisateurs que par son poids dans le budget de l’assurance maladie.
Outre la question de leur utilité médicale, l’usage de plus en plus répandu de ces molécules entraîne des interrogations fondamentales sur notre mode de vie actuel. Les statines sont-elles en train d’acquérir le statut de complément alimentaire utile à la santé comme l’iode dans le sel et le fluor dans le dentifrice ? On n’en est pas là, certes, mais dès qu’on préconise un médicament en prévention primaire, il y a d’énormes précautions qui s’imposent, non seulement sur le plan de la sécurité, mais aussi sur le plan budgétaire et en matière d’équité.
Compte tenu de ces éléments, il nous apparaissait important d’analyser les évolutions récentes dans l’utilisation des statines et le profil de leurs utilisateurs. Les mesures prises au fil des années quant aux modalités d’accès à certaines de ces molécules ont-elles eu un impact ? Dans quelles circonstances cliniques les différentes statines sont-elles utilisées en Belgique ? Et quelles sont les nouvelles tendances qui se dessinent ? Trouver une réponse à ces questions, tel est l’objectif du présent rapport. Il ne fait pour sûr pas le tour de ce sujet vaste et important mais nous osons espérer qu’il contribuera à mener plus avant une politique rationnelle en la matière.
Tout au long de ce projet, nous avons pu faire appel aux connaissances et à l’esprit critique d’experts issus du monde clinique, académique, des organismes assureurs, des autorités et de l’industrie. Leur apport dans un esprit franc et constructif a contribué de manière significative à la réalisation de l’étude, et nous les en remercions sincèrement.
Jean Pierre CLOSON Raf MERTENS
Directeur général adjoint Directeur général
ii Les statines en Belgique KCE reports 141B
Résumé
INTRODUCTION Les maladies cardiovasculaires (MCV), et plus particulièrement la maladie coronarienne (MC), constituent la principale cause de mortalité et de morbidité dans notre société. Le taux de cholestérol, notamment de cholestérol associé aux lipoprotéines de faible densité (C-LDL), qu’on appelle souvent ‘mauvais’ cholestérol, représente un facteur de risque important de MCV. En plus des aménagements apportés au mode de vie, notamment l’abandon du tabac et l’exercice physique, on peut réduire le risque de MCV grâce à des médicaments hypocholestérolémiants dont les statines sont actuellement les molécules phares. C’est la classe de médicaments la plus utilisée en Belgique, et 7% des dépenses totales en médicaments ambulatoires lui sont alloués. La prévention primaire est définie comme le recours aux statines chez les personnes n’ayant pas d’antécédents connus de MCV mais qui présentent un facteur de risque pour cette affection. La prévention secondaire est le recours aux statines dans le but de prévenir de nouveaux accidents cardiovasculaires chez les sujets ayant des antécédents de MCV. Il est bien établi que les statines peuvent réduire le risque d’épisodes de MCV aussi bien en prévention primaire que secondaire. Ceci dit, la réduction de ce risque, en termes absolus, sera d’autant plus grande que le risque individuel de souffrir de MCV est élevé et que la diminution du C-LDL obtenue est grande. La diminution de C-LDL dépend de la dose de statines utilisée et de la molécule prescrite (par exemple 40 mg de simvastatine produisent le même effet sur le C-LDL que 10 mg d’atorvastatine). Les effets secondaires, essentiellement une myopathie et une élévation des enzymes hépatiques, dépendent aussi de la dose. Le risque de diabète est aussi modérément augmenté. Les effets secondaires sévères sont rares.
Contexte belge
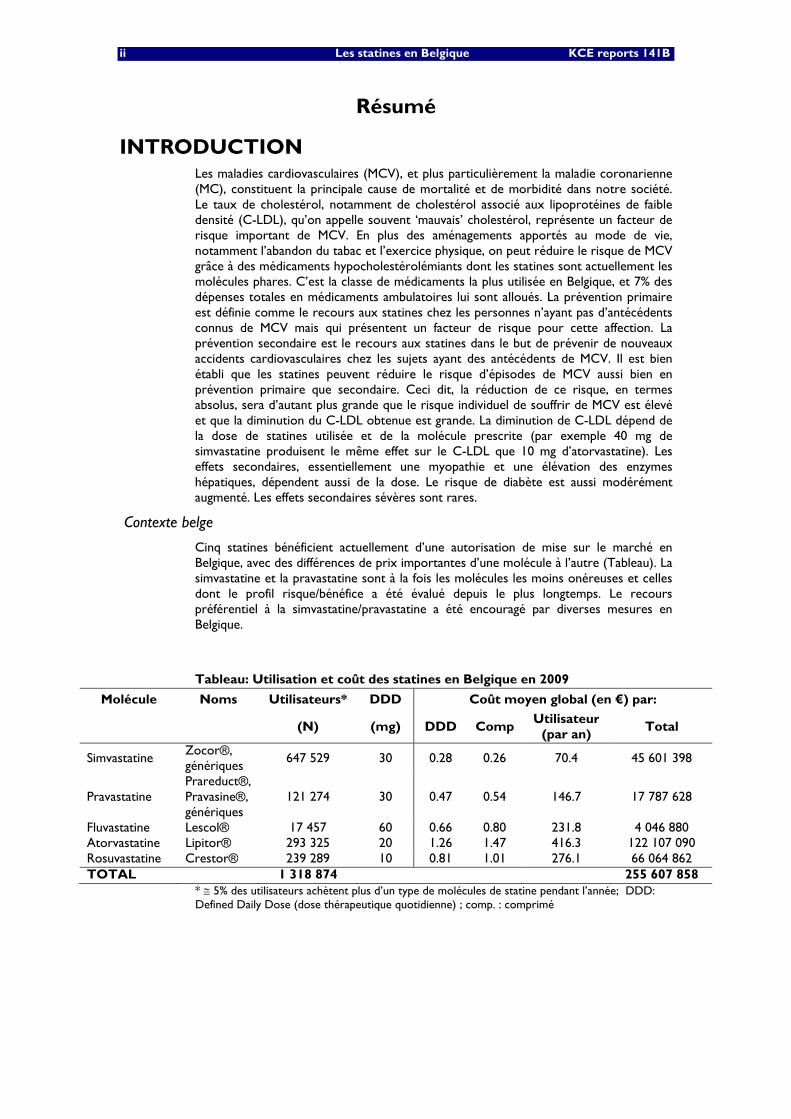
Cinq statines bénéficient actuellement d’une autorisation de mise sur le marché en Belgique, avec des différences de prix importantes d’une molécule à l’autre (Tableau). La simvastatine et la pravastatine sont à la fois les molécules les moins onéreuses et celles dont le profil risque/bénéfice a été évalué depuis le plus longtemps. Le recours préférentiel à la simvastatine/pravastatine a été encouragé par diverses mesures en Belgique.
Tableau: Utilisation et coût des statines en Belgique en 2009
Molécule Noms Utilisateurs* DDD Coût moyen global (en €) par:
(N) (mg) DDD Comp Utilisateur
(par an) Total
Simvastatine Zocor®, génériques
647 529 30 0.28 0.26 70.4 45 601 398
Pravastatine Prareduct®, Pravasine®, génériques
121 274 30 0.47 0.54 146.7 17 787 628
Fluvastatine Lescol® 17 457 60 0.66 0.80 231.8 4 046 880 Atorvastatine Lipitor® 293 325 20 1.26 1.47 416.3 122 107 090 Rosuvastatine Crestor® 239 289 10 0.81 1.01 276.1 66 064 862 TOTAL 1 318 874 255 607 858
* ≅ 5% des utilisateurs achètent plus d’un type de molécules de statine pendant l’année; DDD: Defined Daily Dose (dose thérapeutique quotidienne) ; comp. : comprimé
KCE reports 141B Les statines en Belgique iii
Tout d’abord, depuis août 2004, la simvastatine/pravastatine est remboursable sans contrôle pour toutes les indications reprises dans la notice scientifique. Le remboursement des autres statines ne peut se faire que dans les conditions fixées par la Commission pour le remboursement des médicaments (CRM) de l’Institut National d’assurance maladie-invalidité (INAMI), c.à.d. un C-LDL ≥100 mg/dl en prévention secondaire et chez les patients diabétiques. En prévention primaire, il faut un C-LDL ≥115 mg/dl associé à un risque de mortalité à 10 ans pour cause de MCV ≥ 5% selon la méthode SCOREa.
Ensuite, en 2008, un système d’appel d’offres a été mis en place pour les statines, entraînant une nouvelle diminution de prix pour la simvastatine. Enfin, en 2009, était inscrite dans l’accord Médico-Mutualiste la recommandation d’utiliser la simvastatine/pravastatine dans au moins 80% des nouveaux traitements. En 2010, la CRM a recommandé que ces deux molécules soient utilisées dans 100% des nouveaux traitements en prévention primaire et dans la majorité des nouveaux traitements en prévention secondaire et chez les patients diabétiques. Le passage à une autre statine ne peut être envisagé que si les objectifs thérapeutiques ne sont pas atteints après 3 mois de traitement. L’INAMI veillera à l’application effective de ces recommandations via un contrôle à posteriori des prescriptions.
Objectifs du rapport
Compte tenu de l’importance clinique de la MCV et du nombre énorme de bénéficiaires concernés, avec des retombées budgétaires importantes pour les finances publiques, les évolutions dans l’utilisation de ces médicaments doivent être documentées en temps utile pour orienter les politiques de santé. Dans le présent rapport, nous avons voulu analyser les changements dans l’utilisation des statines au cours du temps (1997-2009), et notamment l’influence des modifications des règles de remboursement introduites en 2004. En outre, des questions spécifiques intéressant les cliniciens et les politiques ont été abordées :
• Y-a-t-il une différence en termes d’utilisation des statines entre les patients en prévention primaire ou secondaire ?
• Quels sont les facteurs favorisant l’instauration d’une prévention secondaire après un épisode cardiovasculaire ?
• Qui sont les patients qui respectent le traitement prescrit et pendant combien de temps prennent-ils des statines ?
• Quels sont les déterminants du recours aux molécules les moins onéreuses ?
• Quelles sont les preuves de l’équivalence en termes d’efficacité et de sécurité cliniques des différentes molécules de statines ?
• Quel serait l’impact budgétaire d’une augmentation de la proportion des patients utilisant les molécules les moins onéreuses ?
a La méthode SCORE permet d’établir le risque individuel de mortalité par MCV dans les 10 ans sur base
de la tension artérielle, de la consommation de tabac, de l’âge, du sexe et de la concentration sanguine en C-LDL
iv Les statines en Belgique KCE reports 141B
MÉTHODES Évaluation des évolutions en termes d’utilisation et des profils d’utilisateur
Après obtention de l’autorisation de la Commission pour la protection de la vie privée, nous avons effectué une analyse de bases de données suivantes:
• Les données agrégées au niveau national de Pharmanet (médicaments délivrés en officine publique), mis à disposition par l’INAMI (de 1997 à 2009)
• Les données détaillées de remboursement des statines liées aux caractéristiques individuelles des patients dans un échantillon de la population générale (Echantillon Permanent - Permanente Steekproef, EPS), mis à disposition par l’Agence Intermutualiste (de 2002 à 2006)
• Les données cliniques d’hospitalisation (RCM) aux fins d’identification des épisodes cardiovasculaires, mises à disposition par le Service public fédéral de santé publique (de 2002 à 2006; 2006 étant la dernière année pour laquelle les données RCM étaient disponibles). Ces données ont été couplées aux données EPS.
Pour évaluer l’observance thérapeutique, nous avons chiffré le « medication possession ratio » personnel (MPR), en posant l’hypothèse que chaque utilisateur absorbe quotidiennement un des comprimés qui lui a été spécifiquement prescrit. Dans le droit fil d’autres études, les patients étaient considérés comme compliants (ou utilisateurs réguliers) s’ils avaient un MPR ≥ 80% pendant toute la période d’utilisation.
Un nouvel utilisateur a été défini comme un sujet achetant au moins un conditionnement de statines sans antécédents d’utilisation d’une statine au cours des 12 mois précédents. Chez les nouveaux utilisateurs sans épisode de MCV enregistré au cours des 12 mois qui précèdent le démarrage de la statine, on parle de prévention primaire. La prévention secondaire a été définie comme l’instauration chez un nouvel utilisateur d’une statine (quelle qu’elle soit) dans les 12 mois suivant une hospitalisation pour un épisode de MCVb.
Dans le but de permettre un suivi suffisamment long pour calculer la durée jusqu’à l’arrêt du traitement, celle-ci n’a été analysée que chez les patients ayant débuté la prise d’une statine en 2003.
Toutes les analyses statistiques (régression logistique ou modèle de Cox) ont été ajustées afin de tenir compte de l’effet de l’âge, du sexe, de la coexistence d’un diabète (établi sur la base du recours à des médicaments antidiabétiques), du type de prévention (primaire/secondaire), de la molécule de statine, de l’initiateur du traitement (médecin généraliste/spécialiste), du droit à un remboursement majoré et de la présence d’un statut d’invalidité ou d’un handicap.
Comparaison de l’efficacité et de la sécurité d’emploi des différentes statines
Nous avons procédé à une revue systématique de la littérature. Les bases de données électroniques Medline, Embase, Database of Abstracts of Reviews of Effects (DARE) ainsi que le Cochrane Central Registry of Controlled Trials ont été utilisées. Pour comparer l’efficacité et la sécurité d’emploi des statines les moins onéreuses par rapport aux plus chères, des essais de type ‘head-to-head’ (face à face) comparant la simvastatine ou la pravastatine à la fluvastatine, l’atorvastatine ou la rosuvastatine ont fait l’objet d’une méta-analyse.
b Un épisode de MCV a été défini sur la base des codes de la CIM 9 et comprenait : l’infarctus du myocarde
aigu, d’autres formes de cardiopathie ischémique aiguë et subaiguë, l’angine de poitrine, d’autres formes de cardiopathie ischémique chronique, un accident vasculo-cérébral ischémique, et une ischémie cérébrale temporaire.
KCE reports 141B Les statines en Belgique v
Impact budgétaire
Dans la foulée des expériences de la Norvège et de la Finlande, nous avons utilisé les données cumulatives de l’INAMI afin de simuler l’impact budgétaire pour la période 2006-2009 d’une augmentation de la proportion des patients prenant de la simvastatine/pravastatine. À cette fin, nous avons calculé les ‘dépenses moyennes’ par patient pour chaque type de statine, en partant de l’hypothèse qu’il n’y avait pas de contre-indication au transfert des patients d’une statine à l’autre.
RÉSULTATS Tendances en matière d’utilisation
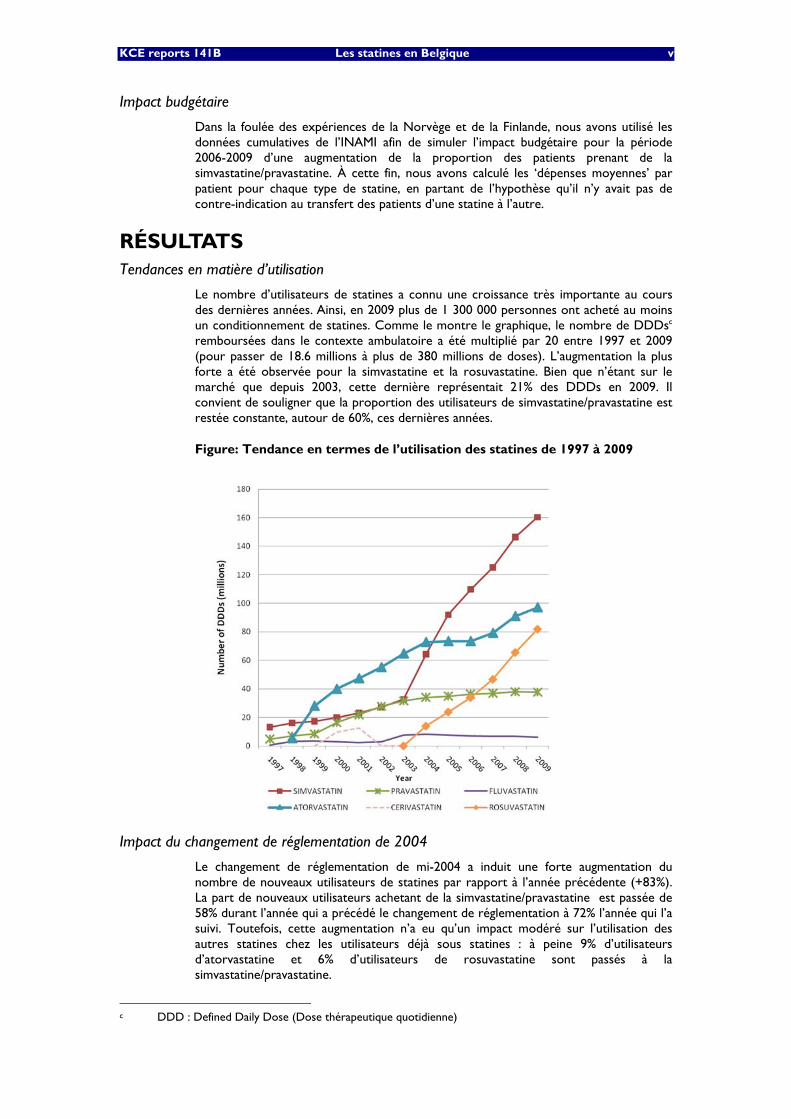
Le nombre d’utilisateurs de statines a connu une croissance très importante au cours des dernières années. Ainsi, en 2009 plus de 1 300 000 personnes ont acheté au moins un conditionnement de statines. Comme le montre le graphique, le nombre de DDDsc remboursées dans le contexte ambulatoire a été multiplié par 20 entre 1997 et 2009 (pour passer de 18.6 millions à plus de 380 millions de doses). L’augmentation la plus forte a été observée pour la simvastatine et la rosuvastatine. Bien que n’étant sur le marché que depuis 2003, cette dernière représentait 21% des DDDs en 2009. Il convient de souligner que la proportion des utilisateurs de simvastatine/pravastatine est restée constante, autour de 60%, ces dernières années.
Figure: Tendance en termes de l’utilisation des statines de 1997 à 2009
Impact du changement de réglementation de 2004
Le changement de réglementation de mi-2004 a induit une forte augmentation du nombre de nouveaux utilisateurs de statines par rapport à l’année précédente (+83%). La part de nouveaux utilisateurs achetant de la simvastatine/pravastatine est passée de 58% durant l’année qui a précédé le changement de réglementation à 72% l’année qui l’a suivi. Toutefois, cette augmentation n’a eu qu’un impact modéré sur l’utilisation des autres statines chez les utilisateurs déjà sous statines : à peine 9% d’utilisateurs d’atorvastatine et 6% d’utilisateurs de rosuvastatine sont passés à la simvastatine/pravastatine.
c DDD : Defined Daily Dose (Dose thérapeutique quotidienne)
vi Les statines en Belgique KCE reports 141B
Profil d’utilisation des nouveaux utilisateurs de statines (période de 2003 à 2006)
La grande majorité des nouveaux utilisateurs (92% au cours de la période) se trouvaient en prévention primaire. Dans l’analyse multivariée, la simvastatine/pravastatine s’avère nettement moins choisie en prévention primaire (65.4% des nouveaux traitements) qu’en prévention secondaire (78.4%), et moins fréquemment par les MG (65.4%) que par les spécialistes (72.0%).
Le pourcentage d’utilisateurs réguliers (c’est-à-dire avec un MPR ≥ 80%) n’était que de 59%. Les utilisateurs ‘occasionnels’ de statines étaient soit des patients qui n’avaient reçu qu’une seule prescription de statine (18%) ou des utilisateurs dont le MPR était inférieur à 80% (23% des patients). Les facteurs le plus fortement associés à une prise régulière étaient les suivants : âge de plus de 50 ans, diabète (adjusted odds ratio (OR)=1.43 (1.34 - 1.53)) et utilisation d’une statine en prévention secondaire (OR=2.06 (1.86 - 2.27)). La probabilité pour les utilisateurs réguliers de toujours être sous statine un an après l’instauration du traitement était de 75% et tombait à 50% après 4 ans.
Prévention secondaire après un épisode cardiovasculaire (2006)
Après une hospitalisation pour un épisode de MCV (N=85.500) chez des patients qui ne prenaient pas de statine avant ledit épisode (N=51.300) et ont quitté l’hôpital en vie, un traitement par statine a été entamé dans seulement 52.4% des cas (données 2006). Cette proportion variait selon le diagnostic principal d’hospitalisation et l’âge des patients, les patients âgés de plus de 70 ans étant nettement moins susceptibles de recevoir une statine, quelle qu’elle soit. Les chiffres les plus élevés étaient observés en cas d’infarctus du myocarde aigu dans le groupe des 50-59 ans, où une prévention secondaire a été instaurée dans 95.8% des cas en 2006, alors que cette proportion était de 58% pour les cas d’AVC dans le même groupe d’âge.
Évaluation comparative des statines les plus onéreuses et les moins onéreuses
Cinq essais comparatifs ont été inclus dans l’évaluation. La plupart des essais incluaient des patients souffrant d’une MC et la majorité des participants étaient de sexe masculin. Dans chaque étude, on a utilisé l’atorvastatine 80 mg et on l’a comparée à la pravastatine 40 mg (3 essais), à la simvastatine 20 mg (1 essai) et à la lovastatine 5 mg (1 essai), la rosuvastatine n’étant utilisée dans aucun des essais. Sur l’ensemble des études, l’atorvastatine 80 mg réduisait le risque d’ infarctus du myocarde de 16% (RR: 0.84 (0.73, 0.96)), tandis que le risque d’AVC et de mortalité toutes causes confondues (RR=0.92 (0.81, 1.04)) ne différait pas de manière significative entre l’atorvastatine et les comparateurs. Notons toutefois que les comparateurs ont été utilisés à des doses thérapeutiques inférieures à celle de l’atorvastatine (80mg=4 DDDs).
Pour ce qui concerne la sécurité, il n’y avait pas de différence manifeste entre les statines, mais nous ne disposions pas de données comparatives sur la molécule la plus récente, à savoir la rosuvastatine.
Considérations budgétaires
En 2009, les dépenses totales pour les statines représentaient € 255.6 millions. Entre 2004 et 2009, le prix par DDD pour la simvastatine et la pravastatine a baissé de plus de 60%, tandis que les prix sont restés relativement constants pour les autres molécules. L’appel d’offres public de 2008 ne s’est finalement appliqué qu’à la simvastatine, ramenant son prix par DDD à € 0.29. Grâce à ces réductions de prix, la simvastatine/pravastatine représentait en 2009 23% des dépenses totales pour les statines tout en fournissant plus de 50% des DDDs. Une augmentation du pourcentage d’utilisateurs des molécules les moins onéreuses d’environ 60% à 80% aurait réduit les dépenses totales en 2006, 2007, 2008 et 2009 de respectivement € 40.5 millions, € 45.7 millions, € 56.9 millions et € 64.4 millions.
KCE reports 141B Les statines en Belgique vii
DISCUSSION ET CONCLUSION Des chiffres en hausse
En 2009, quelque 20% des Belges adultes ≥ 35 ans prenaient une statine, l’atorvastatine et la rosuvastatine occupant respectivement la première et la quatrième position dans la liste des dépenses publiques par médicament. Un constat qui illustre la nécessité d’utiliser rationnellement les statines.
L’essentiel de la hausse dans l’utilisation des statines était lié à la prévention primaire, et ce pour diverses raisons. La simplification administrative mi-2004 et la nouvelle diminution du prix de la simvastatine/pravastatine ont certainement joué un rôle, mais cela n’explique pas l’augmentation concomitante des utilisateurs de rosuvastatine et d’atorvastatine. Le mode de vie (grosso modo 83% des Belges de 35 à 74 ans ont un taux de cholestérol supérieur au plafond recommandé), le vieillissement séculaire de la population, de même qu’une tendance générale à la médicalisation de la prévention forment aussi une combinaison qui favorise l’évolution observée. Il convient de souligner le fait que des changements du mode de vie peuvent également se révéler efficaces pour réduire la morbidité et la mortalité cardiovasculaire et que mettre en œuvre des stratégies globales qui permettraient de tels changements est aussi crucial dans la lutte contre les MCV. Enfin, le seuil actuel à partir duquel un remboursement des statines dans la prévention primaire en Belgique est possible (risque de mortalité MCV à 10 ans ≥ 5%) est peut-être trop souvent interprété comme une indication pour l’utilisation de statines, alors qu’il ne constitue qu’un indicateur clinique pour adapter la prise en charge aux besoins du patient. Ainsi, 88.0 % des sujets belges de sexe masculin âgés de ≥ 63 ans présentent à la fois une hypercholestérolémie et un SCORE ≥ 5%. À lui seul, ce groupe représente 761.000 utilisateurs potentiels et prouve à quel point une approche uniquement basée sur une gestion médicamenteuse du risque serait responsable d’un lourd fardeau sociétal. La prévention avec une statine peut présenter d’importants avantages pour les patients à haut risque mais le gain clinique absolu sera moindre chez les patients avec des risques de MCV plus faibles, alors que les risques d’effets secondaires demeurent constants. C'est un élément important à discuter avec le patient avant de se lancer dans une thérapie pendant de nombreuses années.
Prévention secondaire
La couverture des patients ayant quitté l’hôpital avec un diagnostic de MCV, notamment un AVC, est perfectible, une observation qui s’inscrit dans le droit fil des constats posés dans d’autres pays européens. Cependant, nos analyses se sont limitées à l’année 2006 et la couverture de tels patients à haut risque peut s’être améliorée depuis cette date. En tout état de cause, cet aspect important de la prise en charge mérite une analyse de situation et des actions correctrices si nécessaires de la part des hôpitaux.
Comparaison de l’efficacité et de la sécurité d’emploi des statines
Nous n’avons trouvé aucune donnée probante d’un différentiel en matière de bénéfice clinique pertinent entre les statines commercialisées en Belgique lorsqu’elles sont administrées à une dose thérapeutique équivalente. En effet, les essais comparant les statines entre elles étaient à l’origine conçus dans le but d’évaluer les avantages d’une thérapie intensive par rapport à un dosage usuel. Toutefois, deux autres méta-analyses basées sur des comparaisons indirectes de l’efficacité théorique des statines sont parvenues à la même conclusion que la nôtre. Globalement, le profil de sécurité des statines a été rapporté comme étant satisfaisant à ce jour, à part le retrait de la cérivastatine en 2001 pour des raisons de sécurité. La molécule la plus récente, la rosuvastatine, disponible depuis 2003, semble présenter un profil de sécurité similaire aux autres molécules. Cependant, nous disposons pour évaluer son bilan risques/bénéfices cliniques de beaucoup moins de données que pour les autres statines. En conséquence, la recommandation de la CRM qui préconise de recourir en première intention à la simvastatine/pravastatine chez la majorité des patients en prévention primaire et secondaire repose sur des fondements scientifiques et son application doit être encouragée.
viii Les statines en Belgique KCE reports 141B
Aspects économiques
La mesure de 2004 a essentiellement entraîné une forte augmentation du nombre d’utilisateurs de la simvastatine, avec un impact minime sur les tendances de consommation des autres statines. L’importante réduction du prix par DDD de la simvastatine/pravastatine a quelque peu soulagé la forte élévation des dépenses globales observée au cours de ces dix dernières années (+133%). La part des patients prenant de la simvastatine/pravastatine est néanmoins restée stable au fil des années et toute augmentation de ce nombre résulterait en des économies financières considérables.
Il est cependant trop tôt pour évaluer la manière dont la nouvelle recommandation de la CRM sur l’utilisation des molécules les moins onéreuses en première intention se traduira en réalité au niveau des prescriptions. D’autres pays, tels que la Norvège en 2005 et la Finlande en 2006, ont mis en œuvre une politique plus systématique en rendant la simvastatine obligatoire pour tous les utilisateurs de statines, et non pas uniquement pour les nouveaux utilisateurs. Toutefois, compte tenu de la durée relativement courte du traitement en Belgique (50% des patients réguliers arrêtent leur traitement dans les quatre ans), il est probable que la politique belge actuelle donnera des résultats similaires à moyen terme.
Par ailleurs, le brevet de l’atorvastatine arrive à échéance en novembre 2011 et la possible réduction de prix de cette molécule qui suivra pour aura également un impact important sur les dépenses globales pour les statines.
KCE reports 141B Les statines en Belgique ix
RECOMMANDATIONSd Au niveau opérationnel :
• Les statines ne représentent qu’une composante de la gestion globale du risque de MCV : adapter le mode de vie devrait être prioritaire. Ceci dépasse le cadre de la consultation clinique et suppose des aménagements structurels et des campagnes d’information à destination du grand public.
• Les informations destinées aux prescripteurs devraient également insister sur le fait que les critères de remboursement actuels pour les statines en prévention primaire ne doivent pas être interprétés comme une indication absolue pour l’utilisation des statines.
• Si le recours à une statine s’avère nécessaire, la recommandation de la CRM visant à recourir en première intention à la simvastatine/pravastatine doit être appliquée de manière optimale. Par la même occasion, il y a lieu d’insister sur le fait que l’on dispose pour évaluer le bilan risques/bénéfices cliniques de moins de recul pour la rosuvastatine que pour les autres molécules.
• Le bilan risques/bénéfices d’une prévention avec statines et le nombre de patients à traiter pour prévenir un épisode de MCV sont plus favorables chez les patients à haut risque de MCV. Dès lors, avant d’instaurer une prévention avec une statine, le bénéfice clinique absolu escompté dans chaque cas particulier devrait être dûment débattu avec le patient.
En matière de recherche :
• Nous devons mieux comprendre les mécanismes sous-jacents de la faible observance thérapeutique et des niveaux bas de prévention secondaire pour certains types d’événements cardiovasculaires, afin de pouvoir améliorer ces aspects. Une étude spécifique, comprenant des entretiens approfondis avec les patients et des audits hospitaliers, représenterait une source d’informations cruciale.
• Les récentes recommandations de l’INAMI mais également l’émergence de copies et de génériques de l’atorvastatine dans la foulée de l’expiration de son brevet en novembre 2011 vont également modifier considérablement le rapport coût-efficacité de la prévention de la MCV basée sur les statines. Le rapport coût-efficacité des statines devrait être réévalué pour la Belgique en 2013.
d Le KCE est le seul responsable des recommandations fournies aux pouvoirs publics.

KCE Reports 141 Impact Policy Statin 1
Scientific Summary Table of Contents
INDEX OF TABLES ................................................................................................................... 2 INDEX OF FIGURES ................................................................................................................. 4 1 INTRODUCTION ............................................................................................................ 5 1.1 BACKGROUND ........................................................................................................................................... 5 1.2 OBJECTIVES ................................................................................................................................................... 6 2 BELGIAN SITUATION ................................................................................................... 7 2.1 INDICATIONS AND REGULATIONS.................................................................................................... 7 2.2 DATA ANALYSIS ......................................................................................................................................... 9
2.2.1 Utilization trends (1997- 2009) ................................................................................................... 11 2.2.2 Impact of the 2004 Regulation change ....................................................................................... 19 2.2.3 Characteristics of new statin users (2003-2006) ..................................................................... 25 2.2.4 Cardiovascular events and secondary prevention ................................................................... 34
3 COMPARATIVE APPRAISAL OF STATINS ............................................................. 42 3.1 COMPARISON OF CLINICAL EFFICACY ........................................................................................... 42
3.1.1 Methods ............................................................................................................................................ 42 3.1.2 Results .............................................................................................................................................. 43 3.1.3 Discussion ........................................................................................................................................ 48
3.2 COMPARISON OF SAFETY .................................................................................................................... 50 3.2.1 Methods ............................................................................................................................................ 50 3.2.2 Results .............................................................................................................................................. 51 3.2.3 Discussion ........................................................................................................................................ 51 3.2.4 Conclusion ....................................................................................................................................... 52
3.3 BUDGETARY CONSIDERATIONS ....................................................................................................... 52 3.3.1 Scenarios hypothesis ...................................................................................................................... 53 3.3.2 Results .............................................................................................................................................. 54
4 GENERAL DISCUSSION .............................................................................................. 59 4.1 INCREASING NUMBERS ......................................................................................................................... 59 4.2 SECONDARY PREVENTION ................................................................................................................ 60 4.3 COMPARATIVE EFFICACY OF STATINS .......................................................................................... 60 4.4 COST CONTAINMENT ........................................................................................................................... 60 4.5 STATIN SWITCH ....................................................................................................................................... 61 4.6 ADHERENCE .............................................................................................................................................. 61 4.7 SAFETY ......................................................................................................................................................... 61 4.8 UNRESOLVED ISSUES .............................................................................................................................. 62 5 APPENDICES ................................................................................................................. 63 5.1 DATA SOURCES AND DEFINITIONS ................................................................................................. 63 5.2 USE OF FIBRATES AND EZETIMIB WITH SIMVASTATIN ............................................................. 64 5.3 USE OF STATIN BY SETTING (AMBULATORY VS HOSPITAL) ................................................... 65 5.4 MARKET EVOLUTION OVER TIME ..................................................................................................... 66 5.5 IMPACT OF 2004 REGULATION CHANGE ...................................................................................... 72 5.6 COMPLIANCE OF PATIENTS ................................................................................................................ 74 5.7 SECONDARY PREVENTION .................................................................................................................. 75 5.8 SCORE CHART .......................................................................................................................................... 82 5.9 DRUG INTERACTIONS ........................................................................................................................... 83 5.10 NEW BELGIAN RECOMMENDATIONS FOR THE USE OF STATINES ..................................... 84 6 BIBLIOGRAPHY ............................................................................................................ 87
2 Impact Policy Statin KCE Reports 141
INDEX OF TABLES Table 1: Summary of Data Sources ...................................................................................................................... 10 Table 2: Definitions used in all analyses .............................................................................................................. 10 Table 3: Total number of DDDs per year and statin type (in millions DDDs) .......................................... 12 Table 4: Number of patients using statins per year and statin type .............................................................. 13 Table 5: Cost per year and statin type – Third party payer (in millions €) ................................................ 14 Table 6: Cost per year and statin type – Co- payments(in millions €) ........................................................ 15 Table 7: Cost per year and statin type – Total expenditures (in millions €) .............................................. 16 Table 8: Mean (total) expenditures per DDD in € (Total expenditure / total DDD) .............................. 16 Table 9: Summary data for the year 2009 (percentage of DDDs, tablets and percentage of
expenditures) by statin type ......................................................................................................................... 17 Table 10: Statin use and cost in Belgium in 2009 .............................................................................................. 17 Table 11: Number and Percentage of Patients by Major Statin Type: switch patterns around August
2004 ................................................................................................................................................................... 21 Table 12: Frequency and Percentage of Patients by major statin type used during Aug2004-Aug2005 by
previous period ............................................................................................................................................... 22 Table 13: Number of new statin users during period 2003-2006 (in sample and extrapolated to
Belgium) ............................................................................................................................................................ 26 Table 14: Start of Statin Treatment- New Statin Users .................................................................................. 26 Table 15: Measures of statin compliance based on the Medication possession ratio ............................... 27 Table 16: Factors predicting regular use of statin treatment (results from multivariate logistic
regression) ........................................................................................................................................................ 27 Table 17: Characteristics of new statin users, by type of prevention and year of start of treatment... 29 Table 18: Probability of continuing statin therapy over time ......................................................................... 30 Table 19: Summary table for the duration of statin use – New regular users 2003 ................................. 31 Table 20: Factors predicting stop of statin use (Cox regression) ................................................................. 31 Table 21: Determinants of simvastatin/pravastatin use in new users (logistic regression) ...................... 32 Table 22: Percentage of the hospitalizations for a cardiovascular event preceded by statin use the year
before (12 months) ........................................................................................................................................ 34 Table 23: Rates of secondary prevention after a a CVE hospitalization for (2003-2006) ........................ 35 Table 24: Rates of secondary prevention after a hospitalization for a CVE ................................................ 35 Table 25: Secondary prevention by principal diagnosis of hospitalization (year 2006) ............................. 36 Table 26: Secondary prevention for 2 principal diagnosis (2006) ................................................................ 37 Table 27: Secondary prevention by APR-DRG of hospitalization (2006) .................................................... 37 Table 28: Secondary prevention after percutaneous cardiovascular procedures, per age range (2006)
............................................................................................................................................................................ 39 Table 29: Factors associated to a secondary prevention by statin after an hospitalization for CVE (
Hazard ratio and 95% Confidence limits) .................................................................................................. 40 Table 30: Inclusion and exclusion criteria ........................................................................................................... 42 Table 31: Characteristics of included trials ........................................................................................................ 44 Table 32: Outcome in the 5 selected studies ................................................................................................... 47 Table 33: Average cost of a yearly treatment per molecule (in euros; based on aggregated data) ....... 54 Table 34: Average cost per molecule and users type in 2006 ....................................................................... 57 Table 35: Percentage of patients with statines who also had fibrates (ambulatory sector) (EPS) .......... 64 Table 36: Total number of patients per year and fibrate type (ambulatory sector) (Pharmanet) .......... 64 Table 37: Total number of DDDs per year and fibrate type (ambulatory sector) .................................... 64 Table 38: Percentage of hospital volume in total volume (DDDs) per year and statin type ................... 65 Table 39: Total number of tablets per year and statin type in millions tablets (ambulatory sector) ..... 66 Table 40: Total number of DDDs per semester and statin type in millions DDDs (ambulatory sector)
– 1997 to 2009 ................................................................................................................................................ 68 Table 41: Total number of DDDs per semester and statin type in millions DDDs (ambulatory sector)
– Focus on 2003 to 2006 .............................................................................................................................. 69 Table 42: Estimated Number and Estimated Percent of Patients by Number of Different Statin type
used by Period – Patients taking Statin (extrapolated from EPS) ......................................................... 72 Table 43: Estimated number of patients by statin type, period and change status from previous period
............................................................................................................................................................................ 73 Table 44: Measures of statin compliance based on MPR DDD ..................................................................... 74
KCE Reports 141 Impact Policy Statin 3
Table 45: Reason of hospitalization for Cardiovascular Reason (principal diagnosis) (2002-2006): N extrapolated ..................................................................................................................................................... 76
Table 46: APR-DRGs of hospitalizations for cardiovascular reason (2002-2006) ..................................... 77 Table 47: Hospital mortality amongst hospitalizations for cardiovascular reason (2002-2006) ............. 78 Table 48: Hospital mortality amongst hospitalizations for cardiovascular event (2002-2006)................ 78 Table 49: Statin use in hospitalization (new user)............................................................................................. 79 Table 50: Percentage of secondary prevention after hospitalization for cardiovascular reason per
patient principal diagnosis (2006 only) ....................................................................................................... 80 Table 51: Percentage of secondary prevention for patients hospitalized for Atherosclerosis (Principal
diagnosis code ICD9-CM = 440) (2006 only) ........................................................................................... 81 Table 52: Inducers and inhibitors of major cytochrom isoenzymes 59 ......................................................... 83
4 Impact Policy Statin KCE Reports 141
INDEX OF FIGURES Figure 1: Total number of DDDs per year and statin type (in millions DDDs) ......................................... 12 Figure 2: Number of statin users per year and statin type ............................................................................. 13 Figure 3: Cost per year and statin type – Third party payer (in millions €) ............................................... 14 Figure 4: Cost per year and statin type – Co-payments (in millions €) ....................................................... 15 Figure 5: Cost per year and statin type – Total expenditures (in millions €) ............................................. 15 Figure 6: Mean (total) expenditures per DDD in € (Total expenditure / total DDD) ............................. 16 Figure 7: Tablets strengths prescribed during 2002-2007 (%) ....................................................................... 18 Figure 8: Number of New Users by Major Statin Type and Period .............................................................. 22 Figure 9: Percentage of New Users by Major Statin Type and Period ......................................................... 23 Figure 10: Absolute Number of Patients by Major Statin Type, Status and Period ................................... 24 Figure 11: Time under statin (by type of first statin)– New regular user 2003.......................................... 30 Figure 12: Setting of start of statin (hospital or ambulatory ) ........................................................................ 36 Figure 13: Time to statin use as secondary prevention – Patients hospitalized for CVE and without
statin in the preceding year .......................................................................................................................... 40 Figure 14: Flow chart of trials through the selection process ........................................................................ 43 Figure 15: All-cause mortality in 5 studies of statin comparison ................................................................... 47 Figure 16: Risk of myocardial infarction in 5 studies of statin comparison ................................................. 47 Figure 17: Risk of stroke in 5 studies of statin comparison........................................................................... 48 Figure 18: Funnel plot of the 5 trials included (all-cause mortality) .............................................................. 48 Figure 19: Budgetary differences from switching patients to least expensive statins results for 2006,
2007 and 2008 ................................................................................................................................................. 55 Figure 20: Statins expenditures when increasing use of least costly molecules for 2006 per users type
(in millions) ....................................................................................................................................................... 57 Figure 21 : Total number of tablets per year and statin (ambulatory sector) ............................................ 66 Figure 22 : Total number of DDDs per semester and statin type (ambulatory sector) – 1997 to 2009
............................................................................................................................................................................ 67 Figure 23 : Total number of DDDs per semester and statin type (ambulatory sector) – Focus on 2003
to 2006 .............................................................................................................................................................. 69 Figure 24 : Cost per year and statin type – Third party payer intervention (ambulatory sector – in
millions €) ......................................................................................................................................................... 70 Figure 25: Cost per year and statin type – Out-of-pocket payments (ambulatory sector – in millions €)
............................................................................................................................................................................ 70 Figure 26: Cost per year and statin type – Total expenditures (ambulatory sector – in millions €) .... 71 Figure 27: Estimated Absolute Number of Patients by Major Statin Type and Period ............................. 72 Figure 28: Estimated Percent of Patients by Major Statin Type and Period ................................................ 73 Figure 29: Statin users – Secondary prevention ................................................................................................ 79 Figure 30: SCORE Belgium risk chart for 10-year cardiovascular mortality ............................................ 82
KCE Reports 141 Impact Policy Statin 5
1 INTRODUCTION 1.1 BACKGROUND
Cardiovascular diseasea (CVD), and particularly coronary heart disease (CHD), is the leading cause of mortality worldwide. An estimated 17.1 million people died from CVD in 2004, representing 29% of all deaths. Of these deaths, an estimated 7.2 million were due to CHD and 5.7 million were due to stroke. In Belgium, the age-standardized death rates of ischemic heart disease and cerebrovascular disease were 75.1 and 42.7 per 100 000, respectively, in 2004 (for a global rate of 508.9 per 100 000). The age-standardized rate of DALYs lost for both conditions were 596 and 350 per 100 000, respectively (for a global rate of 10 750 per 100 000)b. Tobacco use, an unhealthy diet, physical inactivity and harmful use of alcohol increase the risk of heart attacks and strokes. Among these risk factors, cholesterol level, particularly low-density lipoprotein (LDL-C), often labelled as “bad” cholesterol, play an important role. WHO estimates that 60% of CHD and 40% of strokes are due to elevated cholesterol levels. Thus besides changes in lifestyle, such as smoking cessation and exercise, CVD risk can be reduced by cholesterol-lowering diets and/or drugs, along with non-cholesterol drug treatments, including aspirin and antihypertensives.
Among cholesterol-lowering drugs, statins, a group that act by inhibiting the enzyme 3-hydroxy 3-methylglutaryl coenzyme A (HMG CoA) reductase involved in cholesterol biosynthesis, occupy a prominent place1. They reduce the concentration of downstream metabolic by-products including mevalonate, which in turn leads to increased expression of LDL-C receptors on hepatocytes, and to increased uptake of LDL-C from the circulation. Statins also tend to reduce the production of apolipoprotein B, leading to reduced VLDL (Very Low Density Lipoprotein) secretion from the liver. The main mechanism of the protective effect on CVD is believed to be the lowering of LDL-C concentrations 2. The 5-year incidence of major coronary events, coronary revascularisation, and stroke can be reduced by about one fifth per mmol/L (39 mg/dL) in LDL-C, largely irrespective of initial lipid profile or other presenting characteristics3,4. Statins also exert pleiotropic effectsc, which could also contribute to the significant reduction in cardiovascular morbidity and mortality, although these mechanisms are still poorly understood today5, 6.
Primary prevention is defined as the utilization of statins in individuals with no known history of but with risk factors for CVD. Secondary prevention is the use of statins to prevent further vascular events in patients with a history of CVD. The ability of statins to reduce the risks of CVD events and CVD-related deaths has been demonstrated in primary 3, 4, 7-12 and secondary 2-4, 9, 13 prevention trials.
a The three major manifestations of CVD are: coronary heart disease (CHD), including myocardial
infarction (MI, heart attack) and angina; cerebrovascular disease (transient ischaemic attack and stroke); and peripheral arterial disease.
b http://apps.who.int/ghodata/?vid=60150 c including reduction of inflammation, improvement of endothelial function, anti-oxidant properties and
increased stability of atherosclerotic plaques
6 Impact Policy Statin KCE Reports 141
Five statins are currently licensed for use in Belgium: atorvastatin (Lipitor®), fluvastatin (Lescol®), pravastatin (Prareduct®, Pravasine®, generics), rosuvastatin (Crestor®), and simvastatin (Zocor®, generics). Statins represent a drug class which is widely used in our country: in 2009, more than 1.300.000 citizens purchased at least one packaging of statins (see Figure 2 p13), i.e. around 20% of Belgian adults ≥ 35 yearsd. Simvastatin and Pravastatin are the molecules with the most ascertained risk/benefit profile and with the lowest retail price (see Table 10, p17). The preferential utilization of simvastatin/pravastatin has been encouraged by various measures (details are provided in section section 2.1, p7). First, since August 2004, simvastatin/pravastatin have been reimbursable without control for all indications mentioned on the scientific information leaflet. The reimbursement of the other statins can only occur within specific official conditions. Second, in 2008, a system of public tender was implemented for statins, leading to a further price reduction of simvastatin. Finally, in late 2009, the National Institute of Insurance for Disease and Invalidity (INAMI/RIZIV) has recommended that simvastatin/pravastatin be used in 80% of new treatments, a recommendation extended to 100% since mid-2010. Switching patients to another statin can only be considered if therapeutic goals are not achieved after 3 months of treatment.
1.2 OBJECTIVES Because of the clinical significance of CVD and the huge numbers of beneficiaries involved, with an important budgetary impact on public finances, the utilization trends of such drugs need to be documented in due time for policy-making purpose. In this report, we aimed at analysing changes in statin use over time (1997-2009), particularly as regards the change of reimbursement rules that occurred in mid-2004. Our objective was to yield a comprehensive description of statin utilization and statin users in Belgium between 1997 and 2009.
In addition, specific questions relevant for clinicians and policy-makers will be addressed:
• Is there a difference in statin use between patients on primary or secondary prevention?
• Who are the compliant patients and how long do they use statins?
Managing the individual risk of CVD is a long-term process, and poor adherence to treatment might be an impediment to optimal CVD prevention 14, 15.
• What are the predictors of beginning a secondary prevention after a cardiovascular event?
• What are the determinants of using simvastatin or pravastatin versus the others statins?
• What do we know about the efficacy and safety equivalence of the various statins?
• What would be the budgetary impact of current recommendations for statin use?
d For the age distribution in Belgium, see:
http://statbel.fgov.be/fr/statistiques/chiffres/population/structure/agesexe/pyramide/index.jsp
KCE Reports 141 Impact Policy Statin 7
2 BELGIAN SITUATION 2.1 INDICATIONS AND REGULATIONS
The indications and regulations of statin use have evolved a great deal in the last few years. Initially, statins were reimbursed within the chapter IV, i.e. only after control and approval by advisors of sickness funds, and the level of blood cholesterol was the only criterion for reimbursemente.
In December 2003, the indications for reimbursement were extended by taking into account the global cardiovascular risk f . By that time, the utilization of statins was recommended in patients with a primary hypercholesterolemia defined as a total cholesterol ≥190 mg/dl or a LDL-C ≥115 mg/dl, measured while fasting at least twice (with an interval of 1 to 8 weeks between the 2 measurements, in patients following appropriate dietary advices) AND at least one of the 2 following conditions:
• a 10-year CVD risk >20%, based on the Framingham risk scoreg
• a history of a coronary event (myocardial infarction, angina, acute coronary syndrome, coronary by-pass) AND/OR a cerebrovascular event (thrombotic stroke, documented transient ischemic attack) AND/OR a documented intermittent claudication
The reimbursement of statins was regulated through Chapter IV, also called the “a priori control”. The reimbursement was possible only after obtaining the authorization from the medical advisor of a sickness fund.
In August 2004 the Belgian reimbursement criteria for statins changed drastically. The reimbursement of simvastatin and pravastatin, for which generic drugs were on the market and of which the drug companies agreed with a drastic price reduction was facilitated. In 2003, the price per Defined Daily Dose (DDD) was 1.40 AND 1.30 euros for simvastatin and pravastin, respectively. By 2005, theses prices went down to 0.68 and 0.85 euros, respectively. As of then, these statins are reimbursed (in category Bh) according to Chapter I of the regulation which means that all indications that are mentioned on the scientific information leaflet are reimbursed without controlij. For the other statins marketed in Belgium – fluvastatin, atorvastatin and rosuvastatin - the Commission for Reimbursement of Pharmaceuticals (CTG-CRM) maintained the stricter reimbursement conditions of Chapter II of the regulation, also called the “a posteriori control”. This implicates that only indications issued by the CTG-CRM are eligible for reimbursement (also in category B), and that the fulfilment of these conditions can be controlled by inspectors of the sickness fundsk.
e http://www.inami.fgov.be/drug/nl/statistics-scientific-information/consensus/2002-05-28/pdf/lv.pdf f http://www.riziv.fgov.be/drug/all/drugs/reglementation/legal-
texts/list_ar_kb_am_mb/pdf/20031218edition1.pdf g http://hp2010.nhlbihin.net/atpiii/calculator.asp?usertype=prof on the basis of the European Task Force
which accounted for age, sex, serum cholesterol, systolic blood pressure and diabetes. h socially and medically useful pharmaceuticals, 75% reimbursement (outside the BIM status) i These indications for the use of simvastatin and pravastatin include: 1.treatment associated to dietary
recommendations for a primary hypercholesterolemia or a mixed dyslipidemia; 2. treatment of a family homozygous hypercholesterolemia; 3. Treatment associated to dietary recommendations of an isolated hypertriglyceridemia in patients intolerant to nicotinic acid or fibrates; 4. primary and secondary prevention of cardio-vascular events.
j For pravastatine, the branded molecule remained in chapter II, while the generics are in chapter I. For simvastatin, all molecules have been moved to chapter I, but generics are not indicated for prevention, except a few generic molecules which are indicated for secondary prevention only.
k “a posteriori control” of the prescriptions is organized by the Department for Medical Evaluation and Control of the National Institute for Sickness and Disability Insurance (RIZIV-INAMI) in collaboration with the medical advisors from the sickness funds. This control consists of a retrospective analysis of prescriptions of individual physicians and determination of outliers.
8 Impact Policy Statin KCE Reports 141
These indications were definedl in 2006 as follows:
• a primary hypercholesterolemia defined as a total cholesterol ≥190 mg/dl or a LDL-C ≥115 mg/dl, measured at least twice (with an interval of 1 to 8 weeks between the 2 measurements, in patients following appropriate dietary advices and fasting on the day of the measurement) AND a risk of lethal CVD ≥ 5% for a 10 years period as measured with SCORE. SCORE is a risk chart for 10-years cardiovascular mortality based on age, sex, LDL-C concentration, smoking and hypertension. A risk chart adapted to the Belgian epidemiology is available 16(a copy of the SCORE Belgium is presented in annex).
• a primary hypercholesterolemia defined as a total cholesterol ≥175 mg/dl or a LDC≥100 mg/dl, measured while fasting at least twice (with an interval of 1 to 8 weeks between the 2 measurements, in patients following appropriate dietary advices) AND a history of at least one of the following conditions:
o a coronary event: myocardial infarction, angina, acute coronary syndrome, coronary by-pass
o a cerebrovascular event: thrombotic stroke or a documented transient ischemic attack
o a documented intermittent claudication
o a diabetes type II in patients ≥ 40 years
o a diabetes type I with a microalbuminuria
Three additional conditions apply for the reimbursement.
• The physician prescribes a dose which is not higher than the maximum daily dose recommended in the scientific notice.
• The physician checks the treatment impact by achieving yearly a lipid profile of his/her patient and by reporting the results in the medical file of the patient
• The physician does not prescribe simultaneously another lipid-lowering drug (such as fibrates), except if the specific association of the 2 drugs can be officially reimbursed.
Statins prescribed for severe hypercholesterolemia (serum cholesterol ≥300 mg/dl), mostly from hereditary origin, can be 100% reimbursed (category A, i.e. pharmaceuticals for serious and long-term illnesses), but only after authorization (Chapter IV).
For a complete overview of the complex reimbursement conditions, please see the article by Chevalier P. 17.
In January 2008, the government launched a system of tender with acknowledged similarities with the so-called Kiwi model practiced in New-Zeeland. The law proposed to increase the reimbursement of the molecule with the lowest price within the therapeutic class of statins, with the aim of making the cheapest molecule the most attractive for patients. However, this eventually turn out to be a so-called “Kiwi light” as the tender did apply only to molecules off-patent and as the reference reimbursement price resulting from the tender did also apply only to off-patent molecules, i.e. other molecules are still reimbursed proportionally to their retail price. Only MSD, the manufacturer of Zocor®, participated to the tender. As a result, the price of simvastatin was reduced by 46%.
l Ministerial decree of April 2006:
http://www.inami.fgov.be/drug/fr/drugs/groups/hypolipidemiants/pdf/arkb2006051001.pdf. The cut-offs for total cholesterol and LDL-C are also the ones recommended by the European guidelines of the 4th Joint Task force: http://www.escardio.org/guidelines-surveys/esc-guidelines/GuidelinesDocuments/guidelines-CVD-prevention-ES-FT.pdf
KCE Reports 141 Impact Policy Statin 9
In the 2009-2010 agreement of the National Convention between Physicians and Sickness Funds (NCPS; “Commission nationale médico-mutualiste (CNMM)/Nationale commissie geneesheren-ziekenfondsen (NCGZ)), agreed physicians commit to prescribe “the least expensive” molecule in 80% of new statin users, provided that there are no contra-indications and that therapeutic targets are achieved. The “least costly” medication is identified by the INAMI/RIZIV based on the cost for the INAMI/RIZIV per Defined Daily Dose (DDD) (for the total consumption in 2008). Moreover, it is recommended to prescribe a branded or a generic molecule for which no financial supplement is requested to the patient, i.e. molecule sold at the reference reimbursement price. In practice, simvastatin (generic and copies; Zocor MSD) and pravastatin (generics and copies; Pravastatine Sandoz; Pravasine) are recommendedm. The convention was signed by 82.8% of physicians.
The first evaluation of this measure was discussed on February 8, 2010 by the NCPS and representatives of the pharmaceutical sector, and was also made available on the website of the INAMI/RIZIVn. The objective to initiate therapy with either simvastatin or pravastatin in at least 8 of 10 patients was not reached. In June 2010, the CTG/CRM issued a new recommendation to use simvastatin or pravastatin to begin 100% new treatments in primary prevention, and most of new treatments in secondary prevention and in patients with diabetes o . In secondary prevention and in diabetic patients, atorvastatin or rosuvastatin can be considered in first intention for a new treatment only if the total cholesterol concentration is >290 mg/dl or the LDL-C is > 165 mg/dl. A new treatment is defined as the use of at least one packaging of statins without a history of statin intake in the 12 preceding months. Switching patients to atorvastatin, rosuvastatin, fluvastatin, or to a statin therapy complemented by other drugs can only be considered if therapeutic goals are not achieved after 3 months of treatment (total cholesterol<175 mg/dl or LDL-C<100 mg/dl in secondary prevention; total cholesterol<190 mg/dl or LDL-C<115 mg/dl in primary prevention). The official text of the recommendations is included in Annex. Doctors not complying with recommendations for statin utilization will be monitored during 6 months. If necessary, the physician monitored will be requested by the Medical Evaluation and Control Services of RIZIV/INAMI to justify his prescribing behaviour. The procedure could further lead to directly survey the prescription register of the incriminated MD and to administrative finesp.
2.2 DATA ANALYSIS Three databases have been used:
• a sample of claim data collected by sickness funds, for identification and description of statin users (the permanent sample/échantillon permanent/permanente steekproef – EPS, from the IMA-AIM databaseq),
• a sample of the hospital clinical data (RCM-MKG) to identify cardiovascular events,
• aggregates of national Pharmanet data to study trends of statin use over time.
These databases and the selection filters applied are described briefly in Table 1, and in extenso in the appendices. There is an unavoidable time delay to access administrative databases containing individual patient data. When this project started, the most recent data were available until 2006 for the hospital data and until the year 2007 for the EPS. The delay to receive aggregates of Pharmanet data is in general much shorter, and we received data up to November 2009.
m The point 6 of the agreement is detailed at: http://www.inami.fgov.be/care/fr/doctors/general-
information/agreements/2009-2010/pdf/20100501.pdf n http://www.inami.fgov.be/care/fr/doctors/general-information/agreements/2009-2010/pdf/point6.pdf o http://www.inami.fgov.be/drug/fr/drugs/recommendation/pdf/recommandations_statines.pdf p http://www.inami.fgov.be/drug/fr/drugs/recommendation/pdf/brochure.pdf q The permanent sample is an anonymous, representative sample of the IMA-AIM database. It consists of
1/40 sample of the Belgian assured <65 years old and a 1/20 sample of people ≥65 years old. This oversampling of people ≥65 years was taken into account in all analyses, and absolute numbers were extrapolated to the national population (unless specified otherwise).
10 Impact Policy Statin KCE Reports 141
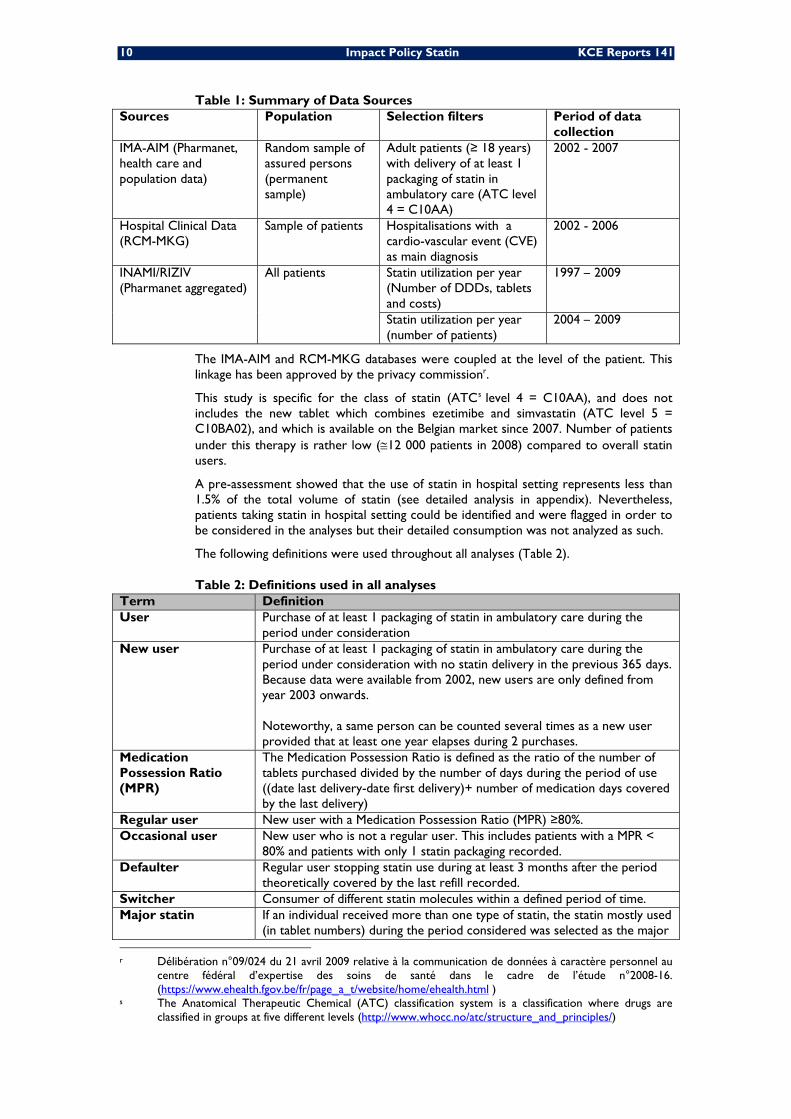
Table 1: Summary of Data Sources Sources Population Selection filters Period of data
collection IMA-AIM (Pharmanet, health care and population data)
Random sample of assured persons (permanent sample)
Adult patients (≥ 18 years) with delivery of at least 1 packaging of statin in ambulatory care (ATC level 4 = C10AA)
2002 - 2007
Hospital Clinical Data (RCM-MKG)
Sample of patients Hospitalisations with a cardio-vascular event (CVE) as main diagnosis
2002 - 2006
INAMI/RIZIV (Pharmanet aggregated)
All patients Statin utilization per year (Number of DDDs, tablets and costs)
1997 – 2009
Statin utilization per year (number of patients)
2004 – 2009
The IMA-AIM and RCM-MKG databases were coupled at the level of the patient. This linkage has been approved by the privacy commissionr.
This study is specific for the class of statin (ATCs level 4 = C10AA), and does not includes the new tablet which combines ezetimibe and simvastatin (ATC level 5 = C10BA02), and which is available on the Belgian market since 2007. Number of patients under this therapy is rather low (≅12 000 patients in 2008) compared to overall statin users.
A pre-assessment showed that the use of statin in hospital setting represents less than 1.5% of the total volume of statin (see detailed analysis in appendix). Nevertheless, patients taking statin in hospital setting could be identified and were flagged in order to be considered in the analyses but their detailed consumption was not analyzed as such.
The following definitions were used throughout all analyses (Table 2).
Table 2: Definitions used in all analyses Term Definition User Purchase of at least 1 packaging of statin in ambulatory care during the
period under consideration New user Purchase of at least 1 packaging of statin in ambulatory care during the
period under consideration with no statin delivery in the previous 365 days. Because data were available from 2002, new users are only defined from year 2003 onwards. Noteworthy, a same person can be counted several times as a new user provided that at least one year elapses during 2 purchases.
Medication Possession Ratio (MPR)
The Medication Possession Ratio is defined as the ratio of the number of tablets purchased divided by the number of days during the period of use ((date last delivery-date first delivery)+ number of medication days covered by the last delivery)
Regular user New user with a Medication Possession Ratio (MPR) ≥80%. Occasional user New user who is not a regular user. This includes patients with a MPR <
80% and patients with only 1 statin packaging recorded. Defaulter Regular user stopping statin use during at least 3 months after the period
theoretically covered by the last refill recorded. Switcher Consumer of different statin molecules within a defined period of time. Major statin
If an individual received more than one type of statin, the statin mostly used (in tablet numbers) during the period considered was selected as the major
r Délibération n°09/024 du 21 avril 2009 relative à la communication de données à caractère personnel au
centre fédéral d’expertise des soins de santé dans le cadre de l’étude n°2008-16. (https://www.ehealth.fgov.be/fr/page_a_t/website/home/ehealth.html )
s The Anatomical Therapeutic Chemical (ATC) classification system is a classification where drugs are classified in groups at five different levels (http://www.whocc.no/atc/structure_and_principles/)
KCE Reports 141 Impact Policy Statin 11
Term Definition statin used.
Cardiovascular Event
A cardiovascular event (CVE) is defined as a hospitalization with a principal diagnosis within the following list:
• 410 Acute myocardial infarction (AMI) • 411 Other acute and subacute forms of ischemic heart disease • 413 Angina pectoris • 414 Other forms of chronic ischemic heart disease • 433 Occlusion and stenosis of precerebral arteries • 434 Occlusion of cerebral arteries • 435 Transient cerebral ischemia
Secondary prevention
Statin in new users within the year following a hospitalization CVE and without statin use in the year prior the hospitalisation.
Primary prevention Statin in new users with no hospitalisation for CVE recorded in the year preceding the start of the statin use.
Diabetic Consumer of at least one packaging of drugs used to treat diabetes, i.e. within the ATC level 2 = A10, in the year preceding the CVE or the start of statin therapy (depending on the analyses)
• A10A – Insulins and analogues • A10B – Blood Glucose Lowering Drugs, excl. insulins • A10X – Other drugs used in diabetes
All analyses were performed using SAS 9.1 or Excel 2007.
2.2.1 Utilization trends (1997- 2009)
This section describes the statins delivered in the ambulatory sector, in terms of volume measures (DDDs, patients, tablets) and expenditures in Belgium between 1997 and 2009. Data from Pharmanet were aggregated per year by INAMI/RIZIV and plotted in Excel by KCE. As a unique patient identifier was available only from 2004 onwards, the number of patients was extrapolated from the EPS dataset for the years 2002 and 2003. The EPS was also used to study the variation in tablets strengths over the years.
2.2.1.1 Volume measures (DDDs, patients, tablets)
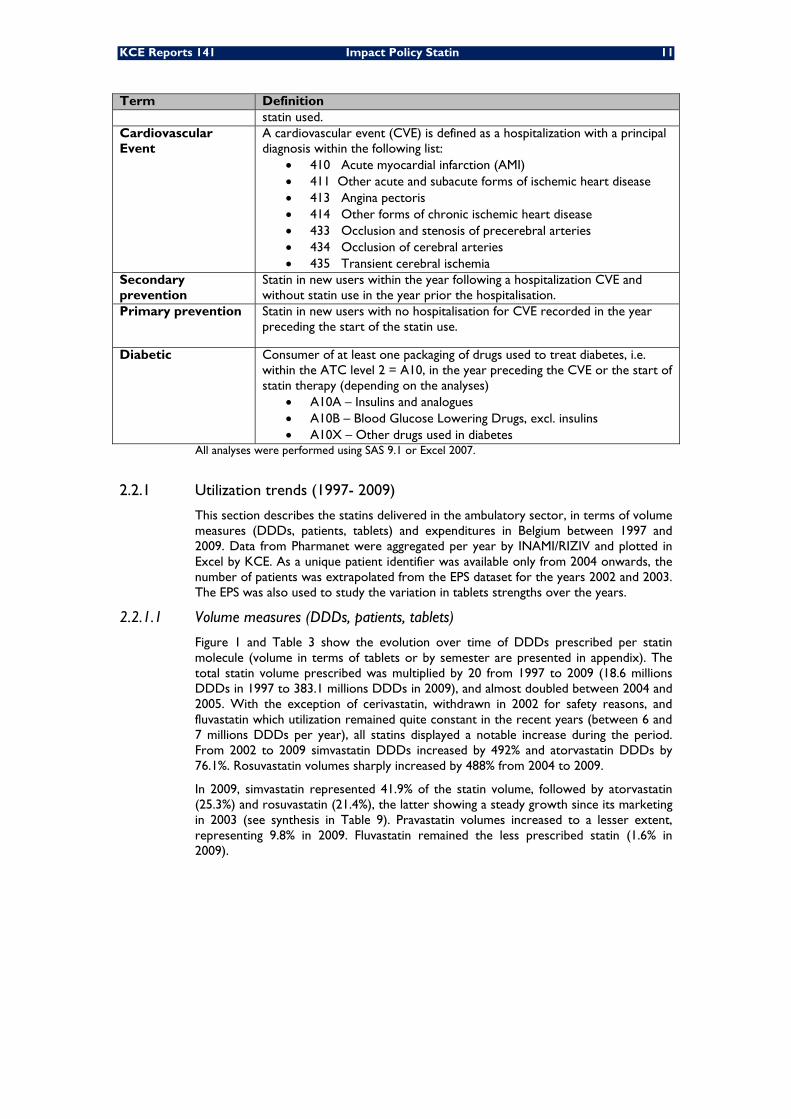
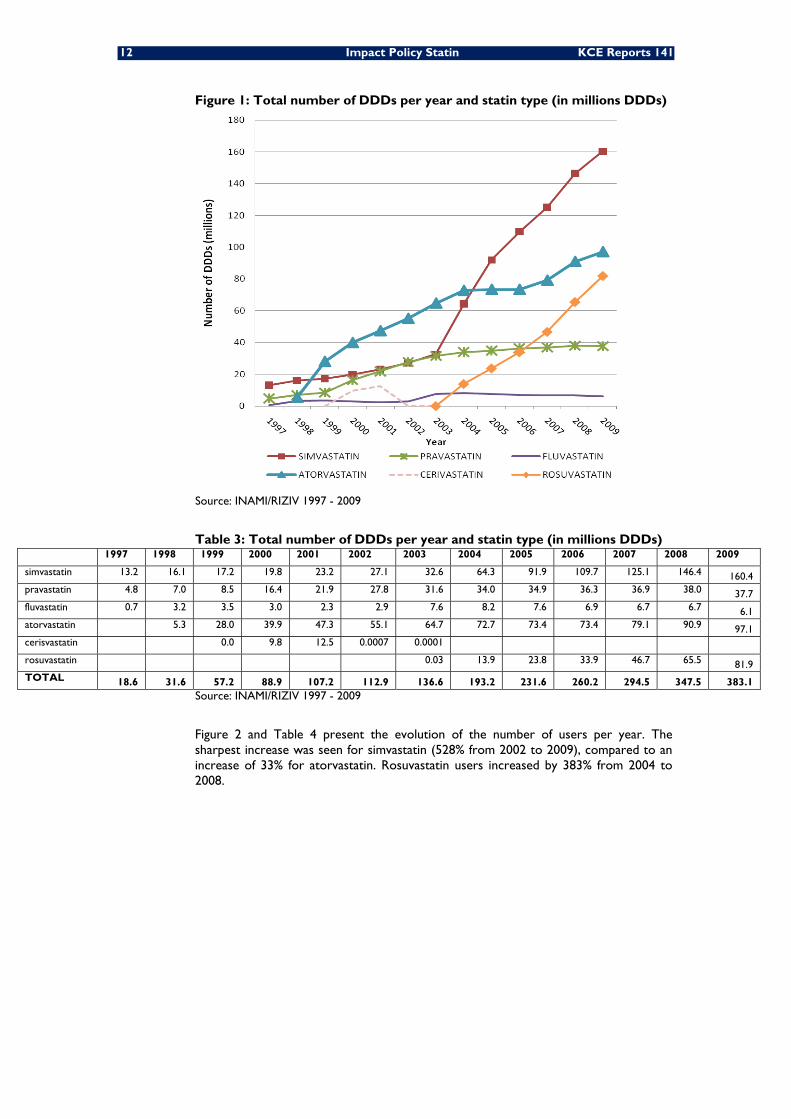
Figure 1 and Table 3 show the evolution over time of DDDs prescribed per statin molecule (volume in terms of tablets or by semester are presented in appendix). The total statin volume prescribed was multiplied by 20 from 1997 to 2009 (18.6 millions DDDs in 1997 to 383.1 millions DDDs in 2009), and almost doubled between 2004 and 2005. With the exception of cerivastatin, withdrawn in 2002 for safety reasons, and fluvastatin which utilization remained quite constant in the recent years (between 6 and 7 millions DDDs per year), all statins displayed a notable increase during the period. From 2002 to 2009 simvastatin DDDs increased by 492% and atorvastatin DDDs by 76.1%. Rosuvastatin volumes sharply increased by 488% from 2004 to 2009.
In 2009, simvastatin represented 41.9% of the statin volume, followed by atorvastatin (25.3%) and rosuvastatin (21.4%), the latter showing a steady growth since its marketing in 2003 (see synthesis in Table 9). Pravastatin volumes increased to a lesser extent, representing 9.8% in 2009. Fluvastatin remained the less prescribed statin (1.6% in 2009).
12 Impact Policy Statin KCE Reports 141
Figure 1: Total number of DDDs per year and statin type (in millions DDDs)
Source: INAMI/RIZIV 1997 - 2009
Table 3: Total number of DDDs per year and statin type (in millions DDDs) 1997 1998 1999 2000 2001 2002 2003 2004 2005 2006 2007 2008 2009
simvastatin 13.2 16.1 17.2 19.8 23.2 27.1 32.6 64.3 91.9 109.7 125.1 146.4 160.4 pravastatin 4.8 7.0 8.5 16.4 21.9 27.8 31.6 34.0 34.9 36.3 36.9 38.0 37.7 fluvastatin 0.7 3.2 3.5 3.0 2.3 2.9 7.6 8.2 7.6 6.9 6.7 6.7 6.1 atorvastatin 5.3 28.0 39.9 47.3 55.1 64.7 72.7 73.4 73.4 79.1 90.9 97.1 cerisvastatin 0.0 9.8 12.5 0.0007 0.0001 rosuvastatin 0.03 13.9 23.8 33.9 46.7 65.5 81.9 TOTAL 18.6 31.6 57.2 88.9 107.2 112.9 136.6 193.2 231.6 260.2 294.5 347.5 383.1
Source: INAMI/RIZIV 1997 - 2009
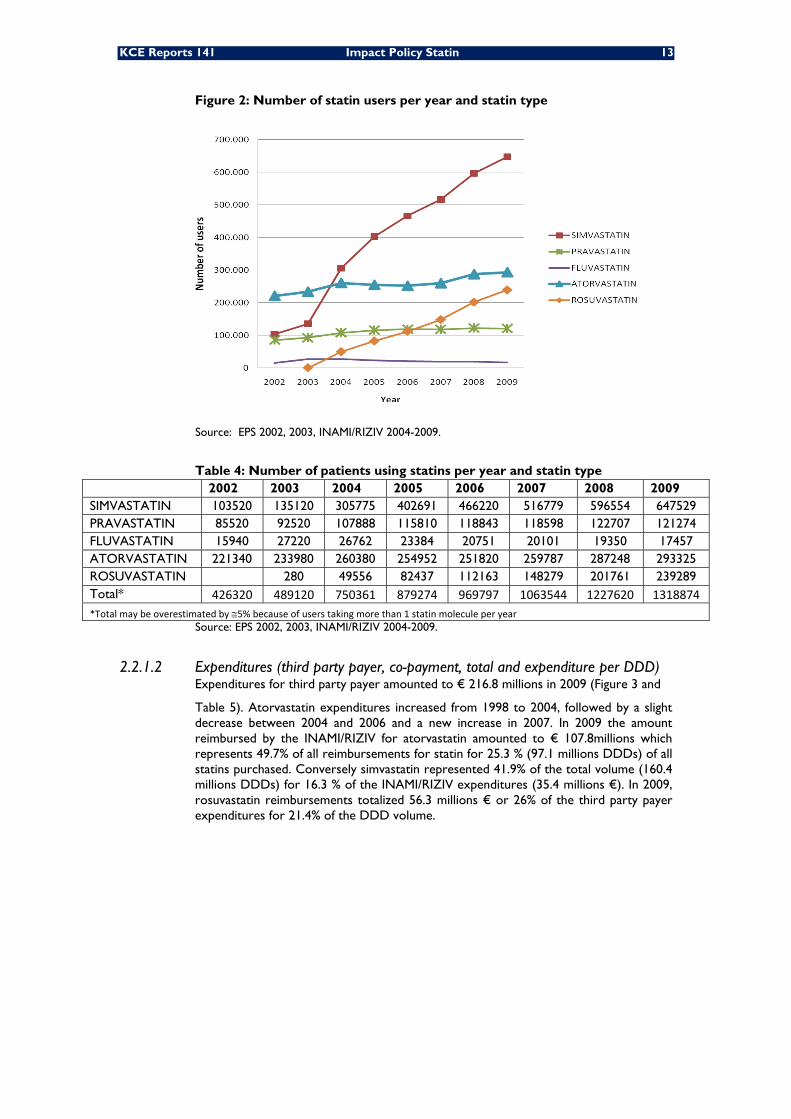
Figure 2 and Table 4 present the evolution of the number of users per year. The sharpest increase was seen for simvastatin (528% from 2002 to 2009), compared to an increase of 33% for atorvastatin. Rosuvastatin users increased by 383% from 2004 to 2008.
KCE Reports 141 Impact Policy Statin 13
Figure 2: Number of statin users per year and statin type
Source: EPS 2002, 2003, INAMI/RIZIV 2004-2009.
Table 4: Number of patients using statins per year and statin type 2002 2003 2004 2005 2006 2007 2008 2009 SIMVASTATIN 103520 135120 305775 402691 466220 516779 596554 647529 PRAVASTATIN 85520 92520 107888 115810 118843 118598 122707 121274 FLUVASTATIN 15940 27220 26762 23384 20751 20101 19350 17457 ATORVASTATIN 221340 233980 260380 254952 251820 259787 287248 293325 ROSUVASTATIN 280 49556 82437 112163 148279 201761 239289 Total* 426320 489120 750361 879274 969797 1063544 1227620 1318874 *Total may be overestimated by ≅5% because of users taking more than 1 statin molecule per year
Source: EPS 2002, 2003, INAMI/RIZIV 2004-2009.
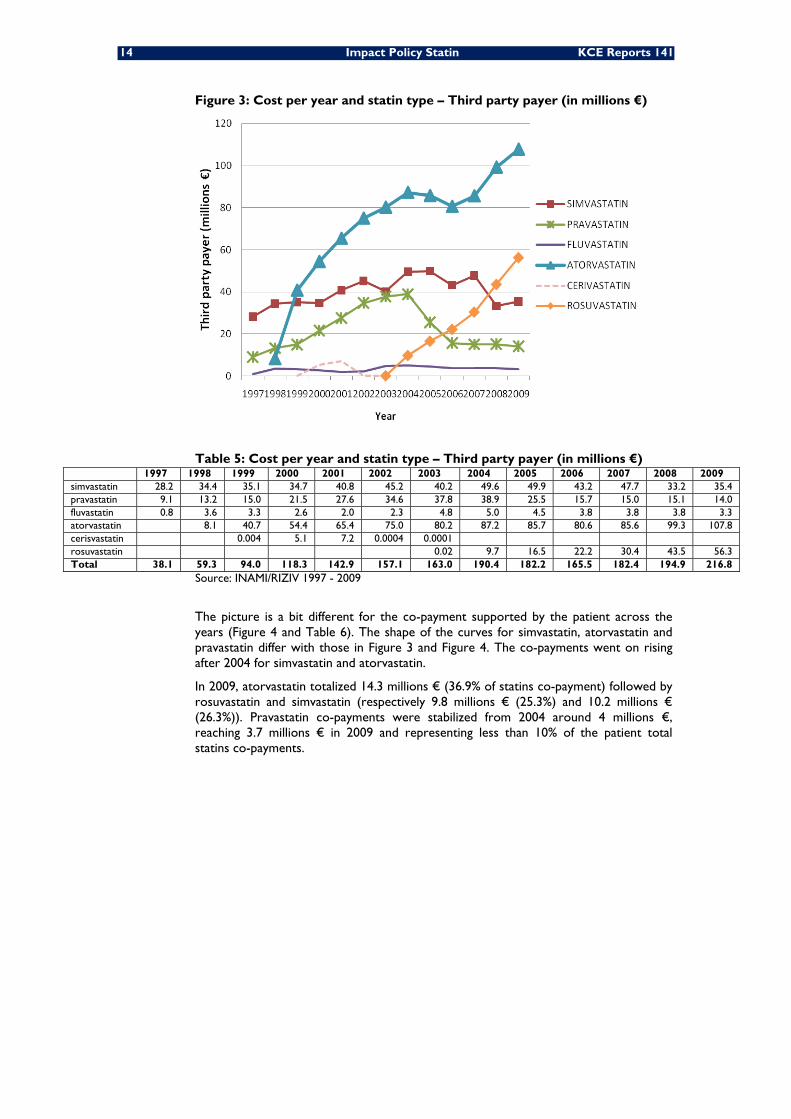
2.2.1.2 Expenditures (third party payer, co-payment, total and expenditure per DDD) Expenditures for third party payer amounted to € 216.8 millions in 2009 (Figure 3 and
Table 5). Atorvastatin expenditures increased from 1998 to 2004, followed by a slight decrease between 2004 and 2006 and a new increase in 2007. In 2009 the amount reimbursed by the INAMI/RIZIV for atorvastatin amounted to € 107.8millions which represents 49.7% of all reimbursements for statin for 25.3 % (97.1 millions DDDs) of all statins purchased. Conversely simvastatin represented 41.9% of the total volume (160.4 millions DDDs) for 16.3 % of the INAMI/RIZIV expenditures (35.4 millions €). In 2009, rosuvastatin reimbursements totalized 56.3 millions € or 26% of the third party payer expenditures for 21.4% of the DDD volume.
14 Impact Policy Statin KCE Reports 141
Figure 3: Cost per year and statin type – Third party payer (in millions €)
Table 5: Cost per year and statin type – Third party payer (in millions €) 1997 1998 1999 2000 2001 2002 2003 2004 2005 2006 2007 2008 2009 simvastatin 28.2 34.4 35.1 34.7 40.8 45.2 40.2 49.6 49.9 43.2 47.7 33.2 35.4 pravastatin 9.1 13.2 15.0 21.5 27.6 34.6 37.8 38.9 25.5 15.7 15.0 15.1 14.0 fluvastatin 0.8 3.6 3.3 2.6 2.0 2.3 4.8 5.0 4.5 3.8 3.8 3.8 3.3 atorvastatin 8.1 40.7 54.4 65.4 75.0 80.2 87.2 85.7 80.6 85.6 99.3 107.8 cerisvastatin 0.004 5.1 7.2 0.0004 0.0001 rosuvastatin 0.02 9.7 16.5 22.2 30.4 43.5 56.3 Total 38.1 59.3 94.0 118.3 142.9 157.1 163.0 190.4 182.2 165.5 182.4 194.9 216.8
Source: INAMI/RIZIV 1997 - 2009
The picture is a bit different for the co-payment supported by the patient across the years (Figure 4 and Table 6). The shape of the curves for simvastatin, atorvastatin and pravastatin differ with those in Figure 3 and Figure 4. The co-payments went on rising after 2004 for simvastatin and atorvastatin.
In 2009, atorvastatin totalized 14.3 millions € (36.9% of statins co-payment) followed by rosuvastatin and simvastatin (respectively 9.8 millions € (25.3%) and 10.2 millions € (26.3%)). Pravastatin co-payments were stabilized from 2004 around 4 millions €, reaching 3.7 millions € in 2009 and representing less than 10% of the patient total statins co-payments.
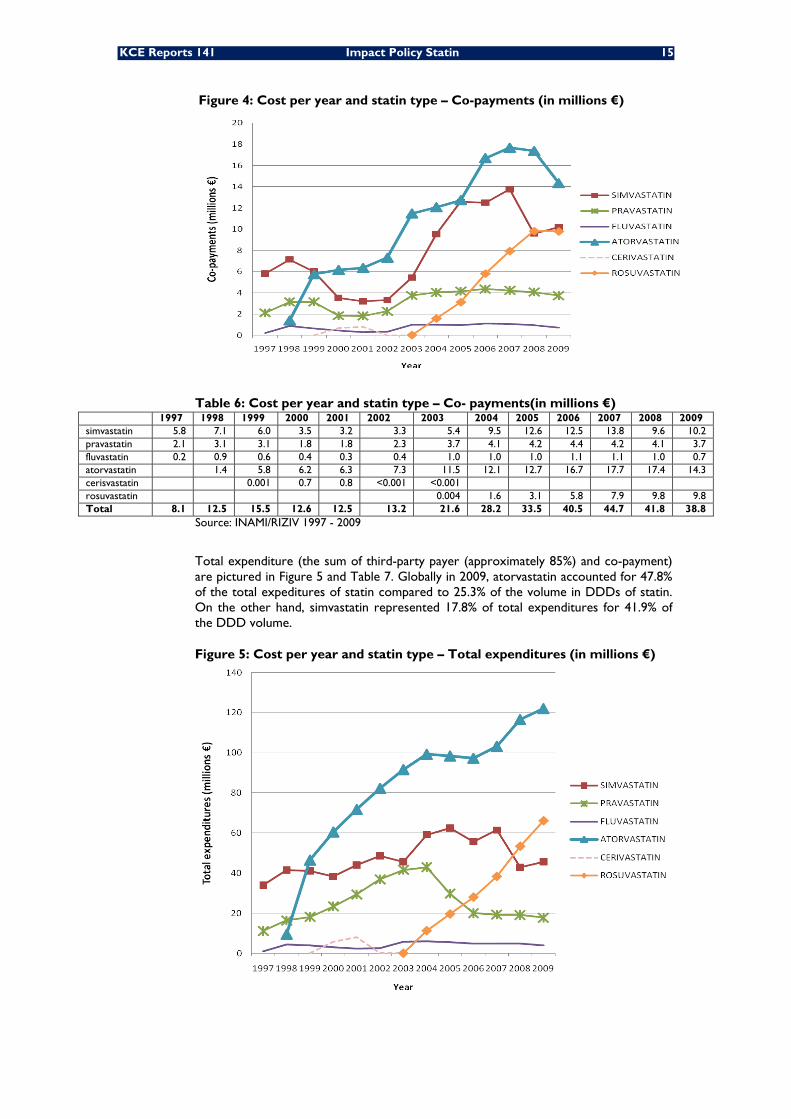
KCE Reports 141 Impact Policy Statin 15
Figure 4: Cost per year and statin type – Co-payments (in millions €)
Table 6: Cost per year and statin type – Co- payments(in millions €) 1997 1998 1999 2000 2001 2002 2003 2004 2005 2006 2007 2008 2009 simvastatin 5.8 7.1 6.0 3.5 3.2 3.3 5.4 9.5 12.6 12.5 13.8 9.6 10.2 pravastatin 2.1 3.1 3.1 1.8 1.8 2.3 3.7 4.1 4.2 4.4 4.2 4.1 3.7 fluvastatin 0.2 0.9 0.6 0.4 0.3 0.4 1.0 1.0 1.0 1.1 1.1 1.0 0.7 atorvastatin 1.4 5.8 6.2 6.3 7.3 11.5 12.1 12.7 16.7 17.7 17.4 14.3 cerisvastatin 0.001 0.7 0.8 <0.001 <0.001 rosuvastatin 0.004 1.6 3.1 5.8 7.9 9.8 9.8 Total 8.1 12.5 15.5 12.6 12.5 13.2 21.6 28.2 33.5 40.5 44.7 41.8 38.8
Source: INAMI/RIZIV 1997 - 2009
Total expenditure (the sum of third-party payer (approximately 85%) and co-payment) are pictured in Figure 5 and Table 7. Globally in 2009, atorvastatin accounted for 47.8% of the total expeditures of statin compared to 25.3% of the volume in DDDs of statin. On the other hand, simvastatin represented 17.8% of total expenditures for 41.9% of the DDD volume.
Figure 5: Cost per year and statin type – Total expenditures (in millions €)
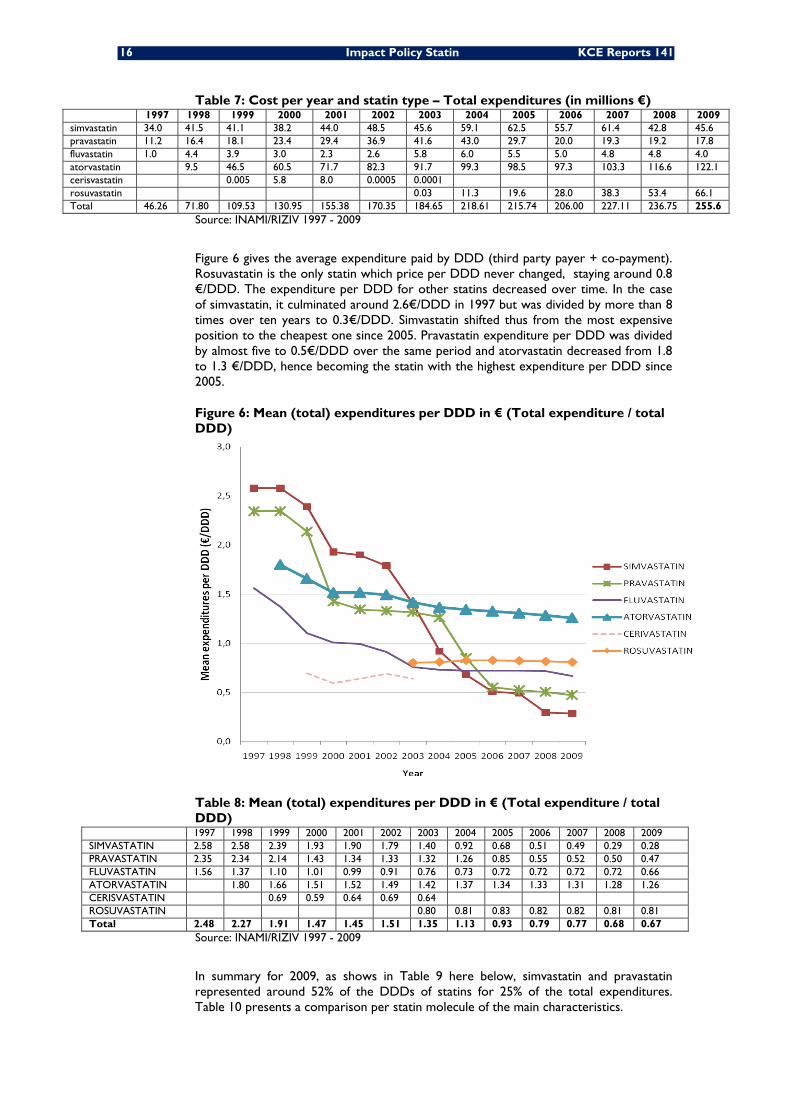
16 Impact Policy Statin KCE Reports 141
Table 7: Cost per year and statin type – Total expenditures (in millions €) 1997 1998 1999 2000 2001 2002 2003 2004 2005 2006 2007 2008 2009
simvastatin 34.0 41.5 41.1 38.2 44.0 48.5 45.6 59.1 62.5 55.7 61.4 42.8 45.6 pravastatin 11.2 16.4 18.1 23.4 29.4 36.9 41.6 43.0 29.7 20.0 19.3 19.2 17.8 fluvastatin 1.0 4.4 3.9 3.0 2.3 2.6 5.8 6.0 5.5 5.0 4.8 4.8 4.0 atorvastatin 9.5 46.5 60.5 71.7 82.3 91.7 99.3 98.5 97.3 103.3 116.6 122.1 cerisvastatin 0.005 5.8 8.0 0.0005 0.0001 rosuvastatin 0.03 11.3 19.6 28.0 38.3 53.4 66.1 Total 46.26 71.80 109.53 130.95 155.38 170.35 184.65 218.61 215.74 206.00 227.11 236.75 255.6
Source: INAMI/RIZIV 1997 - 2009
Figure 6 gives the average expenditure paid by DDD (third party payer + co-payment). Rosuvastatin is the only statin which price per DDD never changed, staying around 0.8 €/DDD. The expenditure per DDD for other statins decreased over time. In the case of simvastatin, it culminated around 2.6€/DDD in 1997 but was divided by more than 8 times over ten years to 0.3€/DDD. Simvastatin shifted thus from the most expensive position to the cheapest one since 2005. Pravastatin expenditure per DDD was divided by almost five to 0.5€/DDD over the same period and atorvastatin decreased from 1.8 to 1.3 €/DDD, hence becoming the statin with the highest expenditure per DDD since 2005.
Figure 6: Mean (total) expenditures per DDD in € (Total expenditure / total DDD)
Table 8: Mean (total) expenditures per DDD in € (Total expenditure / total DDD)
1997 1998 1999 2000 2001 2002 2003 2004 2005 2006 2007 2008 2009 SIMVASTATIN 2.58 2.58 2.39 1.93 1.90 1.79 1.40 0.92 0.68 0.51 0.49 0.29 0.28 PRAVASTATIN 2.35 2.34 2.14 1.43 1.34 1.33 1.32 1.26 0.85 0.55 0.52 0.50 0.47 FLUVASTATIN 1.56 1.37 1.10 1.01 0.99 0.91 0.76 0.73 0.72 0.72 0.72 0.72 0.66 ATORVASTATIN 1.80 1.66 1.51 1.52 1.49 1.42 1.37 1.34 1.33 1.31 1.28 1.26 CERISVASTATIN 0.69 0.59 0.64 0.69 0.64 ROSUVASTATIN 0.80 0.81 0.83 0.82 0.82 0.81 0.81 Total 2.48 2.27 1.91 1.47 1.45 1.51 1.35 1.13 0.93 0.79 0.77 0.68 0.67
Source: INAMI/RIZIV 1997 - 2009
In summary for 2009, as shows in Table 9 here below, simvastatin and pravastatin represented around 52% of the DDDs of statins for 25% of the total expenditures. Table 10 presents a comparison per statin molecule of the main characteristics.
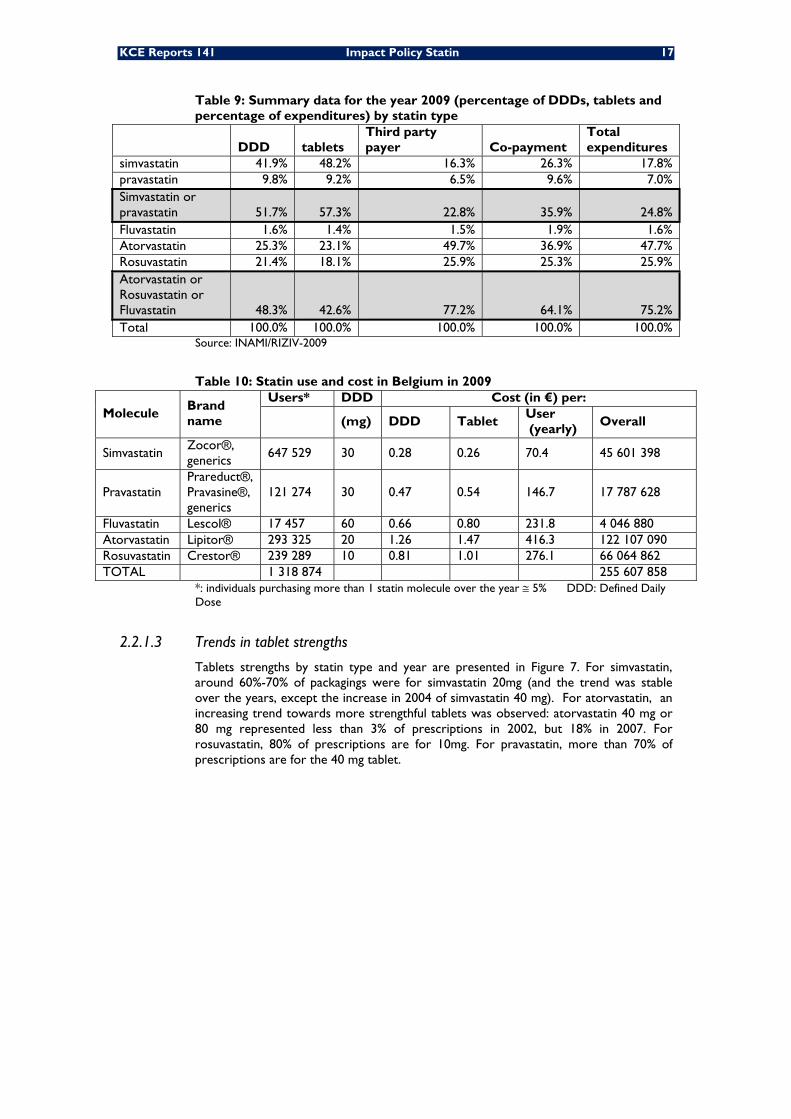
KCE Reports 141 Impact Policy Statin 17
Table 9: Summary data for the year 2009 (percentage of DDDs, tablets and percentage of expenditures) by statin type
DDD tablets Third party payer Co-payment
Total expenditures
simvastatin 41.9% 48.2% 16.3% 26.3% 17.8% pravastatin 9.8% 9.2% 6.5% 9.6% 7.0% Simvastatin or pravastatin 51.7% 57.3% 22.8% 35.9% 24.8% Fluvastatin 1.6% 1.4% 1.5% 1.9% 1.6% Atorvastatin 25.3% 23.1% 49.7% 36.9% 47.7% Rosuvastatin 21.4% 18.1% 25.9% 25.3% 25.9% Atorvastatin or Rosuvastatin or Fluvastatin 48.3% 42.6% 77.2% 64.1% 75.2% Total 100.0% 100.0% 100.0% 100.0% 100.0%
Source: INAMI/RIZIV-2009
Table 10: Statin use and cost in Belgium in 2009
Molecule Brand name
Users* DDD Cost (in €) per:
(mg) DDD Tablet User (yearly)
Overall
Simvastatin Zocor®, generics
647 529 30 0.28 0.26 70.4 45 601 398
Pravastatin Prareduct®, Pravasine®, generics
121 274 30 0.47 0.54 146.7 17 787 628
Fluvastatin Lescol® 17 457 60 0.66 0.80 231.8 4 046 880 Atorvastatin Lipitor® 293 325 20 1.26 1.47 416.3 122 107 090 Rosuvastatin Crestor® 239 289 10 0.81 1.01 276.1 66 064 862 TOTAL 1 318 874 255 607 858
*: individuals purchasing more than 1 statin molecule over the year ≅ 5% DDD: Defined Daily Dose
2.2.1.3 Trends in tablet strengths
Tablets strengths by statin type and year are presented in Figure 7. For simvastatin, around 60%-70% of packagings were for simvastatin 20mg (and the trend was stable over the years, except the increase in 2004 of simvastatin 40 mg). For atorvastatin, an increasing trend towards more strengthful tablets was observed: atorvastatin 40 mg or 80 mg represented less than 3% of prescriptions in 2002, but 18% in 2007. For rosuvastatin, 80% of prescriptions are for 10mg. For pravastatin, more than 70% of prescriptions are for the 40 mg tablet.
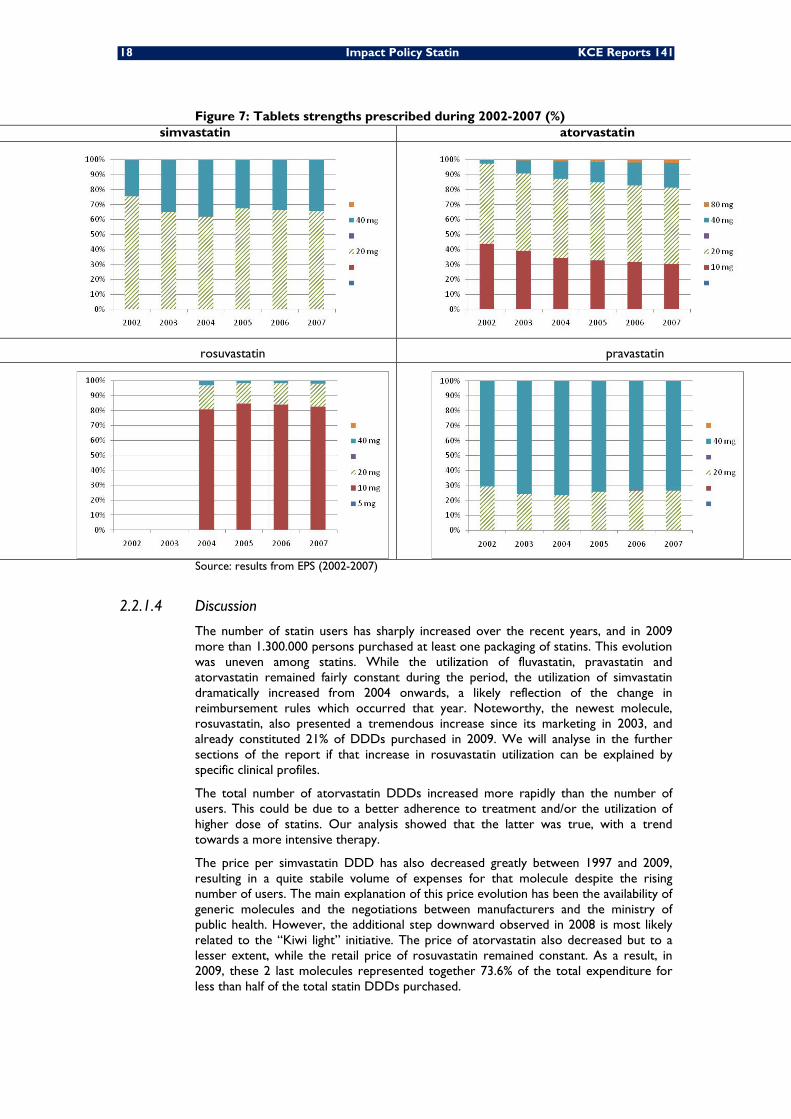
18 Impact Policy Statin KCE Reports 141
Figure 7: Tablets strengths prescribed during 2002-2007 (%) simvastatin atorvastatin
rosuvastatin pravastatin
Source: results from EPS (2002-2007)
2.2.1.4 Discussion
The number of statin users has sharply increased over the recent years, and in 2009 more than 1.300.000 persons purchased at least one packaging of statins. This evolution was uneven among statins. While the utilization of fluvastatin, pravastatin and atorvastatin remained fairly constant during the period, the utilization of simvastatin dramatically increased from 2004 onwards, a likely reflection of the change in reimbursement rules which occurred that year. Noteworthy, the newest molecule, rosuvastatin, also presented a tremendous increase since its marketing in 2003, and already constituted 21% of DDDs purchased in 2009. We will analyse in the further sections of the report if that increase in rosuvastatin utilization can be explained by specific clinical profiles.
The total number of atorvastatin DDDs increased more rapidly than the number of users. This could be due to a better adherence to treatment and/or the utilization of higher dose of statins. Our analysis showed that the latter was true, with a trend towards a more intensive therapy.
The price per simvastatin DDD has also decreased greatly between 1997 and 2009, resulting in a quite stabile volume of expenses for that molecule despite the rising number of users. The main explanation of this price evolution has been the availability of generic molecules and the negotiations between manufacturers and the ministry of public health. However, the additional step downward observed in 2008 is most likely related to the “Kiwi light” initiative. The price of atorvastatin also decreased but to a lesser extent, while the retail price of rosuvastatin remained constant. As a result, in 2009, these 2 last molecules represented together 73.6% of the total expenditure for less than half of the total statin DDDs purchased.
KCE Reports 141 Impact Policy Statin 19
Atorvastatin and rosuvastatin occupied respectively the 1st and 4th position in the top list of highest public expenditures per drug. As the single most used drug class, statins accounted for 7% of overall ambulatory drug expenditure in Belgium in 2009. Noteworthy, atorvastatin will get off-patent in November 2011, which will result very likely in the emergence of generics and copies and in decreased cost per DDD.
Key points
Market evolution over time
• For the period 1997 to 2009, the total statin DDDs delivered was multiplied by 20 (from 18.6 millions DDDs to 383.6 millions DDDs) and the mean expenditure per DDD dropped from 2.7€ to 0.67€.
• In 2009, 1 318 874 individuals purchased at least one packaging of statins. From 2002 to 2009, the number of patients increased by 528% for simvastatin and by 33% for atorvastatin. For rosuvastatin, the increase was 383% from 2004 to 2009.
• In the recent years, the proportion of users of simvastatin/pravastatin has remained around 60%.
• In 2009, total expenditure for statins amounted to 255 607 858 euros (7% of overall expenditure for ambulatory drug in Belgium). Simvastatin and pravastatin represented 52% of the DDDs but 25% of the global statin expenditure.
2.2.2 Impact of the 2004 Regulation change
Expectedly, the regulation change that occurred in August 2004 (see Section 2.1) might have led to modified prescription behaviours, i.e. patients could have been preferentially prescribed simvastatin or pravastatin. The aim of this part was thus to describe the switch between statins when the new regulation was implemented.
All statin users recorded in the EPS were included in this analysis and results presented in this section are extrapolated to the Belgian population (taken into account oversampling of people ≥65 years old). In chapter 2.2.1, only data aggregated at the population level were used, with no possibilities to look at switches of users from 1 statin to another or to look specifically to new users. As the change in regulation occurred in August 2004, we aimed at comparing prescription behaviours before and after that measure, and thus we divided the overall observation period as follows:
• Period 1: 1st August 2002 to 31st July 2003
• Period 2: 1st August 2003 to 31st July 2004
• Period 3: 1st August 2004 to 31st July 2005
• Period 4: 1st August 2005 to 31st July 2006
• Period 5: 1st August 2006 to 31st July 2007
For each of these one-year period, we assessed the number of users and of statin switchers, in absolute and relative terms, per major statin type (as defined in Table 2). Noteworthy, preliminary analyses showed that the proportion of patients using more than one statin within a period was less than 5% (see appendix) and therefore using major statin type was unlikely to distort the results. To assess how the new 2004 regulation might have resulted in statin switches, we focused on the change in statins, if any, between the period preceding and following the new regulation, i.e. between Aug2003-Aug2004 and Aug2004-Aug2005. The analysis included patients with at least one statin packaging delivery in each of the periods, i.e. new users in the period Aug2004-Aug2005 were excluded from the analyses as the occurrence of a statin switch made no sense in such case.
20 Impact Policy Statin KCE Reports 141
2.2.2.1 Statin switches around August 2004
Overall, there were around 89% of patients who haven’t changed of statin type between Aug2003-Aug2004 and Aug2004-Aug2005 (Table 11). The percentage of patients switching to another statin than the one they used before August 2004 was higher for the group of patients using fluvastatin (25%) or pravastatin (17%). Only 9% and 6% of atorvastatin and rosuvastatin users, respectively, switched to simvastatin or pravastatin (Table 12). Conversely, 36% (11 960/32 900) of rosuvastatin users in the period August 2004-August 2005 used another statins prior to Aug2004; this percentage amounted to 16% (27 400/166 360) for simvastatin (Table 12).
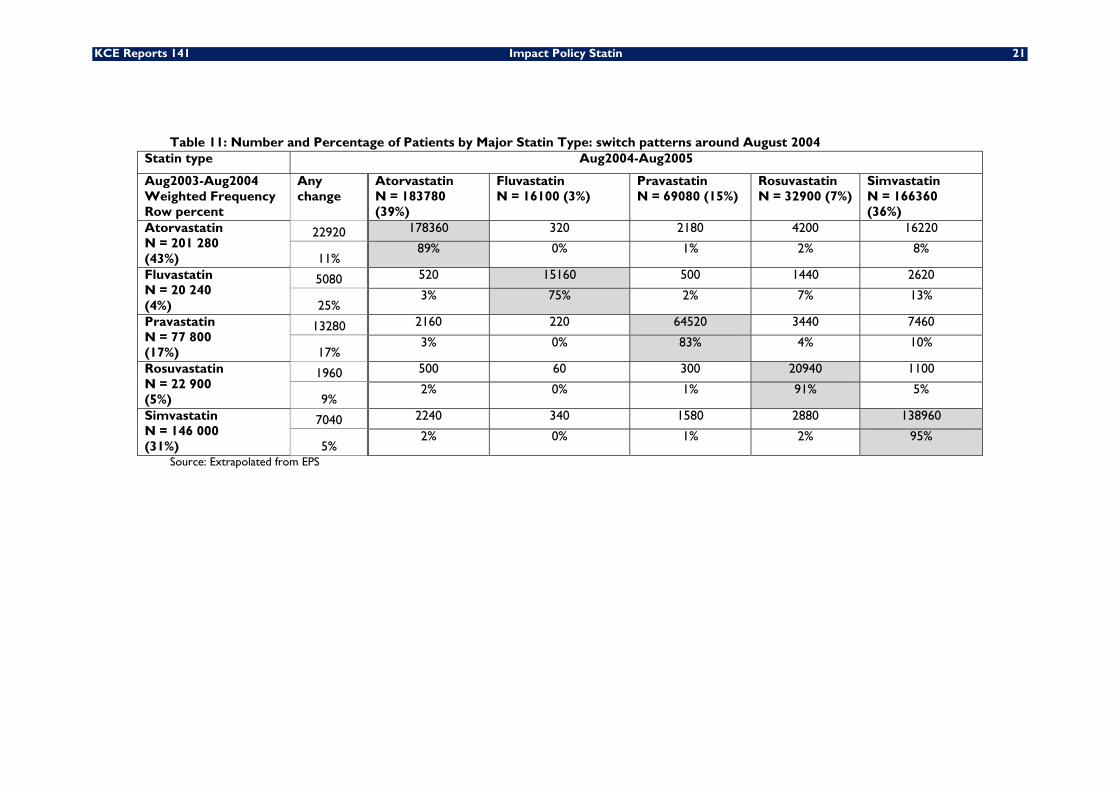
KCE Reports 141 Impact Policy Statin 21
Table 11: Number and Percentage of Patients by Major Statin Type: switch patterns around August 2004 Statin type Aug2004-Aug2005
Aug2003-Aug2004 Weighted Frequency Row percent
Any change
Atorvastatin N = 183780 (39%)
Fluvastatin N = 16100 (3%)
Pravastatin N = 69080 (15%)
Rosuvastatin N = 32900 (7%)
Simvastatin N = 166360 (36%)
Atorvastatin N = 201 280 (43%)
22920 178360 320 2180 4200 16220
11% 89% 0% 1% 2% 8%
Fluvastatin N = 20 240 (4%)
5080 520 15160 500 1440 2620
25% 3% 75% 2% 7% 13%
Pravastatin N = 77 800 (17%)
13280 2160 220 64520 3440 7460
17% 3% 0% 83% 4% 10%
Rosuvastatin N = 22 900 (5%)
1960 500 60 300 20940 1100
9% 2% 0% 1% 91% 5%
Simvastatin N = 146 000 (31%)
7040 2240 340 1580 2880 138960
5% 2% 0% 1% 2% 95%
Source: Extrapolated from EPS
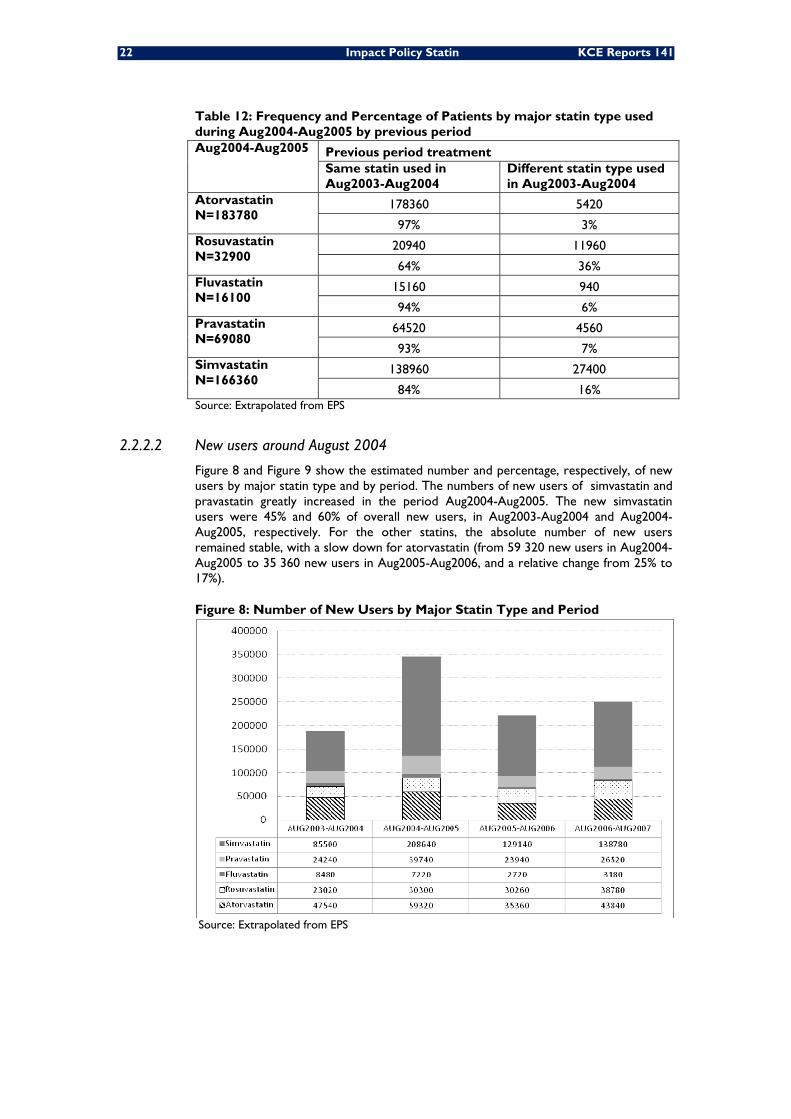
22 Impact Policy Statin KCE Reports 141
Table 12: Frequency and Percentage of Patients by major statin type used during Aug2004-Aug2005 by previous period Aug2004-Aug2005 Previous period treatment
Same statin used in Aug2003-Aug2004
Different statin type used in Aug2003-Aug2004
Atorvastatin N=183780
178360 5420
97% 3% Rosuvastatin N=32900
20940 11960
64% 36% Fluvastatin N=16100
15160 940
94% 6% Pravastatin N=69080
64520 4560
93% 7% Simvastatin N=166360
138960 27400
84% 16% Source: Extrapolated from EPS
2.2.2.2 New users around August 2004
Figure 8 and Figure 9 show the estimated number and percentage, respectively, of new users by major statin type and by period. The numbers of new users of simvastatin and pravastatin greatly increased in the period Aug2004-Aug2005. The new simvastatin users were 45% and 60% of overall new users, in Aug2003-Aug2004 and Aug2004-Aug2005, respectively. For the other statins, the absolute number of new users remained stable, with a slow down for atorvastatin (from 59 320 new users in Aug2004-Aug2005 to 35 360 new users in Aug2005-Aug2006, and a relative change from 25% to 17%).
Figure 8: Number of New Users by Major Statin Type and Period
Source: Extrapolated from EPS
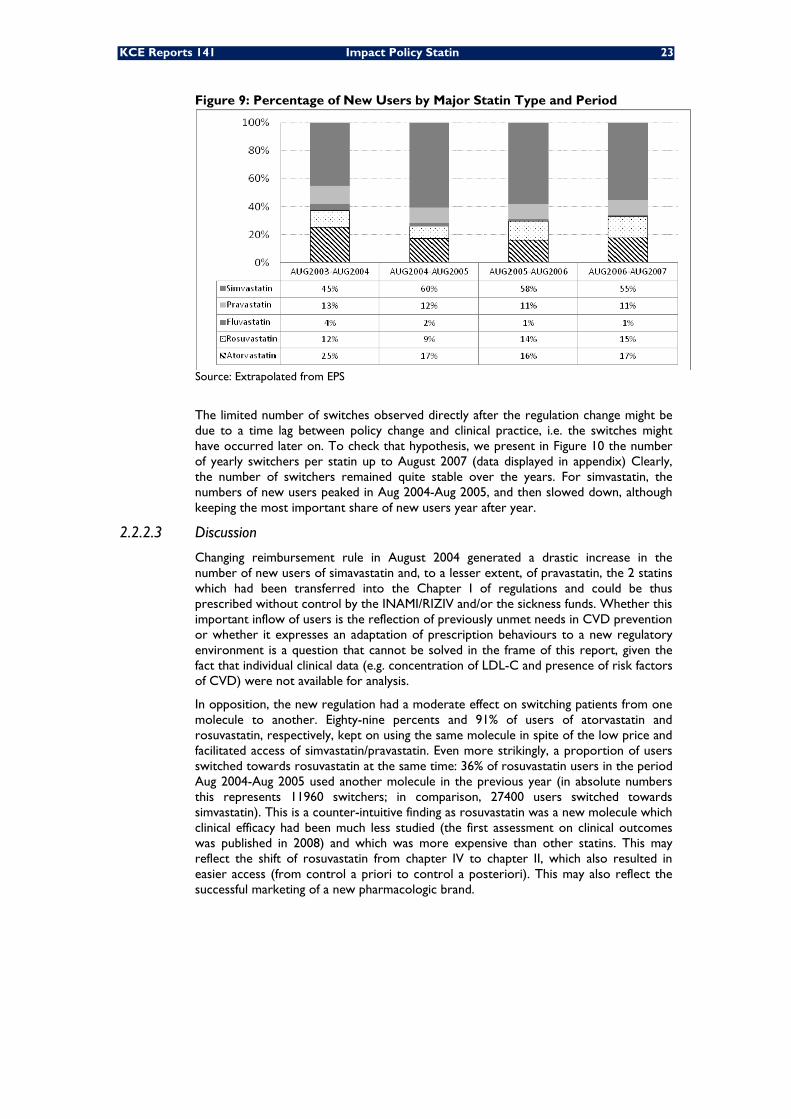
KCE Reports 141 Impact Policy Statin 23
Figure 9: Percentage of New Users by Major Statin Type and Period
Source: Extrapolated from EPS
The limited number of switches observed directly after the regulation change might be due to a time lag between policy change and clinical practice, i.e. the switches might have occurred later on. To check that hypothesis, we present in Figure 10 the number of yearly switchers per statin up to August 2007 (data displayed in appendix) Clearly, the number of switchers remained quite stable over the years. For simvastatin, the numbers of new users peaked in Aug 2004-Aug 2005, and then slowed down, although keeping the most important share of new users year after year.
2.2.2.3 Discussion
Changing reimbursement rule in August 2004 generated a drastic increase in the number of new users of simavastatin and, to a lesser extent, of pravastatin, the 2 statins which had been transferred into the Chapter I of regulations and could be thus prescribed without control by the INAMI/RIZIV and/or the sickness funds. Whether this important inflow of users is the reflection of previously unmet needs in CVD prevention or whether it expresses an adaptation of prescription behaviours to a new regulatory environment is a question that cannot be solved in the frame of this report, given the fact that individual clinical data (e.g. concentration of LDL-C and presence of risk factors of CVD) were not available for analysis.
In opposition, the new regulation had a moderate effect on switching patients from one molecule to another. Eighty-nine percents and 91% of users of atorvastatin and rosuvastatin, respectively, kept on using the same molecule in spite of the low price and facilitated access of simvastatin/pravastatin. Even more strikingly, a proportion of users switched towards rosuvastatin at the same time: 36% of rosuvastatin users in the period Aug 2004-Aug 2005 used another molecule in the previous year (in absolute numbers this represents 11960 switchers; in comparison, 27400 users switched towards simvastatin). This is a counter-intuitive finding as rosuvastatin was a new molecule which clinical efficacy had been much less studied (the first assessment on clinical outcomes was published in 2008) and which was more expensive than other statins. This may reflect the shift of rosuvastatin from chapter IV to chapter II, which also resulted in easier access (from control a priori to control a posteriori). This may also reflect the successful marketing of a new pharmacologic brand.
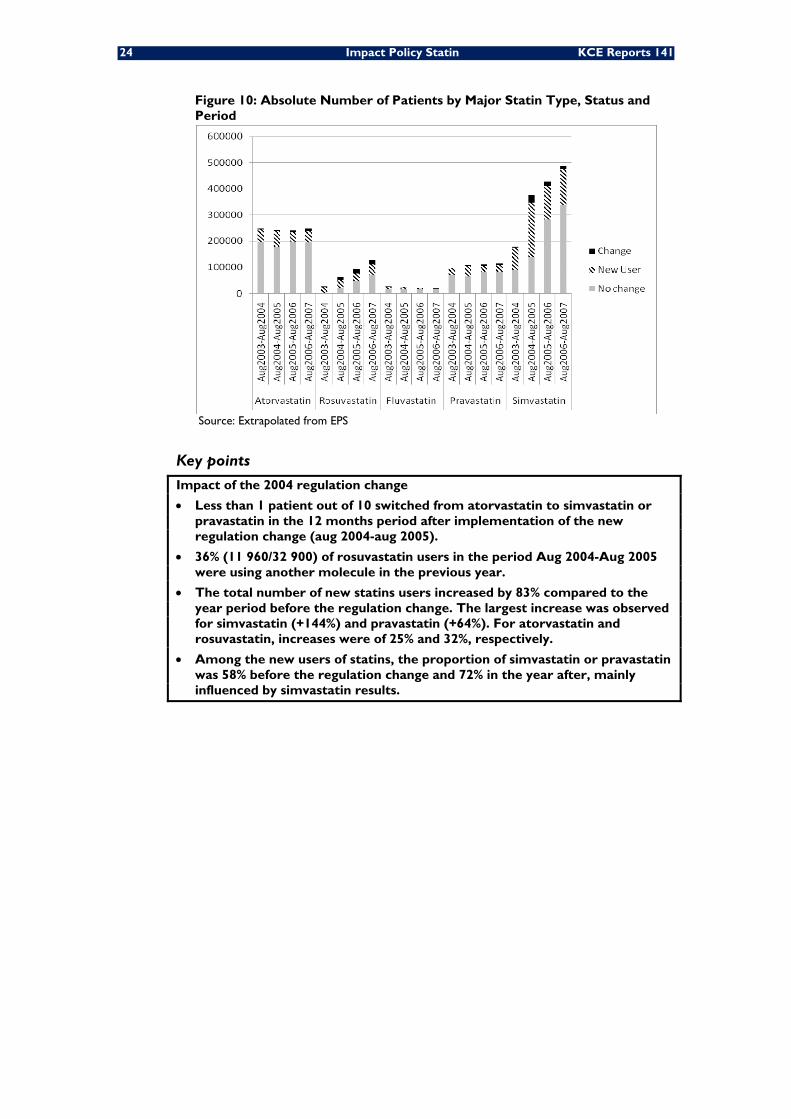
24 Impact Policy Statin KCE Reports 141
Figure 10: Absolute Number of Patients by Major Statin Type, Status and Period
Source: Extrapolated from EPS
Key points
Impact of the 2004 regulation change
• Less than 1 patient out of 10 switched from atorvastatin to simvastatin or pravastatin in the 12 months period after implementation of the new regulation change (aug 2004-aug 2005).
• 36% (11 960/32 900) of rosuvastatin users in the period Aug 2004-Aug 2005 were using another molecule in the previous year.
• The total number of new statins users increased by 83% compared to the year period before the regulation change. The largest increase was observed for simvastatin (+144%) and pravastatin (+64%). For atorvastatin and rosuvastatin, increases were of 25% and 32%, respectively.
• Among the new users of statins, the proportion of simvastatin or pravastatin was 58% before the regulation change and 72% in the year after, mainly influenced by simvastatin results.
KCE Reports 141 Impact Policy Statin 25
2.2.3 Characteristics of new statin users (2003-2006)
This section describes the characteristics of new statin users in the 2003-2006 period: number of patients, reason for starting treatment (for primary or secondary prevention), specialty of treatment initiator, type of treatment and compliance, duration of statin use, factors associated with the discontinuation of treatment, and factors associated with the use of simvastatin or pravastatin (see section 2.1).
The analyses presented in this section are entirely based on new users in ambulatory care during the 2003-2006 period. However, for defining the specialty of the first prescriber, we took into account the fact that some patients started secondary prevention already in hospital. In that case, the treatment was considered to be started by a specialist, even if the first prescription in ambulatory care (after discharge) was made by a GP. The 2002 data were used as a selection filter to identify new users in 2003 (by excluding patients on statin therapy in the 365 previous days). All analyses are based on claims data from Pharmanet (in the EPS), linked to RCM-MKG data to identify hospitalizations for CVE leading to secondary prevention. All results are extrapolated (taking into account the oversampling of ≥65 years old) to the Belgian population except for the survival analyses (see below).
For assessing patient compliance, we made the assumption that every patient would utilize daily1 tablet of the strength specifically prescribed to him/her. This choice was made because exploratory analyses showed that the number of DDDs was not a good measure to assess compliance (results presented in appendix). Logistic regression was used to assess which factors predict good compliance (defined as at least 80% of medication possession ratio (MPR), see Table 2 for the definition of the MPR).
Factors influencing the probability of receiving simvastatin or pravastatin were also analyzed with a logistic regression model.
The duration of statin use was analyzed for the new regular users of year 2003 only (to allow for a 4 years observation period for all users) but excluding the deaths occurring between the estimated end date of statin therapy (last purchase date + number of days covered by the last refill) and an additional 3-months period. The treatment was considered stopped if no other statin delivery was registered within at least a 3-months period after the estimated end date. The duration was assessed as the time between the first delivery of statin in 2003 and the last estimated end date of treatment. As the number of rosuvastatin users in 2003 was marginal, those users were discarded from the analyses of the new regular users 2003. Data were censored in December 2007 as the data were not available afterwards. It has to be noted here that the deaths occurring before the estimated end date of the treatment and an additional 3-months period were not taken into account into the analyses. The Kaplan-Meier curve was used for graphical representation of the duration of statin use. Curves were split by type of statin used at the beginning of the prevention. A Cox proportional hazard regression model was used to analyze the influence of some characteristics on the duration of statin use. The test of proportionality of the hazard was tested and none of the time dependent variables were significant at the 10% level meaning that the proportional hazard assumption was valid. These specific analyses were based on a smaller sample than previous analyses (ie not taking into account the oversampling of the EPS) as analytical techniques for oversampled survival data are not (yet) available in SAS 9.1.
In all analyses, statins are considered as a group, therefore, switches between statins were considered as continuing therapy.
In all regression models mentioned above, the following characteristics were taken into account:
• Age category (<50, 50-59, 60-69, 70-79, 80 and +)
• Sex
• Patient is diabetic (use of anti-diabetic drugs in the year preceding the use of statin)
• Type of prevention (primary, secondary)
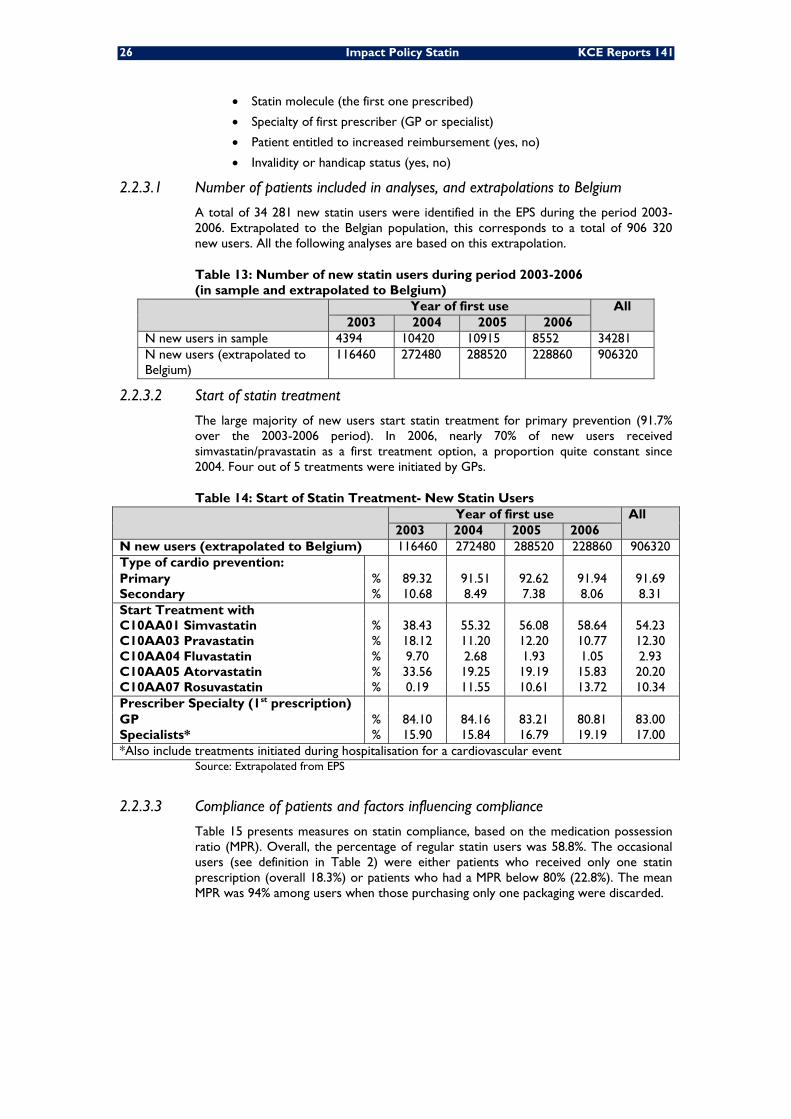
26 Impact Policy Statin KCE Reports 141
• Statin molecule (the first one prescribed)
• Specialty of first prescriber (GP or specialist)
• Patient entitled to increased reimbursement (yes, no)
• Invalidity or handicap status (yes, no)
2.2.3.1 Number of patients included in analyses, and extrapolations to Belgium
A total of 34 281 new statin users were identified in the EPS during the period 2003-2006. Extrapolated to the Belgian population, this corresponds to a total of 906 320 new users. All the following analyses are based on this extrapolation.
Table 13: Number of new statin users during period 2003-2006 (in sample and extrapolated to Belgium)
Year of first use All 2003 2004 2005 2006
N new users in sample 4394 10420 10915 8552 34281 N new users (extrapolated to Belgium)
116460 272480 288520 228860 906320
2.2.3.2 Start of statin treatment
The large majority of new users start statin treatment for primary prevention (91.7% over the 2003-2006 period). In 2006, nearly 70% of new users received simvastatin/pravastatin as a first treatment option, a proportion quite constant since 2004. Four out of 5 treatments were initiated by GPs.
Table 14: Start of Statin Treatment- New Statin Users Year of first use All
2003 2004 2005 2006 N new users (extrapolated to Belgium) 116460 272480 288520 228860 906320 Type of cardio prevention:
89.32 91.51 92.62 91.94 91.69 Primary % Secondary % 10.68 8.49 7.38 8.06 8.31 Start Treatment with
38.43 55.32 56.08 58.64 54.23 C10AA01 Simvastatin % C10AA03 Pravastatin % 18.12 11.20 12.20 10.77 12.30 C10AA04 Fluvastatin % 9.70 2.68 1.93 1.05 2.93 C10AA05 Atorvastatin % 33.56 19.25 19.19 15.83 20.20 C10AA07 Rosuvastatin % 0.19 11.55 10.61 13.72 10.34 Prescriber Specialty (1st prescription)
84.10 84.16 83.21 80.81 83.00 GP % Specialists* % 15.90 15.84 16.79 19.19 17.00 *Also include treatments initiated during hospitalisation for a cardiovascular event
Source: Extrapolated from EPS
2.2.3.3 Compliance of patients and factors influencing compliance
Table 15 presents measures on statin compliance, based on the medication possession ratio (MPR). Overall, the percentage of regular statin users was 58.8%. The occasional users (see definition in Table 2) were either patients who received only one statin prescription (overall 18.3%) or patients who had a MPR below 80% (22.8%). The mean MPR was 94% among users when those purchasing only one packaging were discarded.
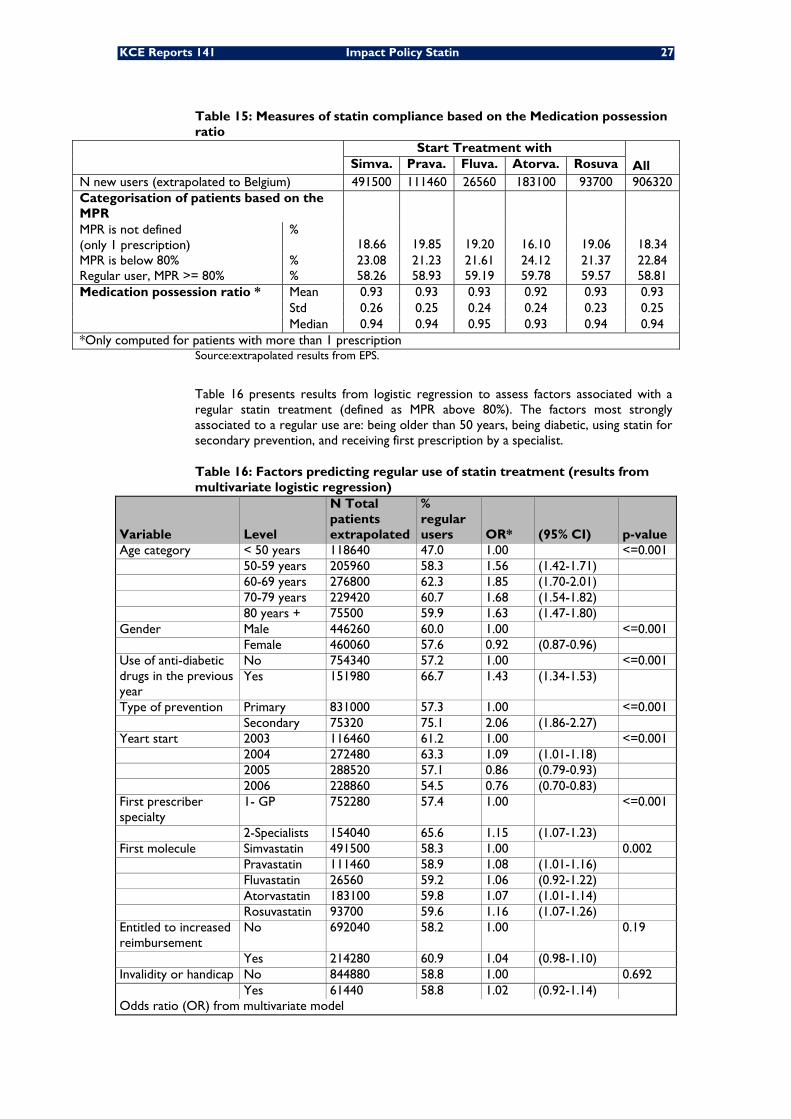
KCE Reports 141 Impact Policy Statin 27
Table 15: Measures of statin compliance based on the Medication possession ratio
Start Treatment with All Simva. Prava. Fluva. Atorva. Rosuva
N new users (extrapolated to Belgium) 491500 111460 26560 183100 93700 906320 Categorisation of patients based on the MPR
18.66
19.85
19.20
16.10
19.06
18.34 MPR is not defined (only 1 prescription)
%
MPR is below 80% % 23.08 21.23 21.61 24.12 21.37 22.84 Regular user, MPR >= 80% % 58.26 58.93 59.19 59.78 59.57 58.81 Medication possession ratio * Mean 0.93 0.93 0.93 0.92 0.93 0.93
Std 0.26 0.25 0.24 0.24 0.23 0.25 Median 0.94 0.94 0.95 0.93 0.94 0.94
*Only computed for patients with more than 1 prescription Source:extrapolated results from EPS.
Table 16 presents results from logistic regression to assess factors associated with a regular statin treatment (defined as MPR above 80%). The factors most strongly associated to a regular use are: being older than 50 years, being diabetic, using statin for secondary prevention, and receiving first prescription by a specialist.
Table 16: Factors predicting regular use of statin treatment (results from multivariate logistic regression)
Variable Level
N Total patients extrapolated
% regular users OR* (95% CI) p-value
Age category < 50 years 118640 47.0 1.00 <=0.001 50-59 years 205960 58.3 1.56 (1.42-1.71) 60-69 years 276800 62.3 1.85 (1.70-2.01) 70-79 years 229420 60.7 1.68 (1.54-1.82) 80 years + 75500 59.9 1.63 (1.47-1.80) Gender Male 446260 60.0 1.00 <=0.001 Female 460060 57.6 0.92 (0.87-0.96) Use of anti-diabetic drugs in the previous year
No 754340 57.2 1.00 <=0.001 Yes 151980 66.7 1.43 (1.34-1.53)
Type of prevention Primary 831000 57.3 1.00 <=0.001 Secondary 75320 75.1 2.06 (1.86-2.27) Yeart start 2003 116460 61.2 1.00 <=0.001 2004 272480 63.3 1.09 (1.01-1.18) 2005 288520 57.1 0.86 (0.79-0.93) 2006 228860 54.5 0.76 (0.70-0.83) First prescriber specialty
1- GP 752280 57.4 1.00 <=0.001
2-Specialists 154040 65.6 1.15 (1.07-1.23) First molecule Simvastatin 491500 58.3 1.00 0.002 Pravastatin 111460 58.9 1.08 (1.01-1.16) Fluvastatin 26560 59.2 1.06 (0.92-1.22) Atorvastatin 183100 59.8 1.07 (1.01-1.14) Rosuvastatin 93700 59.6 1.16 (1.07-1.26) Entitled to increased reimbursement
No 692040 58.2 1.00 0.19
Yes 214280 60.9 1.04 (0.98-1.10) Invalidity or handicap No 844880 58.8 1.00 0.692 Yes 61440 58.8 1.02 (0.92-1.14) Odds ratio (OR) from multivariate model
28 Impact Policy Statin KCE Reports 141
2.2.3.4 Primary and secondary prevention
We analysed the characteristics on new statin users, based on the fact that they started statin therapy for primary prevention (91.7% of the patients during the period 2003-2006) or secondary prevention (8.3% of patients) (Table 17).
Patients starting statin therapy for secondary prevention were 3 years older on average than those starting therapy for primary prevention (66 years old versus 63 years old). They were also treated differently: they received more DDDs (median DDDs during one year: 397 vs 296), and were more compliant with treatment (75% regular users vs 57%). Treatment for secondary prevention was started in ambulatory care by a GP in 34.5% of the cases, versus 87% for primary prevention. Simvastatin/pravastatin represented 78.5% of new treatments in secondary prevention, but only 65.4% of new treatments in primary prevention.
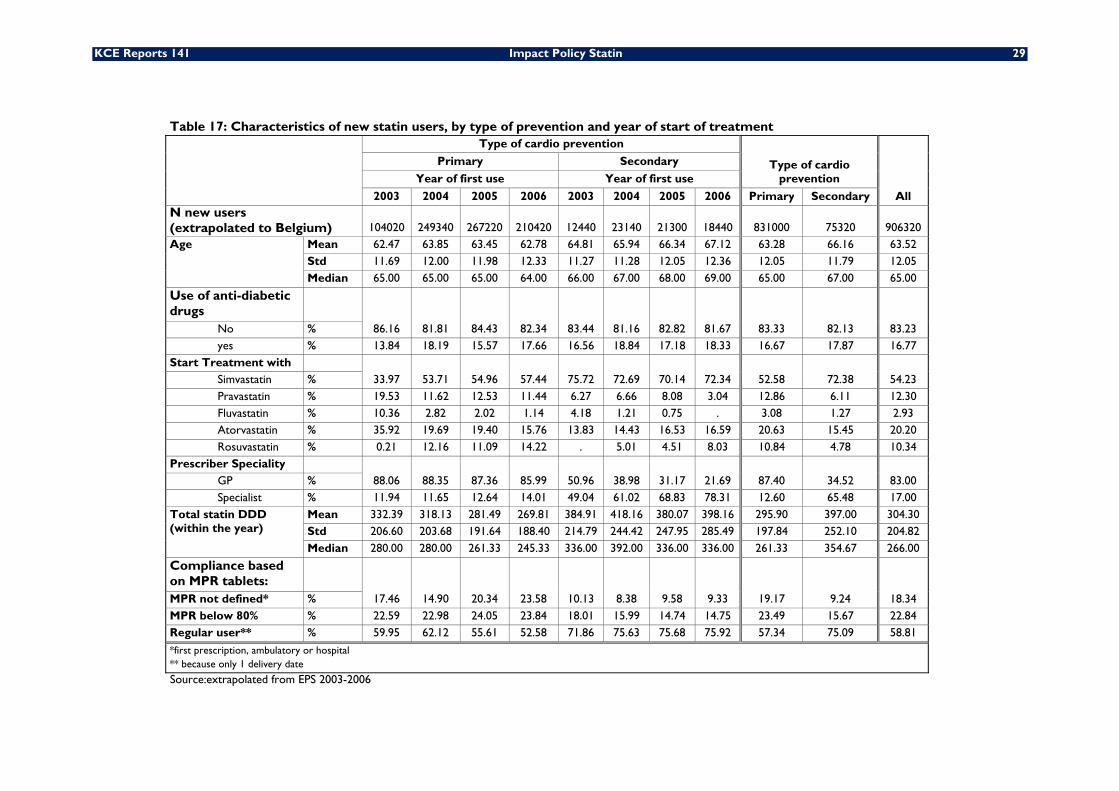
KCE Reports 141 Impact Policy Statin 29
Table 17: Characteristics of new statin users, by type of prevention and year of start of treatment
Type of cardio prevention
Type of cardio prevention
All
Primary Secondary
Year of first use Year of first use
2003 2004 2005 2006 2003 2004 2005 2006 Primary Secondary N new users (extrapolated to Belgium) 104020 249340 267220 210420 12440 23140 21300 18440 831000 75320 906320 Age Mean 62.47 63.85 63.45 62.78 64.81 65.94 66.34 67.12 63.28 66.16 63.52
Std 11.69 12.00 11.98 12.33 11.27 11.28 12.05 12.36 12.05 11.79 12.05 Median 65.00 65.00 65.00 64.00 66.00 67.00 68.00 69.00 65.00 67.00 65.00
Use of anti-diabetic drugs
86.16 81.81 84.43 82.34 83.44 81.16 82.82 81.67 83.33 82.13 83.23 No % yes % 13.84 18.19 15.57 17.66 16.56 18.84 17.18 18.33 16.67 17.87 16.77
Start Treatment with 33.97 53.71 54.96 57.44 75.72 72.69 70.14 72.34 52.58 72.38 54.23 Simvastatin %
Pravastatin % 19.53 11.62 12.53 11.44 6.27 6.66 8.08 3.04 12.86 6.11 12.30 Fluvastatin % 10.36 2.82 2.02 1.14 4.18 1.21 0.75 . 3.08 1.27 2.93 Atorvastatin % 35.92 19.69 19.40 15.76 13.83 14.43 16.53 16.59 20.63 15.45 20.20 Rosuvastatin % 0.21 12.16 11.09 14.22 . 5.01 4.51 8.03 10.84 4.78 10.34
Prescriber Speciality 88.06 88.35 87.36 85.99 50.96 38.98 31.17 21.69 87.40 34.52 83.00 GP %
Specialist % 11.94 11.65 12.64 14.01 49.04 61.02 68.83 78.31 12.60 65.48 17.00 Total statin DDD (within the year)
Mean 332.39 318.13 281.49 269.81 384.91 418.16 380.07 398.16 295.90 397.00 304.30 Std 206.60 203.68 191.64 188.40 214.79 244.42 247.95 285.49 197.84 252.10 204.82 Median 280.00 280.00 261.33 245.33 336.00 392.00 336.00 336.00 261.33 354.67 266.00
Compliance based on MPR tablets:
17.46 14.90 20.34 23.58 10.13 8.38 9.58 9.33 19.17 9.24 18.34 MPR not defined* % MPR below 80% % 22.59 22.98 24.05 23.84 18.01 15.99 14.74 14.75 23.49 15.67 22.84 Regular user** % 59.95 62.12 55.61 52.58 71.86 75.63 75.68 75.92 57.34 75.09 58.81
*first prescription, ambulatory or hospital ** because only 1 delivery date Source:extrapolated from EPS 2003-2006
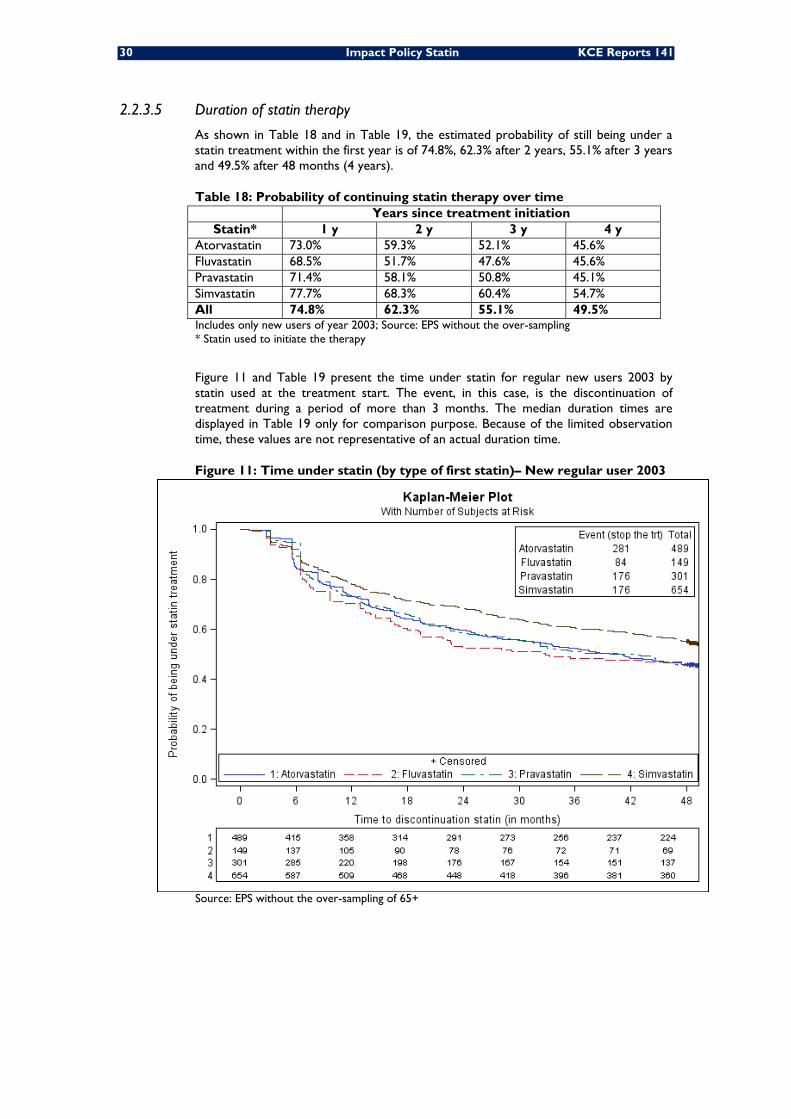
30 Impact Policy Statin KCE Reports 141
2.2.3.5 Duration of statin therapy
As shown in Table 18 and in Table 19, the estimated probability of still being under a statin treatment within the first year is of 74.8%, 62.3% after 2 years, 55.1% after 3 years and 49.5% after 48 months (4 years).
Table 18: Probability of continuing statin therapy over time Years since treatment initiation
Statin* 1 y 2 y 3 y 4 y Atorvastatin 73.0% 59.3% 52.1% 45.6% Fluvastatin 68.5% 51.7% 47.6% 45.6% Pravastatin 71.4% 58.1% 50.8% 45.1% Simvastatin 77.7% 68.3% 60.4% 54.7% All 74.8% 62.3% 55.1% 49.5% Includes only new users of year 2003; Source: EPS without the over-sampling * Statin used to initiate the therapy
Figure 11 and Table 19 present the time under statin for regular new users 2003 by statin used at the treatment start. The event, in this case, is the discontinuation of treatment during a period of more than 3 months. The median duration times are displayed in Table 19 only for comparison purpose. Because of the limited observation time, these values are not representative of an actual duration time.
Figure 11: Time under statin (by type of first statin)– New regular user 2003
Source: EPS without the over-sampling of 65+
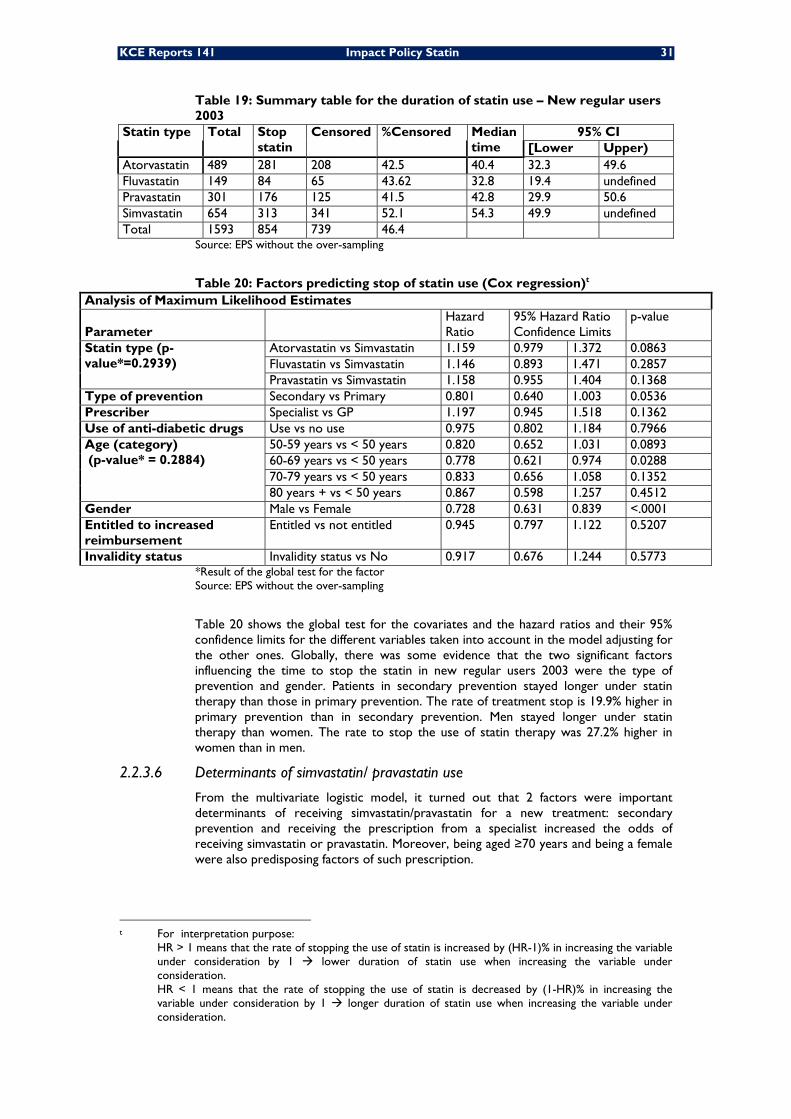
KCE Reports 141 Impact Policy Statin 31
Table 19: Summary table for the duration of statin use – New regular users 2003
Statin type Total Stop statin
Censored %Censored Median time
95% CI [Lower Upper)
Atorvastatin 489 281 208 42.5 40.4 32.3 49.6 Fluvastatin 149 84 65 43.62 32.8 19.4 undefined Pravastatin 301 176 125 41.5 42.8 29.9 50.6 Simvastatin 654 313 341 52.1 54.3 49.9 undefined Total 1593 854 739 46.4
Source: EPS without the over-sampling
Table 20: Factors predicting stop of statin use (Cox regression)t Analysis of Maximum Likelihood Estimates
Parameter Hazard Ratio
95% Hazard Ratio Confidence Limits
p-value
Statin type (p-value*=0.2939)
Atorvastatin vs Simvastatin 1.159 0.979 1.372 0.0863 Fluvastatin vs Simvastatin 1.146 0.893 1.471 0.2857 Pravastatin vs Simvastatin 1.158 0.955 1.404 0.1368
Type of prevention Secondary vs Primary 0.801 0.640 1.003 0.0536 Prescriber Specialist vs GP 1.197 0.945 1.518 0.1362 Use of anti-diabetic drugs Use vs no use 0.975 0.802 1.184 0.7966 Age (category) (p-value* = 0.2884)
50-59 years vs < 50 years 0.820 0.652 1.031 0.0893 60-69 years vs < 50 years 0.778 0.621 0.974 0.0288 70-79 years vs < 50 years 0.833 0.656 1.058 0.1352 80 years + vs < 50 years 0.867 0.598 1.257 0.4512
Gender Male vs Female 0.728 0.631 0.839 <.0001 Entitled to increased reimbursement
Entitled vs not entitled 0.945 0.797 1.122 0.5207
Invalidity status Invalidity status vs No 0.917 0.676 1.244 0.5773 *Result of the global test for the factor Source: EPS without the over-sampling
Table 20 shows the global test for the covariates and the hazard ratios and their 95% confidence limits for the different variables taken into account in the model adjusting for the other ones. Globally, there was some evidence that the two significant factors influencing the time to stop the statin in new regular users 2003 were the type of prevention and gender. Patients in secondary prevention stayed longer under statin therapy than those in primary prevention. The rate of treatment stop is 19.9% higher in primary prevention than in secondary prevention. Men stayed longer under statin therapy than women. The rate to stop the use of statin therapy was 27.2% higher in women than in men.
2.2.3.6 Determinants of simvastatin/ pravastatin use
From the multivariate logistic model, it turned out that 2 factors were important determinants of receiving simvastatin/pravastatin for a new treatment: secondary prevention and receiving the prescription from a specialist increased the odds of receiving simvastatin or pravastatin. Moreover, being aged ≥70 years and being a female were also predisposing factors of such prescription.
t For interpretation purpose: HR > 1 means that the rate of stopping the use of statin is increased by (HR-1)% in increasing the variable
under consideration by 1 lower duration of statin use when increasing the variable under consideration.
HR < 1 means that the rate of stopping the use of statin is decreased by (1-HR)% in increasing the variable under consideration by 1 longer duration of statin use when increasing the variable under consideration.
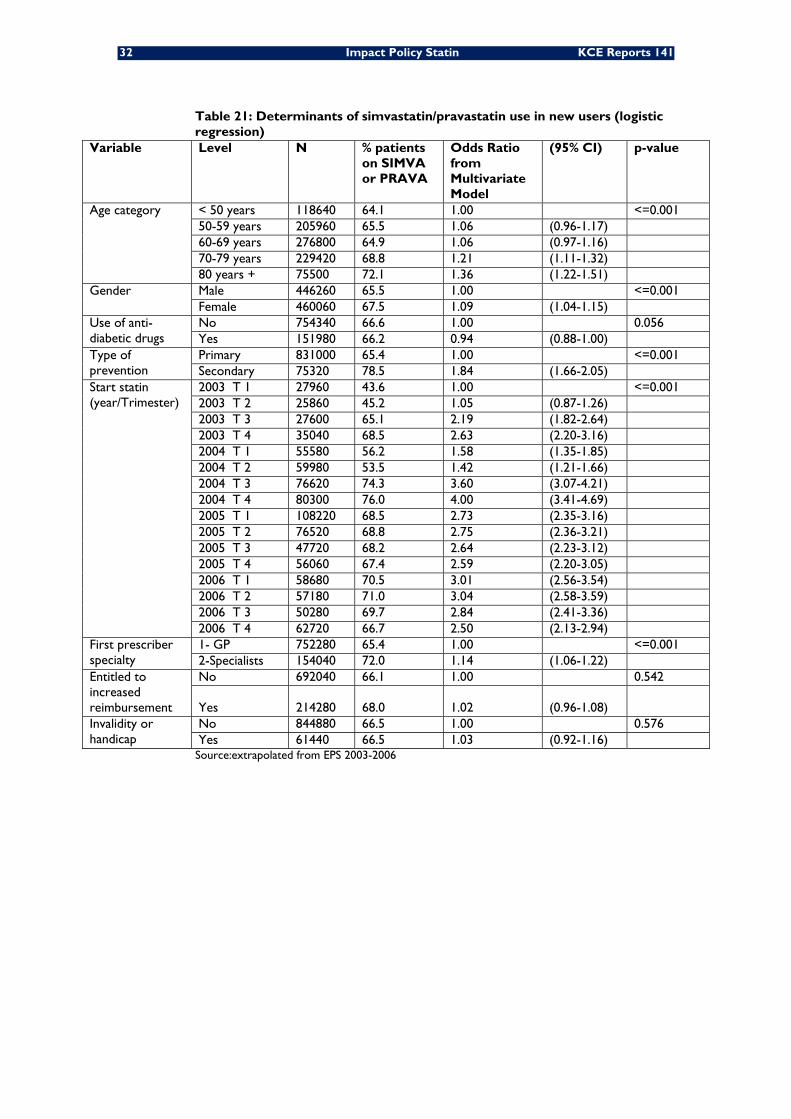
32 Impact Policy Statin KCE Reports 141
Table 21: Determinants of simvastatin/pravastatin use in new users (logistic regression)
Variable Level N % patients on SIMVA or PRAVA
Odds Ratio from Multivariate Model
(95% CI) p-value
Age category < 50 years 118640 64.1 1.00 <=0.001 50-59 years 205960 65.5 1.06 (0.96-1.17) 60-69 years 276800 64.9 1.06 (0.97-1.16) 70-79 years 229420 68.8 1.21 (1.11-1.32) 80 years + 75500 72.1 1.36 (1.22-1.51)
Gender Male 446260 65.5 1.00 <=0.001 Female 460060 67.5 1.09 (1.04-1.15)
Use of anti-diabetic drugs
No 754340 66.6 1.00 0.056 Yes 151980 66.2 0.94 (0.88-1.00)
Type of prevention
Primary 831000 65.4 1.00 <=0.001 Secondary 75320 78.5 1.84 (1.66-2.05)
Start statin (year/Trimester)
2003 T 1 27960 43.6 1.00 <=0.001 2003 T 2 25860 45.2 1.05 (0.87-1.26) 2003 T 3 27600 65.1 2.19 (1.82-2.64) 2003 T 4 35040 68.5 2.63 (2.20-3.16) 2004 T 1 55580 56.2 1.58 (1.35-1.85) 2004 T 2 59980 53.5 1.42 (1.21-1.66) 2004 T 3 76620 74.3 3.60 (3.07-4.21) 2004 T 4 80300 76.0 4.00 (3.41-4.69) 2005 T 1 108220 68.5 2.73 (2.35-3.16) 2005 T 2 76520 68.8 2.75 (2.36-3.21) 2005 T 3 47720 68.2 2.64 (2.23-3.12) 2005 T 4 56060 67.4 2.59 (2.20-3.05) 2006 T 1 58680 70.5 3.01 (2.56-3.54) 2006 T 2 57180 71.0 3.04 (2.58-3.59) 2006 T 3 50280 69.7 2.84 (2.41-3.36) 2006 T 4 62720 66.7 2.50 (2.13-2.94)
First prescriber specialty
1- GP 752280 65.4 1.00 <=0.001 2-Specialists 154040 72.0 1.14 (1.06-1.22)
Entitled to increased reimbursement
No 692040 66.1 1.00 0.542
Yes 214280 68.0 1.02 (0.96-1.08) Invalidity or handicap
No 844880 66.5 1.00 0.576 Yes 61440 66.5 1.03 (0.92-1.16)
Source:extrapolated from EPS 2003-2006
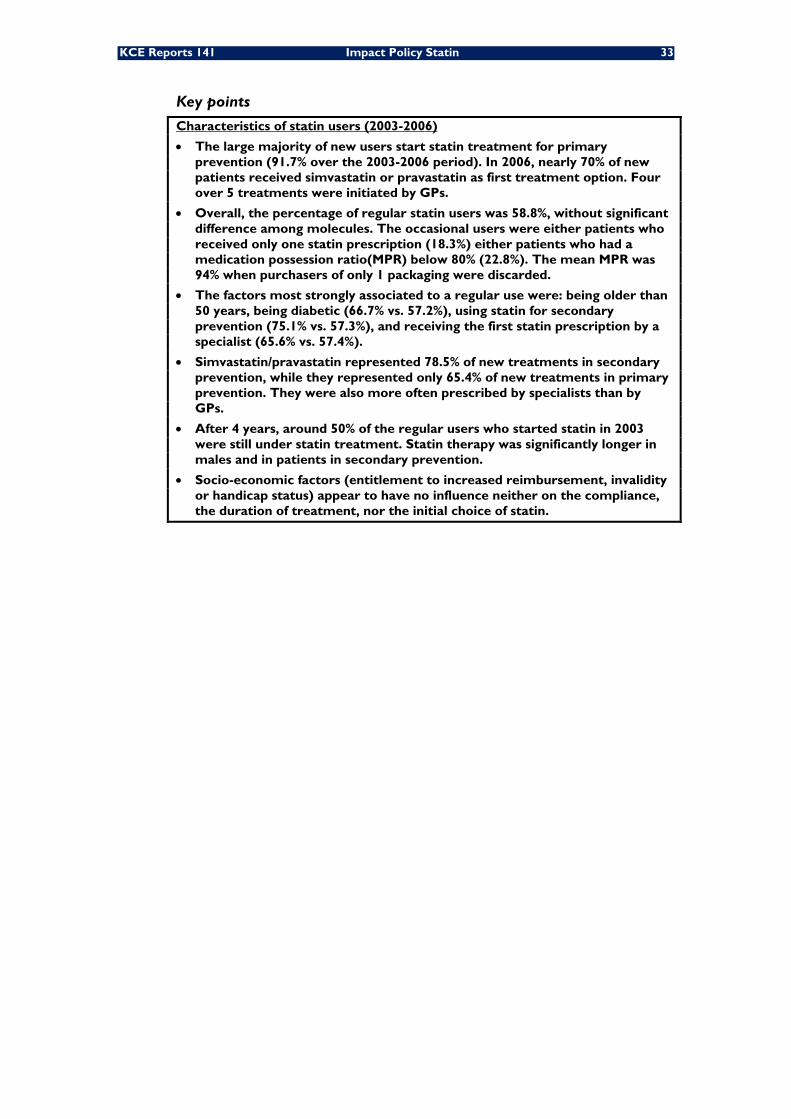
KCE Reports 141 Impact Policy Statin 33
Key points
Characteristics of statin users (2003-2006)
• The large majority of new users start statin treatment for primary prevention (91.7% over the 2003-2006 period). In 2006, nearly 70% of new patients received simvastatin or pravastatin as first treatment option. Four over 5 treatments were initiated by GPs.
• Overall, the percentage of regular statin users was 58.8%, without significant difference among molecules. The occasional users were either patients who received only one statin prescription (18.3%) either patients who had a medication possession ratio(MPR) below 80% (22.8%). The mean MPR was 94% when purchasers of only 1 packaging were discarded.
• The factors most strongly associated to a regular use were: being older than 50 years, being diabetic (66.7% vs. 57.2%), using statin for secondary prevention (75.1% vs. 57.3%), and receiving the first statin prescription by a specialist (65.6% vs. 57.4%).
• Simvastatin/pravastatin represented 78.5% of new treatments in secondary prevention, while they represented only 65.4% of new treatments in primary prevention. They were also more often prescribed by specialists than by GPs.
• After 4 years, around 50% of the regular users who started statin in 2003 were still under statin treatment. Statin therapy was significantly longer in males and in patients in secondary prevention.
• Socio-economic factors (entitlement to increased reimbursement, invalidity or handicap status) appear to have no influence neither on the compliance, the duration of treatment, nor the initial choice of statin.
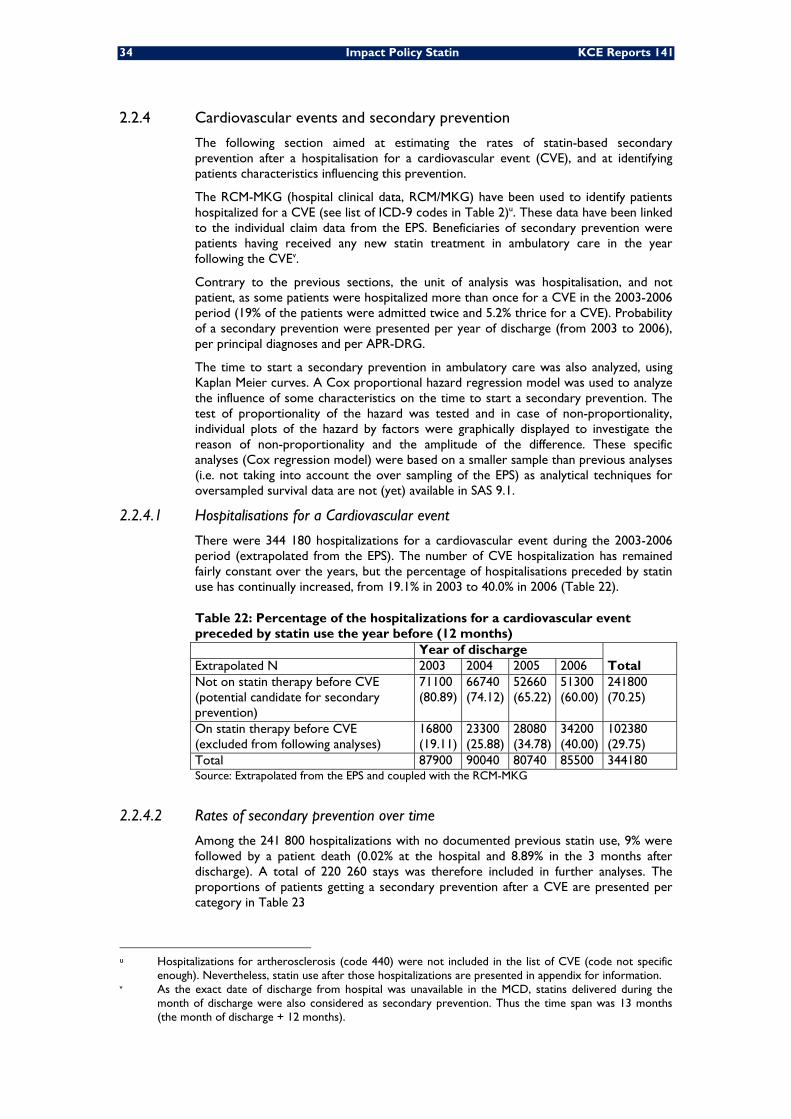
34 Impact Policy Statin KCE Reports 141
2.2.4 Cardiovascular events and secondary prevention
The following section aimed at estimating the rates of statin-based secondary prevention after a hospitalisation for a cardiovascular event (CVE), and at identifying patients characteristics influencing this prevention.
The RCM-MKG (hospital clinical data, RCM/MKG) have been used to identify patients hospitalized for a CVE (see list of ICD-9 codes in Table 2)u. These data have been linked to the individual claim data from the EPS. Beneficiaries of secondary prevention were patients having received any new statin treatment in ambulatory care in the year following the CVEv.
Contrary to the previous sections, the unit of analysis was hospitalisation, and not patient, as some patients were hospitalized more than once for a CVE in the 2003-2006 period (19% of the patients were admitted twice and 5.2% thrice for a CVE). Probability of a secondary prevention were presented per year of discharge (from 2003 to 2006), per principal diagnoses and per APR-DRG.
The time to start a secondary prevention in ambulatory care was also analyzed, using Kaplan Meier curves. A Cox proportional hazard regression model was used to analyze the influence of some characteristics on the time to start a secondary prevention. The test of proportionality of the hazard was tested and in case of non-proportionality, individual plots of the hazard by factors were graphically displayed to investigate the reason of non-proportionality and the amplitude of the difference. These specific analyses (Cox regression model) were based on a smaller sample than previous analyses (i.e. not taking into account the over sampling of the EPS) as analytical techniques for oversampled survival data are not (yet) available in SAS 9.1.
2.2.4.1 Hospitalisations for a Cardiovascular event
There were 344 180 hospitalizations for a cardiovascular event during the 2003-2006 period (extrapolated from the EPS). The number of CVE hospitalization has remained fairly constant over the years, but the percentage of hospitalisations preceded by statin use has continually increased, from 19.1% in 2003 to 40.0% in 2006 (Table 22).
Table 22: Percentage of the hospitalizations for a cardiovascular event preceded by statin use the year before (12 months) Year of discharge
Total Extrapolated N 2003 2004 2005 2006 Not on statin therapy before CVE (potential candidate for secondary prevention)
71100 (80.89)
66740 (74.12)
52660 (65.22)
51300 (60.00)
241800 (70.25)
On statin therapy before CVE (excluded from following analyses)
16800 (19.11)
23300 (25.88)
28080 (34.78)
34200 (40.00)
102380 (29.75)
Total 87900 90040 80740 85500 344180 Source: Extrapolated from the EPS and coupled with the RCM-MKG
2.2.4.2 Rates of secondary prevention over time
Among the 241 800 hospitalizations with no documented previous statin use, 9% were followed by a patient death (0.02% at the hospital and 8.89% in the 3 months after discharge). A total of 220 260 stays was therefore included in further analyses. The proportions of patients getting a secondary prevention after a CVE are presented per category in Table 23
u Hospitalizations for artherosclerosis (code 440) were not included in the list of CVE (code not specific
enough). Nevertheless, statin use after those hospitalizations are presented in appendix for information. v As the exact date of discharge from hospital was unavailable in the MCD, statins delivered during the
month of discharge were also considered as secondary prevention. Thus the time span was 13 months (the month of discharge + 12 months).
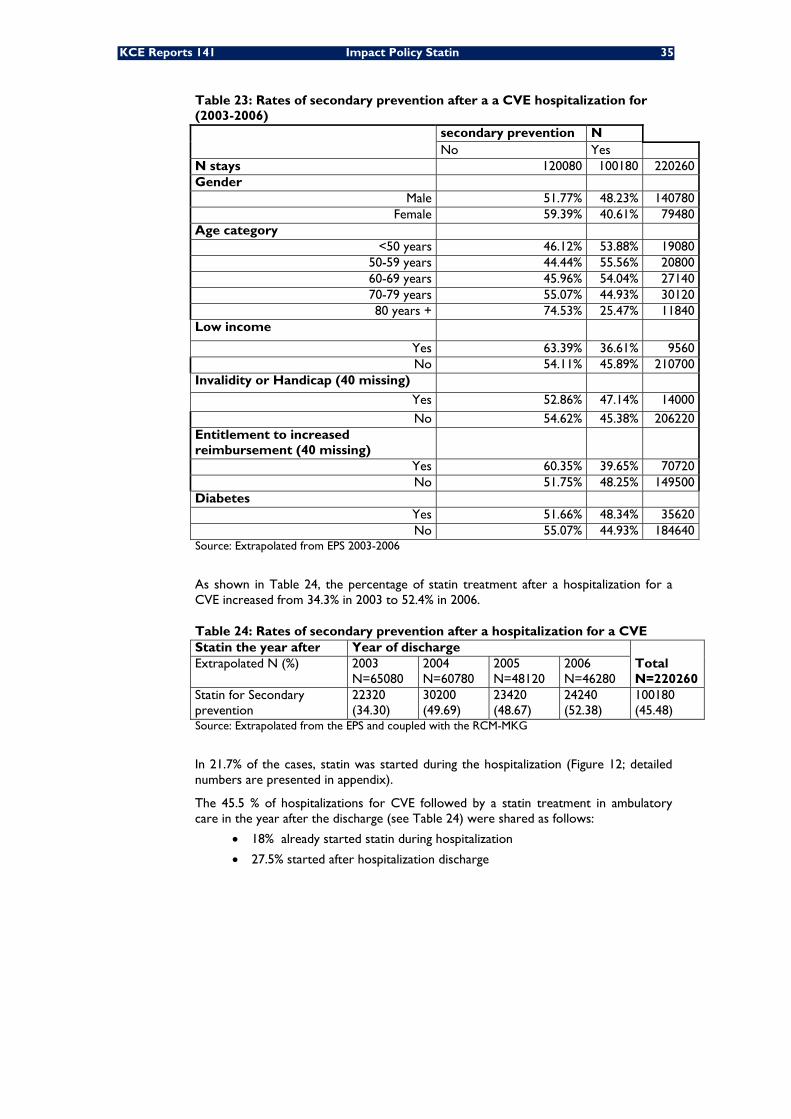
KCE Reports 141 Impact Policy Statin 35
Table 23: Rates of secondary prevention after a a CVE hospitalization for (2003-2006)
secondary prevention N No Yes
N stays 120080 100180 220260 Gender
Male 51.77% 48.23% 140780 Female 59.39% 40.61% 79480
Age category <50 years 46.12% 53.88% 19080
50-59 years 44.44% 55.56% 20800 60-69 years 45.96% 54.04% 27140 70-79 years 55.07% 44.93% 30120 80 years + 74.53% 25.47% 11840
Low income Yes 63.39% 36.61% 9560 No 54.11% 45.89% 210700
Invalidity or Handicap (40 missing) Yes 52.86% 47.14% 14000 No 54.62% 45.38% 206220
Entitlement to increased reimbursement (40 missing)
Yes 60.35% 39.65% 70720 No 51.75% 48.25% 149500
Diabetes Yes 51.66% 48.34% 35620 No 55.07% 44.93% 184640
Source: Extrapolated from EPS 2003-2006
As shown in Table 24, the percentage of statin treatment after a hospitalization for a CVE increased from 34.3% in 2003 to 52.4% in 2006.
Table 24: Rates of secondary prevention after a hospitalization for a CVE Statin the year after Year of discharge
Total N=220260
Extrapolated N (%) 2003 N=65080
2004 N=60780
2005 N=48120
2006 N=46280
Statin for Secondary prevention
22320 (34.30)
30200 (49.69)
23420 (48.67)
24240 (52.38)
100180 (45.48)
Source: Extrapolated from the EPS and coupled with the RCM-MKG
In 21.7% of the cases, statin was started during the hospitalization (Figure 12; detailed numbers are presented in appendix).
The 45.5 % of hospitalizations for CVE followed by a statin treatment in ambulatory care in the year after the discharge (see Table 24) were shared as follows:
• 18% already started statin during hospitalization
• 27.5% started after hospitalization discharge
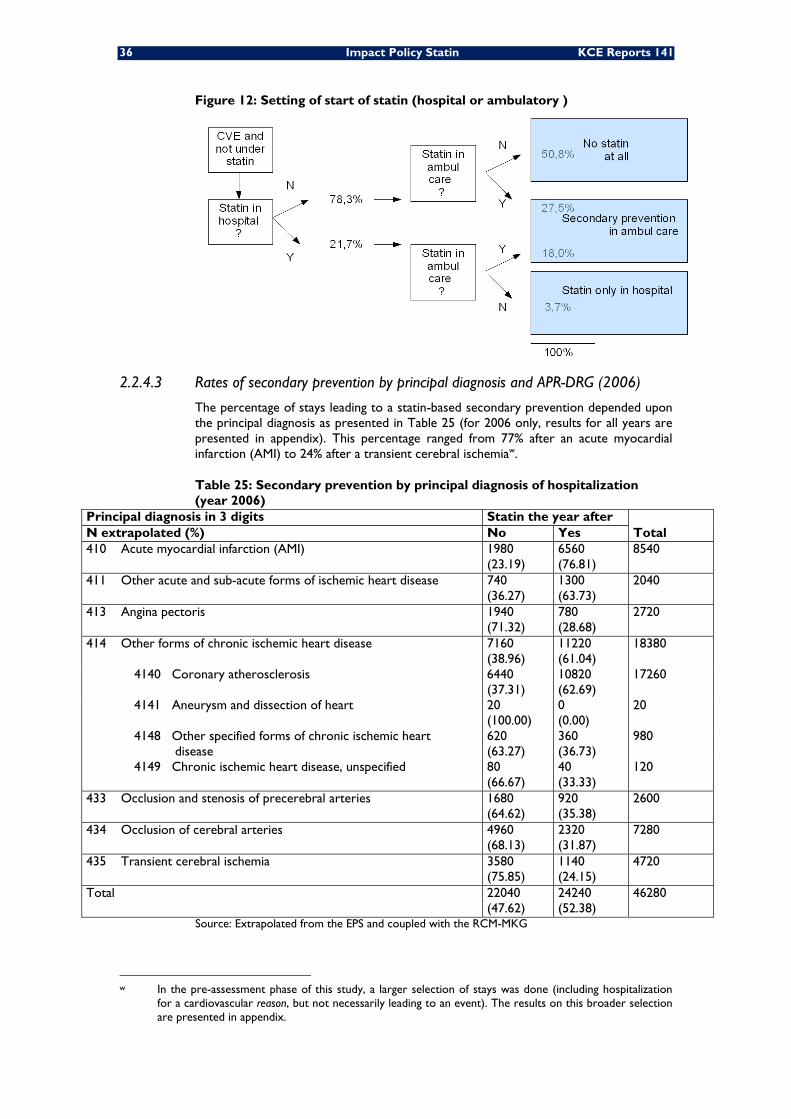
36 Impact Policy Statin KCE Reports 141
Figure 12: Setting of start of statin (hospital or ambulatory )
2.2.4.3 Rates of secondary prevention by principal diagnosis and APR-DRG (2006)
The percentage of stays leading to a statin-based secondary prevention depended upon the principal diagnosis as presented in Table 25 (for 2006 only, results for all years are presented in appendix). This percentage ranged from 77% after an acute myocardial infarction (AMI) to 24% after a transient cerebral ischemiaw.
Table 25: Secondary prevention by principal diagnosis of hospitalization (year 2006)
Principal diagnosis in 3 digits Statin the year after Total N extrapolated (%) No Yes
410 Acute myocardial infarction (AMI) 1980 (23.19)
6560 (76.81)
8540
411 Other acute and sub-acute forms of ischemic heart disease 740 (36.27)
1300 (63.73)
2040
413 Angina pectoris 1940 (71.32)
780 (28.68)
2720
414 Other forms of chronic ischemic heart disease 7160 (38.96)
11220 (61.04)
18380
4140 Coronary atherosclerosis 6440 (37.31)
10820 (62.69)
17260
4141 Aneurysm and dissection of heart 20 (100.00)
0 (0.00)
20
4148 Other specified forms of chronic ischemic heart disease
620 (63.27)
360 (36.73)
980
4149 Chronic ischemic heart disease, unspecified 80 (66.67)
40 (33.33)
120
433 Occlusion and stenosis of precerebral arteries 1680 (64.62)
920 (35.38)
2600
434 Occlusion of cerebral arteries 4960 (68.13)
2320 (31.87)
7280
435 Transient cerebral ischemia 3580 (75.85)
1140 (24.15)
4720
Total 22040 (47.62)
24240 (52.38)
46280
Source: Extrapolated from the EPS and coupled with the RCM-MKG
w In the pre-assessment phase of this study, a larger selection of stays was done (including hospitalization
for a cardiovascular reason, but not necessarily leading to an event). The results on this broader selection are presented in appendix.
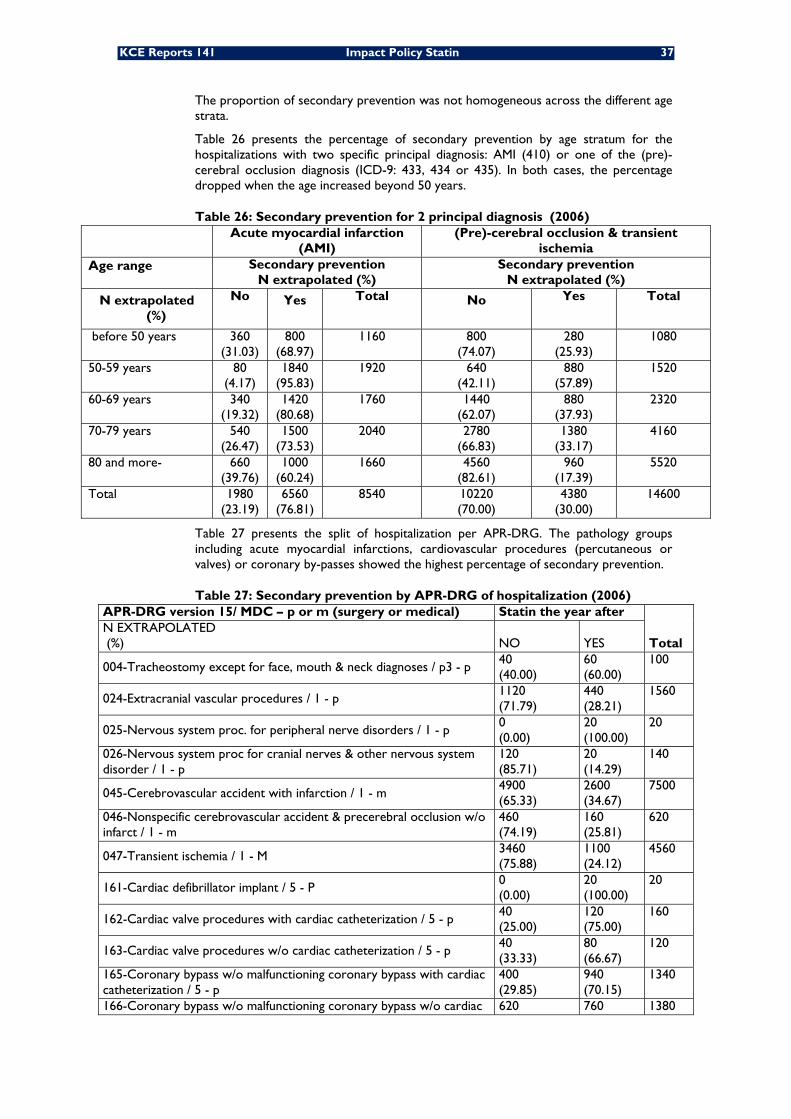
KCE Reports 141 Impact Policy Statin 37
The proportion of secondary prevention was not homogeneous across the different age strata.
Table 26 presents the percentage of secondary prevention by age stratum for the hospitalizations with two specific principal diagnosis: AMI (410) or one of the (pre)-cerebral occlusion diagnosis (ICD-9: 433, 434 or 435). In both cases, the percentage dropped when the age increased beyond 50 years.
Table 26: Secondary prevention for 2 principal diagnosis (2006) Acute myocardial infarction
(AMI) (Pre)-cerebral occlusion & transient
ischemia Age range Secondary prevention
N extrapolated (%) Secondary prevention
N extrapolated (%)
N extrapolated (%)
No Yes Total No Yes Total
before 50 years 360 (31.03)
800 (68.97)
1160
800 (74.07)
280 (25.93)
1080
50-59 years 80 (4.17)
1840 (95.83)
1920
640 (42.11)
880 (57.89)
1520
60-69 years 340 (19.32)
1420 (80.68)
1760
1440 (62.07)
880 (37.93)
2320
70-79 years 540 (26.47)
1500 (73.53)
2040
2780 (66.83)
1380 (33.17)
4160
80 and more- 660 (39.76)
1000 (60.24)
1660
4560 (82.61)
960 (17.39)
5520
Total 1980 (23.19)
6560 (76.81)
8540 10220 (70.00)
4380 (30.00)
14600
Table 27 presents the split of hospitalization per APR-DRG. The pathology groups including acute myocardial infarctions, cardiovascular procedures (percutaneous or valves) or coronary by-passes showed the highest percentage of secondary prevention.
Table 27: Secondary prevention by APR-DRG of hospitalization (2006) APR-DRG version 15/ MDC – p or m (surgery or medical) Statin the year after
Total N EXTRAPOLATED (%) NO YES
004-Tracheostomy except for face, mouth & neck diagnoses / p3 - p 40 (40.00)
60 (60.00)
100
024-Extracranial vascular procedures / 1 - p 1120 (71.79)
440 (28.21)
1560
025-Nervous system proc. for peripheral nerve disorders / 1 - p 0 (0.00)
20 (100.00)
20
026-Nervous system proc for cranial nerves & other nervous system disorder / 1 - p
120 (85.71)
20 (14.29)
140
045-Cerebrovascular accident with infarction / 1 - m 4900 (65.33)
2600 (34.67)
7500
046-Nonspecific cerebrovascular accident & precerebral occlusion w/o infarct / 1 - m
460 (74.19)
160 (25.81)
620
047-Transient ischemia / 1 - M 3460 (75.88)
1100 (24.12)
4560
161-Cardiac defibrillator implant / 5 - P 0 (0.00)
20 (100.00)
20
162-Cardiac valve procedures with cardiac catheterization / 5 - p 40 (25.00)
120 (75.00)
160
163-Cardiac valve procedures w/o cardiac catheterization / 5 - p 40 (33.33)
80 (66.67)
120
165-Coronary bypass w/o malfunctioning coronary bypass with cardiac catheterization / 5 - p
400 (29.85)
940 (70.15)
1340
166-Coronary bypass w/o malfunctioning coronary bypass w/o cardiac 620 760 1380
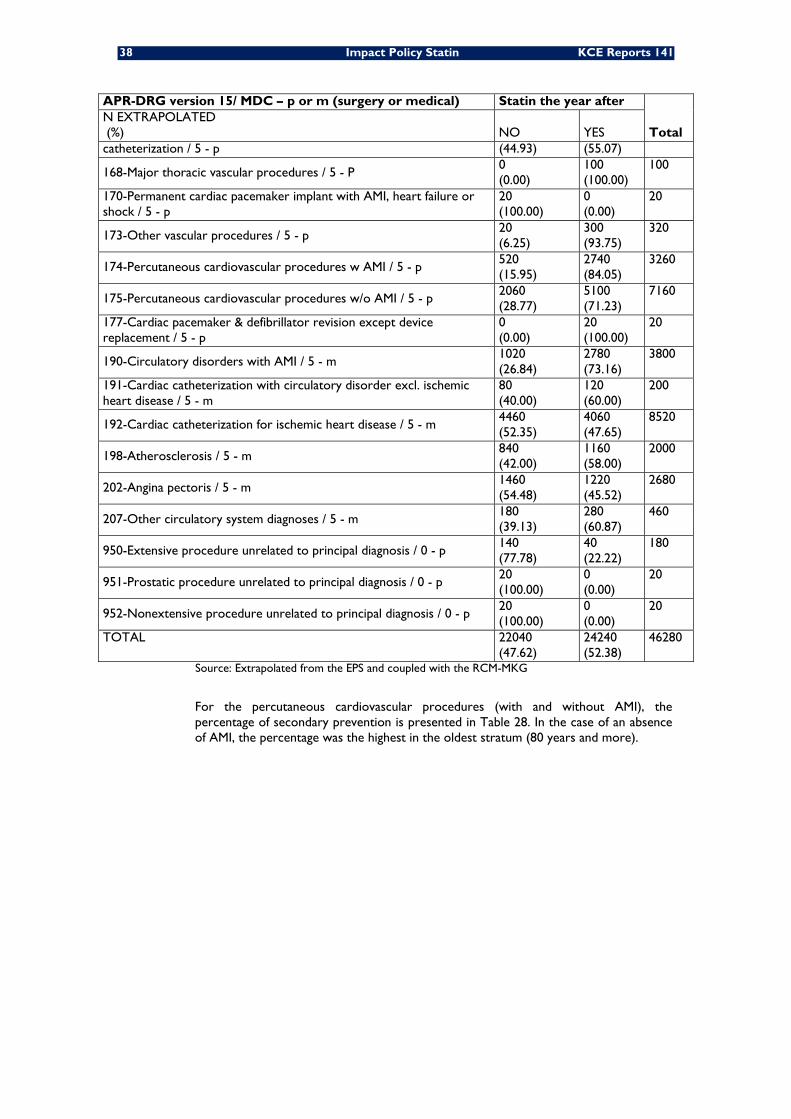
38 Impact Policy Statin KCE Reports 141
APR-DRG version 15/ MDC – p or m (surgery or medical) Statin the year after
Total N EXTRAPOLATED (%) NO YES catheterization / 5 - p (44.93) (55.07)
168-Major thoracic vascular procedures / 5 - P 0 (0.00)
100 (100.00)
100
170-Permanent cardiac pacemaker implant with AMI, heart failure or shock / 5 - p
20 (100.00)
0 (0.00)
20
173-Other vascular procedures / 5 - p 20 (6.25)
300 (93.75)
320
174-Percutaneous cardiovascular procedures w AMI / 5 - p 520 (15.95)
2740 (84.05)
3260
175-Percutaneous cardiovascular procedures w/o AMI / 5 - p 2060 (28.77)
5100 (71.23)
7160
177-Cardiac pacemaker & defibrillator revision except device replacement / 5 - p
0 (0.00)
20 (100.00)
20
190-Circulatory disorders with AMI / 5 - m 1020 (26.84)
2780 (73.16)
3800
191-Cardiac catheterization with circulatory disorder excl. ischemic heart disease / 5 - m
80 (40.00)
120 (60.00)
200
192-Cardiac catheterization for ischemic heart disease / 5 - m 4460 (52.35)
4060 (47.65)
8520
198-Atherosclerosis / 5 - m 840 (42.00)
1160 (58.00)
2000
202-Angina pectoris / 5 - m 1460 (54.48)
1220 (45.52)
2680
207-Other circulatory system diagnoses / 5 - m 180 (39.13)
280 (60.87)
460
950-Extensive procedure unrelated to principal diagnosis / 0 - p 140 (77.78)
40 (22.22)
180
951-Prostatic procedure unrelated to principal diagnosis / 0 - p 20 (100.00)
0 (0.00)
20
952-Nonextensive procedure unrelated to principal diagnosis / 0 - p 20 (100.00)
0 (0.00)
20
TOTAL 22040 (47.62)
24240 (52.38)
46280
Source: Extrapolated from the EPS and coupled with the RCM-MKG
For the percutaneous cardiovascular procedures (with and without AMI), the percentage of secondary prevention is presented in Table 28. In the case of an absence of AMI, the percentage was the highest in the oldest stratum (80 years and more).
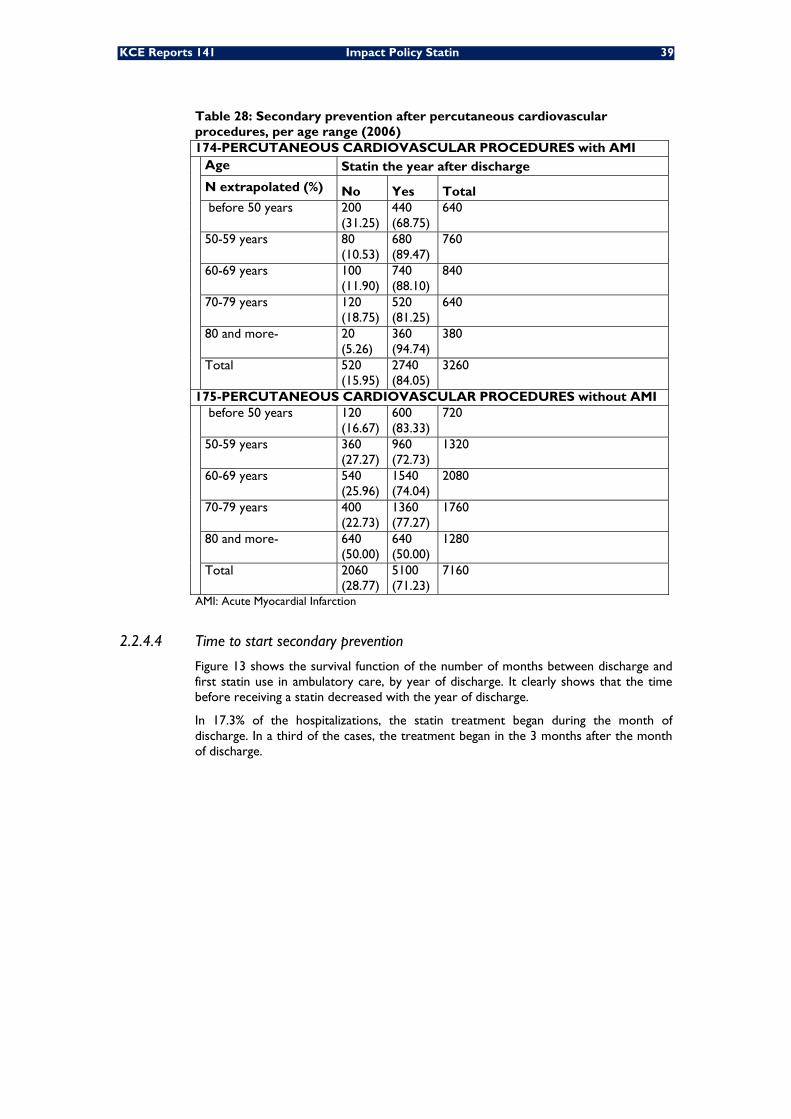
KCE Reports 141 Impact Policy Statin 39
Table 28: Secondary prevention after percutaneous cardiovascular procedures, per age range (2006) 174-PERCUTANEOUS CARDIOVASCULAR PROCEDURES with AMI Age Statin the year after discharge
N extrapolated (%) No Yes Total before 50 years 200
(31.25) 440 (68.75)
640
50-59 years 80 (10.53)
680 (89.47)
760
60-69 years 100 (11.90)
740 (88.10)
840
70-79 years 120 (18.75)
520 (81.25)
640
80 and more- 20 (5.26)
360 (94.74)
380
Total 520 (15.95)
2740 (84.05)
3260
175-PERCUTANEOUS CARDIOVASCULAR PROCEDURES without AMI before 50 years 120
(16.67) 600 (83.33)
720
50-59 years 360 (27.27)
960 (72.73)
1320
60-69 years 540 (25.96)
1540 (74.04)
2080
70-79 years 400 (22.73)
1360 (77.27)
1760
80 and more- 640 (50.00)
640 (50.00)
1280
Total 2060 (28.77)
5100 (71.23)
7160
AMI: Acute Myocardial Infarction
2.2.4.4 Time to start secondary prevention
Figure 13 shows the survival function of the number of months between discharge and first statin use in ambulatory care, by year of discharge. It clearly shows that the time before receiving a statin decreased with the year of discharge.
In 17.3% of the hospitalizations, the statin treatment began during the month of discharge. In a third of the cases, the treatment began in the 3 months after the month of discharge.
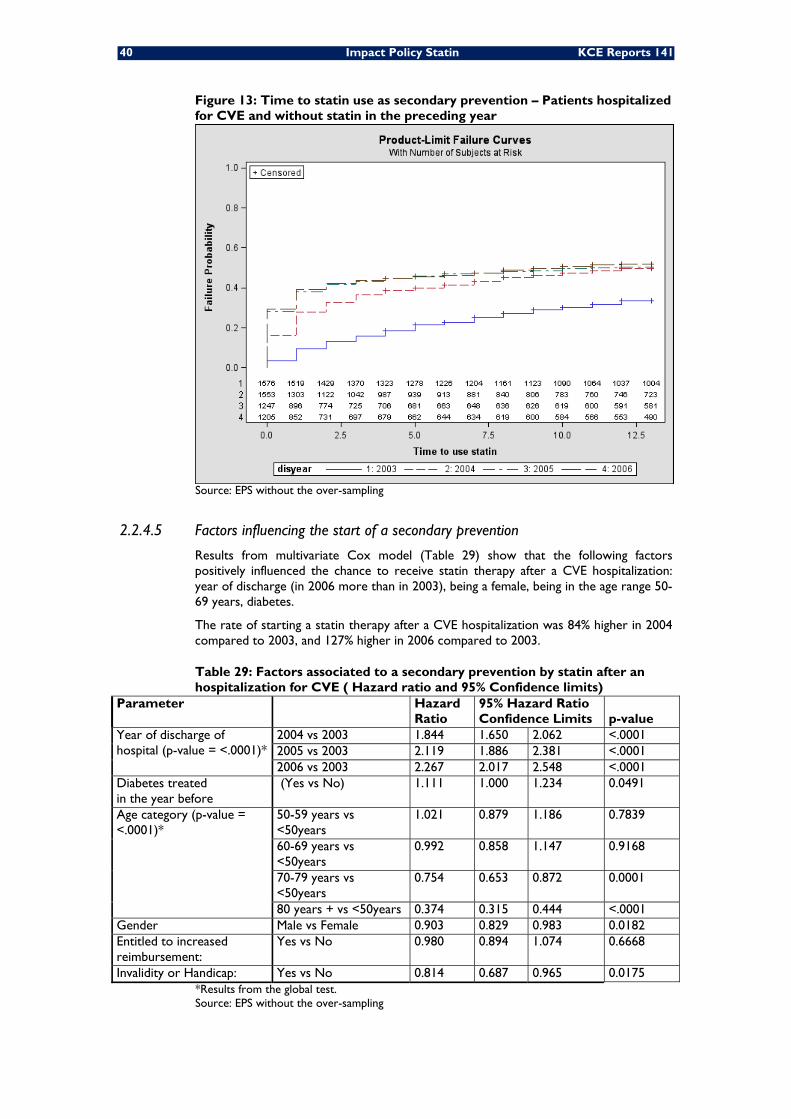
40 Impact Policy Statin KCE Reports 141
Figure 13: Time to statin use as secondary prevention – Patients hospitalized for CVE and without statin in the preceding year
Source: EPS without the over-sampling
2.2.4.5 Factors influencing the start of a secondary prevention
Results from multivariate Cox model (Table 29) show that the following factors positively influenced the chance to receive statin therapy after a CVE hospitalization: year of discharge (in 2006 more than in 2003), being a female, being in the age range 50-69 years, diabetes.
The rate of starting a statin therapy after a CVE hospitalization was 84% higher in 2004 compared to 2003, and 127% higher in 2006 compared to 2003.
Table 29: Factors associated to a secondary prevention by statin after an hospitalization for CVE ( Hazard ratio and 95% Confidence limits)
Parameter
Hazard Ratio
95% Hazard Ratio Confidence Limits p-value
Year of discharge of hospital (p-value = <.0001)*
2004 vs 2003 1.844 1.650 2.062 <.0001 2005 vs 2003 2.119 1.886 2.381 <.0001 2006 vs 2003 2.267 2.017 2.548 <.0001
Diabetes treated in the year before
(Yes vs No) 1.111 1.000 1.234 0.0491
Age category (p-value = <.0001)*
50-59 years vs <50years
1.021 0.879 1.186 0.7839
60-69 years vs <50years
0.992 0.858 1.147 0.9168
70-79 years vs <50years
0.754 0.653 0.872 0.0001
80 years + vs <50years 0.374 0.315 0.444 <.0001 Gender Male vs Female 0.903 0.829 0.983 0.0182 Entitled to increased reimbursement:
Yes vs No 0.980 0.894 1.074 0.6668
Invalidity or Handicap: Yes vs No 0.814 0.687 0.965 0.0175 *Results from the global test. Source: EPS without the over-sampling
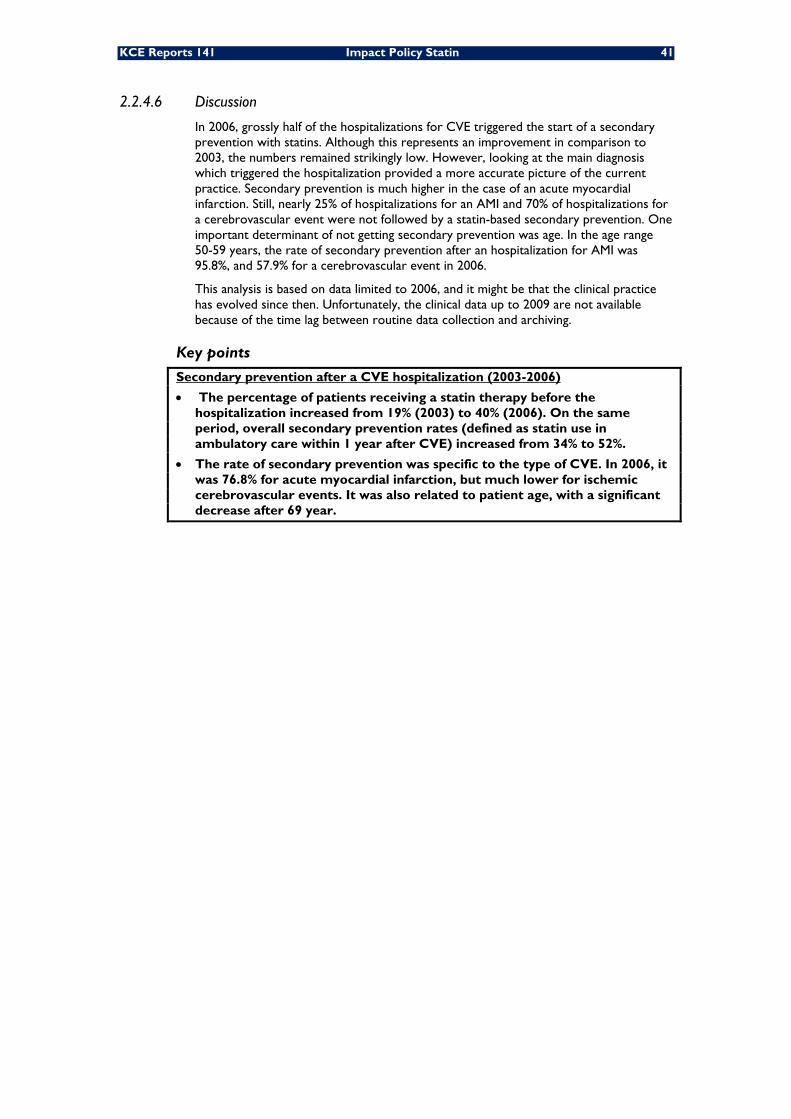
KCE Reports 141 Impact Policy Statin 41
2.2.4.6 Discussion
In 2006, grossly half of the hospitalizations for CVE triggered the start of a secondary prevention with statins. Although this represents an improvement in comparison to 2003, the numbers remained strikingly low. However, looking at the main diagnosis which triggered the hospitalization provided a more accurate picture of the current practice. Secondary prevention is much higher in the case of an acute myocardial infarction. Still, nearly 25% of hospitalizations for an AMI and 70% of hospitalizations for a cerebrovascular event were not followed by a statin-based secondary prevention. One important determinant of not getting secondary prevention was age. In the age range 50-59 years, the rate of secondary prevention after an hospitalization for AMI was 95.8%, and 57.9% for a cerebrovascular event in 2006.
This analysis is based on data limited to 2006, and it might be that the clinical practice has evolved since then. Unfortunately, the clinical data up to 2009 are not available because of the time lag between routine data collection and archiving.
Key points
Secondary prevention after a CVE hospitalization (2003-2006)
• The percentage of patients receiving a statin therapy before the hospitalization increased from 19% (2003) to 40% (2006). On the same period, overall secondary prevention rates (defined as statin use in ambulatory care within 1 year after CVE) increased from 34% to 52%.
• The rate of secondary prevention was specific to the type of CVE. In 2006, it was 76.8% for acute myocardial infarction, but much lower for ischemic cerebrovascular events. It was also related to patient age, with a significant decrease after 69 year.
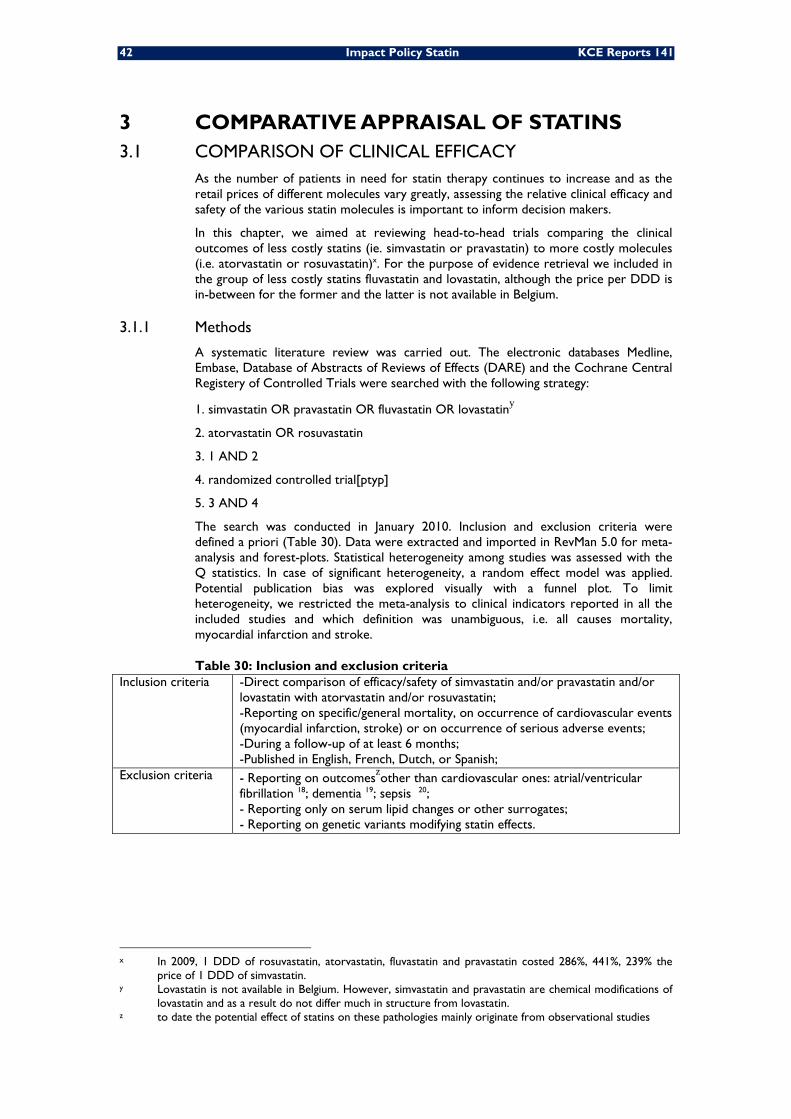
42 Impact Policy Statin KCE Reports 141
3 COMPARATIVE APPRAISAL OF STATINS 3.1 COMPARISON OF CLINICAL EFFICACY
As the number of patients in need for statin therapy continues to increase and as the retail prices of different molecules vary greatly, assessing the relative clinical efficacy and safety of the various statin molecules is important to inform decision makers.
In this chapter, we aimed at reviewing head-to-head trials comparing the clinical outcomes of less costly statins (ie. simvastatin or pravastatin) to more costly molecules (i.e. atorvastatin or rosuvastatin)x. For the purpose of evidence retrieval we included in the group of less costly statins fluvastatin and lovastatin, although the price per DDD is in-between for the former and the latter is not available in Belgium.
3.1.1 Methods
A systematic literature review was carried out. The electronic databases Medline, Embase, Database of Abstracts of Reviews of Effects (DARE) and the Cochrane Central Registery of Controlled Trials were searched with the following strategy:
1. simvastatin OR pravastatin OR fluvastatin OR lovastatiny
2. atorvastatin OR rosuvastatin
3. 1 AND 2
4. randomized controlled trial[ptyp]
5. 3 AND 4
The search was conducted in January 2010. Inclusion and exclusion criteria were defined a priori (Table 30). Data were extracted and imported in RevMan 5.0 for meta-analysis and forest-plots. Statistical heterogeneity among studies was assessed with the Q statistics. In case of significant heterogeneity, a random effect model was applied. Potential publication bias was explored visually with a funnel plot. To limit heterogeneity, we restricted the meta-analysis to clinical indicators reported in all the included studies and which definition was unambiguous, i.e. all causes mortality, myocardial infarction and stroke.
Table 30: Inclusion and exclusion criteria Inclusion criteria -Direct comparison of efficacy/safety of simvastatin and/or pravastatin and/or
lovastatin with atorvastatin and/or rosuvastatin; -Reporting on specific/general mortality, on occurrence of cardiovascular events (myocardial infarction, stroke) or on occurrence of serious adverse events; -During a follow-up of at least 6 months; -Published in English, French, Dutch, or Spanish;
Exclusion criteria - Reporting on outcomeszother than cardiovascular ones: atrial/ventricular fibrillation 18; dementia 19; sepsis 20; - Reporting only on serum lipid changes or other surrogates; - Reporting on genetic variants modifying statin effects.
x In 2009, 1 DDD of rosuvastatin, atorvastatin, fluvastatin and pravastatin costed 286%, 441%, 239% the
price of 1 DDD of simvastatin. y Lovastatin is not available in Belgium. However, simvastatin and pravastatin are chemical modifications of
lovastatin and as a result do not differ much in structure from lovastatin. z to date the potential effect of statins on these pathologies mainly originate from observational studies
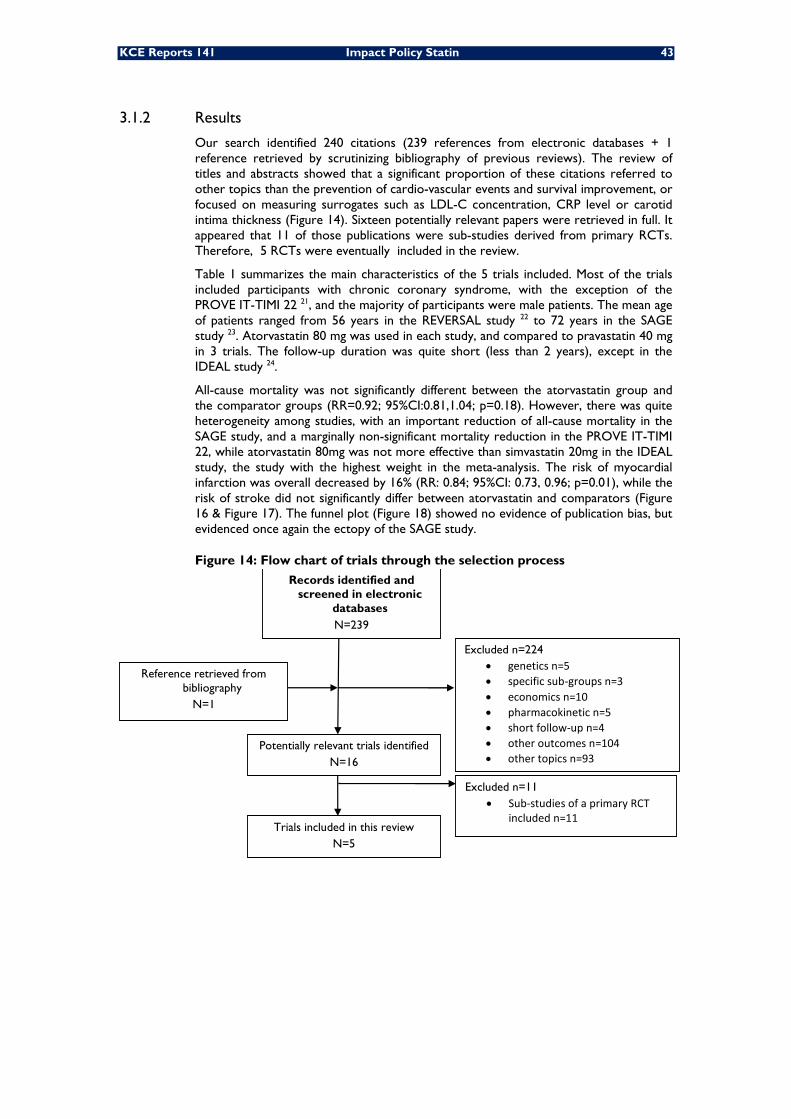
KCE Reports 141 Impact Policy Statin 43
3.1.2 Results
Our search identified 240 citations (239 references from electronic databases + 1 reference retrieved by scrutinizing bibliography of previous reviews). The review of titles and abstracts showed that a significant proportion of these citations referred to other topics than the prevention of cardio-vascular events and survival improvement, or focused on measuring surrogates such as LDL-C concentration, CRP level or carotid intima thickness (Figure 14). Sixteen potentially relevant papers were retrieved in full. It appeared that 11 of those publications were sub-studies derived from primary RCTs. Therefore, 5 RCTs were eventually included in the review.
Table 1 summarizes the main characteristics of the 5 trials included. Most of the trials included participants with chronic coronary syndrome, with the exception of the PROVE IT-TIMI 22 21, and the majority of participants were male patients. The mean age of patients ranged from 56 years in the REVERSAL study 22 to 72 years in the SAGE study 23. Atorvastatin 80 mg was used in each study, and compared to pravastatin 40 mg in 3 trials. The follow-up duration was quite short (less than 2 years), except in the IDEAL study 24.
All-cause mortality was not significantly different between the atorvastatin group and the comparator groups (RR=0.92; 95%CI:0.81,1.04; p=0.18). However, there was quite heterogeneity among studies, with an important reduction of all-cause mortality in the SAGE study, and a marginally non-significant mortality reduction in the PROVE IT-TIMI 22, while atorvastatin 80mg was not more effective than simvastatin 20mg in the IDEAL study, the study with the highest weight in the meta-analysis. The risk of myocardial infarction was overall decreased by 16% (RR: 0.84; 95%CI: 0.73, 0.96; p=0.01), while the risk of stroke did not significantly differ between atorvastatin and comparators (Figure 16 & Figure 17). The funnel plot (Figure 18) showed no evidence of publication bias, but evidenced once again the ectopy of the SAGE study.
Figure 14: Flow chart of trials through the selection process
Excluded n=224 • genetics n=5 • specific sub‐groups n=3 • economics n=10 • pharmacokinetic n=5 • short follow‐up n=4 • other outcomes n=104 • other topics n=93
Reference retrieved from bibliography
N=1
Potentially relevant trials identified N=16
Excluded n=11 • Sub‐studies of a primary RCT
included n=11 Trials included in this review
N=5
Records identified and screened in electronic
databases N=239
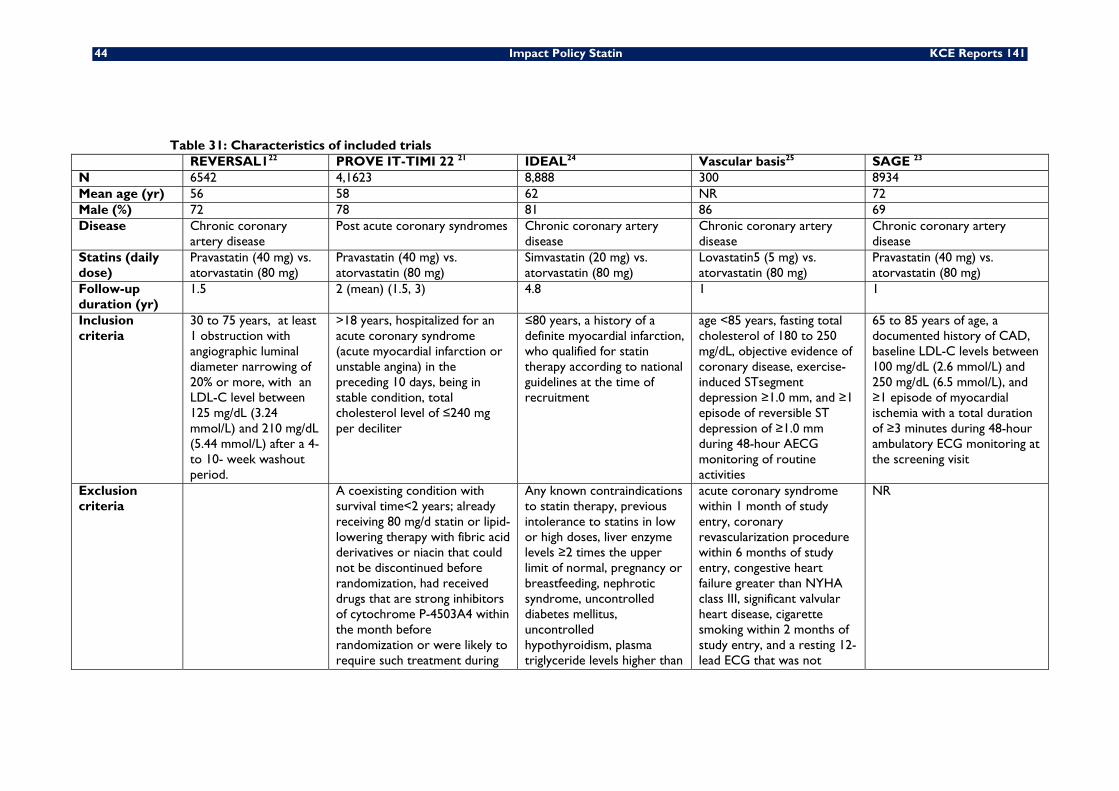
44 Impact Policy Statin KCE Reports 141
Table 31: Characteristics of included trials REVERSAL122 PROVE IT-TIMI 22 21 IDEAL24 Vascular basis25 SAGE 23 N 6542 4,1623 8,888 300 8934 Mean age (yr) 56 58 62 NR 72 Male (%) 72 78 81 86 69 Disease Chronic coronary
artery disease Post acute coronary syndromes Chronic coronary artery
disease Chronic coronary artery disease
Chronic coronary artery disease
Statins (daily dose)
Pravastatin (40 mg) vs. atorvastatin (80 mg)
Pravastatin (40 mg) vs. atorvastatin (80 mg)
Simvastatin (20 mg) vs. atorvastatin (80 mg)
Lovastatin5 (5 mg) vs. atorvastatin (80 mg)
Pravastatin (40 mg) vs. atorvastatin (80 mg)
Follow-up duration (yr)
1.5 2 (mean) (1.5, 3) 4.8 1 1
Inclusion criteria
30 to 75 years, at least 1 obstruction with angiographic luminal diameter narrowing of 20% or more, with an LDL-C level between 125 mg/dL (3.24 mmol/L) and 210 mg/dL (5.44 mmol/L) after a 4- to 10- week washout period.
>18 years, hospitalized for an acute coronary syndrome (acute myocardial infarction or unstable angina) in the preceding 10 days, being in stable condition, total cholesterol level of ≤240 mg per deciliter
≤80 years, a history of a definite myocardial infarction, who qualified for statin therapy according to national guidelines at the time of recruitment
age <85 years, fasting total cholesterol of 180 to 250 mg/dL, objective evidence of coronary disease, exercise-induced STsegment depression ≥1.0 mm, and ≥1 episode of reversible ST depression of ≥1.0 mm during 48-hour AECG monitoring of routine activities
65 to 85 years of age, a documented history of CAD, baseline LDL-C levels between 100 mg/dL (2.6 mmol/L) and 250 mg/dL (6.5 mmol/L), and ≥1 episode of myocardial ischemia with a total duration of ≥3 minutes during 48-hour ambulatory ECG monitoring at the screening visit
Exclusion criteria
A coexisting condition with survival time<2 years; already receiving 80 mg/d statin or lipid-lowering therapy with fibric acid derivatives or niacin that could not be discontinued before randomization, had received drugs that are strong inhibitors of cytochrome P-4503A4 within the month before randomization or were likely to require such treatment during
Any known contraindications to statin therapy, previous intolerance to statins in low or high doses, liver enzyme levels ≥2 times the upper limit of normal, pregnancy or breastfeeding, nephrotic syndrome, uncontrolled diabetes mellitus, uncontrolled hypothyroidism, plasma triglyceride levels higher than
acute coronary syndrome within 1 month of study entry, coronary revascularization procedure within 6 months of study entry, congestive heart failure greater than NYHA class III, significant valvular heart disease, cigarette smoking within 2 months of study entry, and a resting 12-lead ECG that was not
NR
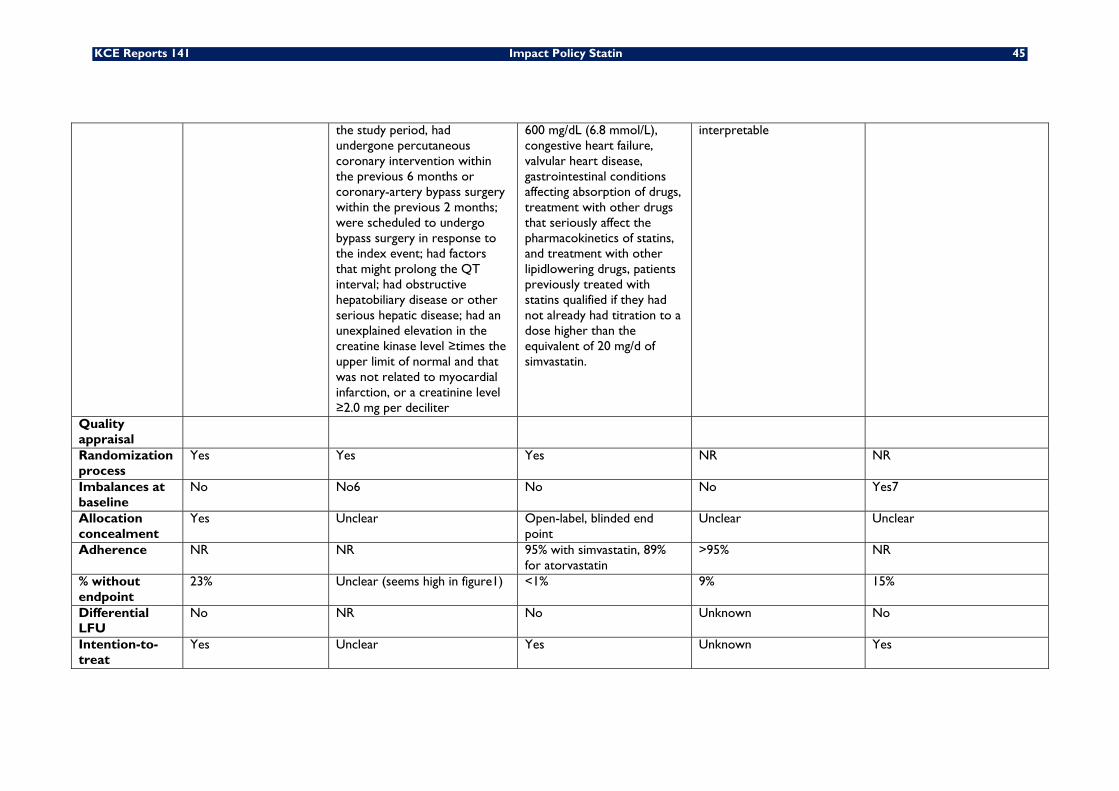
KCE Reports 141 Impact Policy Statin 45
the study period, had undergone percutaneous coronary intervention within the previous 6 months or coronary-artery bypass surgery within the previous 2 months; were scheduled to undergo bypass surgery in response to the index event; had factors that might prolong the QT interval; had obstructive hepatobiliary disease or other serious hepatic disease; had an unexplained elevation in the creatine kinase level ≥times the upper limit of normal and that was not related to myocardial infarction, or a creatinine level ≥2.0 mg per deciliter
600 mg/dL (6.8 mmol/L), congestive heart failure, valvular heart disease, gastrointestinal conditions affecting absorption of drugs, treatment with other drugs that seriously affect the pharmacokinetics of statins, and treatment with other lipidlowering drugs, patients previously treated with statins qualified if they had not already had titration to a dose higher than the equivalent of 20 mg/d of simvastatin.
interpretable
Quality appraisal
Randomization process
Yes Yes Yes NR NR
Imbalances at baseline
No No6 No No Yes7
Allocation concealment
Yes Unclear Open-label, blinded end point
Unclear Unclear
Adherence NR NR 95% with simvastatin, 89% for atorvastatin
>95% NR
% without endpoint
23% Unclear (seems high in figure1) <1% 9% 15%
Differential LFU
No NR No Unknown No
Intention-to-treat
Yes Unclear Yes Unknown Yes
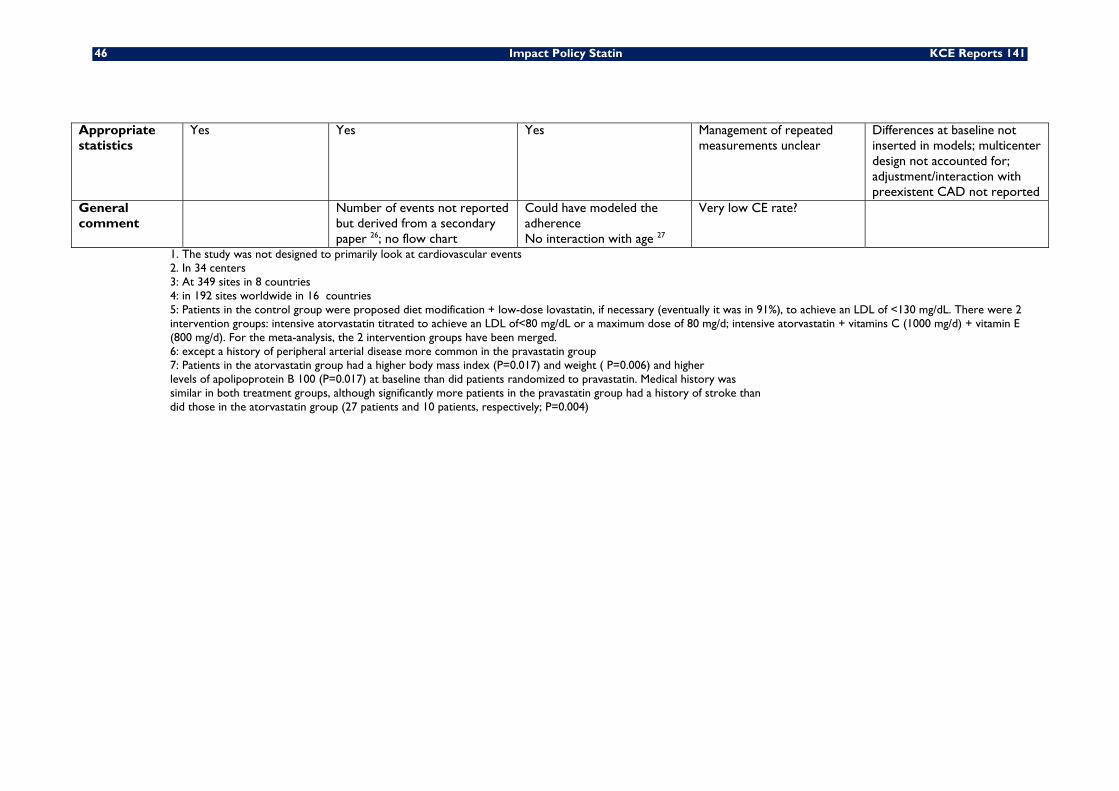
46 Impact Policy Statin KCE Reports 141
Appropriate statistics
Yes Yes Yes Management of repeated measurements unclear
Differences at baseline not inserted in models; multicenter design not accounted for; adjustment/interaction with preexistent CAD not reported
General comment
Number of events not reported but derived from a secondary paper 26; no flow chart
Could have modeled the adherence No interaction with age 27
Very low CE rate?
1. The study was not designed to primarily look at cardiovascular events 2. In 34 centers 3: At 349 sites in 8 countries 4: in 192 sites worldwide in 16 countries 5: Patients in the control group were proposed diet modification + low-dose lovastatin, if necessary (eventually it was in 91%), to achieve an LDL of <130 mg/dL. There were 2 intervention groups: intensive atorvastatin titrated to achieve an LDL of<80 mg/dL or a maximum dose of 80 mg/d; intensive atorvastatin + vitamins C (1000 mg/d) + vitamin E (800 mg/d). For the meta-analysis, the 2 intervention groups have been merged. 6: except a history of peripheral arterial disease more common in the pravastatin group 7: Patients in the atorvastatin group had a higher body mass index (P=0.017) and weight ( P=0.006) and higher levels of apolipoprotein B 100 (P=0.017) at baseline than did patients randomized to pravastatin. Medical history was similar in both treatment groups, although significantly more patients in the pravastatin group had a history of stroke than did those in the atorvastatin group (27 patients and 10 patients, respectively; P=0.004)
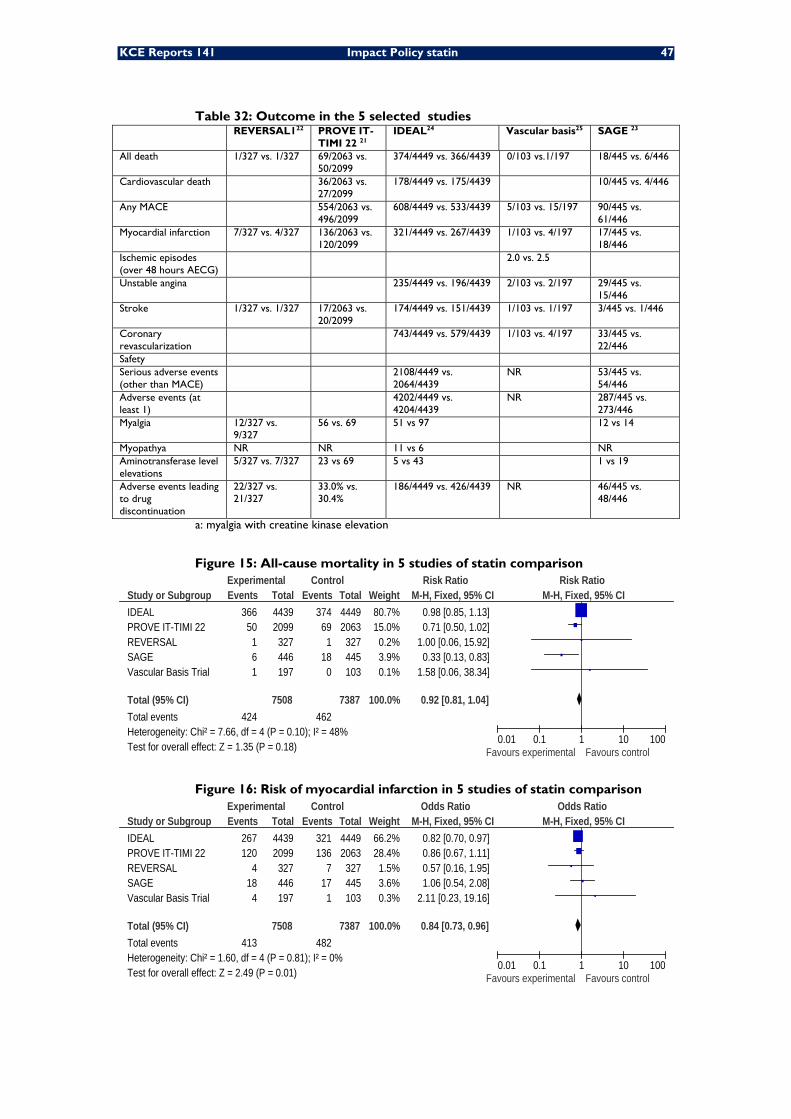
KCE Reports 141 Impact Policy statin 47
Table 32: Outcome in the 5 selected studies REVERSAL122 PROVE IT-
TIMI 22 21 IDEAL24 Vascular basis25 SAGE 23
All death 1/327 vs. 1/327 69/2063 vs. 50/2099
374/4449 vs. 366/4439 0/103 vs.1/197 18/445 vs. 6/446
Cardiovascular death 36/2063 vs. 27/2099
178/4449 vs. 175/4439 10/445 vs. 4/446
Any MACE 554/2063 vs. 496/2099
608/4449 vs. 533/4439 5/103 vs. 15/197 90/445 vs. 61/446
Myocardial infarction 7/327 vs. 4/327 136/2063 vs. 120/2099
321/4449 vs. 267/4439 1/103 vs. 4/197 17/445 vs. 18/446
Ischemic episodes (over 48 hours AECG)
2.0 vs. 2.5
Unstable angina 235/4449 vs. 196/4439 2/103 vs. 2/197 29/445 vs. 15/446
Stroke 1/327 vs. 1/327 17/2063 vs. 20/2099
174/4449 vs. 151/4439 1/103 vs. 1/197 3/445 vs. 1/446
Coronary revascularization
743/4449 vs. 579/4439 1/103 vs. 4/197 33/445 vs. 22/446
Safety Serious adverse events (other than MACE)
2108/4449 vs. 2064/4439
NR 53/445 vs. 54/446
Adverse events (at least 1)
4202/4449 vs. 4204/4439
NR 287/445 vs. 273/446
Myalgia 12/327 vs. 9/327
56 vs. 69 51 vs 97 12 vs 14
Myopathya NR NR 11 vs 6 NR Aminotransferase level elevations
5/327 vs. 7/327 23 vs 69 5 vs 43 1 vs 19
Adverse events leading to drug discontinuation
22/327 vs. 21/327
33.0% vs. 30.4%
186/4449 vs. 426/4439 NR 46/445 vs. 48/446
a: myalgia with creatine kinase elevation
Figure 15: All-cause mortality in 5 studies of statin comparison
Study or SubgroupIDEALPROVE IT-TIMI 22REVERSALSAGEVascular Basis Trial
Total (95% CI)Total eventsHeterogeneity: Chi² = 7.66, df = 4 (P = 0.10); I² = 48%Test for overall effect: Z = 1.35 (P = 0.18)
Events366
50161
424
Total44392099
327446197
7508
Events374
691
180
462
Total44492063
327445103
7387
Weight80.7%15.0%
0.2%3.9%0.1%
100.0%
M-H, Fixed, 95% CI0.98 [0.85, 1.13]0.71 [0.50, 1.02]
1.00 [0.06, 15.92]0.33 [0.13, 0.83]
1.58 [0.06, 38.34]
0.92 [0.81, 1.04]
Experimental Control Risk Ratio Risk RatioM-H, Fixed, 95% CI
0.01 0.1 1 10 100Favours experimental Favours control
Figure 16: Risk of myocardial infarction in 5 studies of statin comparison
Study or SubgroupIDEALPROVE IT-TIMI 22REVERSALSAGEVascular Basis Trial
Total (95% CI)Total eventsHeterogeneity: Chi² = 1.60, df = 4 (P = 0.81); I² = 0%Test for overall effect: Z = 2.49 (P = 0.01)
Events267120
418
4
413
Total44392099
327446197
7508
Events321136
717
1
482
Total44492063
327445103
7387
Weight66.2%28.4%
1.5%3.6%0.3%
100.0%
M-H, Fixed, 95% CI0.82 [0.70, 0.97]0.86 [0.67, 1.11]0.57 [0.16, 1.95]1.06 [0.54, 2.08]
2.11 [0.23, 19.16]
0.84 [0.73, 0.96]
Experimental Control Odds Ratio Odds RatioM-H, Fixed, 95% CI
0.01 0.1 1 10 100Favours experimental Favours control
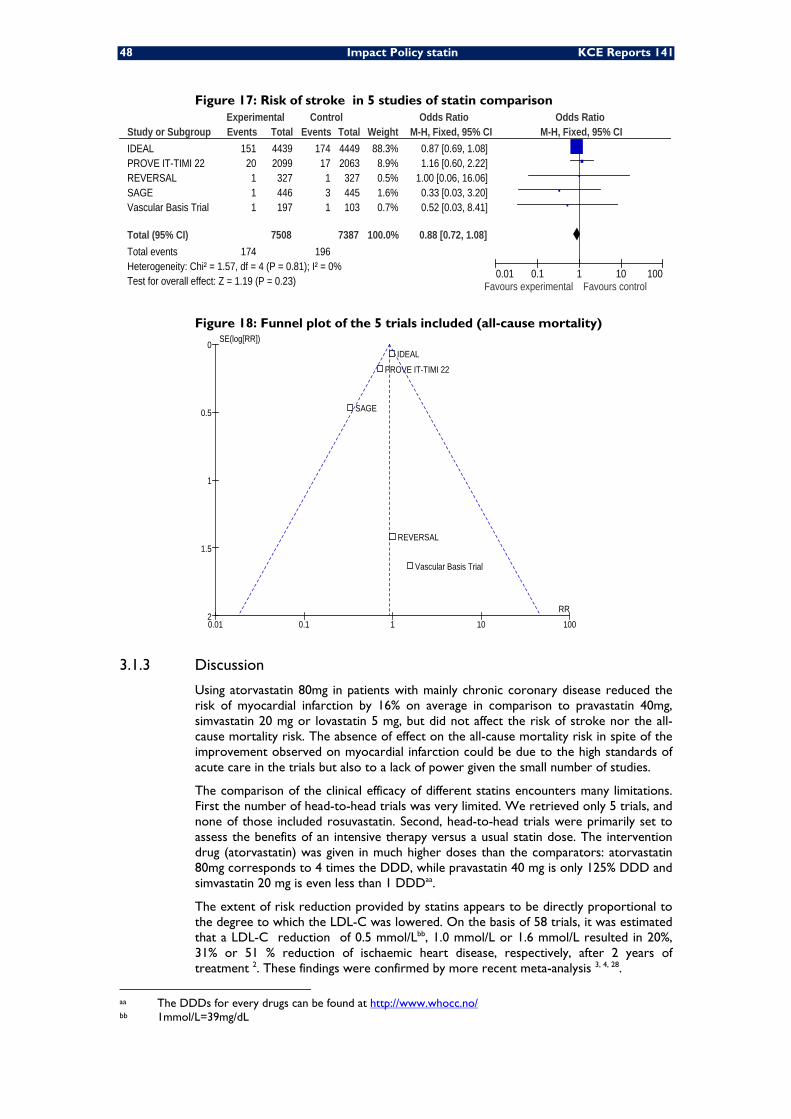
48 Impact Policy statin KCE Reports 141
Figure 17: Risk of stroke in 5 studies of statin comparison
Study or SubgroupIDEALPROVE IT-TIMI 22REVERSALSAGEVascular Basis Trial
Total (95% CI)Total eventsHeterogeneity: Chi² = 1.57, df = 4 (P = 0.81); I² = 0%Test for overall effect: Z = 1.19 (P = 0.23)
Events151
20111
174
Total44392099327446197
7508
Events17417
131
196
Total44492063
327445103
7387
Weight88.3%
8.9%0.5%1.6%0.7%
100.0%
M-H, Fixed, 95% CI0.87 [0.69, 1.08]1.16 [0.60, 2.22]
1.00 [0.06, 16.06]0.33 [0.03, 3.20]0.52 [0.03, 8.41]
0.88 [0.72, 1.08]
Experimental Control Odds Ratio Odds RatioM-H, Fixed, 95% CI
0.01 0.1 1 10 100Favours experimental Favours control
Figure 18: Funnel plot of the 5 trials included (all-cause mortality)
0.01 0.1 1 10 100
0
0.5
1
1.5
2RR
SE(log[RR])
REVERSAL
Vascular Basis Trial
IDEAL
SAGE
PROVE IT-TIMI 22
3.1.3 Discussion
Using atorvastatin 80mg in patients with mainly chronic coronary disease reduced the risk of myocardial infarction by 16% on average in comparison to pravastatin 40mg, simvastatin 20 mg or lovastatin 5 mg, but did not affect the risk of stroke nor the all-cause mortality risk. The absence of effect on the all-cause mortality risk in spite of the improvement observed on myocardial infarction could be due to the high standards of acute care in the trials but also to a lack of power given the small number of studies.
The comparison of the clinical efficacy of different statins encounters many limitations. First the number of head-to-head trials was very limited. We retrieved only 5 trials, and none of those included rosuvastatin. Second, head-to-head trials were primarily set to assess the benefits of an intensive therapy versus a usual statin dose. The intervention drug (atorvastatin) was given in much higher doses than the comparators: atorvastatin 80mg corresponds to 4 times the DDD, while pravastatin 40 mg is only 125% DDD and simvastatin 20 mg is even less than 1 DDDaa.
The extent of risk reduction provided by statins appears to be directly proportional to the degree to which the LDL-C was lowered. On the basis of 58 trials, it was estimated that a LDL-C reduction of 0.5 mmol/Lbb, 1.0 mmol/L or 1.6 mmol/L resulted in 20%, 31% or 51 % reduction of ischaemic heart disease, respectively, after 2 years of treatment 2. These findings were confirmed by more recent meta-analysis 3, 4, 28.
aa The DDDs for every drugs can be found at http://www.whocc.no/ bb 1mmol/L=39mg/dL
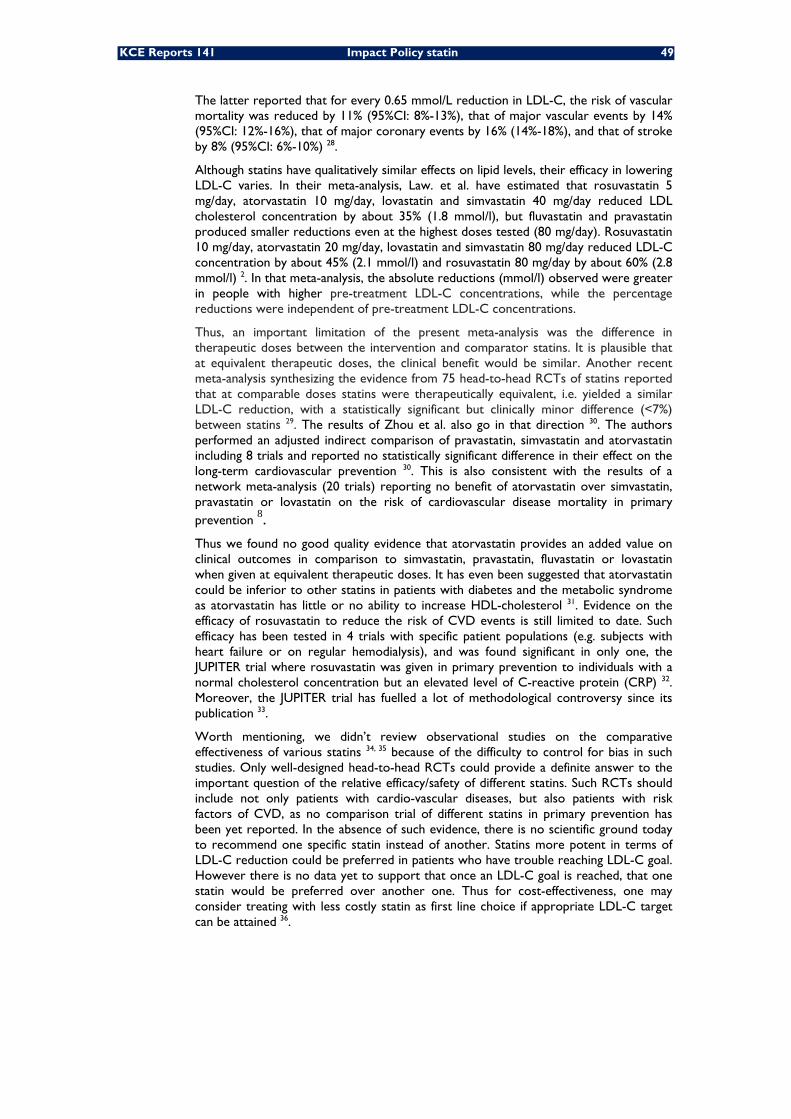
KCE Reports 141 Impact Policy statin 49
The latter reported that for every 0.65 mmol/L reduction in LDL-C, the risk of vascular mortality was reduced by 11% (95%CI: 8%-13%), that of major vascular events by 14% (95%CI: 12%-16%), that of major coronary events by 16% (14%-18%), and that of stroke by 8% (95%CI: 6%-10%) 28.
Although statins have qualitatively similar effects on lipid levels, their efficacy in lowering LDL-C varies. In their meta-analysis, Law. et al. have estimated that rosuvastatin 5 mg/day, atorvastatin 10 mg/day, lovastatin and simvastatin 40 mg/day reduced LDL cholesterol concentration by about 35% (1.8 mmol/l), but fluvastatin and pravastatin produced smaller reductions even at the highest doses tested (80 mg/day). Rosuvastatin 10 mg/day, atorvastatin 20 mg/day, lovastatin and simvastatin 80 mg/day reduced LDL-C concentration by about 45% (2.1 mmol/l) and rosuvastatin 80 mg/day by about 60% (2.8 mmol/l) 2. In that meta-analysis, the absolute reductions (mmol/l) observed were greater in people with higher pre-treatment LDL-C concentrations, while the percentage reductions were independent of pre-treatment LDL-C concentrations.
Thus, an important limitation of the present meta-analysis was the difference in therapeutic doses between the intervention and comparator statins. It is plausible that at equivalent therapeutic doses, the clinical benefit would be similar. Another recent meta-analysis synthesizing the evidence from 75 head-to-head RCTs of statins reported that at comparable doses statins were therapeutically equivalent, i.e. yielded a similar LDL-C reduction, with a statistically significant but clinically minor difference (<7%) between statins 29. The results of Zhou et al. also go in that direction 30. The authors performed an adjusted indirect comparison of pravastatin, simvastatin and atorvastatin including 8 trials and reported no statistically significant difference in their effect on the long-term cardiovascular prevention 30. This is also consistent with the results of a network meta-analysis (20 trials) reporting no benefit of atorvastatin over simvastatin, pravastatin or lovastatin on the risk of cardiovascular disease mortality in primary prevention 8. Thus we found no good quality evidence that atorvastatin provides an added value on clinical outcomes in comparison to simvastatin, pravastatin, fluvastatin or lovastatin when given at equivalent therapeutic doses. It has even been suggested that atorvastatin could be inferior to other statins in patients with diabetes and the metabolic syndrome as atorvastatin has little or no ability to increase HDL-cholesterol 31. Evidence on the efficacy of rosuvastatin to reduce the risk of CVD events is still limited to date. Such efficacy has been tested in 4 trials with specific patient populations (e.g. subjects with heart failure or on regular hemodialysis), and was found significant in only one, the JUPITER trial where rosuvastatin was given in primary prevention to individuals with a normal cholesterol concentration but an elevated level of C-reactive protein (CRP) 32. Moreover, the JUPITER trial has fuelled a lot of methodological controversy since its publication 33.
Worth mentioning, we didn’t review observational studies on the comparative effectiveness of various statins 34, 35 because of the difficulty to control for bias in such studies. Only well-designed head-to-head RCTs could provide a definite answer to the important question of the relative efficacy/safety of different statins. Such RCTs should include not only patients with cardio-vascular diseases, but also patients with risk factors of CVD, as no comparison trial of different statins in primary prevention has been yet reported. In the absence of such evidence, there is no scientific ground today to recommend one specific statin instead of another. Statins more potent in terms of LDL-C reduction could be preferred in patients who have trouble reaching LDL-C goal. However there is no data yet to support that once an LDL-C goal is reached, that one statin would be preferred over another one. Thus for cost-effectiveness, one may consider treating with less costly statin as first line choice if appropriate LDL-C target can be attained 36.
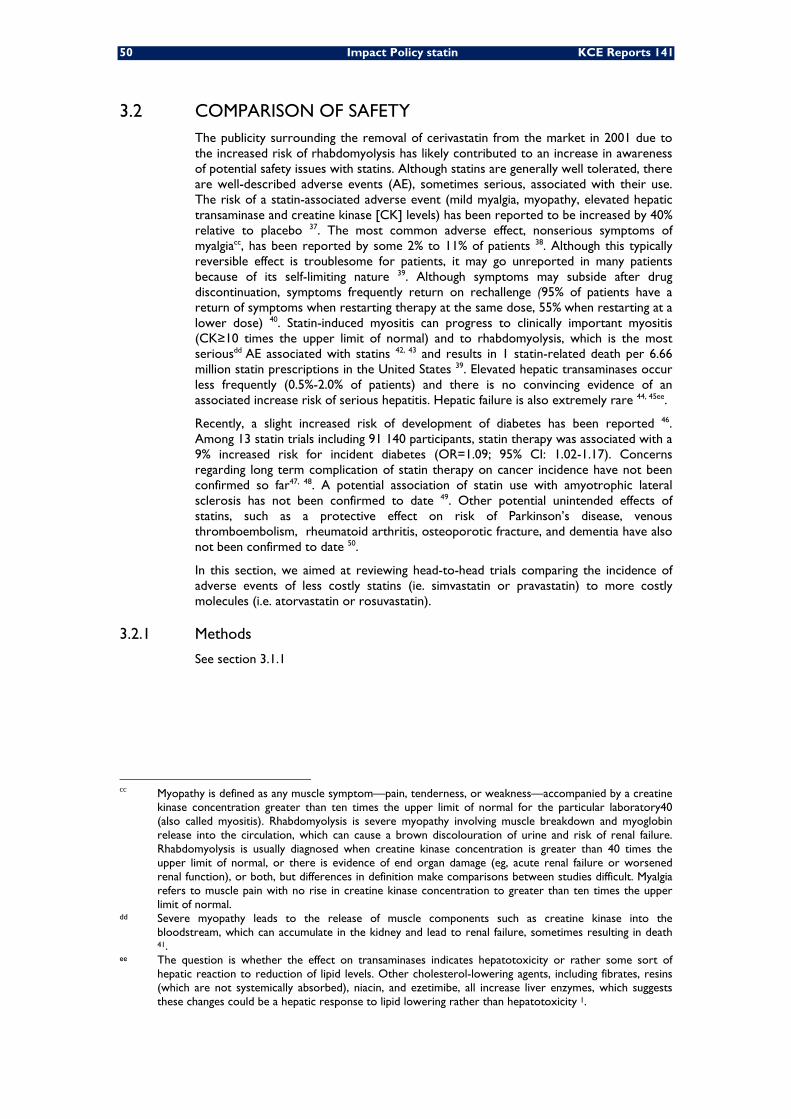
50 Impact Policy statin KCE Reports 141
3.2 COMPARISON OF SAFETY The publicity surrounding the removal of cerivastatin from the market in 2001 due to the increased risk of rhabdomyolysis has likely contributed to an increase in awareness of potential safety issues with statins. Although statins are generally well tolerated, there are well-described adverse events (AE), sometimes serious, associated with their use. The risk of a statin-associated adverse event (mild myalgia, myopathy, elevated hepatic transaminase and creatine kinase [CK] levels) has been reported to be increased by 40% relative to placebo 37. The most common adverse effect, nonserious symptoms of myalgiacc, has been reported by some 2% to 11% of patients 38. Although this typically reversible effect is troublesome for patients, it may go unreported in many patients because of its self-limiting nature 39. Although symptoms may subside after drug discontinuation, symptoms frequently return on rechallenge (95% of patients have a return of symptoms when restarting therapy at the same dose, 55% when restarting at a lower dose) 40. Statin-induced myositis can progress to clinically important myositis (CK≥10 times the upper limit of normal) and to rhabdomyolysis, which is the most seriousdd AE associated with statins 42, 43 and results in 1 statin-related death per 6.66 million statin prescriptions in the United States 39. Elevated hepatic transaminases occur less frequently (0.5%-2.0% of patients) and there is no convincing evidence of an associated increase risk of serious hepatitis. Hepatic failure is also extremely rare 44, 45ee.
Recently, a slight increased risk of development of diabetes has been reported 46. Among 13 statin trials including 91 140 participants, statin therapy was associated with a 9% increased risk for incident diabetes (OR=1.09; 95% CI: 1.02-1.17). Concerns regarding long term complication of statin therapy on cancer incidence have not been confirmed so far47, 48. A potential association of statin use with amyotrophic lateral sclerosis has not been confirmed to date 49. Other potential unintended effects of statins, such as a protective effect on risk of Parkinson’s disease, venous thromboembolism, rheumatoid arthritis, osteoporotic fracture, and dementia have also not been confirmed to date 50.
In this section, we aimed at reviewing head-to-head trials comparing the incidence of adverse events of less costly statins (ie. simvastatin or pravastatin) to more costly molecules (i.e. atorvastatin or rosuvastatin).
3.2.1 Methods
See section 3.1.1
cc Myopathy is defined as any muscle symptom—pain, tenderness, or weakness—accompanied by a creatine
kinase concentration greater than ten times the upper limit of normal for the particular laboratory40 (also called myositis). Rhabdomyolysis is severe myopathy involving muscle breakdown and myoglobin release into the circulation, which can cause a brown discolouration of urine and risk of renal failure. Rhabdomyolysis is usually diagnosed when creatine kinase concentration is greater than 40 times the upper limit of normal, or there is evidence of end organ damage (eg, acute renal failure or worsened renal function), or both, but differences in definition make comparisons between studies difficult. Myalgia refers to muscle pain with no rise in creatine kinase concentration to greater than ten times the upper limit of normal.
dd Severe myopathy leads to the release of muscle components such as creatine kinase into the bloodstream, which can accumulate in the kidney and lead to renal failure, sometimes resulting in death 41.
ee The question is whether the effect on transaminases indicates hepatotoxicity or rather some sort of hepatic reaction to reduction of lipid levels. Other cholesterol-lowering agents, including fibrates, resins (which are not systemically absorbed), niacin, and ezetimibe, all increase liver enzymes, which suggests these changes could be a hepatic response to lipid lowering rather than hepatotoxicity 1.
KCE Reports 141 Impact Policy statin 51
3.2.2 Results
The information on safety issues in the trials included was scarce. There was no obvious difference between statins, except in the IDEAL study where a doubling of the risk of myalgia leading to treatment discontinuation was observed (Table 32).
3.2.3 Discussion
We encountered for direct comparison of safety among different statins the same limitations as for efficacy (see 3.1.3), notably that published head-to-head trials compared high doses of atorvastatin to usual doses of other statins. However, although the risk of adverse events is dose-related 39, globally no excess adverse events was noted in the atorvastatin intervention group. The increase of side effects in the IDEAL study might be partially due to its open-label design. Noteworthy, none of these trials was not designed to assess such adverse events, and the corresponding outcomes were rarely reported.
Rosuvastatin was the first statin to be marketed after the withdrawal of cerivastatin, and there is thus considerable concern regarding its safety profile. The data presented in 2003 to the FDA included 20 controlled trials with placebo or comparator statins (these trials were not included in our meta-analysis as no clinical outcomes were reported). The safety profile of rosuvastatin appeared similar to those of the comparator statins investigated 51. This was confirmed in a further review of head-to-head trials comparing rosuvastatin with atorvastatin 52. An in-vitro study also showed that the cytotoxicity of rosuvastatin and pravastatin, 2 hydrophilic statins, was even lower than for lipophilic statins 53.
Notwithstanding, the appraisal of comparative safety can also be achieved by other means: indirect comparisons of RCTs and pharmacoepidemiology studies.
Indirect comparisons
Two previous meta-analyses achieved an indirect general comparison of statins 8, 30, but only one reported on AEs 8. However, the latter did not apply a mixed-treatment comparison on the aspect of AEs.
Specific AEs were assessed in other meta-analyses. Two recent studies looked at induced diabetes. The first one suggested that the risk of incident diabetes with rosuvastatin (OR=1.18, 95% CI: 1.04-1.33) might be higher than with other statins, although the overall test for heterogeneity among statins was not statistically significant 46. The second one found that statins as a drug class had no significant impact on insulin sensitivity (IS) as compared with placebo 54. However, there were variations by statin molecules: pravastatin was found to significantly improved IS while simvastatin significantly worsened it.
Another meta-analysis reported that atorvastatin was associated with the greatest risk of adverse events (myalgia, elevated liver function tests, creatine phosphokinase) and fluvastatin with the least risk 37. However, the global risk of serious adverse events was low (Number Need to Harm (NNH)=7428 for rhabdomyolisis).
Pharmacoepidemiology
The manufacturer of rosuvastatin (Astra Zeneca) set up an ambitious pharmacoepidemiological programme comparing rosuvastatin with other marketed statins 55. This programme was designed and run by an independent third party. In this large sample (≅200 000 person-years), no significant difference in the risk of myopathy, rhabdomyolysis, acute liver injury or acute renal failure was seen between rosuvastatin and other statins 41, 56, 57. This programme also allowed indirectly to have rates of AEs for the other statins. The incidence rates for myopathy, rhabdomyolysis, acute renal failure and acute liver injury were 0.42, 0.14, 4.36 and 1.13 per 10 000 person-years, respectively, for statins other than rosuvastatin 41.
52 Impact Policy statin KCE Reports 141
A study carried out in primary care setting over a 6 year period and including 2 004 692 patients aged 30-84 years of whom 225 992 (10.7%) were new users of statins reported an apparent decreased risk of colon cancer in men prescribed pravastatin and an increased risk in men prescribed rosuvastatin 50. It was unclear if such findings represented a genuine association or were due to chance, given the large number of outcomes under consideration in this study. In the same study, other potential adverse events associated to statins were investigated 50. Adverse effects tended to be similar across the types of statins for most outcomes except for liver dysfunction, where the highest risks were associated with fluvastatin.
In conclusion, there is to date few, and sometimes contradictory, evidence of a safety difference in the utilization of various statins. The risk profile of statins is overall good. However, the potentially raised diabetes risk, particularly with rosuvastatin, should be taken into account when statin therapy is begun for primary prevention in patients with low cardiovascular risk 46.
3.2.4 Conclusion
We found no clear cut evidence of a differential toxicity among the various statin molecules. Such variations in drug toxicity were plausible given molecular specificities. First, some molecules are hydrophilic (rosuvastatin, pravastatin) and the others are more lipophilic. The more lipophilic statins tend to achieve higher levels of exposure in non-hepatic tissues, while the hydrophilic statins tend to be more hepatoselective. High hepatoselectivity is thought to translate into reduced risk of adverse effects 58. Second, some statins are predominantly metabolized by the cytochrom 3A4 (an isoenzyme of cytochrom P450), such as simvastatin and atorvastatin. Subsequently, drugs inhibiting that isoenzyme will increase the concentration and toxicity of statins. Pravastatin and fluvastatin are not metabolized by any isoenzyme, and rosuvastatin is metabolized by another one (CYP2C9). A table of inducers and inhibitors of those isoenzymes is presented in Annex 59. For instance, the risk of rhabdomyolysis increases with the concomitant use of ciclosporin or fibrates. Third, some categories of patients might be more at risk of AEs. Patients with renal impairment, hypothyroidism, serious debility, or those who are older than 80 years are more susceptible than others to myopathy.
The mechanisms by which statins cause myopathy and rhabdomyolysis is not precisely known, but this effect is dose-dependent and molecule-specific 1, 53. However, the occurrence of AEs is not related to the cholesterol-lowering effect of a particular statin, as the case of cerivastatin showed it.
3.3 BUDGETARY CONSIDERATIONS In view of the results in sections 3.1.3 and 3.2.3, recommending that patients use primarily simvastatin and pravastatin appears to be a reasonable strategy which respects the right of patients to access the best possible care.
In this section, simulations to have a better overview of how changes in prescription patterns impact on total statin expenditure are presented. Two different analysis reflecting two different policies are presented hereafter. Firstly, using INAMI/RIZIV aggregated data we simulated changes on use of different molecules for all users of statins for the period between 2006and 2009. This scenario is set based on the Norwegian experience, in which all users from the most expensive statin were switched to the least expensive alternatives. Secondly, we consider the impact of starting new treatments with the least expensive statins in at least 8 out of 10 patients (following recommendations included in the NCPS 2009 agreement). As recent data on new users is not available for 2009, we used the most recent data where we can identify this information. Thus an overview of the possible impact of the NCPS recommendations was done using data from the EPS for year 2006 (see details on data on section 2.2.3). For both analyses, the least expensive statins are those defined in the NCPS 2009 agreement: simvastatin and pravastatin.
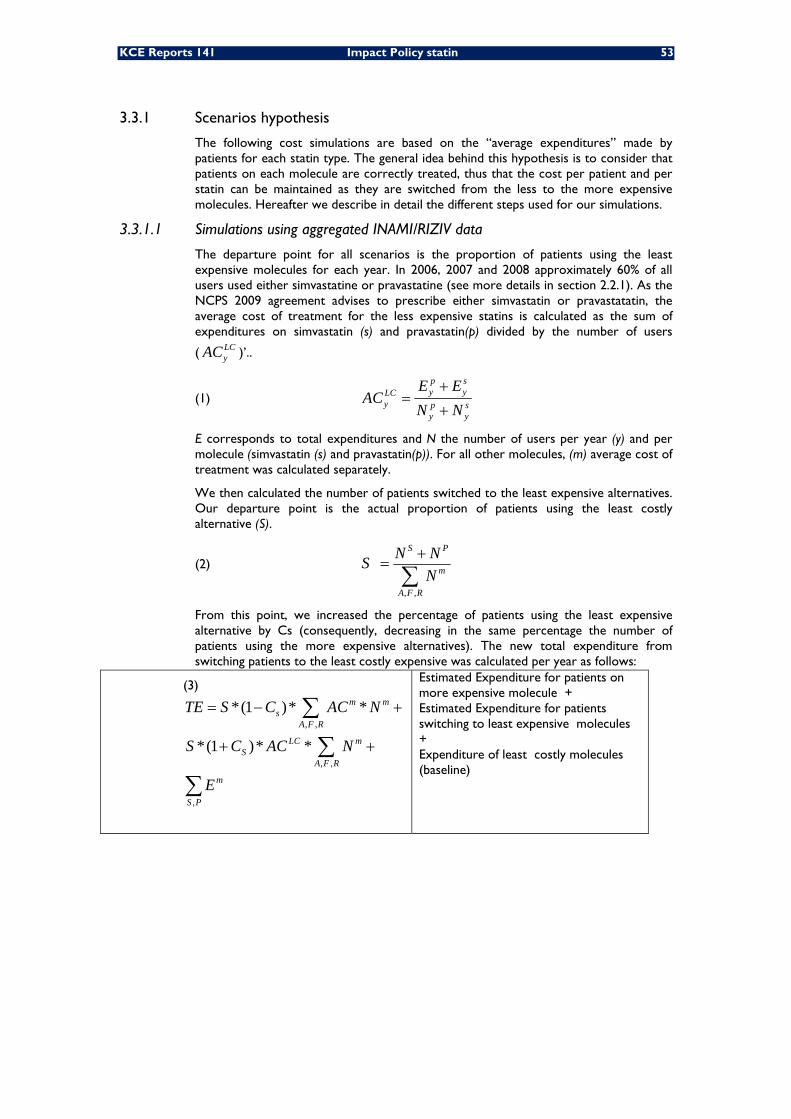
KCE Reports 141 Impact Policy statin 53
3.3.1 Scenarios hypothesis
The following cost simulations are based on the “average expenditures” made by patients for each statin type. The general idea behind this hypothesis is to consider that patients on each molecule are correctly treated, thus that the cost per patient and per statin can be maintained as they are switched from the less to the more expensive molecules. Hereafter we describe in detail the different steps used for our simulations.
3.3.1.1 Simulations using aggregated INAMI/RIZIV data
The departure point for all scenarios is the proportion of patients using the least expensive molecules for each year. In 2006, 2007 and 2008 approximately 60% of all users used either simvastatine or pravastatine (see more details in section 2.2.1). As the NCPS 2009 agreement advises to prescribe either simvastatin or pravastatatin, the average cost of treatment for the less expensive statins is calculated as the sum of expenditures on simvastatin (s) and pravastatin(p) divided by the number of users
( LCyAC )’..
(1) p sy yLC
y p sy y
E EAC
N N+
=+
E corresponds to total expenditures and N the number of users per year (y) and per molecule (simvastatin (s) and pravastatin(p)). For all other molecules, (m) average cost of treatment was calculated separately.
We then calculated the number of patients switched to the least expensive alternatives. Our departure point is the actual proportion of patients using the least costly alternative (S).
(2)
, ,
S P
m
A F R
N NSN+
=∑
From this point, we increased the percentage of patients using the least expensive alternative by Cs (consequently, decreasing in the same percentage the number of patients using the more expensive alternatives). The new total expenditure from switching patients to the least costly expensive was calculated per year as follows:
(3)
, ,
, ,
,
*(1 )* *
*(1 )* *
m ms
A F R
LC mS
A F R
m
S P
TE S C AC N
S C AC N
E
= − +
+ +
∑
∑
∑
Estimated Expenditure for patients on more expensive molecule + Estimated Expenditure for patients switching to least expensive molecules + Expenditure of least costly molecules (baseline)
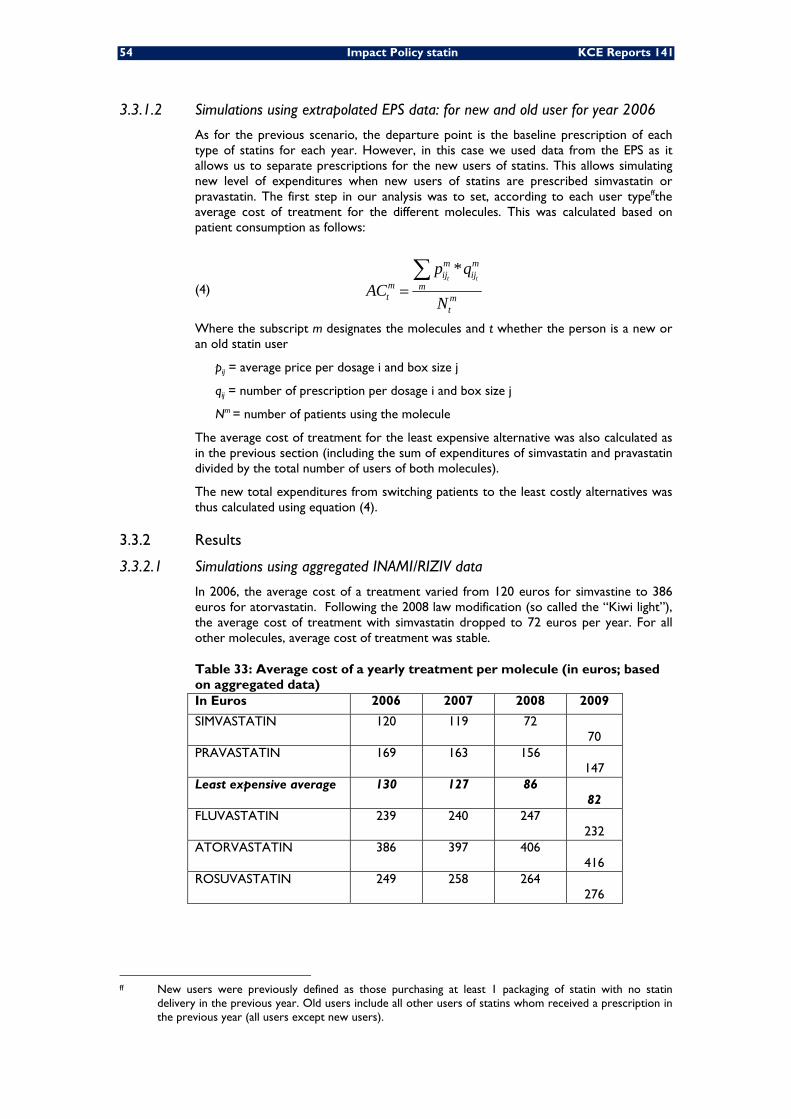
54 Impact Policy statin KCE Reports 141
3.3.1.2 Simulations using extrapolated EPS data: for new and old user for year 2006
As for the previous scenario, the departure point is the baseline prescription of each type of statins for each year. However, in this case we used data from the EPS as it allows us to separate prescriptions for the new users of statins. This allows simulating new level of expenditures when new users of statins are prescribed simvastatin or pravastatin. The first step in our analysis was to set, according to each user typeffthe average cost of treatment for the different molecules. This was calculated based on patient consumption as follows:
(4)
*t t
m mij ij
m mt m
t
p qAC
N=∑
Where the subscript m designates the molecules and t whether the person is a new or an old statin user
pij = average price per dosage i and box size j
qij = number of prescription per dosage i and box size j
Nm = number of patients using the molecule
The average cost of treatment for the least expensive alternative was also calculated as in the previous section (including the sum of expenditures of simvastatin and pravastatin divided by the total number of users of both molecules).
The new total expenditures from switching patients to the least costly alternatives was thus calculated using equation (4).
3.3.2 Results
3.3.2.1 Simulations using aggregated INAMI/RIZIV data
In 2006, the average cost of a treatment varied from 120 euros for simvastine to 386 euros for atorvastatin. Following the 2008 law modification (so called the “Kiwi light”), the average cost of treatment with simvastatin dropped to 72 euros per year. For all other molecules, average cost of treatment was stable.
Table 33: Average cost of a yearly treatment per molecule (in euros; based on aggregated data) In Euros 2006 2007 2008 2009
SIMVASTATIN 120 119 72 70
PRAVASTATIN 169 163 156 147
Least expensive average 130 127 86 82
FLUVASTATIN 239 240 247 232
ATORVASTATIN 386 397 406 416
ROSUVASTATIN 249 258 264 276
ff New users were previously defined as those purchasing at least 1 packaging of statin with no statin
delivery in the previous year. Old users include all other users of statins whom received a prescription in the previous year (all users except new users).
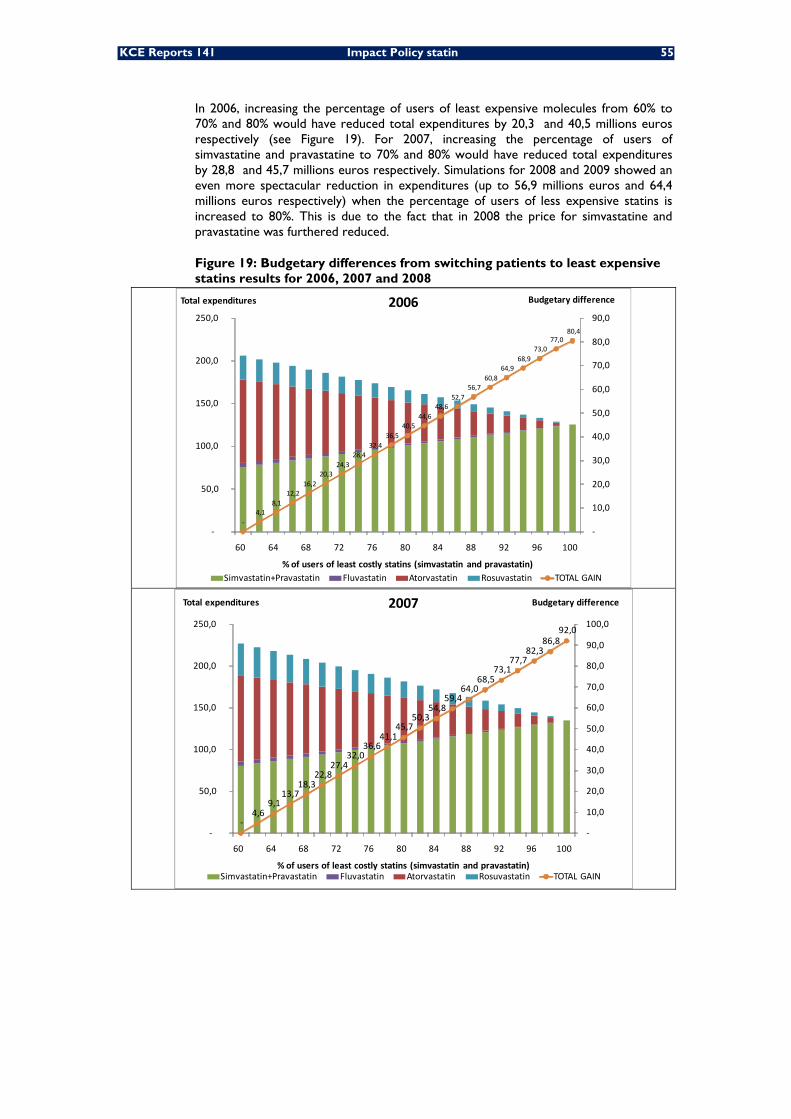
KCE Reports 141 Impact Policy statin 55
In 2006, increasing the percentage of users of least expensive molecules from 60% to 70% and 80% would have reduced total expenditures by 20,3 and 40,5 millions euros respectively (see Figure 19). For 2007, increasing the percentage of users of simvastatine and pravastatine to 70% and 80% would have reduced total expenditures by 28,8 and 45,7 millions euros respectively. Simulations for 2008 and 2009 showed an even more spectacular reduction in expenditures (up to 56,9 millions euros and 64,4 millions euros respectively) when the percentage of users of less expensive statins is increased to 80%. This is due to the fact that in 2008 the price for simvastatine and pravastatine was furthered reduced.
Figure 19: Budgetary differences from switching patients to least expensive statins results for 2006, 2007 and 2008
‐4,1
8,1 12,2
16,2 20,3
24,3 28,4
32,4 36,5
40,5 44,6
48,6 52,7
56,7 60,8
64,9 68,9
73,0 77,0
80,4
‐
10,0
20,0
30,0
40,0
50,0
60,0
70,0
80,0
90,0
‐
50,0
100,0
150,0
200,0
250,0
60 64 68 72 76 80 84 88 92 96 100
Budgetary difference Total expenditures
% of users of least costly statins (simvastatin and pravastatin)
2006
Simvastatin+Pravastatin Fluvastatin Atorvastatin Rosuvastatin TOTAL GAIN
‐4,6
9,1 13,7
18,3 22,8
27,4 32,0
36,6 41,1
45,7 50,3
54,8 59,4
64,0 68,5
73,1 77,7
82,3 86,8
92,0
‐
10,0
20,0
30,0
40,0
50,0
60,0
70,0
80,0
90,0
100,0
‐
50,0
100,0
150,0
200,0
250,0
60 64 68 72 76 80 84 88 92 96 100
Budgetary differenceTotal expenditures
% of users of least costly statins (simvastatin and pravastatin)
2007
Simvastatin+Pravastatin Fluvastatin Atorvastatin Rosuvastatin TOTAL GAIN
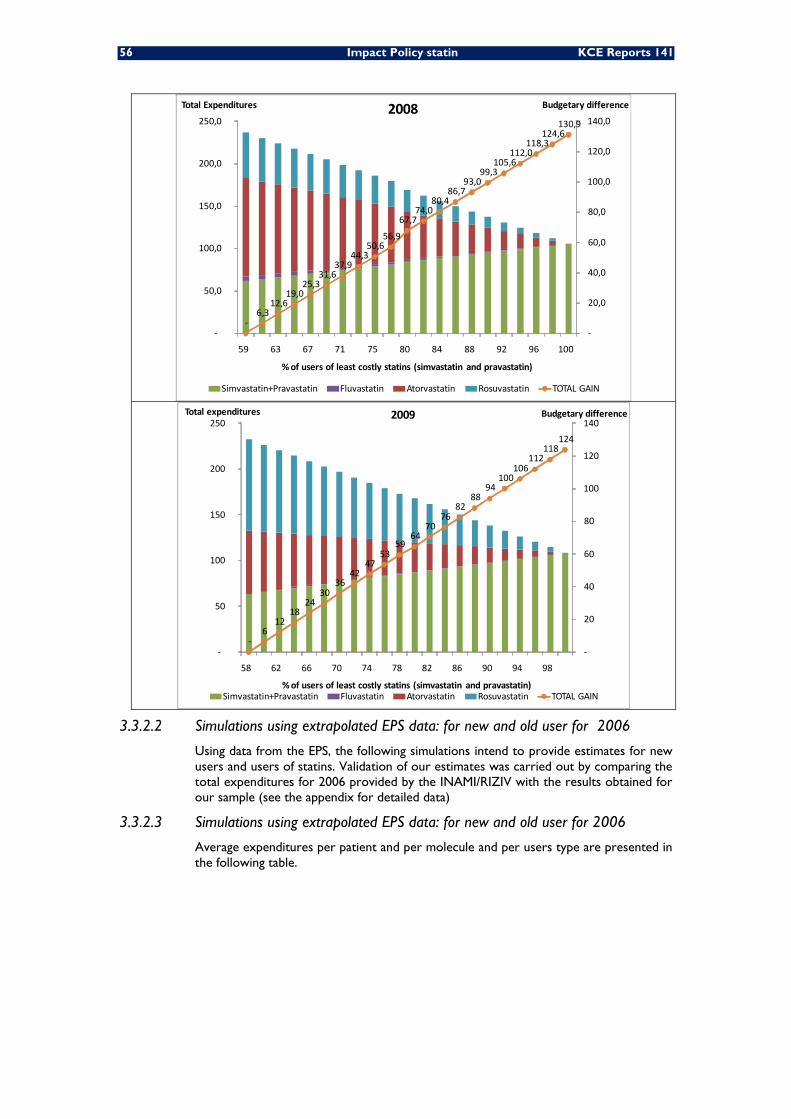
56 Impact Policy statin KCE Reports 141
‐6,3
12,6 19,0
25,3 31,6
37,9 44,3
50,6 56,9
67,7 74,0
80,4 86,7
93,0 99,3
105,6 112,0
118,3 124,6
130,9
‐
20,0
40,0
60,0
80,0
100,0
120,0
140,0
‐
50,0
100,0
150,0
200,0
250,0
59 63 67 71 75 80 84 88 92 96 100
Budgetary differenceTotal Expenditures
% of users of least costly statins (simvastatin and pravastatin)
2008
Simvastatin+Pravastatin Fluvastatin Atorvastatin Rosuvastatin TOTAL GAIN
‐6
12 18
24 30
36 42
47 53
59 64
70 76
82 88
94 100
106 112
118 124
‐
20
40
60
80
100
120
140
‐
50
100
150
200
250
58 62 66 70 74 78 82 86 90 94 98
Budgetary differenceTotal expenditures
% of users of least costly statins (simvastatin and pravastatin)
2009
Simvastatin+Pravastatin Fluvastatin Atorvastatin Rosuvastatin TOTAL GAIN
3.3.2.2 Simulations using extrapolated EPS data: for new and old user for 2006
Using data from the EPS, the following simulations intend to provide estimates for new users and users of statins. Validation of our estimates was carried out by comparing the total expenditures for 2006 provided by the INAMI/RIZIV with the results obtained for our sample (see the appendix for detailed data)
3.3.2.3 Simulations using extrapolated EPS data: for new and old user for 2006
Average expenditures per patient and per molecule and per users type are presented in the following table.
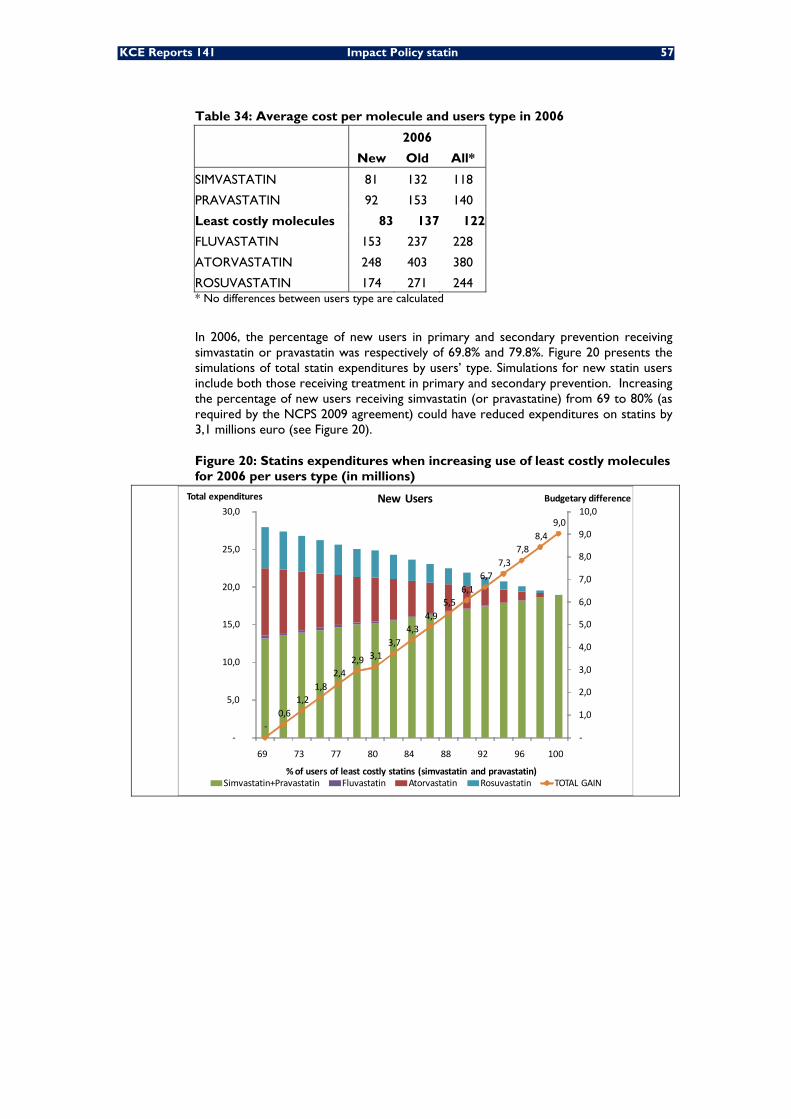
KCE Reports 141 Impact Policy statin 57
Table 34: Average cost per molecule and users type in 2006
2006
New Old All*
SIMVASTATIN 81 132 118
PRAVASTATIN 92 153 140
Least costly molecules 83 137 122
FLUVASTATIN 153 237 228
ATORVASTATIN 248 403 380
ROSUVASTATIN 174 271 244 * No differences between users type are calculated
In 2006, the percentage of new users in primary and secondary prevention receiving simvastatin or pravastatin was respectively of 69.8% and 79.8%. Figure 20 presents the simulations of total statin expenditures by users’ type. Simulations for new statin users include both those receiving treatment in primary and secondary prevention. Increasing the percentage of new users receiving simvastatin (or pravastatine) from 69 to 80% (as required by the NCPS 2009 agreement) could have reduced expenditures on statins by 3,1 millions euro (see Figure 20).
Figure 20: Statins expenditures when increasing use of least costly molecules for 2006 per users type (in millions)
‐0,6
1,2 1,8
2,4 2,9 3,1
3,7 4,3
4,9 5,5
6,1 6,7
7,3 7,8
8,4 9,0
‐
1,0
2,0
3,0
4,0
5,0
6,0
7,0
8,0
9,0
10,0
‐
5,0
10,0
15,0
20,0
25,0
30,0
69 73 77 80 84 88 92 96 100
Budgetary differenceTotal expenditures
% of users of least costly statins (simvastatin and pravastatin)
New Users
Simvastatin+Pravastatin Fluvastatin Atorvastatin Rosuvastatin TOTAL GAIN
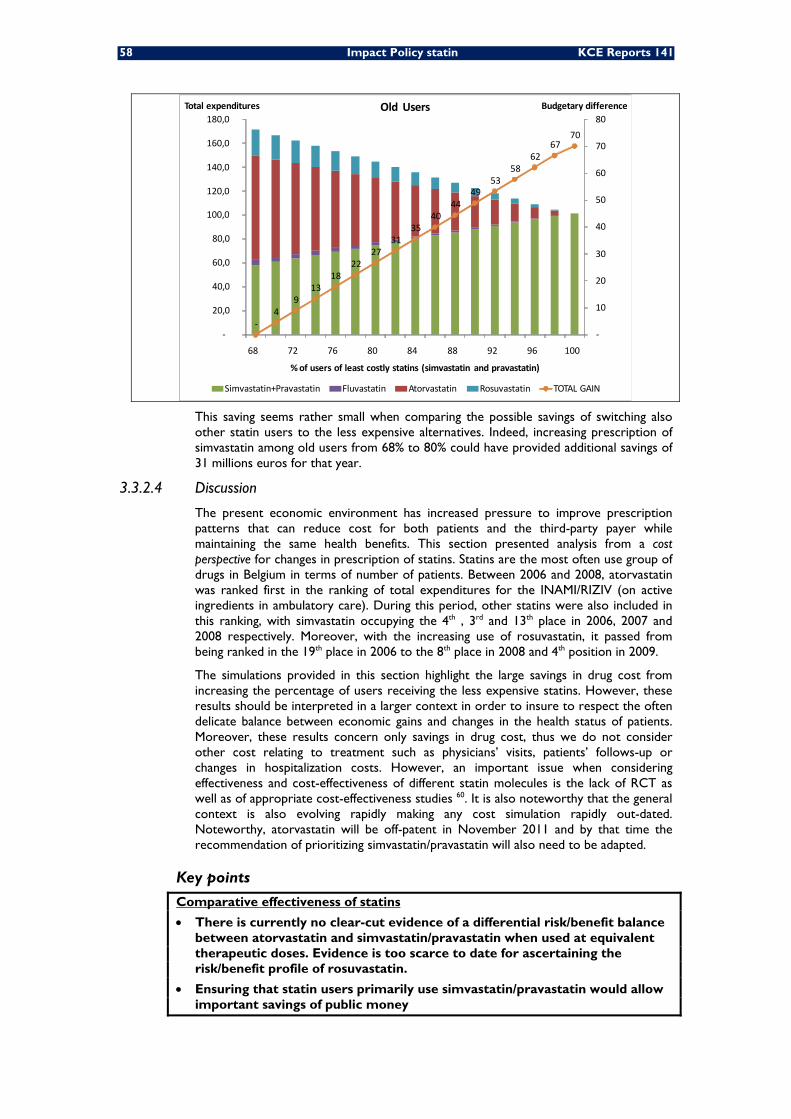
58 Impact Policy statin KCE Reports 141
‐4
9 13
18 22
27 31
35 40
44 49
53 58
62 67
70
‐
10
20
30
40
50
60
70
80
‐
20,0
40,0
60,0
80,0
100,0
120,0
140,0
160,0
180,0
68 72 76 80 84 88 92 96 100
Budgetary differenceTotal expenditures
% of users of least costly statins (simvastatin and pravastatin)
Old Users
Simvastatin+Pravastatin Fluvastatin Atorvastatin Rosuvastatin TOTAL GAIN
This saving seems rather small when comparing the possible savings of switching also other statin users to the less expensive alternatives. Indeed, increasing prescription of simvastatin among old users from 68% to 80% could have provided additional savings of 31 millions euros for that year.
3.3.2.4 Discussion
The present economic environment has increased pressure to improve prescription patterns that can reduce cost for both patients and the third-party payer while maintaining the same health benefits. This section presented analysis from a cost perspective for changes in prescription of statins. Statins are the most often use group of drugs in Belgium in terms of number of patients. Between 2006 and 2008, atorvastatin was ranked first in the ranking of total expenditures for the INAMI/RIZIV (on active ingredients in ambulatory care). During this period, other statins were also included in this ranking, with simvastatin occupying the 4th , 3rd and 13th place in 2006, 2007 and 2008 respectively. Moreover, with the increasing use of rosuvastatin, it passed from being ranked in the 19th place in 2006 to the 8th place in 2008 and 4th position in 2009.
The simulations provided in this section highlight the large savings in drug cost from increasing the percentage of users receiving the less expensive statins. However, these results should be interpreted in a larger context in order to insure to respect the often delicate balance between economic gains and changes in the health status of patients. Moreover, these results concern only savings in drug cost, thus we do not consider other cost relating to treatment such as physicians’ visits, patients’ follows-up or changes in hospitalization costs. However, an important issue when considering effectiveness and cost-effectiveness of different statin molecules is the lack of RCT as well as of appropriate cost-effectiveness studies 60. It is also noteworthy that the general context is also evolving rapidly making any cost simulation rapidly out-dated. Noteworthy, atorvastatin will be off-patent in November 2011 and by that time the recommendation of prioritizing simvastatin/pravastatin will also need to be adapted.
Key points
Comparative effectiveness of statins
• There is currently no clear-cut evidence of a differential risk/benefit balance between atorvastatin and simvastatin/pravastatin when used at equivalent therapeutic doses. Evidence is too scarce to date for ascertaining the risk/benefit profile of rosuvastatin.
• Ensuring that statin users primarily use simvastatin/pravastatin would allow important savings of public money
KCE Reports 141 Impact Policy statin 59
4 GENERAL DISCUSSION 4.1 INCREASING NUMBERS
Because CVD is common and statins are widely dispensed, statins are among the most frequently prescribed drugs. In 2009, around 20% of Belgian adults ≥ 35 years utilized some statin, and atorvastatin and rosuvastatin occupied respectively the 1st and 4th position in the top list of highest public expenditures per drug. This emphasizes the need for a rational statin utilization.
Most of the utilization rise related to primary prevention, for various reasons. The administrative simplification occurred in mid-2004 and the further price reduction of simvastatin/pravastatin certainly played a role, but this doesn’t explain the concurrent rise of rosuvastatin and atorvastatin users. Lifestyle (roughly 83% of the Belgians have a total cholesterol level higher than the recommended limits61), secular population ageing, and a general tendency towards medicalization of prevention also form a triggering combination. It should be emphasized that lifestyle interventions can also be effective in reducing CVD morbidity and mortality, and that there is an urgent need of implementing comprehensive strategies that would allow such changes. Finally, the current cut-off for reimbursing statins in Belgium in primary prevention (SCORE 10-years CVD mortality risk≥5%) might be interpreted too narrowly as a threshold for statin use when it is in reality a clinical indicator to adapt the CVD management to individual needs. For instance, 88.0 % of males ≥63 years have a high cholesterol concentration 61. The SCORE is ≥5% for virtually all this sub-population. Thus 88% of males ≥63 years would be eligible for statin prevention. This only group represents 761 000 beneficiaries. Thirty-six percents of the adult population ≥35 years suffer from both hypertension and hypercholesteremia. Among those, 19.6% have a SCORE ≥5% 61. As a result, more than 7% of adults ≥35 years could receive statins. This amounts to 21% of people 55-64 years, and to 63% of people 65-74 years. These figures clearly show that a management of CVD risk based essentially on drug use would result in a high societal burden. The cost-effectiveness of such strategy in our country has been evaluated pretty high in comparison to other strategies such as low-dose aspirin or smoking cessation 60. Even when using the less costly molecule on the market at the time, the authors found that the incremental cost per life-year gained was 29 173 euros 87 022 euros in a male high-risk group aged 60 and a male moderate-risk aged 50, respectively. Very large beneficiary groups and high cost-effectiveness will result in an ever increasing proportion of health expenditures being dedicated to statin prescriptions.
It is also important to recall that the individual absolute clinical benefit of a statin prevention is related to an individual’s absolute risk of CVD events. The decision whether to initiate statin therapy should be made after an informed discussion between the responsible clinician and the individual about the risks and benefits of statin treatment, and taking into account additional factors such as comorbidities and life expectancy. Also, the way of presenting to the patient the expected risk reduction (i.e. absolute or relative measures) influences his/her decision-making of beginning or not the statin 62. Presenting the benefits of taking statins as a relative risk reduction increases the likelihood of people accepting treatment compared to presenting absolute summary statistics, independent of the relative importance they attach to the consequences. Natural frequencies may be the most suitable summary statistic for presenting treatment effects, based on self-reported preference, understanding of and satisfaction with the information, and confidence in the decision 62.
60 Impact Policy statin KCE Reports 141
4.2 SECONDARY PREVENTION At the same time, a statin therapy was initialized in only 52.4% of patients hospitalized for a CVD in 2006 (45.5% for 2003-2006). This proportion was very much dependent of the age group and the specific pathology considered. In 96 % of adults aged 50-59 hospitalized for an acute myocardial infarction in 2006 a statin therapy was started, while this proportion was 58% for an ischemic cerebrovascular event in the same age group. Such sub-optimal coverage of high-risk patients, particularly after a stroke, is consistent with what is observed in other European countries 63.
It is important to define innovative strategies to improve the coverage of such patients. Noteworthy, the utilization of statin-based secondary therapy after a CVD event has increased greatly between 2003 and 2006, and the coverage rate for all such events is plausibly better nowadays.
4.3 COMPARATIVE EFFICACY OF STATINS Although the efficacy in lowering LDL-C varies by statin molecules, we found no clear-cut evidence of a differential risk/benefit balance between atorvastatin and simvastatin/pravastatin when used at equivalent therapeutic doses. Direct evidence was scarce because head-to-head trials were primarily designed to assess the benefits of an intensive therapy versus usual doses of statin, but other meta-analyses based on indirect methods reached the same conclusion as ours. The absolute benefit relates mainly to an individual’s absolute risk of CVD events and to the absolute reduction in LDL-C achieved. Thus, what matters is the therapeutic target in terms of LDL-C concentration whatever the specific molecule used. There are indeed indications that simvastatin/pravastatin at higher doses could yield the same clinical benefit as atorvastatin/rosuvastatin. For instance, Nicholls et al. have reported that doubling the dose of each statin was accompanied by a 4% to 7% greater degree of lowering of all atherogenic lipids 64. There was also no evidence of a different safety profile among statines 54. However, the occurrence of adverse events is also dose-dependent. Worth mentioning, evidence for ascertaining the risk/benefit profile of rosuvastatin was scarce to date. Therefore the current recommendations by INAMI/RIZI to use primarily simvastatin or pravastatin in the majority of patients in primary and secondary prevention are scientifically sound.
4.4 COST CONTAINMENT A number of measures were taken to curve the rising public expenses on statins while maintaining an equal access.
The facilitation of reimbursement conditions for simvastatin and pravastatin in 2004 resulted in an increase of users but had a moderate effect on the numbers of patients using other statins. The number of rosuvastatin users has also greatly increased since its marketing in 2003. In spite of the lower price and facilitated access to simvastatin and pravastatin, these 2 molecules represented still only 51.6% of DDD intake in 2009 (66.5% of users in 2003-2006). Surprisingly, the utilization of these 2 least-expensive molecules was more important in secondary prevention. For instance, in 2003-2006, 78.4% of patients in secondary prevention used simvastatin/pravastatin while this proportion was only 65.4% in primary prevention. This was a counterintuitive finding, as one would have expected that more potent molecules be utilized more often in patients with an history of CVD.
In 2008, a system of public tender was set up. It resulted in the price reduction of simvastatin, with no obvious effect however on the utilization of more expensive molecules.
In 2009, the INAMI/RIZIV recommended that simvastatin/pravastatin be used in 80% of new treatments, and extended its recommendation in 2010 to all patients beginning primary prevention, including diabetic patients, and to the majority of patients beginning a secondary prevention. Given the time lag in collection and analysis of routine data, it is too early to evaluate the impact of such strategy on prescription patterns.
KCE Reports 141 Impact Policy statin 61
4.5 STATIN SWITCH Noteworthy, a more important budgetary impact would be obtained if all statin users, i.e. not only new users, were shifted towards simvastatin/pravastatin. This seems a reasonable scenario provided that the level of CVD protection is maintained constant for each patient and if switching back is possible. Such global shift has been implemented in Norway in 2005 65 and Finland in 2006 66, but also in Austria, Denmark and Sweden. Between 40% and 60% of patients using atorvastatin or rosuvastatin switched to a less expensive statins in Norway and Finland. However, the policy line was quite strict (expensive statins can be reimbursed only when less expensive ones are proved to be ineffective or not tolerated) and unlikely to be adapted to our national context. Moreover, given the relatively short treatment duration in Belgium (50% patients stop their treatment within a 4 year period), the proportion of patients who begun a statin regimen before the 2009 and 2010 recommendations will be washed out in the mid-term.
4.6 ADHERENCE Among new users in 2003-2006 only 59% were regular users, and this proportion was similar for all statins. We identified a number of factors related to a low treatment adherence such as being younger than 50 years, being a male, following a primary prevention or being prescribed by a GP. A history of cardiovascular disease predicted a better adherence to statins. Similarly, a diagnosis of diabetes was associated with better adherence. This is very consistent with international results 67. However, even in patients in secondary prevention, the proportion of adherents did not go over 75%, a finding also in line with other European countries 63. This is a matter of concerns as non-adherence is associated with a marked increase in CVD and hospitalization rates 14,
15. Higher adherence rates could dramatically improve patient outcomes while reducing overall health care spending 68,69. Innovative ways to improve adherence are crucially needed.
4.7 SAFETY Although statin therapy were reportedly well tolerated and relatively safe in trials, adverse events might be more common in clinical practice for several reasons. First, trial participants are generally younger and healthier and they are more closely followed than patients in usual clinical practice. In addition, these trials excluded over half of all screened patients because of co-morbidities (e.g., advanced age, renal failure, alcohol abuse, hepatic failure) or use of concomitant medications (e.g., other lipid lowering drugs, inhibitors of the cytochrome P450 systemgg), which may increase the risk of adverse events 71. Second, some of these trials only enrolled patients after they had successfully completed a run-in period without complication. Third, because of a relatively short time frame, these randomized trials may fail to detect retarded adverse event as follow-up duration is relatively short. For instance, no excess risk of cancer due to statin utilization has been detected. However, on average the follow-up of participants has not been longer than 4.1 (1.9-5.3) years 7, quite a short period to assess cancer incidence. Longer follow-up would be helpful to determine whether new cancer events occur with time. This also underscores the importance of postmarketing surveillance studies to track complication rates and drug-discontinuation rates in usual clinical practice.
gg Statins that are metabolized predominantly by the cytochrome P-450 system can interact with other
drugs, some of which involve commonly prescribed drugs 1. Serum concentration of atorvastatin and simvastatin increases if used concomitantly with blockers of cytochrome P-3A4, while fluvastatine concentration increase with inhibitors of CYP2C9. Statins also vary in their propensity to cause drug interactions through other mechanisms (eg, by blocking organic anion transporter peptides) 70. The genetic polymorphisms within these systems also affect drug disposition and the likelihood of interactions.
62 Impact Policy statin KCE Reports 141
4.8 UNRESOLVED ISSUES Theoretically, the lower the LDL-C concentration, the lower the risk of CVD would be. However, the association between lowering LDL-C and reduction of CVD risk has been tested for lowering LDL-C by up to 1.89 mmol/l (73.1 mg/dL). Thus, the clinical benefit of lowering LDL-C more than that amount is unknown, the vast majority of the studies reporting on a LDL-C reduction in the range 0.51-1.42 mmol/l (20-55 mg/dL) 28.
Another important consideration relates to treatment duration as the effect size increases dramatically after the 1st year of treatment 2 3. Noteworthy, most of the systematic review excluded trials with a follow-up ≤1 year2, 3, 7, 8 (exclusion ≤2 years for 3). For instance, in the 24 trials where a mean reduction of 1 mmol/L of LDL-C was observed, the reduction (%) in risk of ischaemic heart disease eventshh was 19%, 31% and 30% after 1-2 years, 3-5 years and ≥ 6 years in trial at time of the event, respectively 2. The efficacy of therapy ≤1 year is unknown, but likely to be lower than the pooled estimates usually presented. The persistence of the protective effect once the treatment is stopped is also an aspect which is today not documented although plausible.
Effect modification by factors such as age, diabetes or sex has not been demonstrated 7. It is thus not possible to define today one group of people who would benefit most from long term statin use. However, identification of such target groups is important as statin intervention can present large benefits when targeting high risk individuals 72. Identification of target groups might be done by revising the criteria for starting a statin treatment or by the identification in the future of new biological/genetic/behavioural risk factors. Changes in lifestyle and diet may also be a cost-effective alternative to prevent CVD. There is an urgent need of testing rigorously comprehensive strategies that would allow such changes in our society. There is also a crucial need to redirect some of the public money towards health promotion.
hh Ischaemic Heart Disease death and non fatal myocardial infarction
KCE Reports 141 Impact Policy statin 63
5 APPENDICES 5.1 DATA SOURCES AND DEFINITIONS
IMA-AIM DATA (PHARMANET, HEALTH CARE DATA, POPULATION DATA)
IMA-AIM (Intermutualistisch Agentschap (IMA) – Agence Intermutualiste (AIM)) is a non-profit institution with all Belgian sickness funds as its members.
Sickness funds have individual patient data on patient characteristics, reimbursed services and pharmaceuticals delivered by pharmacists, at the detailed level of the service or the prescription. This information can be found in three databases:
• “Pharmanet” is the database specific to pharmaceutical products delivered in community pharmacies (not in hospital).
• The database “Health Care” contains all other reimbursed acts and pharmaceutical products.
• The “Population” database contains information on the demographic and socioeconomic profile of each of the sickness funds members.
These data are collected and made available by the IMA-AIM (Intermutualistic Agency).
HOSPITAL CLINICAL DATA (HCD) The registration of Hospital Clinical Data (HCD, MKG = ‘Minimale Klinische Gegevens / RCM = Résumé Clinique Minimum) is mandatory for every hospital in Belgium since 1991. This means that for each hospitalized patient, information such as date of birth, sex, postal code of domicile and other information such as length of hospital stay, hospital ward and bed type occupation etc., has to be recorded, along with ICD-9-CM (International classification of diseases, version 9, clinical modification (WHO)) encoding of relevant diagnoses as well as diagnostic and therapeutic procedures performed. Diagnosis and procedure codes are collected per attended hospital department, each coding for one primary and several secondary diagnoses. After stripping of direct patient-identifying information, records have to be sent biannually to the federal Ministry of Health (MoH - Federale Overheidsdienst Volksgezondheid, Veiligheid van de Voedselketen en Leefmilieu / Service Public Fédéral Santé publique, Sécurité de la Chaîne alimentaire et Environnement). Here all department registrations are concatenated with assignment of the principal diagnosis of the whole stay, determinant for the APrDRG-grouper software (All Patient refined Diagnostic Groups, version 15.0).
Since 1995 the HCD records are afterwards linked to the Hospital Billing Data (HBD - MFG = ‘Minimale Financiële Gegevens / RFM = Résumé Financier Minimum’), yearly transmitted by the national health insurance companies to the NIHDI and assembling all NIHDI remunerations for each hospital stay. HCD-HBD linkage is performed by a legally instituted ‘Technical Cell’ and requires separately sent matching tables containing for each identifiable hospital stay an unique patient pseudonym created by two separately executed hashings: the first one by the hospital or national health insurance companies respectively and the second one by an appointed security advisor of the MOH. Linkage process takes about 2 years to completion and full validation. Linkage percentages increased over the years and exceed nowadays 95% overall (Expressed as the fraction of the number of stays in HBD data as denominator; staycounts in HBD are always less than staycounts in HCD data since the latter cover all hospital stays, whether or not they were at the expense of the NIHDI.). This means that the relationship between treated pathology and the costs to the health care system can be studied for ‘in patient’ hospital admissions.
The advantage of the coupled HCD-HBD data is that registration is obligatory for all hospitals (HCD) and all national health insurance companies (HBD).
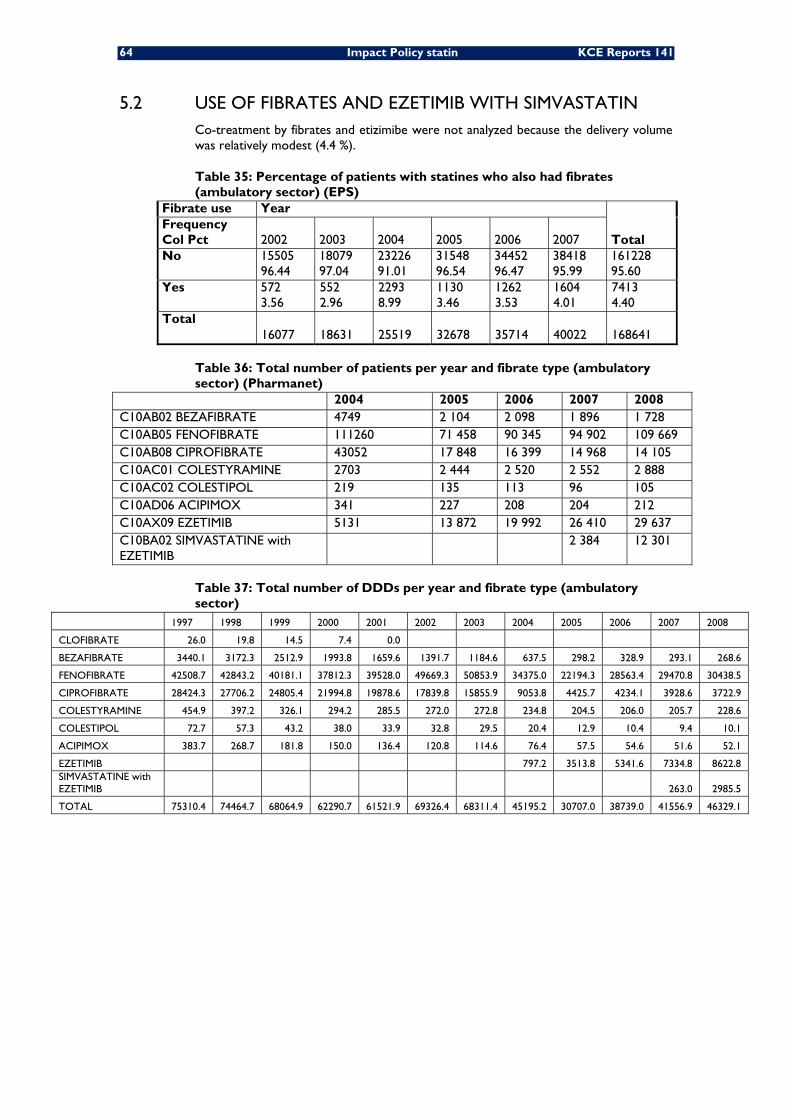
64 Impact Policy statin KCE Reports 141
5.2 USE OF FIBRATES AND EZETIMIB WITH SIMVASTATIN Co-treatment by fibrates and etizimibe were not analyzed because the delivery volume was relatively modest (4.4 %).
Table 35: Percentage of patients with statines who also had fibrates (ambulatory sector) (EPS)
Fibrate use Year
Total Frequency Col Pct 2002 2003 2004 2005 2006 2007 No 15505
96.44 18079 97.04
23226 91.01
31548 96.54
34452 96.47
38418 95.99
161228 95.60
Yes 572 3.56
552 2.96
2293 8.99
1130 3.46
1262 3.53
1604 4.01
7413 4.40
Total 16077 18631 25519 32678 35714 40022 168641
Table 36: Total number of patients per year and fibrate type (ambulatory sector) (Pharmanet)
2004 2005 2006 2007 2008 C10AB02 BEZAFIBRATE 4749 2 104 2 098 1 896 1 728 C10AB05 FENOFIBRATE 111260 71 458 90 345 94 902 109 669 C10AB08 CIPROFIBRATE 43052 17 848 16 399 14 968 14 105 C10AC01 COLESTYRAMINE 2703 2 444 2 520 2 552 2 888 C10AC02 COLESTIPOL 219 135 113 96 105 C10AD06 ACIPIMOX 341 227 208 204 212 C10AX09 EZETIMIB 5131 13 872 19 992 26 410 29 637 C10BA02 SIMVASTATINE with EZETIMIB
2 384 12 301
Table 37: Total number of DDDs per year and fibrate type (ambulatory sector)
1997 1998 1999 2000 2001 2002 2003 2004 2005 2006 2007 2008
CLOFIBRATE 26.0 19.8 14.5 7.4 0.0
BEZAFIBRATE 3440.1 3172.3 2512.9 1993.8 1659.6 1391.7 1184.6 637.5 298.2 328.9 293.1 268.6
FENOFIBRATE 42508.7 42843.2 40181.1 37812.3 39528.0 49669.3 50853.9 34375.0 22194.3 28563.4 29470.8 30438.5
CIPROFIBRATE 28424.3 27706.2 24805.4 21994.8 19878.6 17839.8 15855.9 9053.8 4425.7 4234.1 3928.6 3722.9
COLESTYRAMINE 454.9 397.2 326.1 294.2 285.5 272.0 272.8 234.8 204.5 206.0 205.7 228.6
COLESTIPOL 72.7 57.3 43.2 38.0 33.9 32.8 29.5 20.4 12.9 10.4 9.4 10.1
ACIPIMOX 383.7 268.7 181.8 150.0 136.4 120.8 114.6 76.4 57.5 54.6 51.6 52.1
EZETIMIB 797.2 3513.8 5341.6 7334.8 8622.8 SIMVASTATINE with EZETIMIB 263.0 2985.5
TOTAL 75310.4 74464.7 68064.9 62290.7 61521.9 69326.4 68311.4 45195.2 30707.0 38739.0 41556.9 46329.1
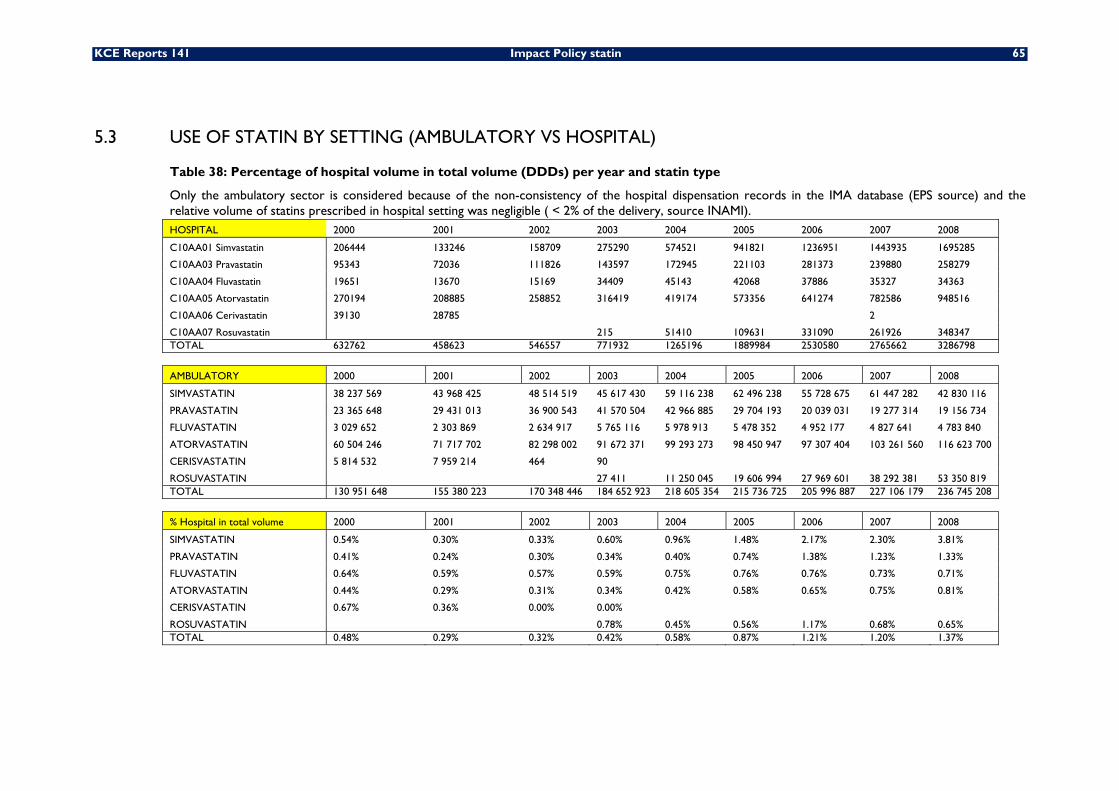
KCE Reports 141 Impact Policy statin 65
5.3 USE OF STATIN BY SETTING (AMBULATORY VS HOSPITAL)
Table 38: Percentage of hospital volume in total volume (DDDs) per year and statin type
Only the ambulatory sector is considered because of the non-consistency of the hospital dispensation records in the IMA database (EPS source) and the relative volume of statins prescribed in hospital setting was negligible ( < 2% of the delivery, source INAMI). HOSPITAL 2000 2001 2002 2003 2004 2005 2006 2007 2008
C10AA01 Simvastatin 206444 133246 158709 275290 574521 941821 1236951 1443935 1695285
C10AA03 Pravastatin 95343 72036 111826 143597 172945 221103 281373 239880 258279
C10AA04 Fluvastatin 19651 13670 15169 34409 45143 42068 37886 35327 34363
C10AA05 Atorvastatin 270194 208885 258852 316419 419174 573356 641274 782586 948516
C10AA06 Cerivastatin 39130 28785 2
C10AA07 Rosuvastatin 215 51410 109631 331090 261926 348347 TOTAL 632762 458623 546557 771932 1265196 1889984 2530580 2765662 3286798
AMBULATORY 2000 2001 2002 2003 2004 2005 2006 2007 2008
SIMVASTATIN 38 237 569 43 968 425 48 514 519 45 617 430 59 116 238 62 496 238 55 728 675 61 447 282 42 830 116
PRAVASTATIN 23 365 648 29 431 013 36 900 543 41 570 504 42 966 885 29 704 193 20 039 031 19 277 314 19 156 734
FLUVASTATIN 3 029 652 2 303 869 2 634 917 5 765 116 5 978 913 5 478 352 4 952 177 4 827 641 4 783 840
ATORVASTATIN 60 504 246 71 717 702 82 298 002 91 672 371 99 293 273 98 450 947 97 307 404 103 261 560 116 623 700
CERISVASTATIN 5 814 532 7 959 214 464 90
ROSUVASTATIN 27 411 11 250 045 19 606 994 27 969 601 38 292 381 53 350 819 TOTAL 130 951 648 155 380 223 170 348 446 184 652 923 218 605 354 215 736 725 205 996 887 227 106 179 236 745 208
% Hospital in total volume 2000 2001 2002 2003 2004 2005 2006 2007 2008
SIMVASTATIN 0.54% 0.30% 0.33% 0.60% 0.96% 1.48% 2.17% 2.30% 3.81%
PRAVASTATIN 0.41% 0.24% 0.30% 0.34% 0.40% 0.74% 1.38% 1.23% 1.33%
FLUVASTATIN 0.64% 0.59% 0.57% 0.59% 0.75% 0.76% 0.76% 0.73% 0.71%
ATORVASTATIN 0.44% 0.29% 0.31% 0.34% 0.42% 0.58% 0.65% 0.75% 0.81%
CERISVASTATIN 0.67% 0.36% 0.00% 0.00%
ROSUVASTATIN 0.78% 0.45% 0.56% 1.17% 0.68% 0.65% TOTAL 0.48% 0.29% 0.32% 0.42% 0.58% 0.87% 1.21% 1.20% 1.37%
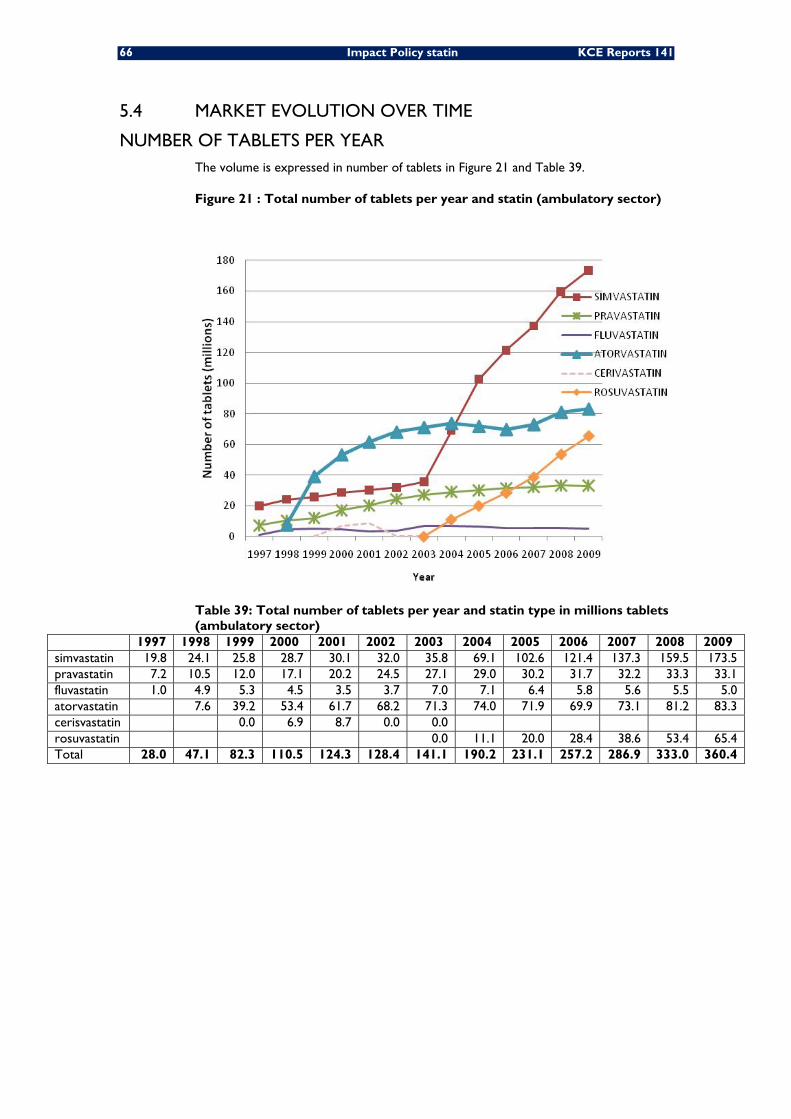
66 Impact Policy statin KCE Reports 141
5.4 MARKET EVOLUTION OVER TIME
NUMBER OF TABLETS PER YEAR The volume is expressed in number of tablets in Figure 21 and Table 39.
Figure 21 : Total number of tablets per year and statin (ambulatory sector)
Table 39: Total number of tablets per year and statin type in millions tablets (ambulatory sector)
1997 1998 1999 2000 2001 2002 2003 2004 2005 2006 2007 2008 2009 simvastatin 19.8 24.1 25.8 28.7 30.1 32.0 35.8 69.1 102.6 121.4 137.3 159.5 173.5 pravastatin 7.2 10.5 12.0 17.1 20.2 24.5 27.1 29.0 30.2 31.7 32.2 33.3 33.1 fluvastatin 1.0 4.9 5.3 4.5 3.5 3.7 7.0 7.1 6.4 5.8 5.6 5.5 5.0 atorvastatin 7.6 39.2 53.4 61.7 68.2 71.3 74.0 71.9 69.9 73.1 81.2 83.3 cerisvastatin 0.0 6.9 8.7 0.0 0.0 rosuvastatin 0.0 11.1 20.0 28.4 38.6 53.4 65.4 Total 28.0 47.1 82.3 110.5 124.3 128.4 141.1 190.2 231.1 257.2 286.9 333.0 360.4
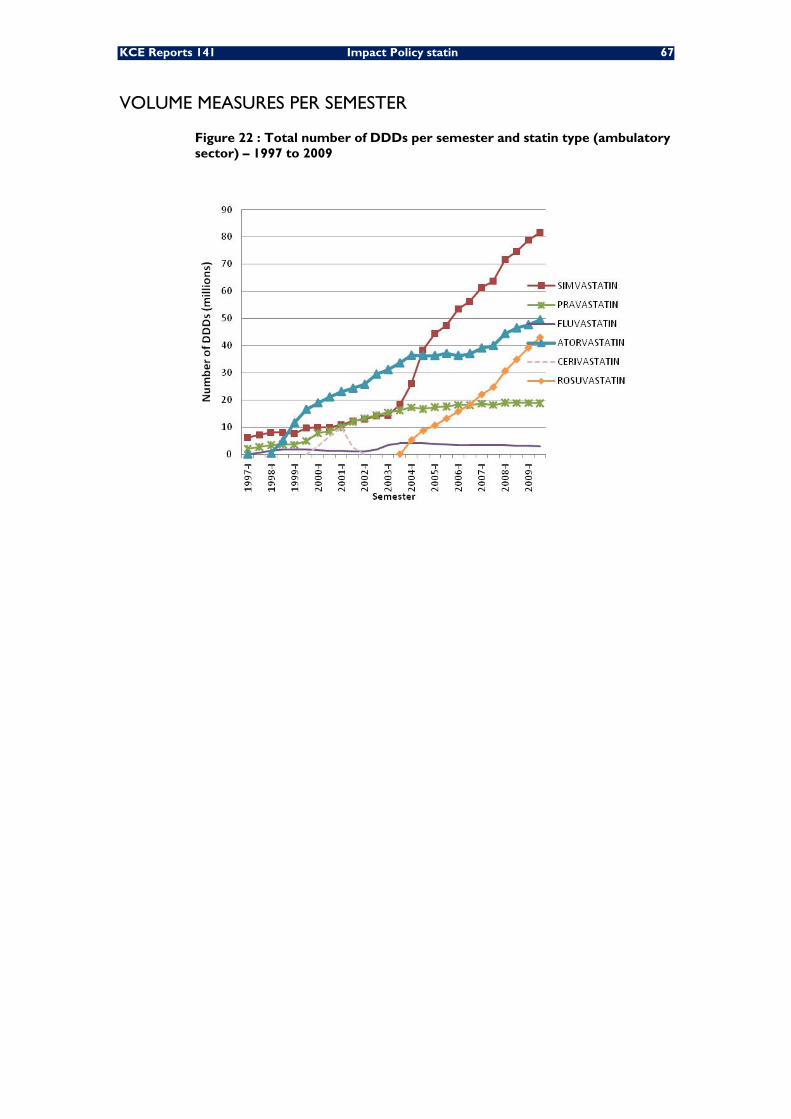
KCE Reports 141 Impact Policy statin 67
VOLUME MEASURES PER SEMESTER
Figure 22 : Total number of DDDs per semester and statin type (ambulatory sector) – 1997 to 2009
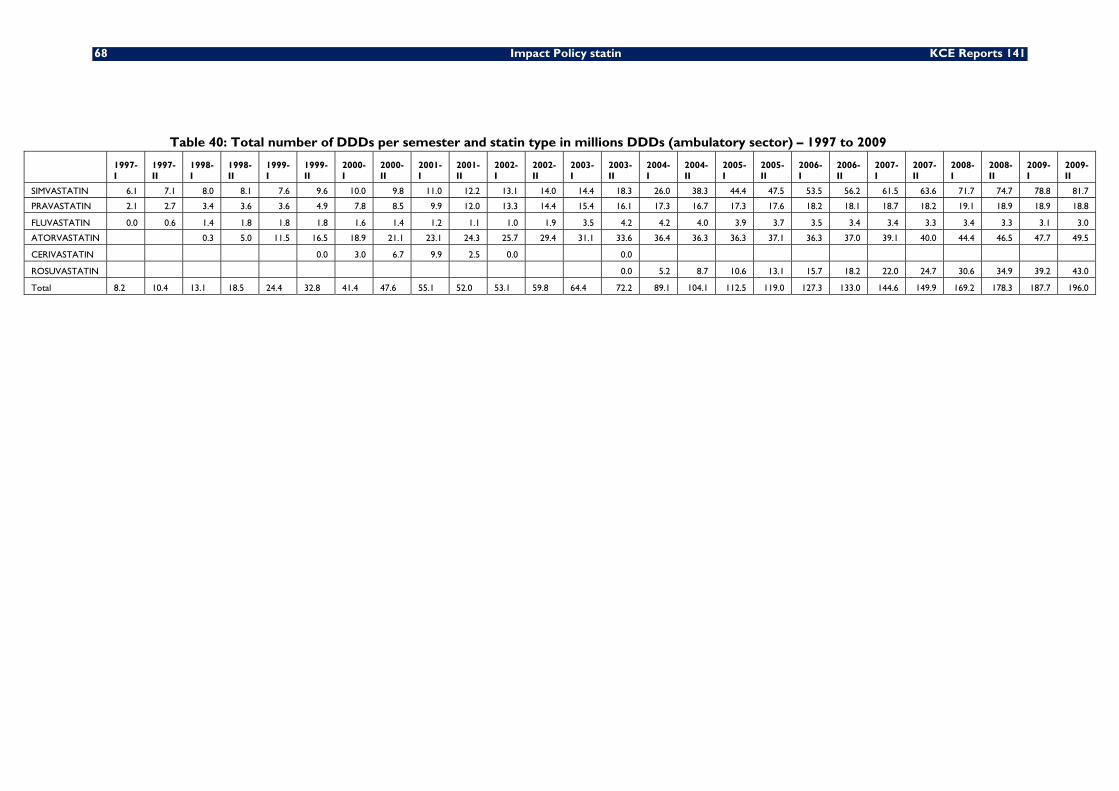
68 Impact Policy statin KCE Reports 141
Table 40: Total number of DDDs per semester and statin type in millions DDDs (ambulatory sector) – 1997 to 2009
1997-I
1997-II
1998-I
1998-II
1999-I
1999-II
2000-I
2000-II
2001-I
2001-II
2002-I
2002-II
2003-I
2003-II
2004-I
2004-II
2005-I
2005-II
2006-I
2006-II
2007-I
2007-II
2008-I
2008-II
2009-I
2009-II
SIMVASTATIN 6.1 7.1 8.0 8.1 7.6 9.6 10.0 9.8 11.0 12.2 13.1 14.0 14.4 18.3 26.0 38.3 44.4 47.5 53.5 56.2 61.5 63.6 71.7 74.7 78.8 81.7
PRAVASTATIN 2.1 2.7 3.4 3.6 3.6 4.9 7.8 8.5 9.9 12.0 13.3 14.4 15.4 16.1 17.3 16.7 17.3 17.6 18.2 18.1 18.7 18.2 19.1 18.9 18.9 18.8
FLUVASTATIN 0.0 0.6 1.4 1.8 1.8 1.8 1.6 1.4 1.2 1.1 1.0 1.9 3.5 4.2 4.2 4.0 3.9 3.7 3.5 3.4 3.4 3.3 3.4 3.3 3.1 3.0
ATORVASTATIN 0.3 5.0 11.5 16.5 18.9 21.1 23.1 24.3 25.7 29.4 31.1 33.6 36.4 36.3 36.3 37.1 36.3 37.0 39.1 40.0 44.4 46.5 47.7 49.5
CERIVASTATIN 0.0 3.0 6.7 9.9 2.5 0.0 0.0
ROSUVASTATIN 0.0 5.2 8.7 10.6 13.1 15.7 18.2 22.0 24.7 30.6 34.9 39.2 43.0
Total 8.2 10.4 13.1 18.5 24.4 32.8 41.4 47.6 55.1 52.0 53.1 59.8 64.4 72.2 89.1 104.1 112.5 119.0 127.3 133.0 144.6 149.9 169.2 178.3 187.7 196.0
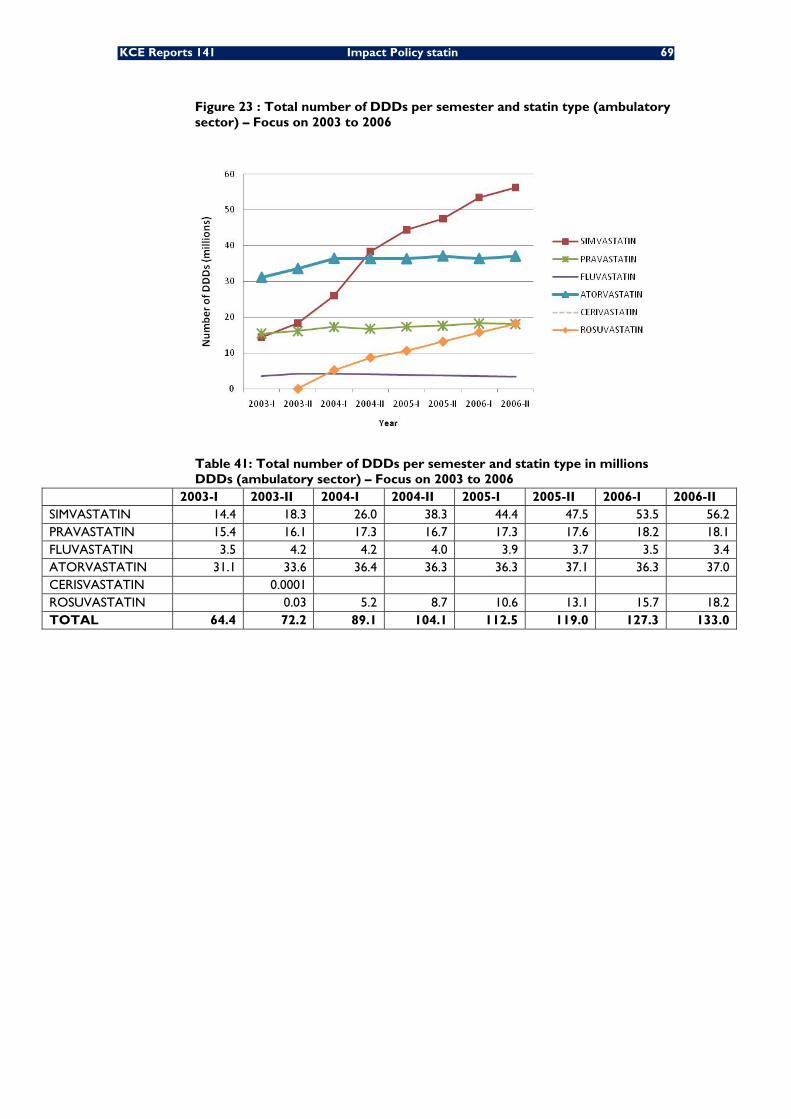
KCE Reports 141 Impact Policy statin 69
Figure 23 : Total number of DDDs per semester and statin type (ambulatory sector) – Focus on 2003 to 2006
Table 41: Total number of DDDs per semester and statin type in millions DDDs (ambulatory sector) – Focus on 2003 to 2006
2003-I 2003-II 2004-I 2004-II 2005-I 2005-II 2006-I 2006-II SIMVASTATIN 14.4 18.3 26.0 38.3 44.4 47.5 53.5 56.2 PRAVASTATIN 15.4 16.1 17.3 16.7 17.3 17.6 18.2 18.1 FLUVASTATIN 3.5 4.2 4.2 4.0 3.9 3.7 3.5 3.4 ATORVASTATIN 31.1 33.6 36.4 36.3 36.3 37.1 36.3 37.0 CERISVASTATIN 0.0001 ROSUVASTATIN 0.03 5.2 8.7 10.6 13.1 15.7 18.2 TOTAL 64.4 72.2 89.1 104.1 112.5 119.0 127.3 133.0
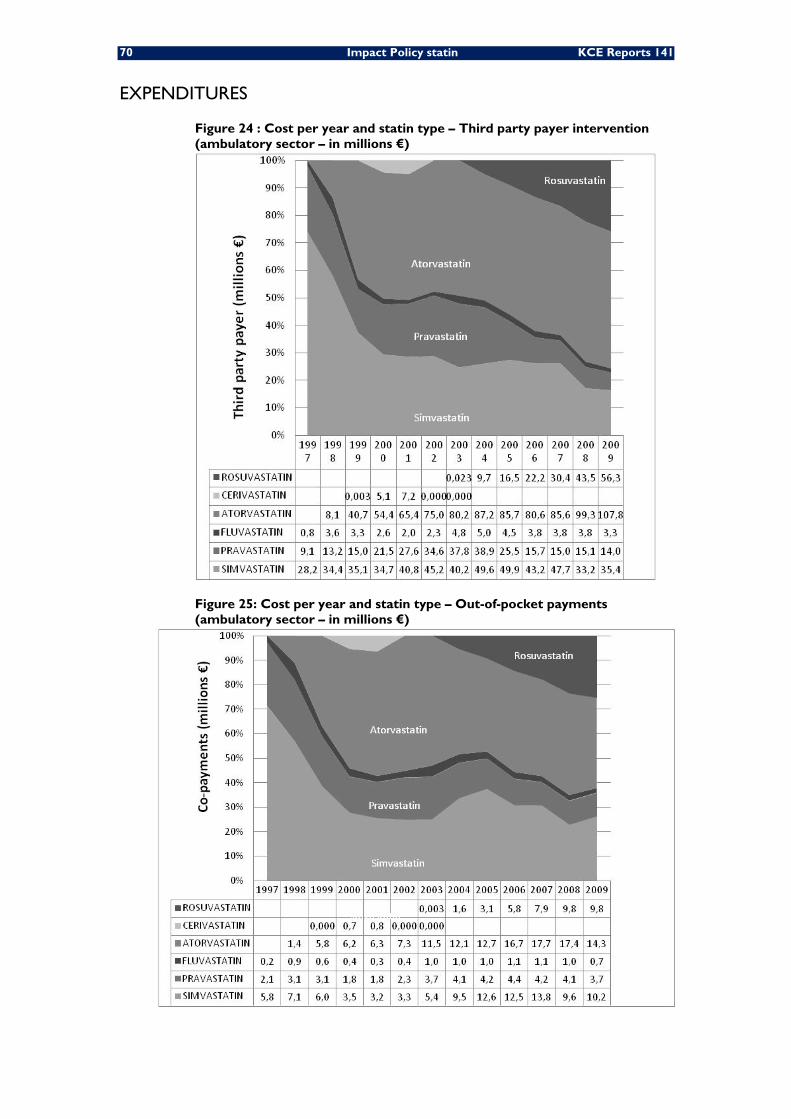
70 Impact Policy statin KCE Reports 141
EXPENDITURES
Figure 24 : Cost per year and statin type – Third party payer intervention (ambulatory sector – in millions €)
Figure 25: Cost per year and statin type – Out-of-pocket payments (ambulatory sector – in millions €)
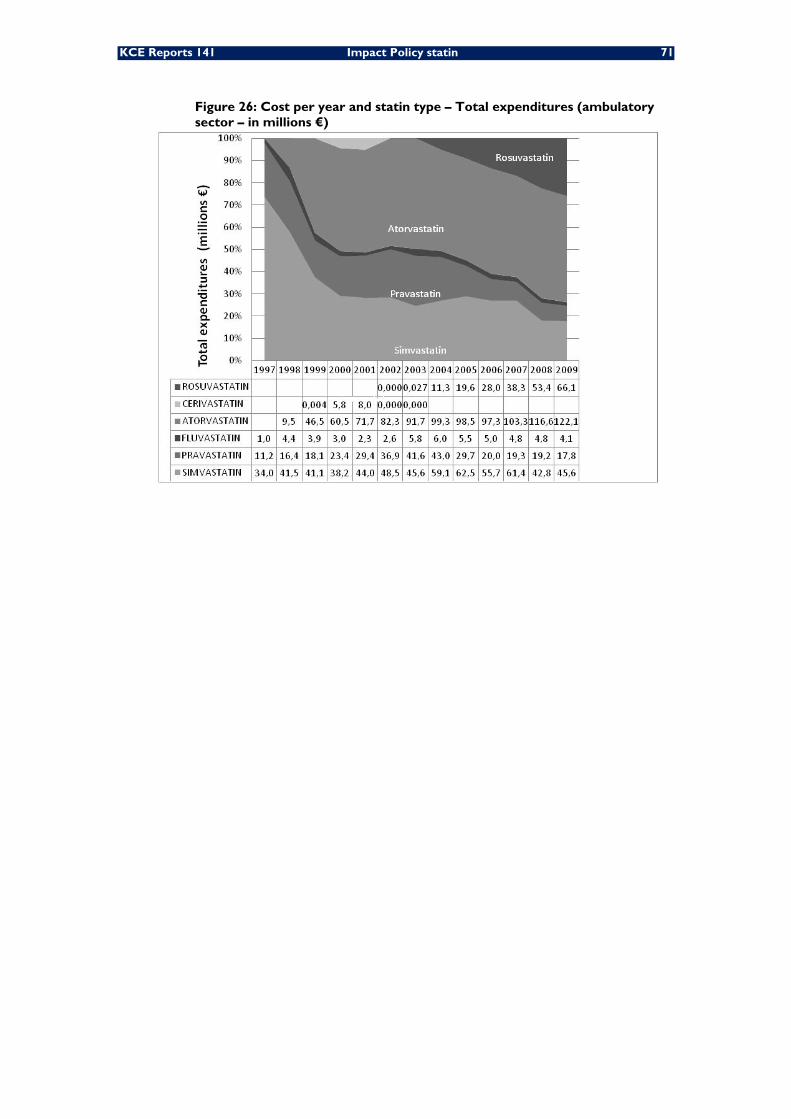
KCE Reports 141 Impact Policy statin 71
Figure 26: Cost per year and statin type – Total expenditures (ambulatory sector – in millions €)
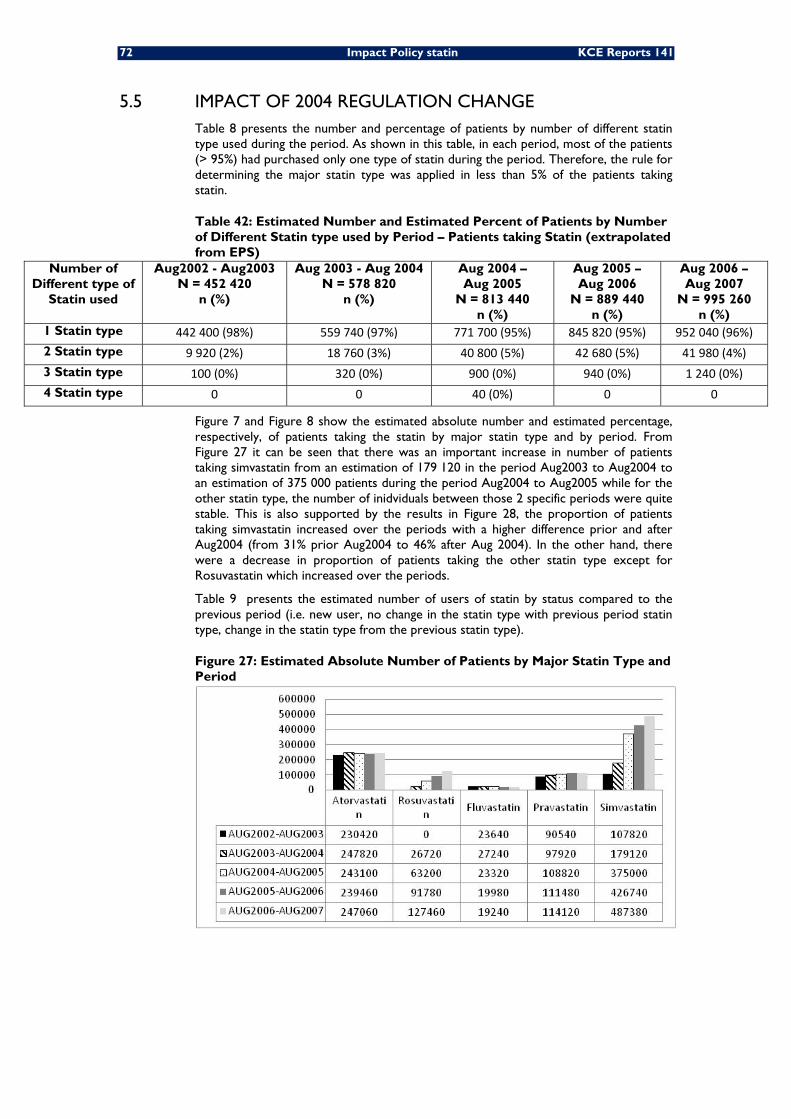
72 Impact Policy statin KCE Reports 141
5.5 IMPACT OF 2004 REGULATION CHANGE Table 8 presents the number and percentage of patients by number of different statin type used during the period. As shown in this table, in each period, most of the patients (> 95%) had purchased only one type of statin during the period. Therefore, the rule for determining the major statin type was applied in less than 5% of the patients taking statin.
Table 42: Estimated Number and Estimated Percent of Patients by Number of Different Statin type used by Period – Patients taking Statin (extrapolated from EPS)
Number of Different type of
Statin used
Aug2002 - Aug2003 N = 452 420
n (%)
Aug 2003 - Aug 2004 N = 578 820
n (%)
Aug 2004 – Aug 2005
N = 813 440 n (%)
Aug 2005 – Aug 2006
N = 889 440 n (%)
Aug 2006 – Aug 2007
N = 995 260 n (%)
1 Statin type 442 400 (98%) 559 740 (97%) 771 700 (95%) 845 820 (95%) 952 040 (96%)2 Statin type 9 920 (2%) 18 760 (3%) 40 800 (5%) 42 680 (5%) 41 980 (4%)3 Statin type 100 (0%) 320 (0%) 900 (0%) 940 (0%) 1 240 (0%)4 Statin type 0 0 40 (0%) 0 0
Figure 7 and Figure 8 show the estimated absolute number and estimated percentage, respectively, of patients taking the statin by major statin type and by period. From Figure 27 it can be seen that there was an important increase in number of patients taking simvastatin from an estimation of 179 120 in the period Aug2003 to Aug2004 to an estimation of 375 000 patients during the period Aug2004 to Aug2005 while for the other statin type, the number of inidviduals between those 2 specific periods were quite stable. This is also supported by the results in Figure 28, the proportion of patients taking simvastatin increased over the periods with a higher difference prior and after Aug2004 (from 31% prior Aug2004 to 46% after Aug 2004). In the other hand, there were a decrease in proportion of patients taking the other statin type except for Rosuvastatin which increased over the periods.
Table 9 presents the estimated number of users of statin by status compared to the previous period (i.e. new user, no change in the statin type with previous period statin type, change in the statin type from the previous statin type).
Figure 27: Estimated Absolute Number of Patients by Major Statin Type and Period
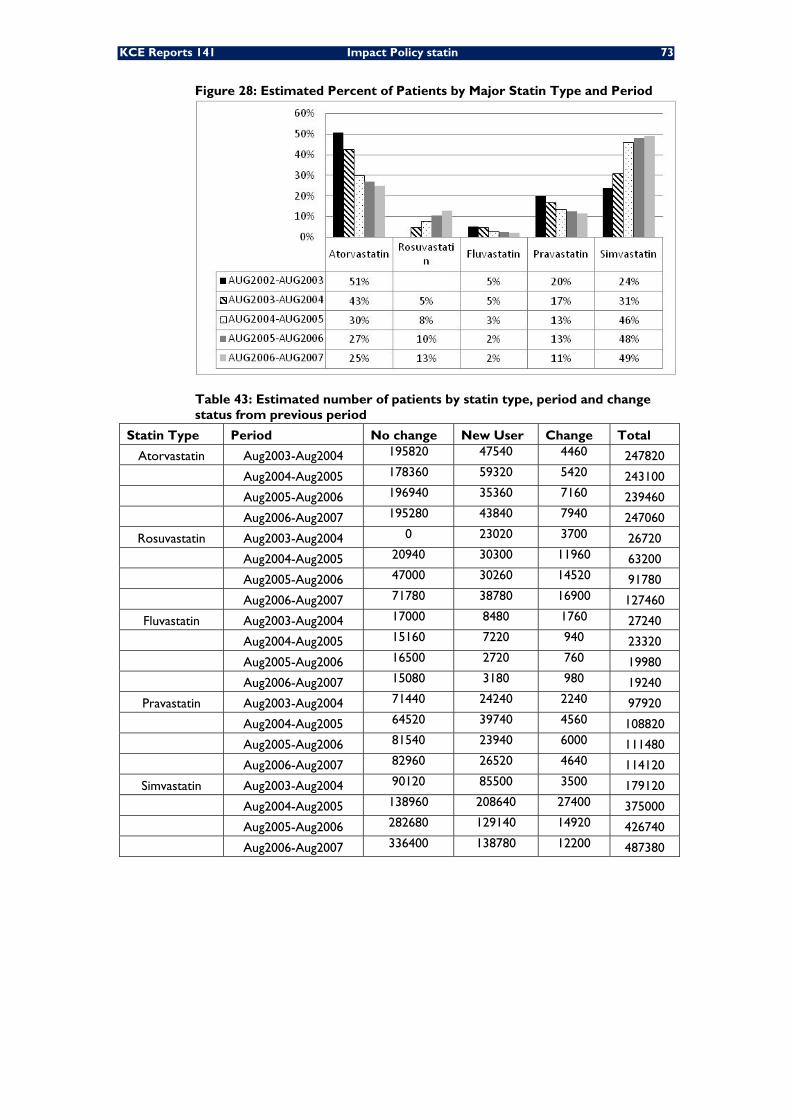
KCE Reports 141 Impact Policy statin 73
Figure 28: Estimated Percent of Patients by Major Statin Type and Period
Table 43: Estimated number of patients by statin type, period and change status from previous period
Statin Type Period No change New User Change Total
Atorvastatin Aug2003-Aug2004 195820 47540 4460 247820
Aug2004-Aug2005 178360 59320 5420 243100
Aug2005-Aug2006 196940 35360 7160 239460
Aug2006-Aug2007 195280 43840 7940 247060
Rosuvastatin Aug2003-Aug2004 0 23020 3700 26720
Aug2004-Aug2005 20940 30300 11960 63200
Aug2005-Aug2006 47000 30260 14520 91780
Aug2006-Aug2007 71780 38780 16900 127460
Fluvastatin Aug2003-Aug2004 17000 8480 1760 27240
Aug2004-Aug2005 15160 7220 940 23320
Aug2005-Aug2006 16500 2720 760 19980
Aug2006-Aug2007 15080 3180 980 19240
Pravastatin Aug2003-Aug2004 71440 24240 2240 97920
Aug2004-Aug2005 64520 39740 4560 108820
Aug2005-Aug2006 81540 23940 6000 111480
Aug2006-Aug2007 82960 26520 4640 114120
Simvastatin Aug2003-Aug2004 90120 85500 3500 179120
Aug2004-Aug2005 138960 208640 27400 375000
Aug2005-Aug2006 282680 129140 14920 426740
Aug2006-Aug2007 336400 138780 12200 487380
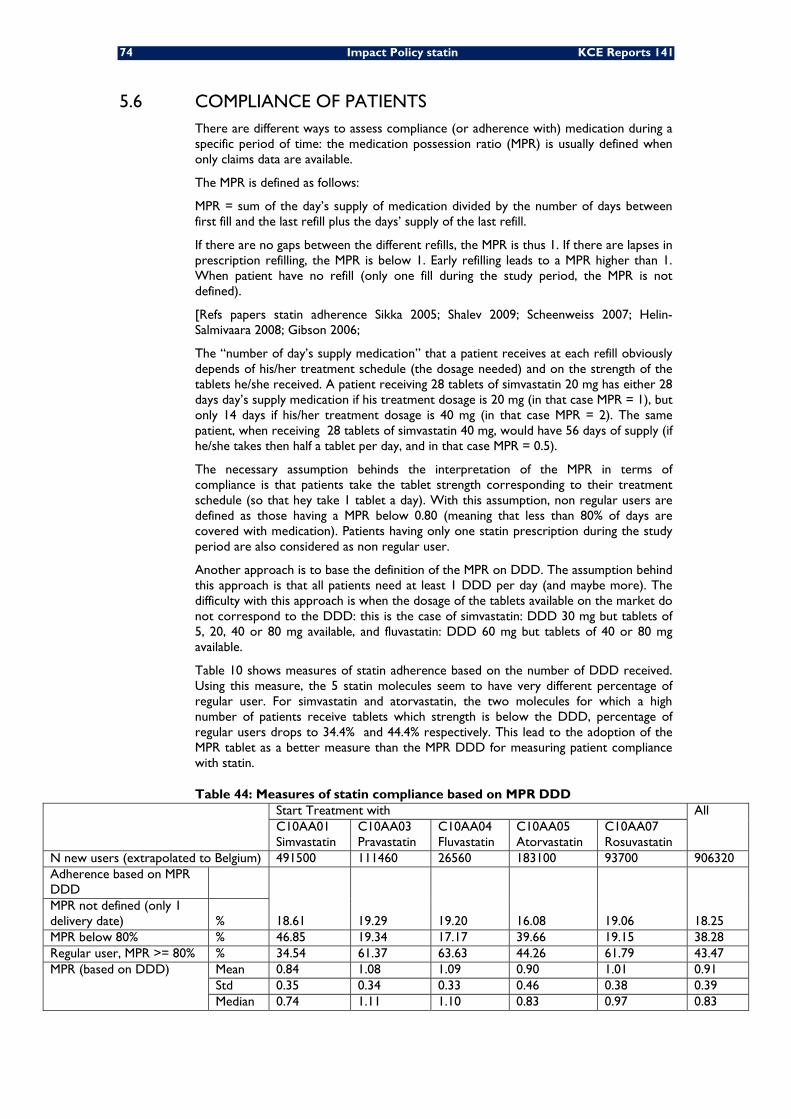
74 Impact Policy statin KCE Reports 141
5.6 COMPLIANCE OF PATIENTS There are different ways to assess compliance (or adherence with) medication during a specific period of time: the medication possession ratio (MPR) is usually defined when only claims data are available.
The MPR is defined as follows:
MPR = sum of the day’s supply of medication divided by the number of days between first fill and the last refill plus the days’ supply of the last refill.
If there are no gaps between the different refills, the MPR is thus 1. If there are lapses in prescription refilling, the MPR is below 1. Early refilling leads to a MPR higher than 1. When patient have no refill (only one fill during the study period, the MPR is not defined).
[Refs papers statin adherence Sikka 2005; Shalev 2009; Scheenweiss 2007; Helin-Salmivaara 2008; Gibson 2006;
The “number of day’s supply medication” that a patient receives at each refill obviously depends of his/her treatment schedule (the dosage needed) and on the strength of the tablets he/she received. A patient receiving 28 tablets of simvastatin 20 mg has either 28 days day’s supply medication if his treatment dosage is 20 mg (in that case MPR = 1), but only 14 days if his/her treatment dosage is 40 mg (in that case MPR = 2). The same patient, when receiving 28 tablets of simvastatin 40 mg, would have 56 days of supply (if he/she takes then half a tablet per day, and in that case MPR = 0.5).
The necessary assumption behinds the interpretation of the MPR in terms of compliance is that patients take the tablet strength corresponding to their treatment schedule (so that hey take 1 tablet a day). With this assumption, non regular users are defined as those having a MPR below 0.80 (meaning that less than 80% of days are covered with medication). Patients having only one statin prescription during the study period are also considered as non regular user.
Another approach is to base the definition of the MPR on DDD. The assumption behind this approach is that all patients need at least 1 DDD per day (and maybe more). The difficulty with this approach is when the dosage of the tablets available on the market do not correspond to the DDD: this is the case of simvastatin: DDD 30 mg but tablets of 5, 20, 40 or 80 mg available, and fluvastatin: DDD 60 mg but tablets of 40 or 80 mg available.
Table 10 shows measures of statin adherence based on the number of DDD received. Using this measure, the 5 statin molecules seem to have very different percentage of regular user. For simvastatin and atorvastatin, the two molecules for which a high number of patients receive tablets which strength is below the DDD, percentage of regular users drops to 34.4% and 44.4% respectively. This lead to the adoption of the MPR tablet as a better measure than the MPR DDD for measuring patient compliance with statin.
Table 44: Measures of statin compliance based on MPR DDD Start Treatment with All
C10AA01 Simvastatin
C10AA03 Pravastatin
C10AA04 Fluvastatin
C10AA05 Atorvastatin
C10AA07 Rosuvastatin
N new users (extrapolated to Belgium) 491500 111460 26560 183100 93700 906320 Adherence based on MPR DDD
18.61 19.29 19.20 16.08 19.06 18.25 MPR not defined (only 1 delivery date) % MPR below 80% % 46.85 19.34 17.17 39.66 19.15 38.28 Regular user, MPR >= 80% % 34.54 61.37 63.63 44.26 61.79 43.47 MPR (based on DDD) Mean 0.84 1.08 1.09 0.90 1.01 0.91
Std 0.35 0.34 0.33 0.46 0.38 0.39 Median 0.74 1.11 1.10 0.83 0.97 0.83
KCE Reports 141 Impact Policy Statin 75
5.7 SECONDARY PREVENTION
DEFINITION OF HOSPITALIZATION FOR CARDIOVASCULAR REASON
Cardiovascular disease (CVD) is disease of the heart and blood vessels, which can lead to cardiovascular events such as heart attack (myocardial infarction) and stroke. The most common form of CVD is coronary heart disease (CHD), which can result in angina and heart attack. Other forms of CVD are stroke, transient ischaemic attack and peripheral arterial disease.
Every hospitalisation discharged between 2002 and 2006 for a cardiovascular reason was initially selected. A cardiovascular reason was defined when the first three digits of the principal diagnosis equal to one of the following codes:
a cardiovascular “event” was defined as an hospitalisation. We considered
• 410 Acute myocardial infarction (AMI)
• 411 Other acute and subacute forms of ischemic heart disease
• 412 Old myocardial infarction
• 413 Angina pectoris
• 414 Other forms of chronic ischemic heart disease
• 430 Subarachnoid hemorrhage
• 431 Intracerebral hemorrhage
• 432 Other and unspecified intracranial hemorrhage
• 433 Occlusion and stenosis of precerebral arteries
• 434 Occlusion of cerebral arteries
• 435 Transient cerebral ischemia
• 436 Acute, but ill-defined, cerebrovascular disease
• 437 Other and ill-defined cerebrovascular disease
• 438 Late effects of cerebrovascular disease
• 440 Atherosclerosis
• 441 Aortic aneurysm and dissection
The discharge date was conventionally chosen as the cardiovascular event date. For privacy reasons, the exact discharge date is not recorded in the HCD; but the year, the month and the day of the week (e.g. monday) are available.
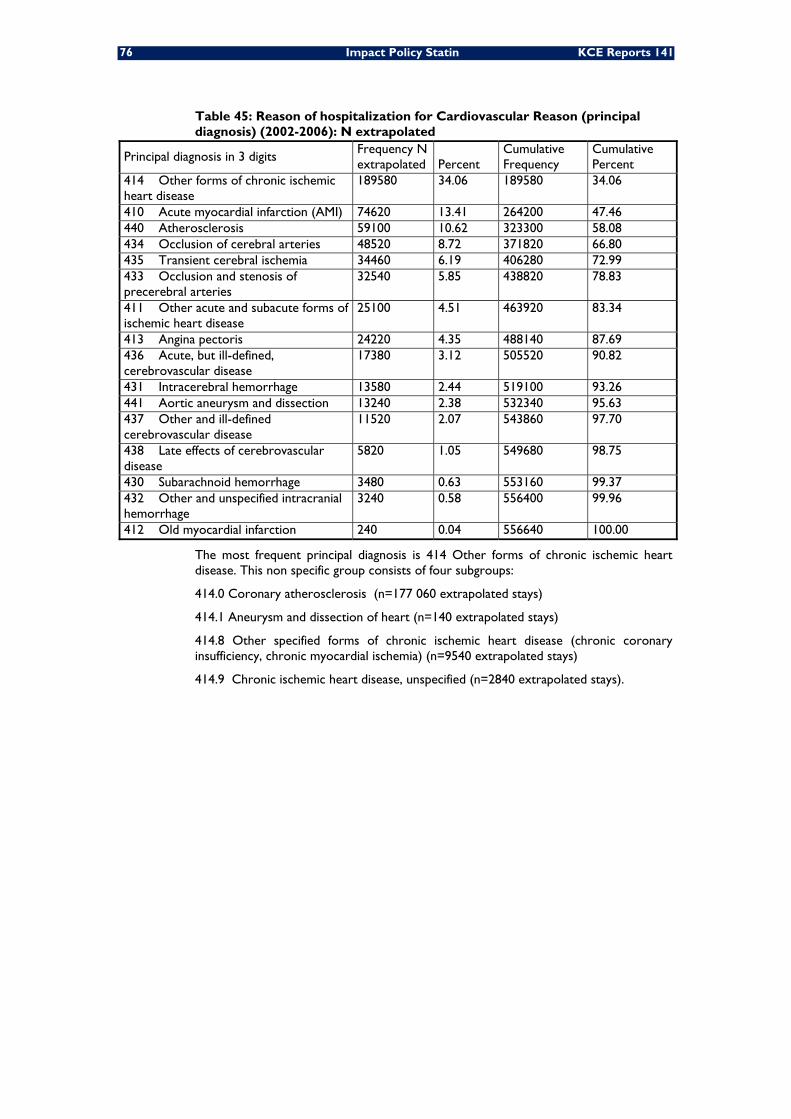
76 Impact Policy Statin KCE Reports 141
Table 45: Reason of hospitalization for Cardiovascular Reason (principal diagnosis) (2002-2006): N extrapolated
Principal diagnosis in 3 digits Frequency N extrapolated Percent
Cumulative Frequency
Cumulative Percent
414 Other forms of chronic ischemic heart disease
189580 34.06 189580 34.06
410 Acute myocardial infarction (AMI) 74620 13.41 264200 47.46 440 Atherosclerosis 59100 10.62 323300 58.08 434 Occlusion of cerebral arteries 48520 8.72 371820 66.80 435 Transient cerebral ischemia 34460 6.19 406280 72.99 433 Occlusion and stenosis of precerebral arteries
32540 5.85 438820 78.83
411 Other acute and subacute forms of ischemic heart disease
25100 4.51 463920 83.34
413 Angina pectoris 24220 4.35 488140 87.69 436 Acute, but ill-defined, cerebrovascular disease
17380 3.12 505520 90.82
431 Intracerebral hemorrhage 13580 2.44 519100 93.26 441 Aortic aneurysm and dissection 13240 2.38 532340 95.63 437 Other and ill-defined cerebrovascular disease
11520 2.07 543860 97.70
438 Late effects of cerebrovascular disease
5820 1.05 549680 98.75
430 Subarachnoid hemorrhage 3480 0.63 553160 99.37 432 Other and unspecified intracranial hemorrhage
3240 0.58 556400 99.96
412 Old myocardial infarction 240 0.04 556640 100.00
The most frequent principal diagnosis is 414 Other forms of chronic ischemic heart disease. This non specific group consists of four subgroups:
414.0 Coronary atherosclerosis (n=177 060 extrapolated stays)
414.1 Aneurysm and dissection of heart (n=140 extrapolated stays)
414.8 Other specified forms of chronic ischemic heart disease (chronic coronary insufficiency, chronic myocardial ischemia) (n=9540 extrapolated stays)
414.9 Chronic ischemic heart disease, unspecified (n=2840 extrapolated stays).
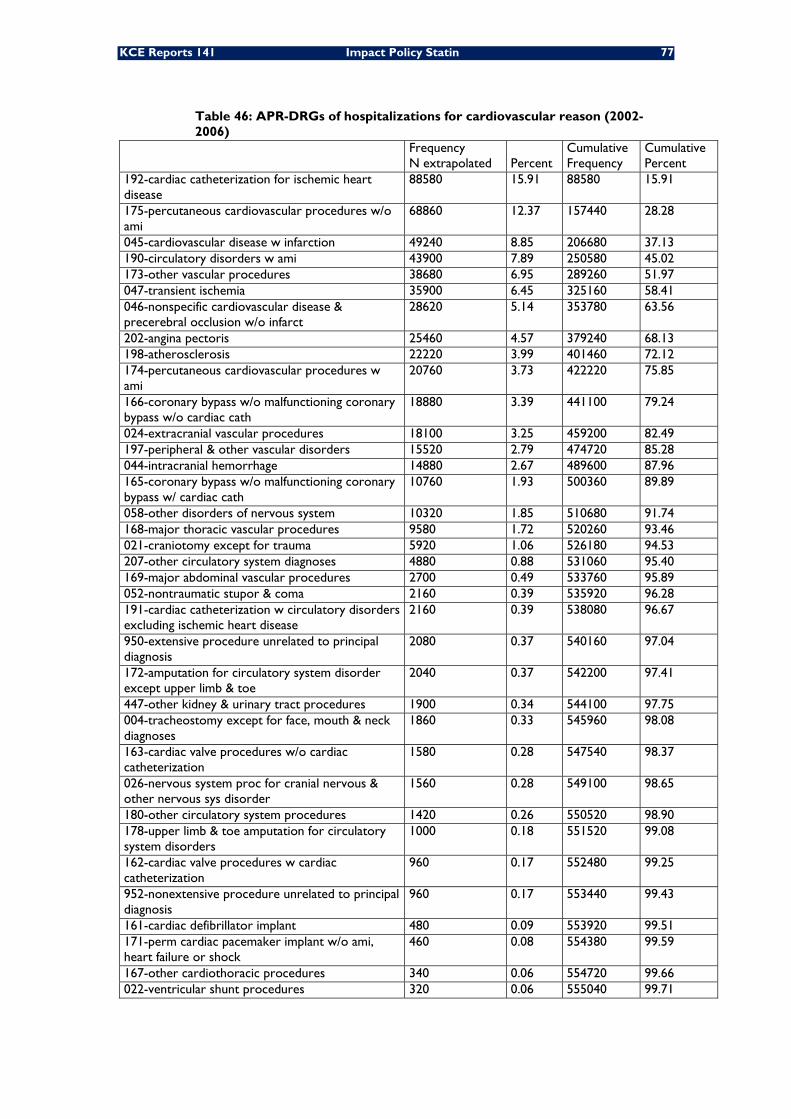
KCE Reports 141 Impact Policy Statin 77
Table 46: APR-DRGs of hospitalizations for cardiovascular reason (2002-2006)
Frequency N extrapolated Percent
Cumulative Frequency
Cumulative Percent
192-cardiac catheterization for ischemic heart disease
88580 15.91 88580 15.91
175-percutaneous cardiovascular procedures w/o ami
68860 12.37 157440 28.28
045-cardiovascular disease w infarction 49240 8.85 206680 37.13 190-circulatory disorders w ami 43900 7.89 250580 45.02 173-other vascular procedures 38680 6.95 289260 51.97 047-transient ischemia 35900 6.45 325160 58.41 046-nonspecific cardiovascular disease & precerebral occlusion w/o infarct
28620 5.14 353780 63.56
202-angina pectoris 25460 4.57 379240 68.13 198-atherosclerosis 22220 3.99 401460 72.12 174-percutaneous cardiovascular procedures w ami
20760 3.73 422220 75.85
166-coronary bypass w/o malfunctioning coronary bypass w/o cardiac cath
18880 3.39 441100 79.24
024-extracranial vascular procedures 18100 3.25 459200 82.49 197-peripheral & other vascular disorders 15520 2.79 474720 85.28 044-intracranial hemorrhage 14880 2.67 489600 87.96 165-coronary bypass w/o malfunctioning coronary bypass w/ cardiac cath
10760 1.93 500360 89.89
058-other disorders of nervous system 10320 1.85 510680 91.74 168-major thoracic vascular procedures 9580 1.72 520260 93.46 021-craniotomy except for trauma 5920 1.06 526180 94.53 207-other circulatory system diagnoses 4880 0.88 531060 95.40 169-major abdominal vascular procedures 2700 0.49 533760 95.89 052-nontraumatic stupor & coma 2160 0.39 535920 96.28 191-cardiac catheterization w circulatory disorders excluding ischemic heart disease
2160 0.39 538080 96.67
950-extensive procedure unrelated to principal diagnosis
2080 0.37 540160 97.04
172-amputation for circulatory system disorder except upper limb & toe
2040 0.37 542200 97.41
447-other kidney & urinary tract procedures 1900 0.34 544100 97.75 004-tracheostomy except for face, mouth & neck diagnoses
1860 0.33 545960 98.08
163-cardiac valve procedures w/o cardiac catheterization
1580 0.28 547540 98.37
026-nervous system proc for cranial nervous & other nervous sys disorder
1560 0.28 549100 98.65
180-other circulatory system procedures 1420 0.26 550520 98.90 178-upper limb & toe amputation for circulatory system disorders
1000 0.18 551520 99.08
162-cardiac valve procedures w cardiac catheterization
960 0.17 552480 99.25
952-nonextensive procedure unrelated to principal diagnosis
960 0.17 553440 99.43
161-cardiac defibrillator implant 480 0.09 553920 99.51 171-perm cardiac pacemaker implant w/o ami, heart failure or shock
460 0.08 554380 99.59
167-other cardiothoracic procedures 340 0.06 554720 99.66 022-ventricular shunt procedures 320 0.06 555040 99.71
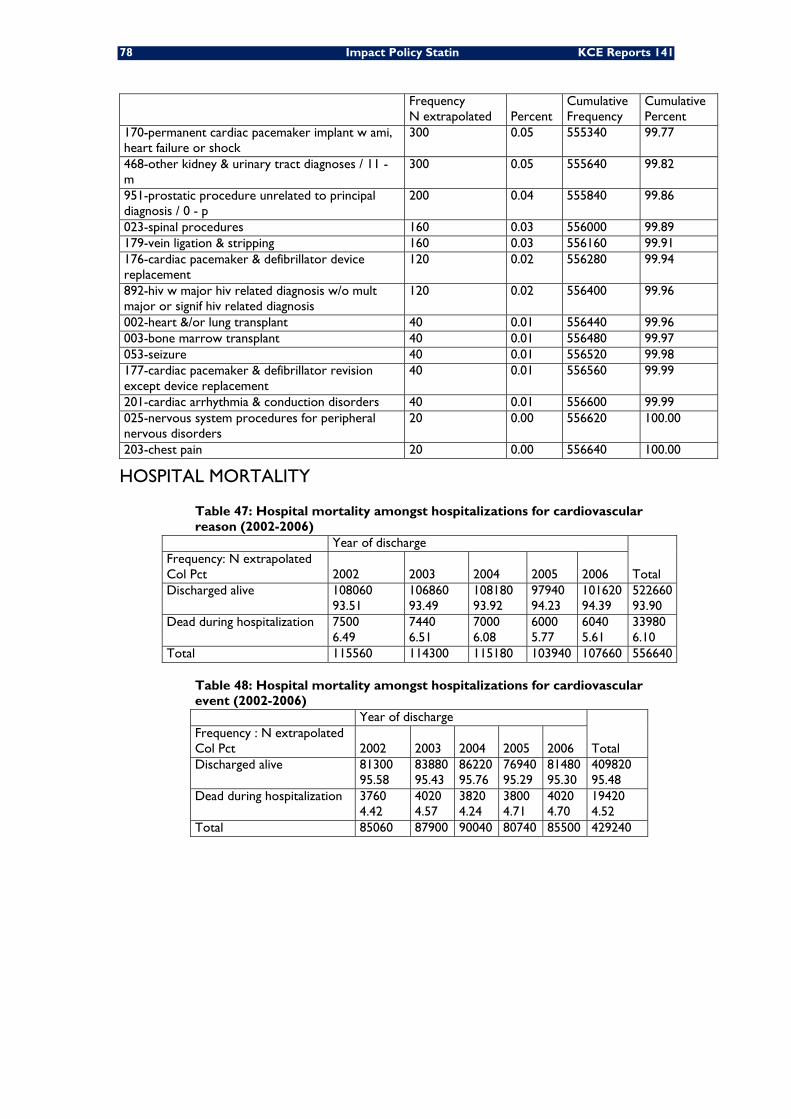
78 Impact Policy Statin KCE Reports 141
Frequency N extrapolated Percent
Cumulative Frequency
Cumulative Percent
170-permanent cardiac pacemaker implant w ami, heart failure or shock
300 0.05 555340 99.77
468-other kidney & urinary tract diagnoses / 11 - m
300 0.05 555640 99.82
951-prostatic procedure unrelated to principal diagnosis / 0 - p
200 0.04 555840 99.86
023-spinal procedures 160 0.03 556000 99.89 179-vein ligation & stripping 160 0.03 556160 99.91 176-cardiac pacemaker & defibrillator device replacement
120 0.02 556280 99.94
892-hiv w major hiv related diagnosis w/o mult major or signif hiv related diagnosis
120 0.02 556400 99.96
002-heart &/or lung transplant 40 0.01 556440 99.96 003-bone marrow transplant 40 0.01 556480 99.97 053-seizure 40 0.01 556520 99.98 177-cardiac pacemaker & defibrillator revision except device replacement
40 0.01 556560 99.99
201-cardiac arrhythmia & conduction disorders 40 0.01 556600 99.99 025-nervous system procedures for peripheral nervous disorders
20 0.00 556620 100.00
203-chest pain 20 0.00 556640 100.00
HOSPITAL MORTALITY
Table 47: Hospital mortality amongst hospitalizations for cardiovascular reason (2002-2006)
Year of discharge
Total Frequency: N extrapolated Col Pct 2002 2003 2004 2005 2006 Discharged alive 108060
93.51 106860 93.49
108180 93.92
97940 94.23
101620 94.39
522660 93.90
Dead during hospitalization 7500 6.49
7440 6.51
7000 6.08
6000 5.77
6040 5.61
33980 6.10
Total 115560 114300 115180 103940 107660 556640
Table 48: Hospital mortality amongst hospitalizations for cardiovascular event (2002-2006) Year of discharge
Total Frequency : N extrapolated Col Pct 2002 2003 2004 2005 2006 Discharged alive 81300
95.58 83880 95.43
86220 95.76
76940 95.29
81480 95.30
409820 95.48
Dead during hospitalization 3760 4.42
4020 4.57
3820 4.24
3800 4.71
4020 4.70
19420 4.52
Total 85060 87900 90040 80740 85500 429240
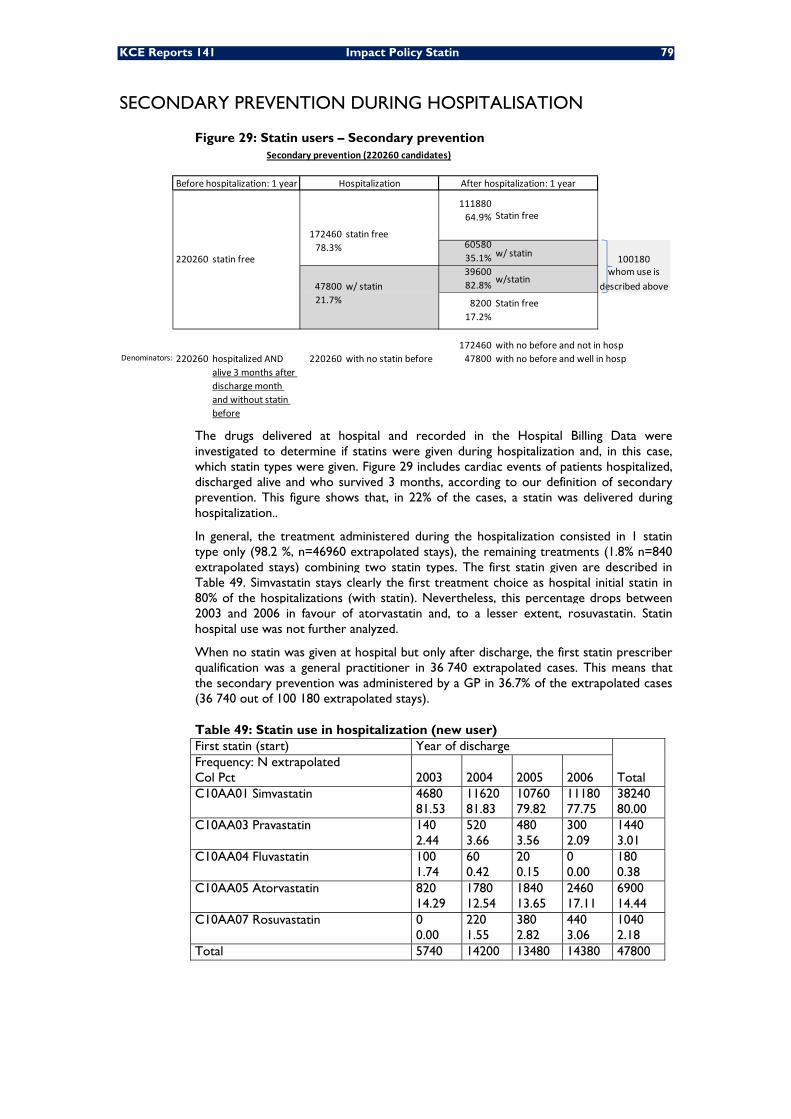
KCE Reports 141 Impact Policy Statin 79
SECONDARY PREVENTION DURING HOSPITALISATION
Figure 29: Statin users – Secondary prevention
11188064.9%
6058035.1% 10018039600 whom use is82.8% described above
21.7% 8200 Statin free17.2%
172460 with no before and not in hospDenominators: 220260 hospitalized AND
alive 3 months after discharge month and without statin before
220260 with no statin before 47800 with no before and well in hosp
47800 w/ statinw/statin
Secondary prevention (220260 candidates)
Before hospitalization: 1 year Hospitalization After hospitalization: 1 year
220260 statin free
172460 statin free
Statin free
78.3% w/ statin
The drugs delivered at hospital and recorded in the Hospital Billing Data were investigated to determine if statins were given during hospitalization and, in this case, which statin types were given. Figure 29 includes cardiac events of patients hospitalized, discharged alive and who survived 3 months, according to our definition of secondary prevention. This figure shows that, in 22% of the cases, a statin was delivered during hospitalization..
In general, the treatment administered during the hospitalization consisted in 1 statin type only (98.2 %, n=46960 extrapolated stays), the remaining treatments (1.8% n=840 extrapolated stays) combining two statin types. The first statin given are described in Table 49. Simvastatin stays clearly the first treatment choice as hospital initial statin in 80% of the hospitalizations (with statin). Nevertheless, this percentage drops between 2003 and 2006 in favour of atorvastatin and, to a lesser extent, rosuvastatin. Statin hospital use was not further analyzed.
When no statin was given at hospital but only after discharge, the first statin prescriber qualification was a general practitioner in 36 740 extrapolated cases. This means that the secondary prevention was administered by a GP in 36.7% of the extrapolated cases (36 740 out of 100 180 extrapolated stays).
Table 49: Statin use in hospitalization (new user) First statin (start) Year of discharge
Total Frequency: N extrapolated Col Pct 2003 2004 2005 2006 C10AA01 Simvastatin 4680
81.53 11620 81.83
10760 79.82
11180 77.75
38240 80.00
C10AA03 Pravastatin 140 2.44
520 3.66
480 3.56
300 2.09
1440 3.01
C10AA04 Fluvastatin 100 1.74
60 0.42
20 0.15
0 0.00
180 0.38
C10AA05 Atorvastatin 820 14.29
1780 12.54
1840 13.65
2460 17.11
6900 14.44
C10AA07 Rosuvastatin 0 0.00
220 1.55
380 2.82
440 3.06
1040 2.18
Total 5740 14200 13480 14380 47800
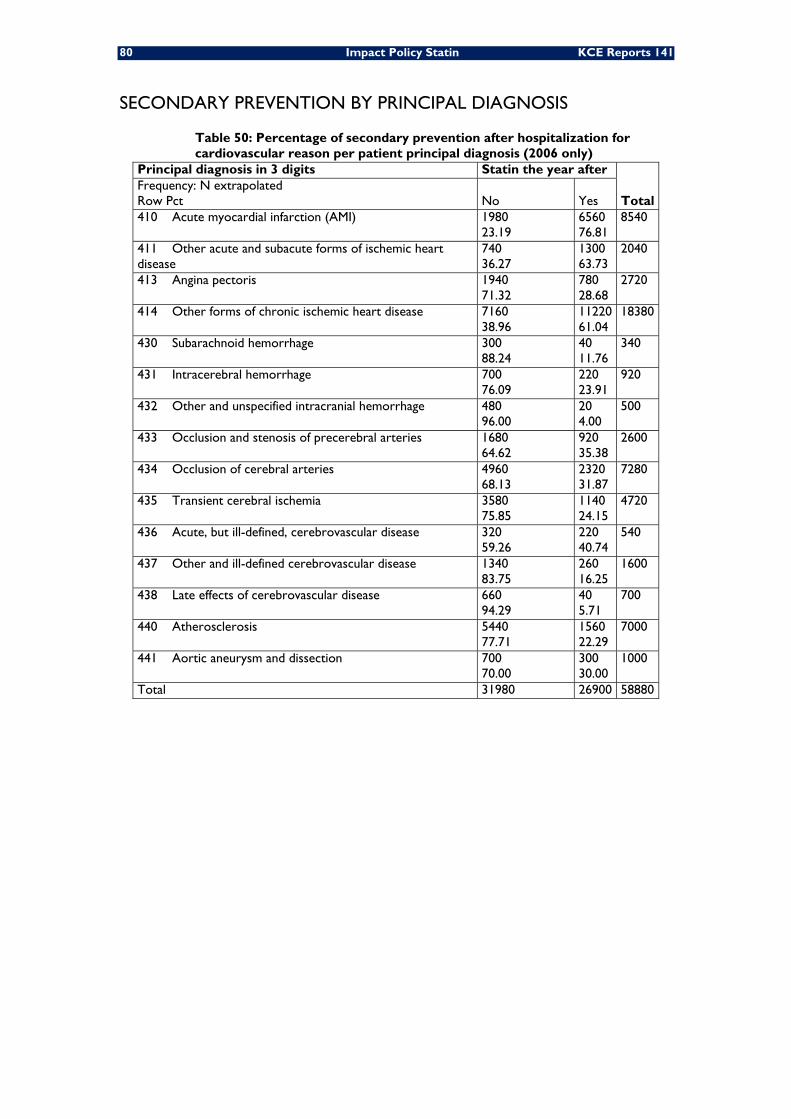
80 Impact Policy Statin KCE Reports 141
SECONDARY PREVENTION BY PRINCIPAL DIAGNOSIS
Table 50: Percentage of secondary prevention after hospitalization for cardiovascular reason per patient principal diagnosis (2006 only)
Principal diagnosis in 3 digits Statin the year after
Total Frequency: N extrapolated Row Pct No Yes 410 Acute myocardial infarction (AMI) 1980
23.19 6560 76.81
8540
411 Other acute and subacute forms of ischemic heart disease
740 36.27
1300 63.73
2040
413 Angina pectoris 1940 71.32
780 28.68
2720
414 Other forms of chronic ischemic heart disease 7160 38.96
11220 61.04
18380
430 Subarachnoid hemorrhage 300 88.24
40 11.76
340
431 Intracerebral hemorrhage 700 76.09
220 23.91
920
432 Other and unspecified intracranial hemorrhage 480 96.00
20 4.00
500
433 Occlusion and stenosis of precerebral arteries 1680 64.62
920 35.38
2600
434 Occlusion of cerebral arteries 4960 68.13
2320 31.87
7280
435 Transient cerebral ischemia 3580 75.85
1140 24.15
4720
436 Acute, but ill-defined, cerebrovascular disease 320 59.26
220 40.74
540
437 Other and ill-defined cerebrovascular disease 1340 83.75
260 16.25
1600
438 Late effects of cerebrovascular disease 660 94.29
40 5.71
700
440 Atherosclerosis 5440 77.71
1560 22.29
7000
441 Aortic aneurysm and dissection 700 70.00
300 30.00
1000
Total 31980 26900 58880
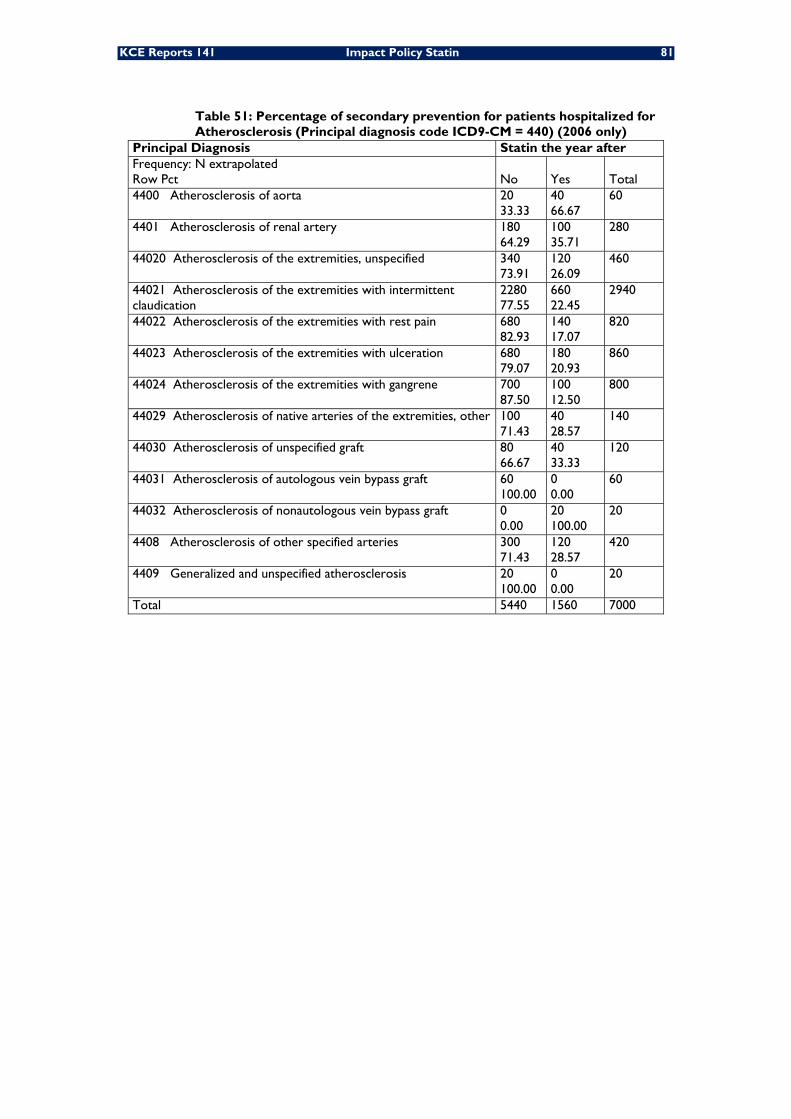
KCE Reports 141 Impact Policy Statin 81
Table 51: Percentage of secondary prevention for patients hospitalized for Atherosclerosis (Principal diagnosis code ICD9-CM = 440) (2006 only)
Principal Diagnosis Statin the year after Frequency: N extrapolated Row Pct No Yes Total 4400 Atherosclerosis of aorta 20
33.33 40 66.67
60
4401 Atherosclerosis of renal artery 180 64.29
100 35.71
280
44020 Atherosclerosis of the extremities, unspecified 340 73.91
120 26.09
460
44021 Atherosclerosis of the extremities with intermittent claudication
2280 77.55
660 22.45
2940
44022 Atherosclerosis of the extremities with rest pain 680 82.93
140 17.07
820
44023 Atherosclerosis of the extremities with ulceration 680 79.07
180 20.93
860
44024 Atherosclerosis of the extremities with gangrene 700 87.50
100 12.50
800
44029 Atherosclerosis of native arteries of the extremities, other 100 71.43
40 28.57
140
44030 Atherosclerosis of unspecified graft 80 66.67
40 33.33
120
44031 Atherosclerosis of autologous vein bypass graft 60 100.00
0 0.00
60
44032 Atherosclerosis of nonautologous vein bypass graft 0 0.00
20 100.00
20
4408 Atherosclerosis of other specified arteries 300 71.43
120 28.57
420
4409 Generalized and unspecified atherosclerosis 20 100.00
0 0.00
20
Total 5440 1560 7000
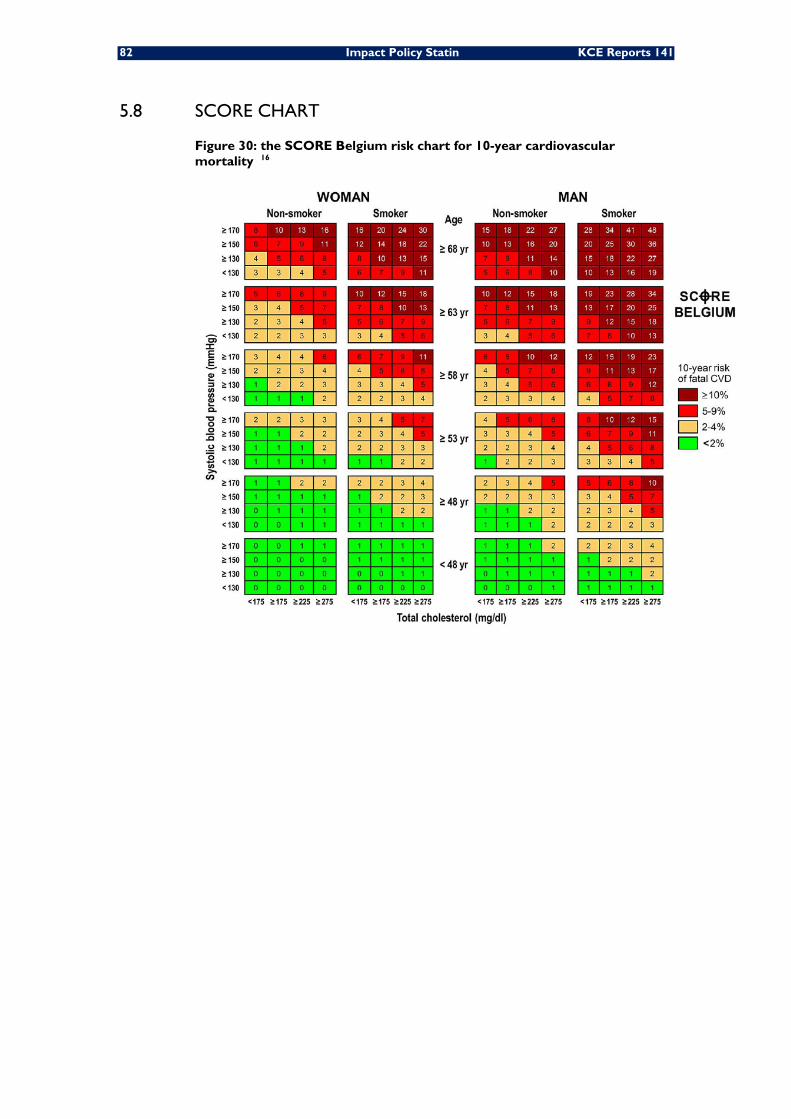
82 Impact Policy Statin KCE Reports 141
5.8 SCORE CHART
Figure 30: the SCORE Belgium risk chart for 10-year cardiovascular mortality 16
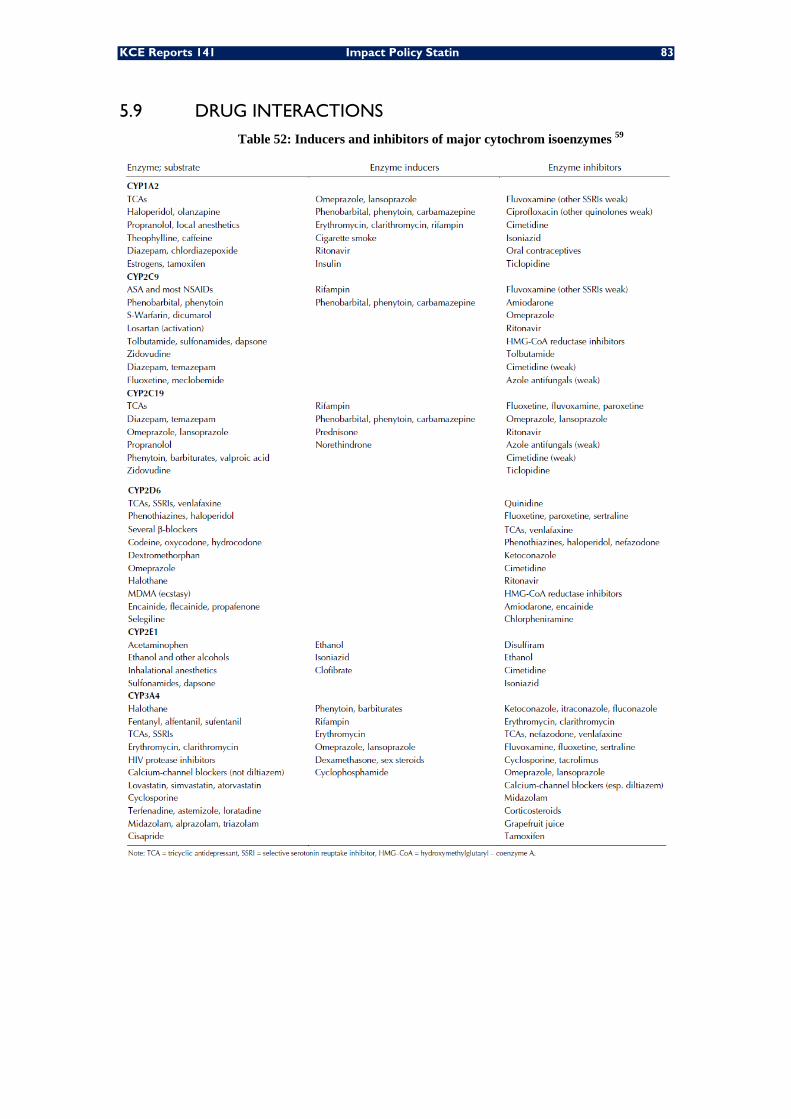
KCE Reports 141 Impact Policy Statin 83
5.9 DRUG INTERACTIONS Table 52: Inducers and inhibitors of major cytochrom isoenzymes 59
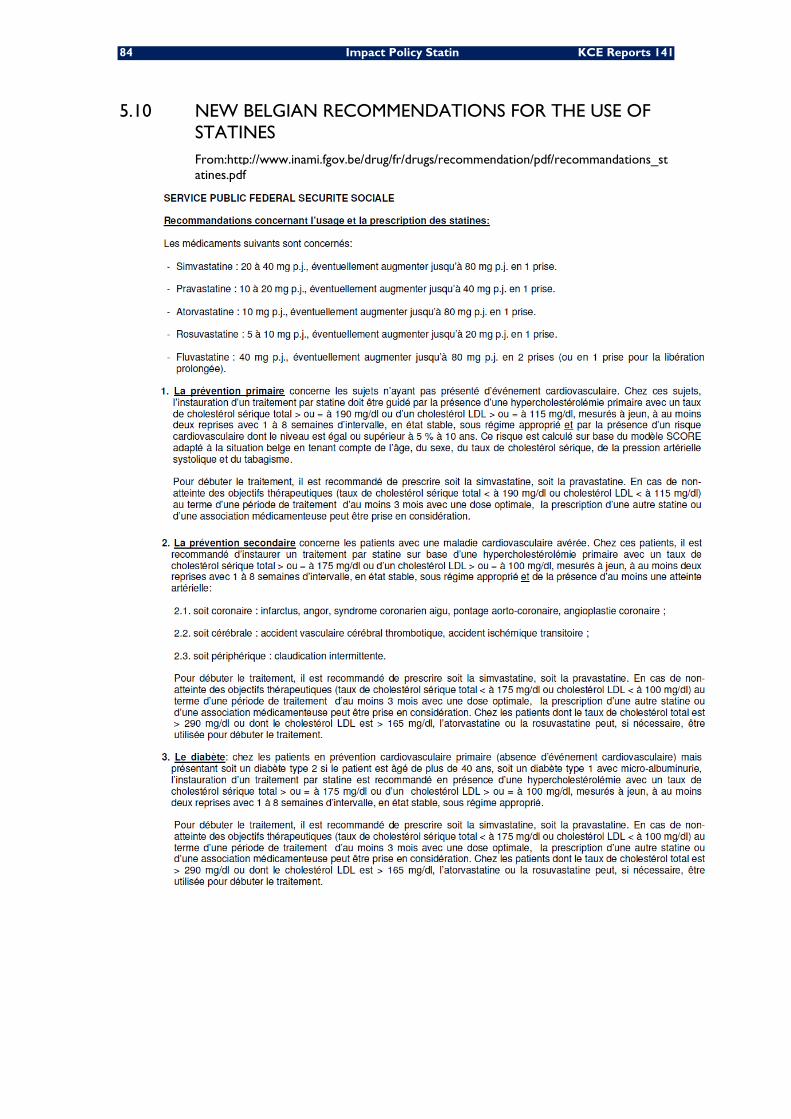
84 Impact Policy Statin KCE Reports 141
5.10 NEW BELGIAN RECOMMENDATIONS FOR THE USE OF STATINES From:http://www.inami.fgov.be/drug/fr/drugs/recommendation/pdf/recommandations_statines.pdf
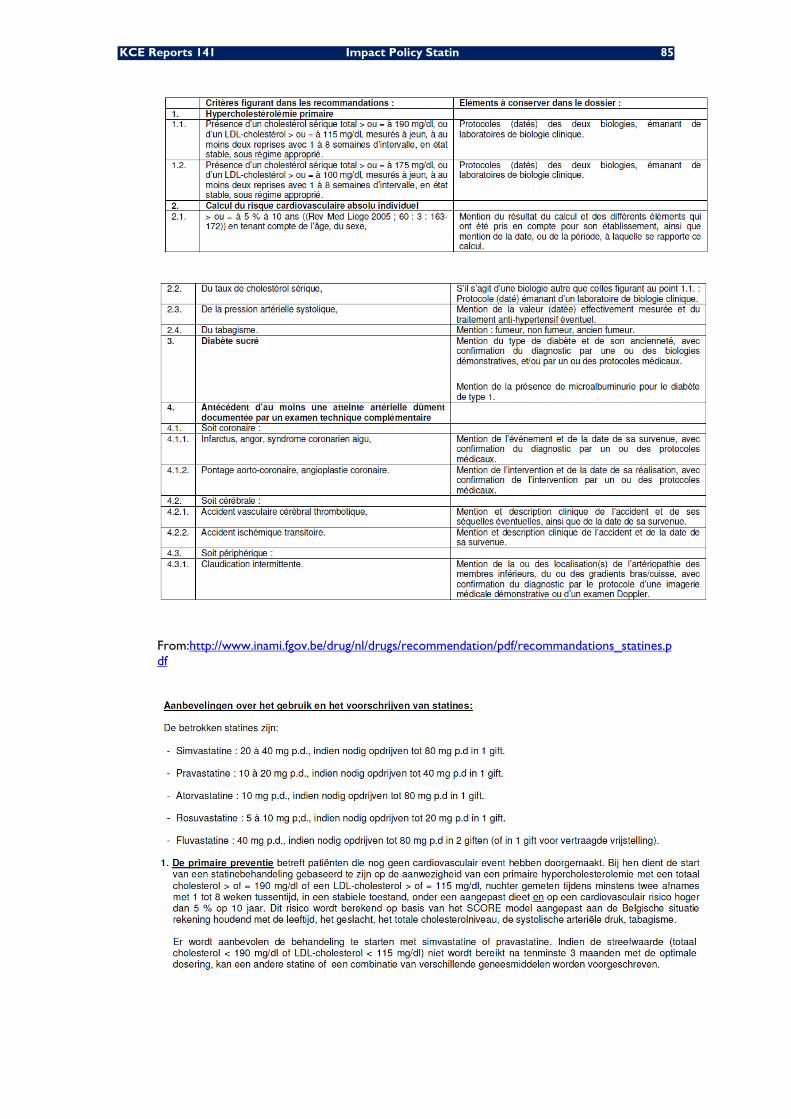
KCE Reports 141 Impact Policy Statin 85
From:http://www.inami.fgov.be/drug/nl/drugs/recommendation/pdf/recommandations_statines.pdf
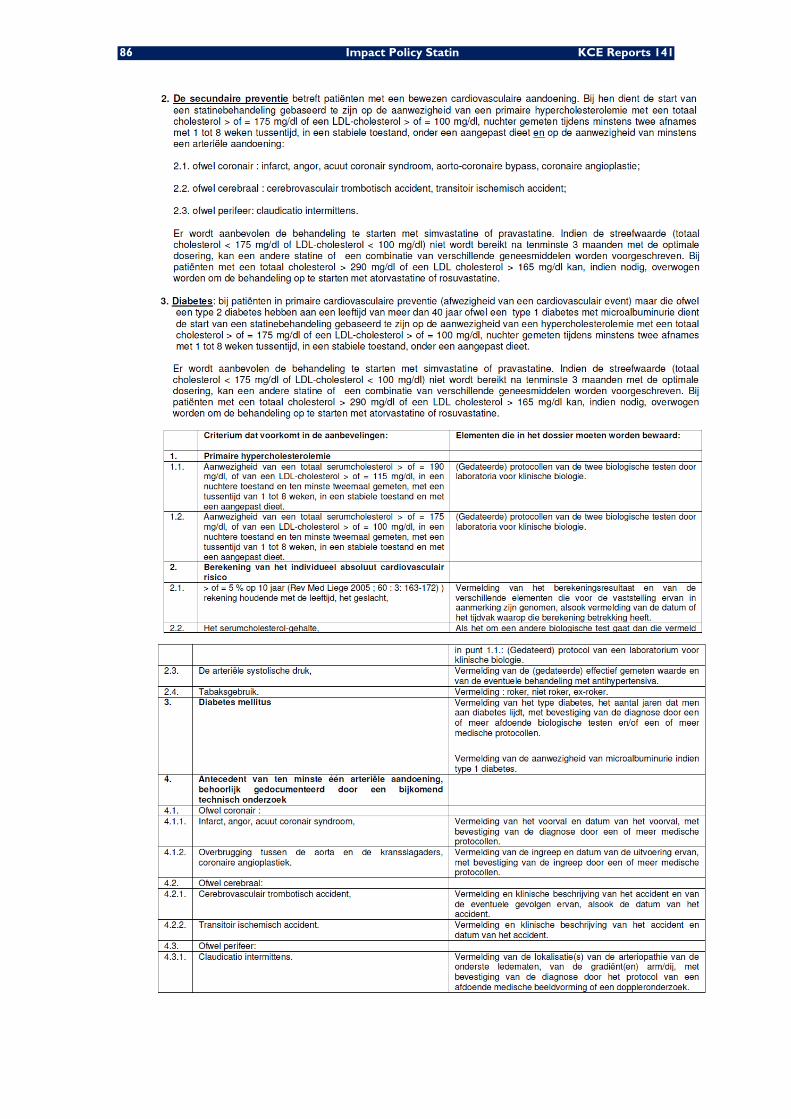
86 Impact Policy Statin KCE Reports 141
KCE Reports 141 Impact Policy Statin 87
6 BIBLIOGRAPHY 1. Armitage J. The safety of statins in clinical practice. Lancet. 2007;370(9601):1781-90.
2. Law MR, Wald NJ, Rudnicka AR. Quantifying effect of statins on low density lipoprotein cholesterol, ischaemic heart disease, and stroke: systematic review and meta-analysis. BMJ. 2003;326(7404):1423.
3. Baigent C, Keech A, Kearney PM, Blackwell L, Buck G, Pollicino C, et al. Efficacy and safety of cholesterol-lowering treatment: prospective meta-analysis of data from 90,056 participants in 14 randomised trials of statins. Lancet. 2005;366(9493):1267-78.
4. Gould AL, Davies GM, Alemao E, Yin DD, Cook JR. Cholesterol reduction yields clinical benefits: meta-analysis including recent trials. Clin Ther. 2007;29(5):778-94.
5. Bellosta S, Ferri N, Arnaboldi L, Bernini F, Paoletti R, Corsini A. Pleiotropic effects of statins in atherosclerosis and diabetes. Diabetes Care. 2000;23 Suppl 2:B72-8.
6. Robinson JG, Smith B, Maheshwari N, Schrott H. Pleiotropic effects of statins: benefit beyond cholesterol reduction? A meta-regression analysis. J Am Coll Cardiol. 2005;46(10):1855-62.
7. Brugts JJ, Yetgin T, Hoeks SE, Gotto AM, Shepherd J, Westendorp RGJ, et al. The benefits of statins in people without established cardiovascular disease but with cardiovascular risk factors: meta-analysis of randomised controlled trials. BMJ. 2009;338:b2376.
8. Mills EJ, Rachlis B, Wu P, Devereaux PJ, Arora P, Perri D. Primary prevention of cardiovascular mortality and events with statin treatments: a network meta-analysis involving more than 65,000 patients. J Am Coll Cardiol. 2008;52(22):1769-81.
9. Ward S, Lloyd Jones M, Pandor A, Holmes M, Ara R, Ryan A, et al. A systematic review and economic evaluation of statins for the prevention of coronary events. Health Technol Assess. 2007;11(14):1-160, iii-iv.
10. O'Regan C, Wu P, Arora P, Perri D, Mills EJ. Statin therapy in stroke prevention: a meta-analysis involving 121,000 patients. Am J Med. 2008;121(1):24-33.
11. Thavendiranathan P, Bagai A, Brookhart MA, Choudhry NK. Primary prevention of cardiovascular diseases with statin therapy: a meta-analysis of randomized controlled trials. Arch Intern Med. 2006;166(21):2307-13.
12. Ray KK, Seshasai SRK, Erqou S, Sever P, Jukema JW, Ford I, et al. Statins and all-cause mortality in high-risk primary prevention: a meta-analysis of 11 randomized controlled trials involving 65,229 participants. Arch Intern Med. 2010;170(12):1024-31.
13. Manktelow BN, Potter JF. Interventions in the management of serum lipids for preventing stroke recurrence. Cochrane Database Syst Rev. 2009(3):CD002091.
14. Dragomir A, Cote R, White M, Lalonde L, Blais L, Berard A, et al. Relationship between adherence level to statins, clinical issues and health-care costs in real-life clinical setting. Value Health. 2010;13(1):87-94.
15. Tuppin P, Neumann A, Danchin N, de Peretti C, Weill A, Ricordeau P, et al. Evidence-based pharmacotherapy after myocardial infarction in France: adherence-associated factors and relationship with 30-month mortality and rehospitalization. Arch Cardiovasc Dis. 2010;103(6-7):363-75.
16. De Bacquer D, De Backer G. Predictive ability of the SCORE Belgium risk chart for cardiovascular mortality. Int J Cardiol. 2010;143(3):385-90.
17. Chevalier P. Les lipides enfin limpides. Revue de la Médecine Générale. 2007;239:30-5.
18. Abuissa H, O'Keefe JH, Bybee KA. Statins as antiarrhythmics: a systematic review part I: effects on risk of atrial fibrillation. Clin Cardiol. 2009;32(10):544-8.
19. McGuinness B, Craig D, Bullock R, Passmore P. Statins for the prevention of dementia. Cochrane Database Syst Rev. 2009(2):CD003160.
20. Kopterides P, Falagas ME. Statins for sepsis: a critical and updated review. Clin Microbiol Infect. 2009;15(4):325-34.
21. Cannon CP, Braunwald E, McCabe CH, Rader DJ, Rouleau JL, Belder R, et al. Intensive versus moderate lipid lowering with statins after acute coronary syndromes. N Engl J Med. 2004;350(15):1495-504.
88 Impact Policy Statin KCE Reports 141
22. Nissen SE, Tuzcu EM, Schoenhagen P, Brown BG, Ganz P, Vogel RA, et al. Effect of intensive compared with moderate lipid-lowering therapy on progression of coronary atherosclerosis: a randomized controlled trial. JAMA. 2004;291(9):1071-80.
23. Deedwania P, Stone PH, Bairey Merz CN, Cosin-Aguilar J, Koylan N, Luo D, et al. Effects of intensive versus moderate lipid-lowering therapy on myocardial ischemia in older patients with coronary heart disease: results of the Study Assessing Goals in the Elderly (SAGE). Circulation. 2007;115(6):700-7.
24. Pedersen TR, Faergeman O, Kastelein JJ, Olsson AG, Tikkanen MJ, Holme I, et al. High-dose atorvastatin vs usual-dose simvastatin for secondary prevention after myocardial infarction: the IDEAL study: a randomized controlled trial. JAMA. 2005;294(19):2437-45.
25. Stone PH, Lloyd-Jones DM, Kinlay S, Frei B, Carlson W, Rubenstein J, et al. Effect of intensive lipid lowering, with or without antioxidant vitamins, compared with moderate lipid lowering on myocardial ischemia in patients with stable coronary artery disease: the Vascular Basis for the Treatment of Myocardial Ischemia Study. Circulation. 2005;111(14):1747-55.
26. Cannon CP, Steinberg BA, Murphy SA, Mega JL, Braunwald E. Meta-analysis of cardiovascular outcomes trials comparing intensive versus moderate statin therapy. J Am Coll Cardiol. 2006;48(3):438-45.
27. Tikkanen MJ, Holme I, Cater NB, Szarek M, Faergeman O, Kastelein JJ, et al. Comparison of efficacy and safety of atorvastatin (80 mg) to simvastatin (20 to 40 mg) in patients aged <65 versus >or=65 years with coronary heart disease (from the Incremental DEcrease through Aggressive Lipid Lowering IDEAL study). Am J Cardiol. 2009;103(5):577-82.
28. Delahoy PJ, Magliano DJ, Webb K, Grobler M, Liew D. The relationship between reduction in low-density lipoprotein cholesterol by statins and reduction in risk of cardiovascular outcomes: an updated meta-analysis. Clin Ther. 2009;31(2):236-44.
29. Weng TC, Yang YHK, Lin SJ, Tai SH. A systematic review and meta-analysis on the therapeutic equivalence of statins. J Clin Pharm Ther. 2010;35(2):139-51.
30. Zhou Z, Rahme E, Pilote L. Are statins created equal? Evidence from randomized trials of pravastatin, simvastatin, and atorvastatin for cardiovascular disease prevention. Am Heart J. 2006;151(2):273-81.
31. Doggrell SA. Is atorvastatin superior to other statins? Analysis of the clinical trials with atorvastatin having cardiovascular endpoints. Rev Recent Clin Trials. 2006;1(2):143-53.
32. Ridker PM, Danielson E, Fonseca FAH, Genest J, Gotto AM, Jr., Kastelein JJP, et al. Rosuvastatin to prevent vascular events in men and women with elevated C-reactive protein. N Engl J Med. 2008;359(21):2195-207.
33. de Lorgeril M, Salen P, Abramson J, Dodin S, Hamazaki T, Kostucki W, et al. Cholesterol lowering, cardiovascular diseases, and the rosuvastatin-JUPITER controversy: a critical reappraisal. Arch Intern Med. 2010;170(12):1032-6.
34. Dieleman JP, van Wyk JT, van Wijk MA, van Herpen G, Straus SM, Dunselman H, et al. Differences between statins on clinical endpoints: a population-based cohort study. Curr Med Res Opin. 2005;21(9):1461-8.
35. Motsko SP, Russmann S, Ming EE, Singh VP, Vendiola RM, Jones JK. Effectiveness of rosuvastatin compared to other statins for the prevention of cardiovascular events-a cohort study in 395 039 patients from clinical practice. Pharmacoepidemiol Drug Saf. 2009;18(12):1214-22.
36. Narla V, Blaha MJ, Blumenthal RS, Michos ED. The JUPITER and AURORA clinical trials for rosuvastatin in special primary prevention populations: perspectives, outcomes, and consequences. Vasc Health Risk Manag. 2009;5:1033-42.
37. Silva MA, Swanson AC, Gandhi PJ, Tataronis GR. Statin-related adverse events: a meta-analysis. Clin Ther. 2006;28(1):26-35.
38. Thompson PD, Clarkson P, Karas RH. Statin-associated myopathy. JAMA. 2003;289(13):1681-90.
39. Silva M, Matthews ML, Jarvis C, Nolan NM, Belliveau P, Malloy M, et al. Meta-analysis of drug-induced adverse events associated with intensive-dose statin therapy. Clin Ther. 2007;29(2):253-60.
40. Golomb BA, Evans MA. Statin adverse effects : a review of the literature and evidence for a mitochondrial mechanism. Am J Cardiovasc Drugs. 2008;8(6):373-418.
KCE Reports 141 Impact Policy Statin 89
41. Rodriguez L, Herings R, Johansson S. Use of multiple international healthcare databases for the detection of rare drug-associated outcomes: a pharmacoepidemiological programme comparing rosuvastatin with other marketed statins. Pharmacoepidemiol Drug Saf. 2010.
42. Grundy SM. The issue of statin safety: where do we stand? Circulation. 2005;111(23):3016-9.
43. Graham DJ, Staffa JA, Shatin D, Andrade SE, Schech SD, La Grenade L, et al. Incidence of hospitalized rhabdomyolysis in patients treated with lipid-lowering drugs. JAMA. 2004;292(21):2585-90.
44. Chalasani N. Statins and hepatotoxicity: focus on patients with fatty liver. Hepatology. 2005;41(4):690-5.
45. Chalasani N, Aljadhey H, Kesterson J, Murray MD, Hall SD. Patients with elevated liver enzymes are not at higher risk for statin hepatotoxicity. Gastroenterology. 2004;126(5):1287-92.
46. Sattar N, Preiss D, Murray HM, Welsh P, Buckley BM, de Craen AJM, et al. Statins and risk of incident diabetes: a collaborative meta-analysis of randomised statin trials. Lancet. 2010;375(9716):735-42.
47. Dale KM, Coleman CI, Henyan NN, Kluger J, White CM. Statins and cancer risk: a meta-analysis. JAMA. 2006;295(1):74-80.
48. Kuoppala J, Lamminpaa A, Pukkala E. Statins and cancer: A systematic review and meta-analysis. Eur J Cancer. 2008;44(15):2122-32.
49. Sorensen HT, Lash TL. Statins and amyotrophic lateral sclerosis--the level of evidence for an association. J Intern Med. 2009;266(6):520-6.
50. Hippisley-Cox J, Coupland C. Unintended effects of statins in men and women in England and Wales: population based cohort study using the QResearch database. BMJ. 2010;340:c2197.
51. Shepherd J, Hunninghake DB, Stein EA, Kastelein JJP, Harris S, Pears J, et al. Safety of rosuvastatin. Am J Cardiol. 2004;94(7):882-8.
52. Wlodarczyk J, Sullivan D, Smith M. Comparison of benefits and risks of rosuvastatin versus atorvastatin from a meta-analysis of head-to-head randomized controlled trials. Am J Cardiol. 2008;102(12):1654-62.
53. Kobayashi M, Chisaki I, Narumi K, Hidaka K, Kagawa T, Itagaki S, et al. Association between risk of myopathy and cholesterol-lowering effect: a comparison of all statins. Life Sci. 2008;82(17-18):969-75.
54. Baker WL, Talati R, White CM, Coleman CI. Differing effect of statins on insulin sensitivity in non-diabetics: a systematic review and meta-analysis. Diabetes Res Clin Pract. 2010;87(1):98-107.
55. Johansson S, Ming EE, Wallander M-A, Rodriguez LAG, Herings RMC, Goettsch WG, et al. Rosuvastatin safety: a comprehensive, international pharmacoepidemiology programme. Pharmacoepidemiol Drug Saf. 2006;15(7):454-61.
56. Garcia-Rodriguez LA, Gonzalez-Perez A, Stang MR, Wallander M-A, Johansson S. The safety of rosuvastatin in comparison with other statins in over 25,000 statin users in the Saskatchewan Health Databases. Pharmacoepidemiol Drug Saf. 2008;17(10):953-61.
57. Garcia-Rodriguez LA, Masso-Gonzalez EL, Wallander M-A, Johansson S. The safety of rosuvastatin in comparison with other statins in over 100,000 statin users in UK primary care. Pharmacoepidemiol Drug Saf. 2008;17(10):943-52.
58. Hamelin BA, Turgeon J. Hydrophilicity/lipophilicity: relevance for the pharmacology and clinical effects of HMG-CoA reductase inhibitors. Trends Pharmacol Sci. 1998;19(1):26-37.
59. Herman RJ. Drug interactions and the statins. CMAJ. 1999;161(10):1281-6.
60. Neyt M, De Laet C, Van Brabandt H, Franco O, Ramaekers D. Cost-effectiveness of statins in the primary prevention of cardiovascular disease: a systematic review and economic analysis for Belgium. Acta Cardiol. 2009;64(1):1-10.
61. De Bacquer D, De Backer G. The prevalence of concomitant hypertension and hypercholesterolaemia in the general population. Int J Cardiol. 2006;110(2):217-23.
62. Carling CLL, Kristoffersen DT, Montori VM, Herrin J, Schunemann HJ, Treweek S, et al. The effect of alternative summary statistics for communicating risk reduction on decisions about taking statins: a randomized trial. PLoS Med. 2009;6(8):e1000134.
90 Impact Policy Statin KCE Reports 141
63. Kotseva K, Wood D, De Backer G, De Bacquer D, Pyorala K, Keil U, et al. Cardiovascular prevention guidelines in daily practice: a comparison of EUROASPIRE I, II, and III surveys in eight European countries. Lancet. 2009;373(9667):929-40.
64. Nicholls SJ, Brandrup-Wognsen G, Palmer M, Barter PJ. Meta-analysis of comparative efficacy of increasing dose of Atorvastatin versus Rosuvastatin versus Simvastatin on lowering levels of atherogenic lipids (from VOYAGER). Am J Cardiol. 2010;105(1):69-76.
65. Sakshaug S, Furu K, Karlstad O, Ronning M, Skurtveit S. Switching statins in Norway after new reimbursement policy: a nationwide prescription study. Br J Clin Pharmacol. 2007;64(4):476-81.
66. Martikainen JE, Saastamoinen LK, Korhonen MJ, Enlund H, Helin-Salmivaara A. Impact of restricted reimbursement on the use of statins in Finland: a register-based study. Med Care. 2010;48(9):761-6.
67. Mann DM, Woodward M, Muntner P, Falzon L, Kronish I. Predictors of nonadherence to statins: a systematic review and meta-analysis. Ann Pharmacother. 2010;44(9):1410-21.
68. Mitka M. Improving medication adherence promises great payback, but poses tough challenge. JAMA. 2010;303(9):825.
69. Bates TR, Connaughton VM, Watts GF. Non-adherence to statin therapy: a major challenge for preventive cardiology. Expert Opin Pharmacother. 2009;10(18):2973-85.
70. Shitara Y, Sugiyama Y. Pharmacokinetic and pharmacodynamic alterations of 3-hydroxy-3-methylglutaryl coenzyme A (HMG-CoA) reductase inhibitors: drug-drug interactions and interindividual differences in transporter and metabolic enzyme functions. Pharmacol Ther. 2006;112(1):71-105.
71. Josan K, Majumdar SR, McAlister FA. The efficacy and safety of intensive statin therapy: a meta-analysis of randomized trials. CMAJ. 2008;178(5):576-84.
72. Manuel DG, Kwong K, Tanuseputro P, Lim J, Mustard CA, Anderson GM, et al. Effectiveness and efficiency of different guidelines on statin treatment for preventing deaths from coronary heart disease: modelling study. BMJ. 2006;332(7555):1419.

This page is left intentionally blank.

Dépôt légal : D/2010/10.273/70
KCE reports
1. Efficacité et rentabilité des thérapies de sevrage tabagique. D/2004/10.273/2. 2. Etude relative aux coûts potentiels liés à une éventuelle modification des règles du droit de la
responsabilité médicale (Phase 1). D/2004/10.273/4. 3. Utilisation des antibiotiques en milieu hospitalier dans le cas de la pyélonéphrite aiguë.
D/2004/10.273/6. 4. Leucoréduction. Une mesure envisageable dans le cadre de la politique nationale de sécurité
des transfusions sanguines. D/2004/10.273/8. 5. Evaluation des risques préopératoires. D/2004/10.273/10. 6. Recommandation nationale relative aux soins prénatals: Une base pour un itinéraire clinique de
suivi de grossesses. D/2004/10.273/14. 7. Validation du rapport de la Commission d’examen du sous financement des hôpitaux.
D/2004/10.273/12. 8. Systèmes de financement des médicaments hospitaliers: étude descriptive de certains pays
européens et du Canada. D/2004/10.273/16. 9. Feedback: évaluation de l'impact et des barrières à l'implémentation – Rapport de recherche:
partie 1. D/2005/10.273/02. 10. Le coût des prothèses dentaires. D/2005/10.273/04. 11. Dépistage du cancer du sein. D/2005/10.273/06. 12. Etude d’une méthode de financement alternative pour le sang et les dérivés sanguins labiles
dans les hôpitaux. D/2005/10.273/08. 13. Traitement endovasculaire de la sténose carotidienne. D/2005/10.273/10. 14. Variations des pratiques médicales hospitalières en cas d’infarctus aigu du myocarde en
Belgique. D/2005/10.273/12 15. Evolution des dépenses de santé. D/2005/10.273/14. 16. Etude relative aux coûts potentiels liés à une éventuelle modification des règles du droit de la
responsabilité médicale. Phase II : développement d'un modèle actuariel et premières estimations. D/2005/10.273/16.
17. Evaluation des montants de référence. D/2005/10.273/18. 18. Utilisation des itinéraires cliniques et guides de bonne pratique afin de déterminer de manière
prospective les honoraires des médecins hospitaliers: plus facile à dire qu'à faire.. D/2005/10.273/20
19. Evaluation de l'impact d'une contribution personnelle forfaitaire sur le recours au service d'urgences. D/2005/10.273/22.
20. HTA Diagnostic Moléculaire en Belgique. D/2005/10.273/24, D/2005/10.273/26. 21. HTA Matériel de Stomie en Belgique. D/2005/10.273.28. 22. HTA Tomographie par Emission de Positrons en Belgique. D/2005/10.273/30. 23. HTA Le traitement électif endovasculaire de l’anévrysme de l’aorte abdominale (AAA).
D/2005/10.273.33. 24. L'emploi des peptides natriurétiques dans l'approche diagnostique des patients présentant une
suspicion de décompensation cardiaque. D/2005/10.273.35 25. Endoscopie par capsule. D2006/10.273.02. 26. Aspects médico-légaux des recommandations de bonne pratique médicale. D2006/10.273/06. 27. Qualité et organisation des soins du diabète de type 2. D2006/10.273/08. 28. Recommandations provisoires pour les évaluations pharmacoéconomiques en Belgique.
D2006/10.273/11. 29. Recommandations nationales Collège d’oncologie : A. cadre général pour un manuel
d’oncologie B. base scientifique pour itinéraires cliniques de diagnostic et traitement, cancer colorectal et cancer du testicule. D2006/10.273/13.
30. Inventaire des bases de données de soins de santé. D2006/10.273/15. 31. Health Technology Assessment : l’antigène prostatique spécifique (PSA) dans le dépistage du
cancer de la prostate. D2006/10.273/18. 32. Feedback: évaluation de l'impact et des barrières à l'implémentation - Rapport de recherche:
partie II. D2006/10.273/20. 33. Effets et coûts de la vaccination des enfants Belges au moyen du vaccin conjugué
antipneumococcique. D2006/10.273/22. 34. Trastuzumab pour les stades précoces du cancer du sein. D2006/10.273/24.
35. Etude relative aux coûts potentiels liés à une éventuelle modification des règles du droit de la responsabilité médicale – Phase III : affinement des estimations. D2006/10.273/27.
36. Traitement pharmacologique et chirurgical de l'obésité. Prise en charge résidentielle des enfants sévèrement obèses en Belgique. D/2006/10.273/29.
37. Health Technology Assessment Imagerie par Résonance Magnétique. D/2006/10.273/33. 38. Dépistage du cancer du col de l’utérus et recherche du Papillomavirus humain (HPV).
D/2006/10.273/36 39. Evaluation rapide de technologies émergentes s'appliquant à la colonne vertébrale :
remplacement de disque intervertébral et vertébro/cyphoplastie par ballonnet. D/2006/10.273/39.
40. Etat fonctionnel du patient: un instrument potentiel pour le remboursement de la kinésithérapie en Belgique? D/2006/10.273/41.
41. Indicateurs de qualité cliniques. D/2006/10.273/44. 42. Etude des disparités de la chirurgie élective en Belgique. D/2006/10.273/46. 43. Mise à jour de recommandations de bonne pratique existantes. D/2006/10.273/49. 44. Procédure d'évaluation des dispositifs médicaux émergeants. D/2006/10.273/51. 45. HTA Dépistage du Cancer Colorectal : état des lieux scientifique et impact budgétaire pour la
Belgique. D/2006/10.273/54. 46. Health Technology Assessment. Polysomnographie et monitoring à domicile des nourrissons
en prévention de la mort subite. D/2006/10.273/60. 47. L'utilisation des médicaments dans les maisons de repos et les maisons de repos et de soins
Belges. D/2006/10.273/62 48. Lombalgie chronique. D/2006/10.273/64. 49. Médicaments antiviraux en cas de grippe saisonnière et pandémique. Revue de littérature et
recommandations de bonne pratique. D/2006/10.273/66. 50. Contributions personnelles en matière de soins de santé en Belgique. L'impact des suppléments.
D/2006/10.273/69. 51. Besoin de soins chroniques des personnes âgées de 18 à 65 ans et atteintes de lésions
cérébrales acquises. D/2007/10.273/02. 52. Rapid Assessment: Prévention cardiovasculaire primaire dans la pratique du médecin
généraliste en Belgique. D/2007/10.273/04. 53. Financement des soins Infirmiers Hospitaliers. D/2007/10 273/06 54. Vaccination des nourrissons contre le rotavirus en Belgique. Analyse coût-efficacité 55. Valeur en termes de données probantes des informations écrites de l’industrie pharmaceutique
destinées aux médecins généralistes. D/2007/10.273/13 56. Matériel orthopédique en Belgique: Health Technology Assessment. D/2007/10.273/15. 57. Organisation et Financement de la Réadaptation Locomotrice et Neurologique en Belgique
D/2007/10.273/19 58. Le Défibrillateur Cardiaque Implantable.: un rapport d’évaluation de technologie de santé
D/2007/10.273/22 59. Analyse de biologie clinique en médecine général. D/2007/10.273/25 60. Tests de la fonction pulmonaire chez l'adulte. D/2007/10.273/28 61. Traitement de plaies par pression négative: une évaluation rapide. D/2007/10.273/31 62. Radiothérapie Conformationelle avec Modulation d’intensité (IMRT). D/2007/10.273/33. 63. Support scientifique du Collège d’Oncologie: un guideline pour la prise en charge du cancer du
sein. D/2007/10.273/36. 64. Vaccination HPV pour la prévention du cancer du col de l’utérus en Belgique: Health
Technology Assessment. D/2007/10.273/42. 65. Organisation et financement du diagnostic génétique en Belgique. D/2007/10.273/45. 66. Drug Eluting Stents en Belgique: Health Technology Assessment. D/2007/10.273/48. 67. Hadronthérapie. D/2007/10.273/51. 68. Indemnisation des dommages résultant de soins de santé - Phase IV : Clé de répartition entre
le Fonds et les assureurs. D/2007/10.273/53. 69. Assurance de Qualité pour le cancer du rectum – Phase 1: Recommandation de bonne
pratique pour la prise en charge du cancer rectal D/2007/10.273/55 70. Etude comparative des programmes d’accréditation hospitalière en Europe. D/2008/10.273/02 71. Recommandation de bonne pratique clinique pour cinq tests ophtalmiques. D/2008/10.273/05 72. L’offre de médecins en Belgique. Situation actuelle et défis. D/2008/10.273/08
73. Financement du programme de soins pour le patient gériatrique dans l’hôpital classique : Définition et évaluation du patient gériatrique, fonction de liaison et évaluation d’un instrument pour un financement approprié. D/2008/10.273/12
74. Oxygénothérapie Hyperbare: Rapid Assessment. D/2008/10.273/14. 75. Guideline pour la prise en charge du cancer oesophagien et gastrique: éléments scientifiques à
destination du Collège d’Oncologie. D/2008/10.273/17. 76. Promotion de la qualité de la médecine générale en Belgique: status quo ou quo vadis ?
D/2008/10.273/19. 77. Orthodontie chez les enfants et adolescents D/2008/10.273/21 78. Recommandations pour les évaluations pharmacoéconomiques en Belgique. D/2008/10.273/24. 79. Remboursement des radioisotopes en Belgique. D/2008/10.273/27. 80. Évaluation des effets du maximum à facturer sur la consommation et l’accessibilité financière
des soins de santé. D/2008/10.273/36. 81. Assurance de qualité pour le cancer rectal – phase 2: développement et test d’un ensemble
d’indicateurs de qualité. D/2008/10.273/39 82. Angiographie coronaire par tomodensitométrie 64-détecteurs chez les patients suspects de
maladie coronarienne. D/2008/10.273/41 83. Comparaison internationale des règles de remboursement et aspects légaux de la chirurgie
plastique D/2008/10.273/44 84. Les séjours psychiatriques de longue durée en lits T. D/2008/10.273/47 85. Comparaison de deux systèmes de financement des soins de première ligne en Belgique.
D/2008/10.273/50. 86. Différenciation de fonctions dans les soins infirmiers :possibilités et limites D/2008/10.273/53 87. Consommation de kinésithérapie et de médecine physique et de réadaptation en Belgique.
D/2008/10.273/55 88. Syndrome de Fatigue Chronique : diagnostic, traitement et organisation des soins.
D/2008/10.273/59. 89. Evaluation des certains nouveaux traitements du cancer de la prostate et de l’hypertrophie
bénigne de la prostate. D/2008/10.273/62 90. Médecine générale: comment promouvoir l’attraction et la rétention dans la profession ?
D/2008/10.273/64. 91. Appareils auditifs en Belgique: health technology assessment. D/2008/10.273/68 92. Les infections nosocomiales en Belgique : Volet I, Etude Nationale de Prévalence.
D/2008/10.273/71. 93. Détection des événements indésirables dans les bases de données administratives.
D/2008/10.273/74. 94. Soins maternels intensifs (Maternal Intensive Care) en Belgique. D/2008/10.273/78. 95. Implantation percutanée des valvules cardiaques dans le cas de maladies valvulaires congénitales
et dégénératives: A rapid Health Technology Assessment. D/2007/10.273/80. 96. Construction d’un index médical pour les contrats privés d’assurance maladie.
D/2008/10.273/83. 97. Centres de réadaptation ORL/PSY : groupes cibles, preuves scientifiques et organisation des
soins. D/2009/10.273/85. 98. Évaluation de programmes de vaccination généraux et ciblés contre l’hépatite A en Belgique.
D/2008/10.273/89. 99. Financement de l’hôpital de jour gériatrique. D/2008/10.273/91. 100. Valeurs seuils pour le rapport coût-efficacité en soins de santé. D/2008/10.273/95. 101. Enregistrement vidéo des interventions chirurgicales par endoscopie : une évaluation rapide.
D/2008/10.273/98. 102. Les infections nosocomiales en Belgique: Volet II: Impact sur la mortalité et sur les coûts.
D/2009/10.273/100. 103. Réformes dans l’organisation des soins de santé mentale : étude d’évaluation des ‘projets
thérapeutiques’ - 1er rapport intermédiaire. D/2009/10.273/05. 104. Chirurgie assistée par robot: health technology assessment. D/2009/10.273/08 105. Soutien scientifique au Collège d’Oncologie: recommandations pour la pratique clinique dans la
prise en charge du cancer du pancréas. D/2009/10.273/11 106. Imagerie par résonance magnétique : analyse de coûts. D/2009/10.273/15 107. Indemnisation des dommages résultant de soins de santé. Phase V: impact budgétaire de la
transposition du système français en Belgique. D/2009/10.273/17
108. Le Tiotropium dans le traitement des BronchoPneumopathies Chroniques Obstructives: Health Technology Assessment. D/2009/10.273/19
109. A propos de la valeur de l’EEG et des potentiels évoqués dans la pratique clinique. D/2009/10.273/22
110. La tomographie par émission de positrons en Belgique: une mise à jour. D/2009/10.273/25 111. Interventions pharmaceutiques et non pharmaceutiques dans la maladie d’Alzheimer : une
évaluation rapide. D/2009/10.273/28 112. Politiques relatives aux maladies orphelines et aux médicaments orphelins. D/2009/10.273/31 113. Le volume des interventions chirurgicales et son impact sur le résultat : étude de faisabilité
basée sur des données belges. D/2009/10.273/34. 114. Valves endobronchiales dans le traitement de l’emphysème pulmonaire avancé: un rapid Health
Technology Assessment. D/2009/10.273/38 115. Organisation des soins palliatifs en Belgique. D/2009/10.273/41 116. Evaluation rapide des implants inter-épineux et des vis pédiculaires pour la stabilisation
dynamique de la colonne vertébrale lombaire. D/2009/10.273/45 117. Utilisation des coagulomètres portables chez les patients sous anticoagulants oraux: Health
technology Assesment. D/2009/10.273/48. 118. Avantages, désavantages et faisabilité de l’introduction de programmes “P4Q” en Belgique.
D/2009/10.273/51. 119. Douleur cervicales atypiques: diagnostic et traitement. D/2009/10.273/55. 120. Comment assurer l’autosuffisance de la Belgique en dérivés stables du plasma?
D/2009/10.273/58. 121. Étude de faisabilité de l’introduction en Belgique d’un système de financement « all-in » par
pathologie. D/2010/10.273/02 122. Le financement des soins infirmiers à domicile en Belgique. D/2010/10.273/06 123. Réformes dans l’organisation des soins de santé mentale: etude d’évaluation des ‘projets
thérapeutiques’ – 2ème rapport intermédiaire. D/2010/10.273/09 124. Organisation et financement de la dialyse chronique en Belgique. D/2010/10.273/12 125. Impact du visiteur médical indépendant sur la pratique des médecins de première ligne.
D/2010/10.273/15 126. Le système du prix de référence et les différences socio-économiques dans l’utilisation des
médicaments moins onéreux. D/2010/10.273/19. 127. Rapport coût-efficacité du traitement antiviral de l’hépatite B chronique en Belgique. Partie 1:
Examen de la littérature et résultats d’une étude nationale. D/2010/10.273/23. 128. Un premier pas vers la mesure de la performance du système de soins de santé belge.
D/2010/10.273/26 129. Dépistage du cancer du sein entre 40 et 49 ans. D/2010/10.273/29. 130. Critères de qualité pour les lieux de stage des candidats-médecins généralistes et candidats-
spécialistes. D/2010/10.273/34. 131. Continuité du traitement médicamenteux entre hôpital et domicile. D/2010/10.273/38. 132. Faut-il un dépistage néonatal de la mucoviscidose en Belgique? D/2010/10.273/42. 133. Optimisation du fonctionnement du Fonds Spécial de Solidarité. D/2010/10.273/45. 134. Indemnisation des victimes transfusionnelles du virus de l’hépatite C ou du VIH.
D/2010/10.273/48. 135. L’urgence psychiatrique pour enfants et adolescents. D/2010/10.273/50. 136. Surveillance à distance des patients porteurs de défibrillateurs implantés. Evaluation de la
technologie et cadre réglementaire général. D/2010/10.273/54. 137. La stimulation cardiaque chez les patients bradycardes en Belgique. D/2010/10.273/57. 138. Le système de santé belge en 2010. D/2010/10.273/60. 139. Recommandations de bonne pratique pour l’accouchement à bas risque. D/2010/10.273/63 140. Rééducation cardiaque: efficacité clinique et utilisation en Belgique. D/2010/10.273/66. 141. Les statines en Belgique: évolutions de l’utilisation et impact des politiques de remboursement.
D/2010/10.273/70.