Embed Size (px)
Citation preview
This document consists of 12 printed pages and 4 blank pages.
IB09 06_0620_06/4RP © UCLES 2009 [Turn over
*7022409479*
For Examiner's Use
1
2
3
4
5
6
Total
UNIVERSITY OF CAMBRIDGE INTERNATIONAL EXAMINATIONS International General Certificate of Secondary Education
CHEMISTRY 0620/06
Paper 6 Alternative to Practical May/June 2009
1 hour
Candidates answer on the Question Paper.
No additional materials are required.
READ THESE INSTRUCTIONS FIRST
Write your Centre number, candidate number and name on all the work you hand in.
Write in dark blue or black pen.
You may use a pencil for any diagrams, graphs or rough working.
Do not use staples, paper clips, highlighters, glue or correction fluid.
DO NOT WRITE IN ANY BARCODES.
Answer all questions.
At the end of the examination, fasten all your work securely together.
The number of marks is given in brackets [ ] at the end of each question or part question.
www.dynamicpapers.com
2
0620/06/M/J/09
BLANK PAGE
www.dynamicpapers.com
3
© UCLES 2009 0620/06/M/J/09 [Turn over
For
Examiner's
Use
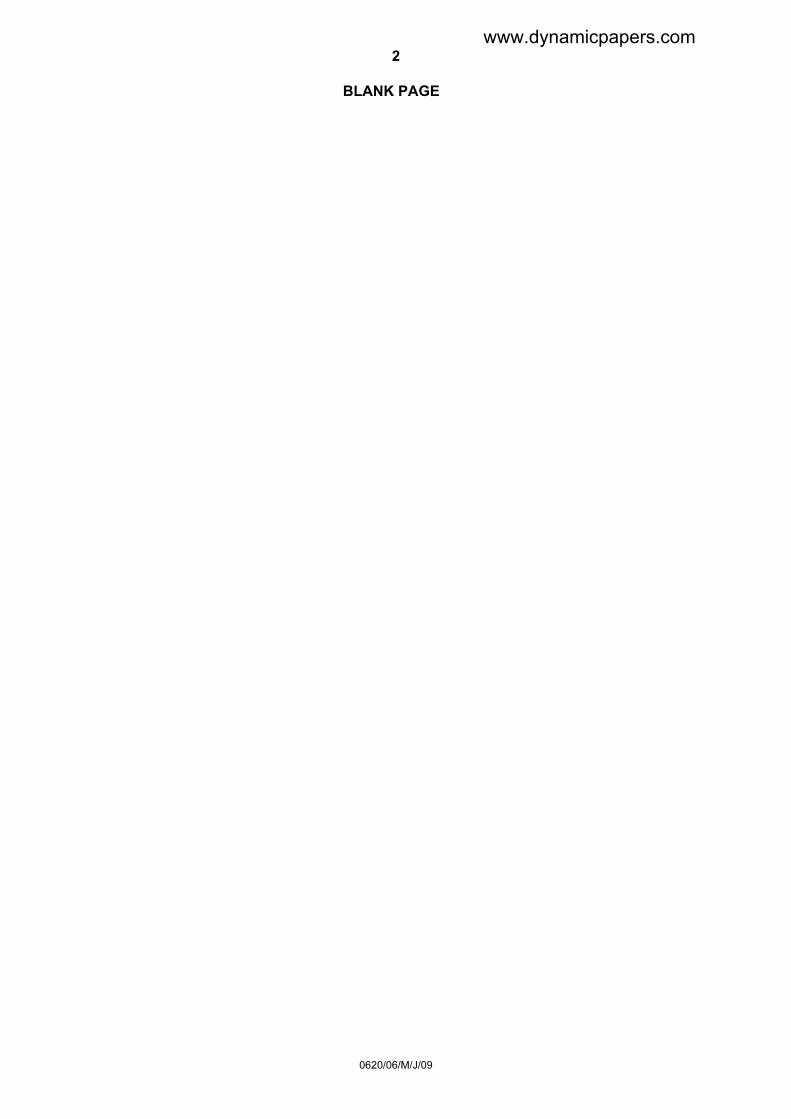
1 A student reacted nitric acid with magnesium oxide to prepare magnesium nitrate. The diagram shows the procedure followed in three stages.
warm
1magnesium oxide
weighed
2 magnesium oxide added until all the nitric acid reacted
3 mixture allowed
to cool
(a) Complete the boxes to identify the pieces of apparatus labelled. [3] (b) (i) What term is used to describe the unreacted magnesium oxide?
[1]
(ii) What method is used to remove the unreacted magnesium oxide after stage 3?
[1]
(c) Describe how crystals of magnesium nitrate could be quickly obtained from the
solution.
[2]
[Total: 7]
www.dynamicpapers.com
4
© UCLES 2009 0620/06/M/J/09
For
Examiner's
Use
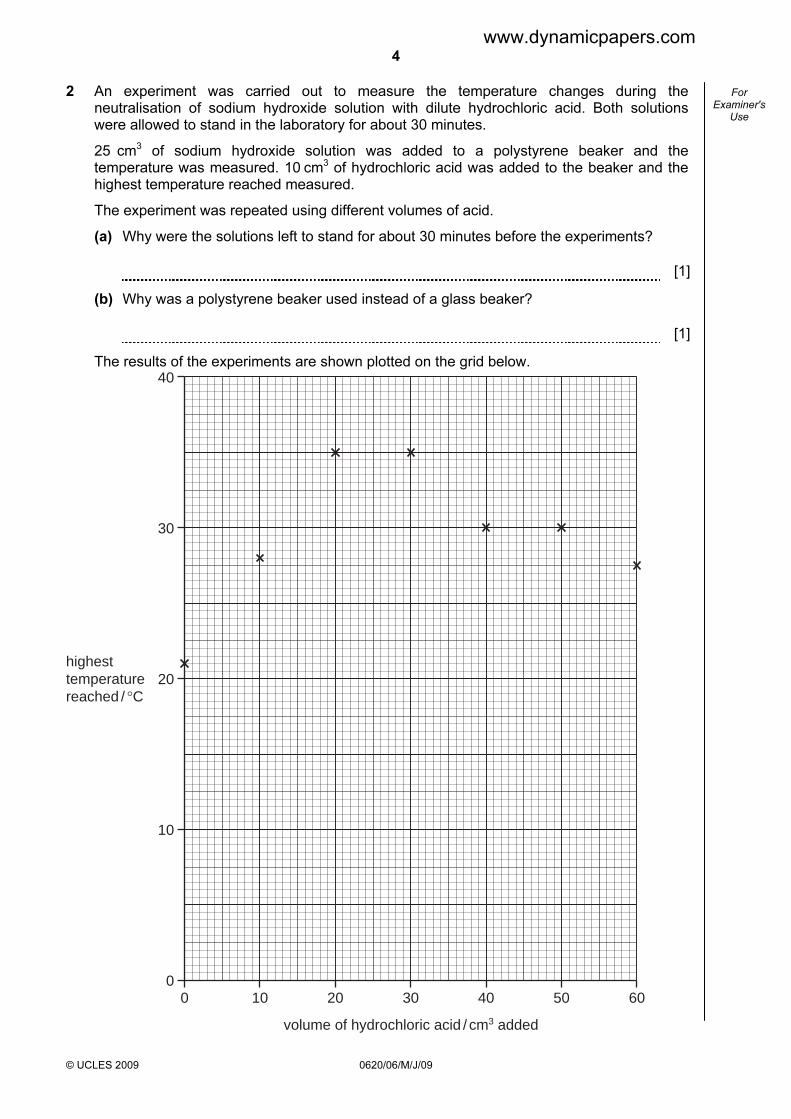
2 An experiment was carried out to measure the temperature changes during the neutralisation of sodium hydroxide solution with dilute hydrochloric acid. Both solutions were allowed to stand in the laboratory for about 30 minutes.
25 cm3 of sodium hydroxide solution was added to a polystyrene beaker and the temperature was measured. 10 cm3 of hydrochloric acid was added to the beaker and the highest temperature reached measured.
The experiment was repeated using different volumes of acid.
(a) Why were the solutions left to stand for about 30 minutes before the experiments?
[1]
(b) Why was a polystyrene beaker used instead of a glass beaker?
[1]
The results of the experiments are shown plotted on the grid below.
0 10 20 30 40 50 60
40
30
20
10
0
volume of hydrochloric acid / cm3 added
highesttemperaturereached / °C
www.dynamicpapers.com
5
© UCLES 2009 0620/06/M/J/09 [Turn over
For
Examiner's
Use
(c) What type of chemical reaction occurs when sodium hydroxide is neutralised by hydrochloric acid?
[1]
(d) (i) Which point appears to be inaccurate?
[1]
(ii) Draw two straight lines through the points and extend them until they cross. [2] (iii) What volume of hydrochloric acid was needed to neutralise 25 cm3 of the sodium
hydroxide solution?
[2]
[Total: 8]
www.dynamicpapers.com
6
© UCLES 2009 0620/06/M/J/09
For
Examiner's
Use
3 Describe a chemical test to distinguish between each of the following pairs of substances. An example is given.
Example: hydrogen and carbon dioxide
test lighted splint
result with hydrogen gives a pop
result with carbon dioxide splint is extinguished
(a) zinc carbonate and zinc chloride
test
result with zinc carbonate
result with zinc chloride [2]
(b) ammonia and chlorine
test
result with ammonia
result with chlorine [3]
(c) aqueous iron(II) sulfate and aqueous iron(III) sulfate
test
result with aqueous iron(II) sulfate
result with aqueous iron(III) sulfate [3]
[Total: 8]
www.dynamicpapers.com
7
© UCLES 2009 0620/06/M/J/09 [Turn over
For
Examiner's
Use
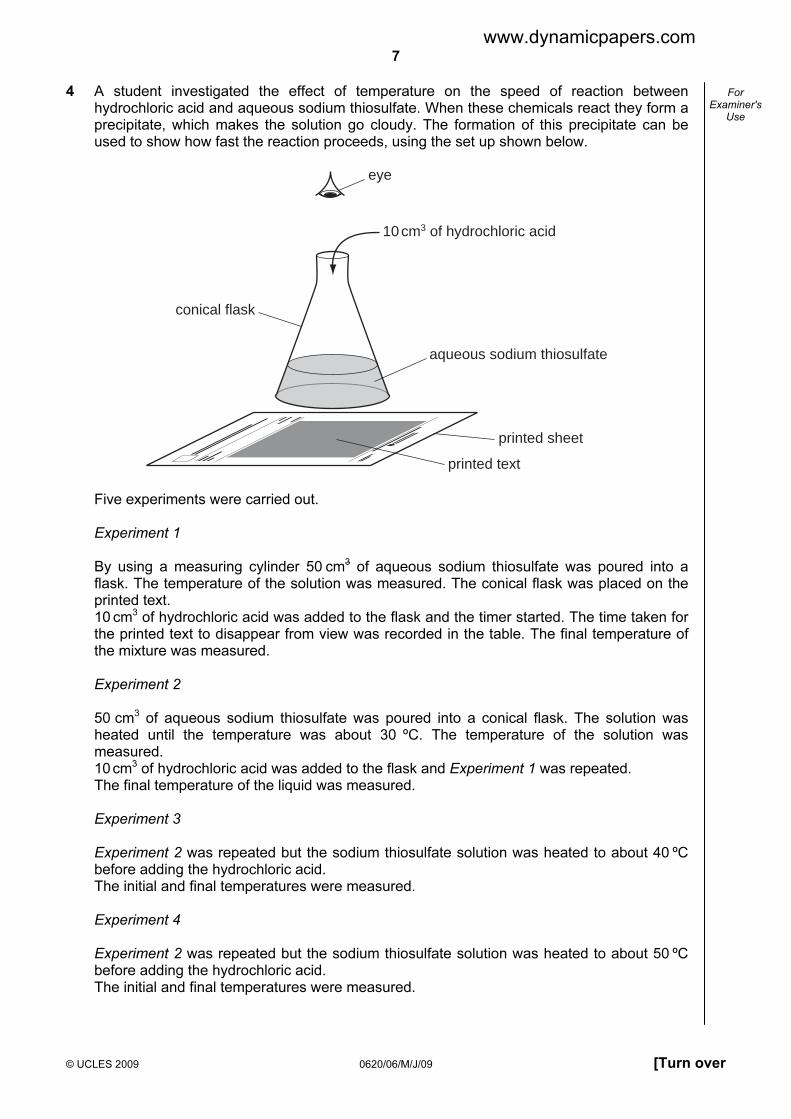
4 A student investigated the effect of temperature on the speed of reaction between hydrochloric acid and aqueous sodium thiosulfate. When these chemicals react they form a precipitate, which makes the solution go cloudy. The formation of this precipitate can be used to show how fast the reaction proceeds, using the set up shown below.
aqueous sodium thiosulfate
eye
10 cm3 of hydrochloric acid
conical flask
printed sheet
printed text Five experiments were carried out. Experiment 1
By using a measuring cylinder 50 cm3 of aqueous sodium thiosulfate was poured into a
flask. The temperature of the solution was measured. The conical flask was placed on the printed text.
10 cm3 of hydrochloric acid was added to the flask and the timer started. The time taken for the printed text to disappear from view was recorded in the table. The final temperature of the mixture was measured.
Experiment 2
50 cm3 of aqueous sodium thiosulfate was poured into a conical flask. The solution was
heated until the temperature was about 30 ºC. The temperature of the solution was measured.
10 cm3 of hydrochloric acid was added to the flask and Experiment 1 was repeated. The final temperature of the liquid was measured. Experiment 3
Experiment 2 was repeated but the sodium thiosulfate solution was heated to about 40 ºC
before adding the hydrochloric acid. The initial and final temperatures were measured. Experiment 4
Experiment 2 was repeated but the sodium thiosulfate solution was heated to about 50 ºC
before adding the hydrochloric acid. The initial and final temperatures were measured.
www.dynamicpapers.com
8
© UCLES 2009 0620/06/M/J/09
For
Examiner's
Use
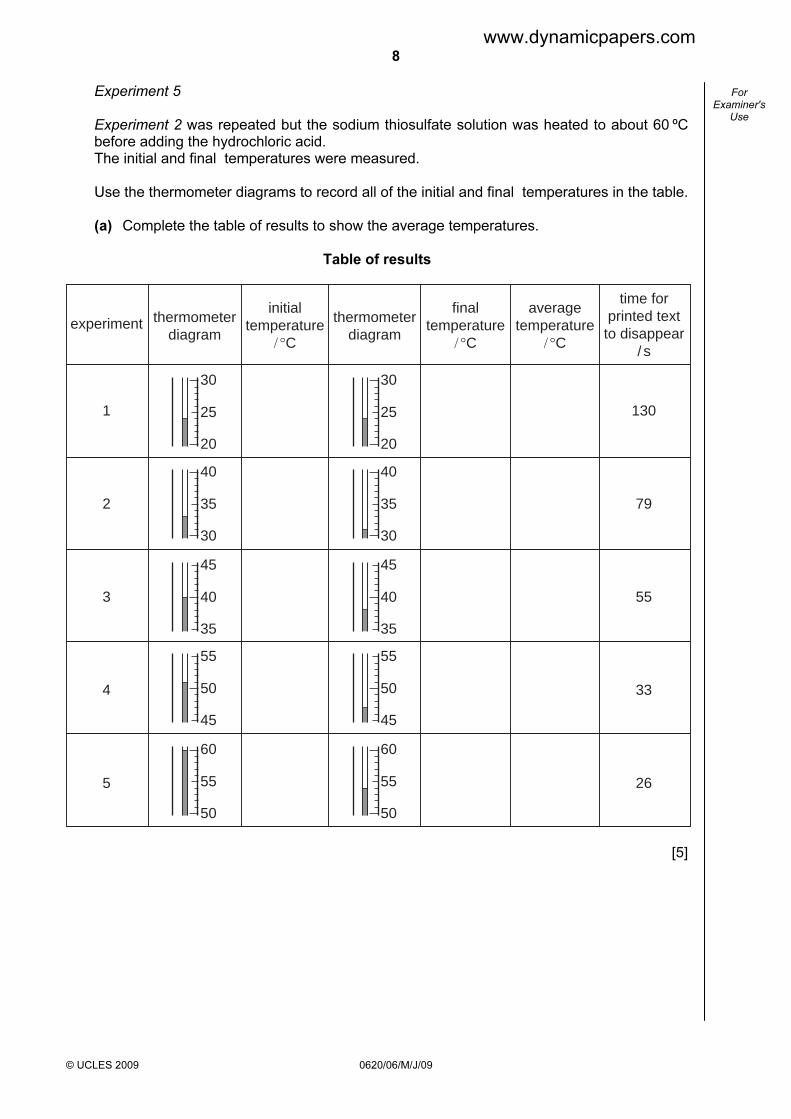
Experiment 5
Experiment 2 was repeated but the sodium thiosulfate solution was heated to about 60 ºC
before adding the hydrochloric acid. The initial and final temperatures were measured. Use the thermometer diagrams to record all of the initial and final temperatures in the table. (a) Complete the table of results to show the average temperatures.
Table of results
experiment
1
2
3
4
5
130
79
55
33
26
thermometerdiagram
initialtemperature
/ °C
thermometerdiagram
finaltemperature
/ °C
averagetemperature
/ °C
time forprinted textto disappear
/ s
30
25
20
40
35
30
45
40
35
55
50
45
60
55
50
30
25
20
40
35
30
45
40
35
55
50
45
60
55
50
[5]
www.dynamicpapers.com
9
© UCLES 2009 0620/06/M/J/09 [Turn over
For
Examiner's
Use
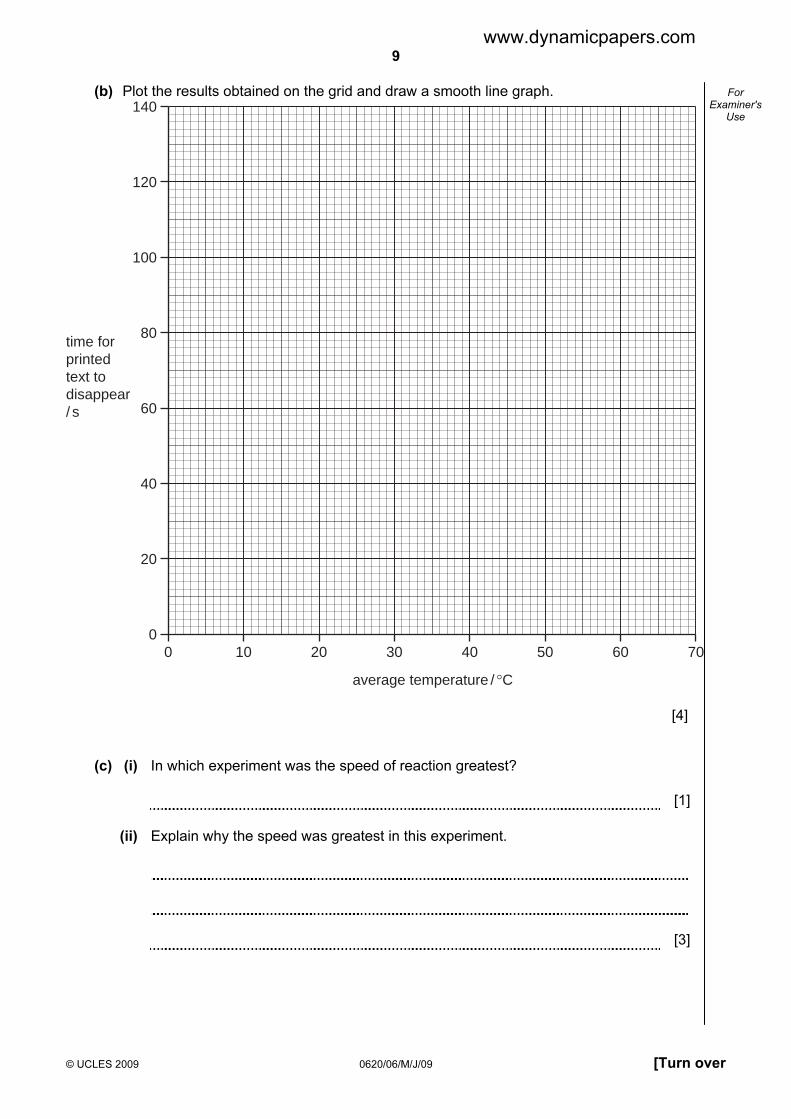
(b) Plot the results obtained on the grid and draw a smooth line graph. 140
120
100
80
60
40
20
0 0 10 20 30 40 50 60 70
time forprinted text todisappear/ s
average temperature / °C [4] (c) (i) In which experiment was the speed of reaction greatest?
[1]
(ii) Explain why the speed was greatest in this experiment.
[3]
www.dynamicpapers.com
10
© UCLES 2009 0620/06/M/J/09
For
Examiner's
Use
(d) Why was the same volume of sodium thiosulfate solution and the same volume of hydrochloric acid used in each experiment?
[1]
(e) (i) From your graph, deduce the time for the printed text to disappear if Experiment 2
was to be repeated at 70 ºC. Show clearly on the grid how you worked out your answer.
[3]
(ii) Sketch on the grid the curve you would expect if all the experiments were repeated
using 50 cm3 of more concentrated sodium thiosulfate solution. [1] (f) Explain one change that could be made to the experimental method to obtain more
accurate results.
change
explanation [2]
[Total: 20]
www.dynamicpapers.com
11
0620/06/M/J/09 [Turn over
BLANK PAGE
Question 5 starts on page 12
www.dynamicpapers.com
12
© UCLES 2009 0620/06/M/J/09
For
Examiner's
Use
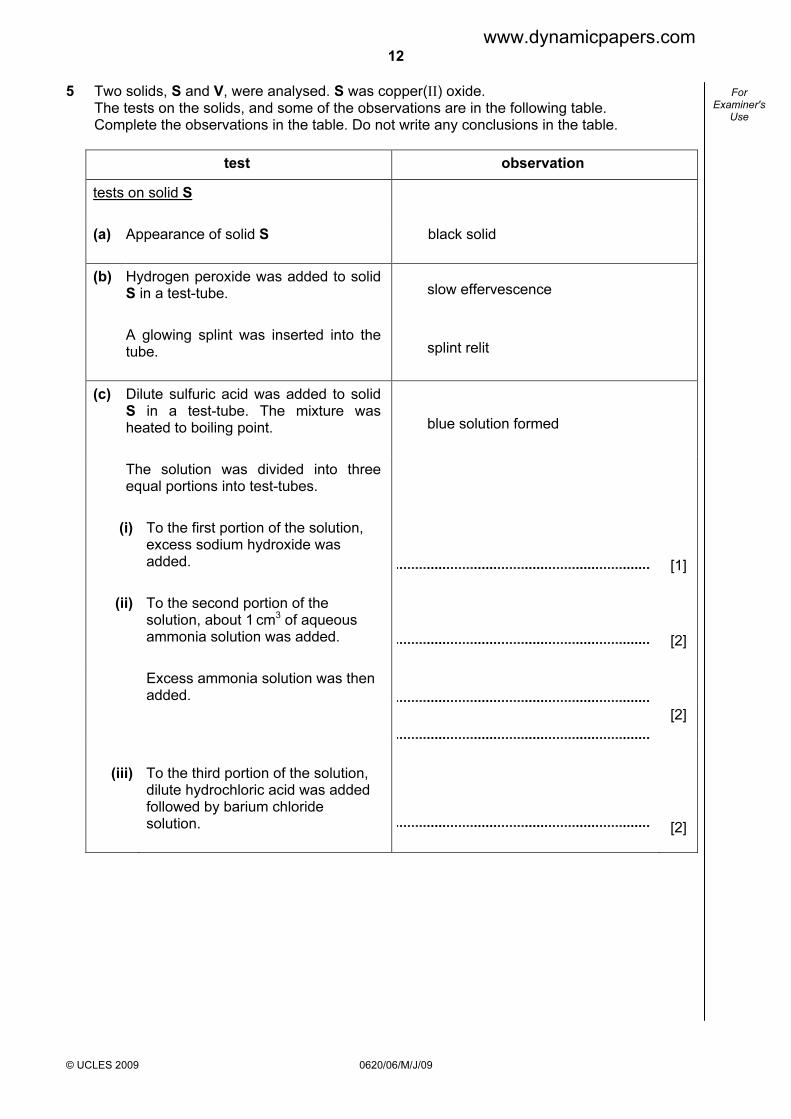
5 Two solids, S and V, were analysed. S was copper(II) oxide. The tests on the solids, and some of the observations are in the following table. Complete the observations in the table. Do not write any conclusions in the table.
test observation
tests on solid S
(a) Appearance of solid S
black solid
(b) Hydrogen peroxide was added to solid S in a test-tube.
slow effervescence
A glowing splint was inserted into the tube.
splint relit
(c) Dilute sulfuric acid was added to solid S in a test-tube. The mixture was heated to boiling point.
blue solution formed
The solution was divided into three equal portions into test-tubes.
(i) To the first portion of the solution, excess sodium hydroxide was added.
[1]
(ii) To the second portion of the solution, about 1 cm3 of aqueous ammonia solution was added.
[2]
Excess ammonia solution was then added.
[2]
(iii)
To the third portion of the solution, dilute hydrochloric acid was added followed by barium chloride solution.
[2]
www.dynamicpapers.com
13
© UCLES 2009 0620/06/M/J/09 [Turn over
For
Examiner's
Use
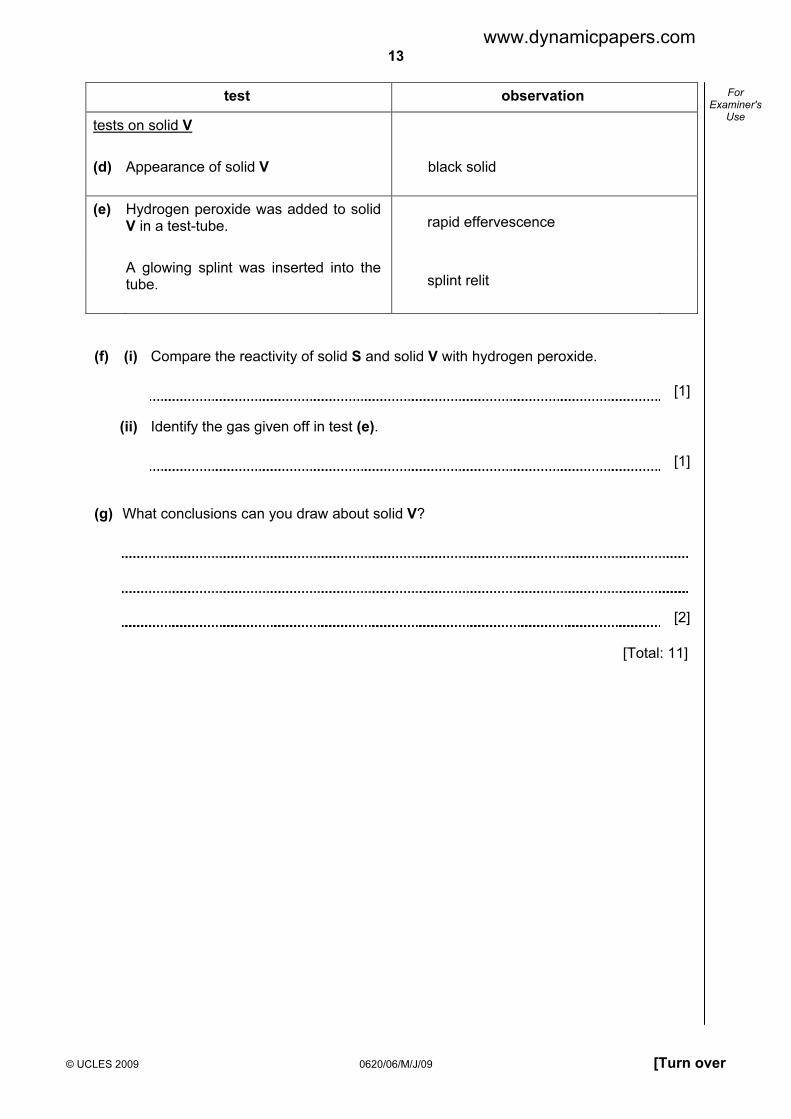
test observation
tests on solid V
(d) Appearance of solid V
black solid
(e) Hydrogen peroxide was added to solid V in a test-tube.
rapid effervescence
A glowing splint was inserted into the tube.
splint relit
(f) (i) Compare the reactivity of solid S and solid V with hydrogen peroxide.
[1]
(ii) Identify the gas given off in test (e).
[1]
(g) What conclusions can you draw about solid V?
[2]
[Total: 11]
www.dynamicpapers.com
14
© UCLES 2009 0620/06/M/J/09
For
Examiner's
Use
6 Acid base indicators Indicators are used to identify acids and bases. Indicators can be obtained from berries and other fruits. (a) Plan an experiment to obtain an aqueous solution of an indicator from some berries.
[3]
(b) Plan an experiment to use the indicator solution to show that it is an effective indicator.
[3]
[Total: 6]
www.dynamicpapers.com
15
0620/06/M/J/09
BLANK PAGE
www.dynamicpapers.com
16
Permission to reproduce items where third-party owned material protected by copyright is included has been sought and cleared where possible. Every reasonable effort has been made by the publisher (UCLES) to trace copyright holders, but if any items requiring clearance have unwittingly been included, the publisher will be pleased to make amends at the earliest possible opportunity.
University of Cambridge International Examinations is part of the Cambridge Assessment Group. Cambridge Assessment is the brand name of University of Cambridge Local Examinations Syndicate (UCLES), which is itself a department of the University of Cambridge.
© UCLES 2009 0620/06/M/J/09
BLANK PAGE
www.dynamicpapers.com

![LIBS TASK OIGSCIEN 11 0620 03 2008 - Dynamic Papersii) Use your answer to (i) to calculate the percentage of iron in rust. [2] (d) Iron from the blast furnace is impure. Two of the](https://img.pdfslide.net/doc/110x75/5ab89a727f8b9a28468d09e1/libs-task-oigscien-11-0620-03-2008-dynamic-ii-use-your-answer-to-i-to-calculate.jpg)
![LIBS TASK OIGSCIEN 11 0620 02 2007 - TheAllPaperstheallpapers.com/papers/CIE/IGCSE/Chemistry (0620... · alkali. [1] (c) Many sweets contain ... What governs the order of the elements](https://img.pdfslide.net/doc/110x75/5b7b26cd7f8b9adb4c8c0735/libs-task-oigscien-11-0620-02-2007-thea-0620-alkali-1-c-many-sweets.jpg)