Embed Size (px)
Citation preview
Advanced Processes and Systems in Manufacturing An International Conference 2016 28 ~ 30 August 2016- Kuala Lumpur, pp. 53-54
53
Life Cycle Asessment Based-Approach in Designing Environmentally Conscious Products
Tatbita Titin Suhariyanto*, Dzuraidah Abd Wahab, Mohd Nizam Ab Rahman
Department of Mechanical and Materials Engineering, Faculty of Engineering and Built Environment, Universiti Kebangsaan Malaysia,
43600 UKM Bangi, Selangor, Malaysia.
*Corresponding e-mail: [email protected]: E-Waste, Life Cycle Assessment, Design for Environment.
ABSTRACT – The ever increasing quantity of electric and electronic waste (e-waste) has led manufacturers and stakeholders to consider developing environmentally conscious products in order to mitigate their adverse impact on the environment. This strategy however requires a structured approach that takes into consideration the impact of the product during its life cycle and how the study can influence the design of the product for effective recovery at the end of its useful life. Accordingly, this paper aims to provide an integration of Life Cycle Assessment (LCA) and Design for Environment (DfE) for establishing environmentally conscious products. This study contains two important stages and uses a water leakage alarm as a case example. The first stage is assessing the environmental impacts of the product through LCA. The result of this study shows that most environmental impacts occur at the disposal of batteries, cable, and PCB to landfill. The next step is to develop some scenarios for sustainable improvements and verify the environmental improvements resulting from changes in the product’s life cycle. Some sustainable improvements to resolve these problems are recycling batteries, using rechargeable batteries, and recycling cables and PCB along with the product. Then, the last step is to establish a simple DfE guideline based on the LCA result. This approach provides a systematic and objective way in pursuit of sustainable products.
1. INTRODUCTIONIn 2014, the global quantity of e-waste generation
was around 41.8 million tons [1]. This figure will continue to rise along with the human productivity and innovation technology. According to [2], up to 90% of the world’s e-waste is illegally traded or dumped each year. This circumstance alerts many stakeholders, such as designer, manufacturer, user, government, etc., to take sustainability actions.
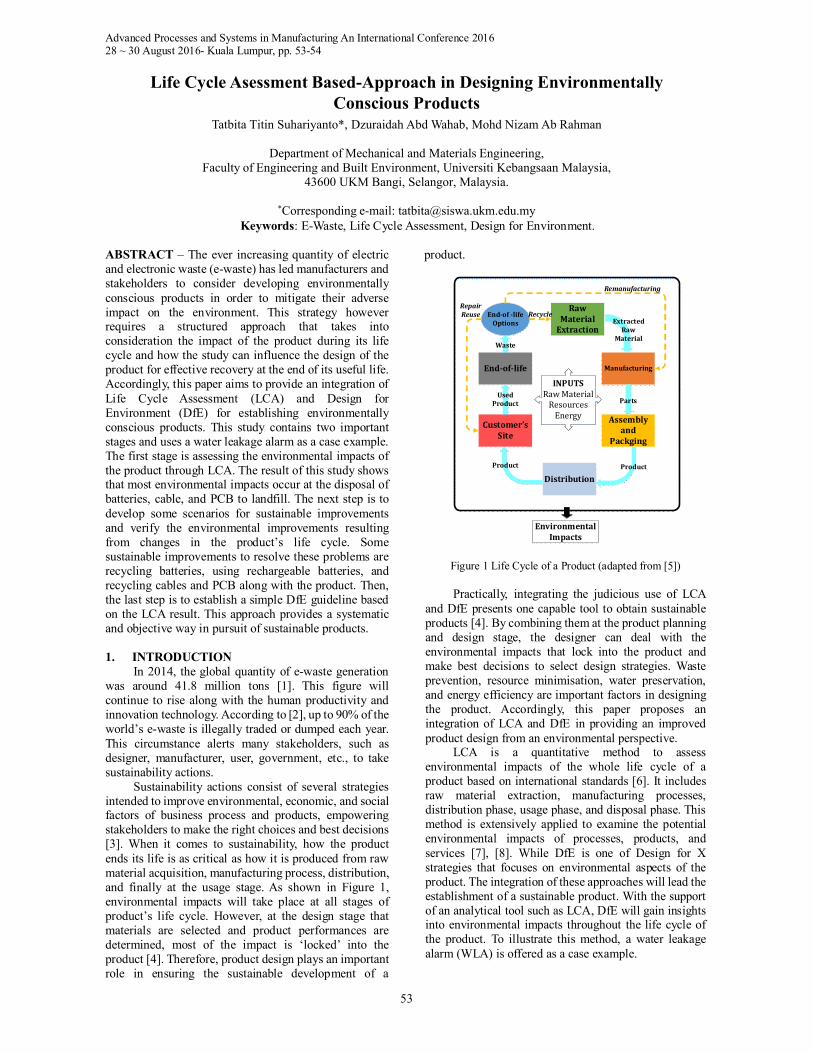
Sustainability actions consist of several strategies intended to improve environmental, economic, and social factors of business process and products, empowering stakeholders to make the right choices and best decisions [3]. When it comes to sustainability, how the product ends its life is as critical as how it is produced from raw material acquisition, manufacturing process, distribution, and finally at the usage stage. As shown in Figure 1, environmental impacts will take place at all stages of product’s life cycle. However, at the design stage that materials are selected and product performances are determined, most of the impact is ‘locked’ into the product [4]. Therefore, product design plays an important role in ensuring the sustainable development of a
product.
Raw Material
Extraction
Manufacturing
Assembly and
Packging
Distribution
Customer’s Site
End-of-life
Extracted Raw
Material
Parts
Product
Used Product
Product
End-of -life Options
Waste
INPUTSRaw Material
ResourcesEnergy
Environmental Impacts
Remanufacturing
RepairReuse Recycle
Figure 1 Life Cycle of a Product (adapted from [5])
Practically, integrating the judicious use of LCA and DfE presents one capable tool to obtain sustainable products [4]. By combining them at the product planning and design stage, the designer can deal with the environmental impacts that lock into the product and make best decisions to select design strategies. Waste prevention, resource minimisation, water preservation, and energy efficiency are important factors in designing the product. Accordingly, this paper proposes an integration of LCA and DfE in providing an improved product design from an environmental perspective.
LCA is a quantitative method to assess environmental impacts of the whole life cycle of a product based on international standards [6]. It includes raw material extraction, manufacturing processes, distribution phase, usage phase, and disposal phase. This method is extensively applied to examine the potential environmental impacts of processes, products, and services [7], [8]. While DfE is one of Design for X strategies that focuses on environmental aspects of the product. The integration of these approaches will lead the establishment of a sustainable product. With the support of an analytical tool such as LCA, DfE will gain insights into environmental impacts throughout the life cycle of the product. To illustrate this method, a water leakage alarm (WLA) is offered as a case example.
54
2. METHODOLOGYThis study contains two important stages. The first
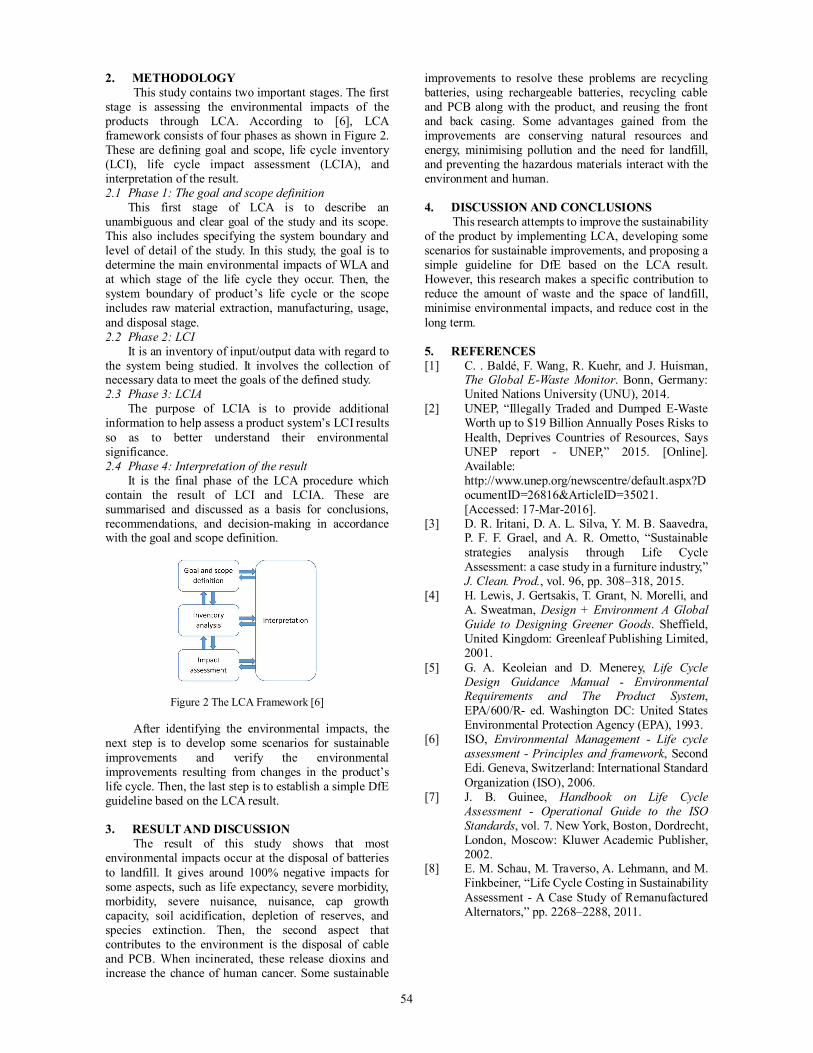
stage is assessing the environmental impacts of the products through LCA. According to [6], LCA framework consists of four phases as shown in Figure 2. These are defining goal and scope, life cycle inventory (LCI), life cycle impact assessment (LCIA), and interpretation of the result. 2.1 Phase 1: The goal and scope definition
This first stage of LCA is to describe an unambiguous and clear goal of the study and its scope. This also includes specifying the system boundary and level of detail of the study. In this study, the goal is to determine the main environmental impacts of WLA and at which stage of the life cycle they occur. Then, the system boundary of product’s life cycle or the scope includes raw material extraction, manufacturing, usage, and disposal stage. 2.2 Phase 2: LCI
It is an inventory of input/output data with regard to the system being studied. It involves the collection of necessary data to meet the goals of the defined study. 2.3 Phase 3: LCIA
The purpose of LCIA is to provide additional information to help assess a product system’s LCI results so as to better understand their environmental significance. 2.4 Phase 4: Interpretation of the result
It is the final phase of the LCA procedure which contain the result of LCI and LCIA. These are summarised and discussed as a basis for conclusions, recommendations, and decision-making in accordance with the goal and scope definition.
Figure 2 The LCA Framework [6]
After identifying the environmental impacts, the next step is to develop some scenarios for sustainable improvements and verify the environmental improvements resulting from changes in the product’s life cycle. Then, the last step is to establish a simple DfE guideline based on the LCA result.
3. RESULT AND DISCUSSIONThe result of this study shows that most
environmental impacts occur at the disposal of batteries to landfill. It gives around 100% negative impacts for some aspects, such as life expectancy, severe morbidity, morbidity, severe nuisance, nuisance, cap growth capacity, soil acidification, depletion of reserves, and species extinction. Then, the second aspect that contributes to the environment is the disposal of cable and PCB. When incinerated, these release dioxins and increase the chance of human cancer. Some sustainable
improvements to resolve these problems are recycling batteries, using rechargeable batteries, recycling cable and PCB along with the product, and reusing the front and back casing. Some advantages gained from the improvements are conserving natural resources and energy, minimising pollution and the need for landfill, and preventing the hazardous materials interact with the environment and human.
4. DISCUSSION AND CONCLUSIONSThis research attempts to improve the sustainability
of the product by implementing LCA, developing some scenarios for sustainable improvements, and proposing a simple guideline for DfE based on the LCA result. However, this research makes a specific contribution to reduce the amount of waste and the space of landfill, minimise environmental impacts, and reduce cost in the long term.
5. REFERENCES[1] C. . Baldé, F. Wang, R. Kuehr, and J. Huisman,
The Global E-Waste Monitor. Bonn, Germany:United Nations University (UNU), 2014.
[2] UNEP, “Illegally Traded and Dumped E-WasteWorth up to $19 Billion Annually Poses Risks toHealth, Deprives Countries of Resources, SaysUNEP report - UNEP,” 2015. [Online].Available:http://www.unep.org/newscentre/default.aspx?DocumentID=26816&ArticleID=35021.[Accessed: 17-Mar-2016].
[3] D. R. Iritani, D. A. L. Silva, Y. M. B. Saavedra,P. F. F. Grael, and A. R. Ometto, “Sustainablestrategies analysis through Life CycleAssessment: a case study in a furniture industry,”J. Clean. Prod., vol. 96, pp. 308–318, 2015.
[4] H. Lewis, J. Gertsakis, T. Grant, N. Morelli, andA. Sweatman, Design + Environment A GlobalGuide to Designing Greener Goods. Sheffield,United Kingdom: Greenleaf Publishing Limited,2001.
[5] G. A. Keoleian and D. Menerey, Life CycleDesign Guidance Manual - EnvironmentalRequirements and The Product System,EPA/600/R- ed. Washington DC: United StatesEnvironmental Protection Agency (EPA), 1993.
[6] ISO, Environmental Management - Life cycleassessment - Principles and framework, SecondEdi. Geneva, Switzerland: International StandardOrganization (ISO), 2006.
[7] J. B. Guinee, Handbook on Life CycleAssessment - Operational Guide to the ISOStandards, vol. 7. New York, Boston, Dordrecht,London, Moscow: Kluwer Academic Publisher,2002.
[8] E. M. Schau, M. Traverso, A. Lehmann, and M.Finkbeiner, “Life Cycle Costing in SustainabilityAssessment - A Case Study of RemanufacturedAlternators,” pp. 2268–2288, 2011.
Advanced Processes and Systems in Manufacturing An International Conference 2016 28 ~ 30 August 2016- Kuala Lumpur, pp. 55-56
55
Improved Traffic Light Controller Based on Fuzzy Inference System D R Jaya Bhanu Rao*, Ahmad Zakaria
Universiti Kuala Lumpur, Institute of Product Design and Manufacturing(IPROM),
56100 Cheras, Kuala Lumpur, Malaysia.
*Corresponding e-mail: [email protected]: Fuzzy Inference System; Traffic Management System; Fuzzy rules
ABSTRACT – The number of vehicles on the road has been significantly increasing every year throughout the world. This phenomenon has lead to a severe traffic congestion especially in many highly populated cities. In order to ease this congestion, an effective and robust traffic control system is necessary. The current method of controlling the traffic light is based on the ‘time-of the-day’ approach. With this technique, the switching of traffic light takes place at a constant cycle time everyday. A predetermined light control sequence in a specified duration has been implemented for peak hours and off- peak hours daily. This approach does not provide an efficient solution for a smooth control of the traffic flow. In the current practice, a traffic police officer will be placed on duty at designated junctions to control the traffic congestion. An improved traffic light control system based on fuzzy inference system(FIS) can be implemented to ensure a smooth traffic flow without long queues and delays. The main objective of this design of control system is to avoid long delays of traffic especially during peak hours and also to avoid any police personnel at the scene. The concept of fuzzy rules that have been incorporated is similar to the way a traffic police controls the traffic congestion. In this case, the duration the green light is extended or stopped depending on the number of vehiches approaching the junction and the length of the queue of the vehicles during the stop mode at the red light. A miniature working model for an isolated 3–lane intersection junction with traffic lights has been constructed to demonstrate the fuzzy traffic light control system. The fuzzy controller has been designed and simulated in MATLAB with fuzzy logic toolbox. The fuzzy controller has been written in C code and loaded in Arduino Due microcontroller board to control the traffic lights. Data related to traffic parameters is collected in Arduino IDE environment. The final output in terms of time delay of the existing controller is then compared with output from the fuzzy controller in order to monitor the significant effectiveness of the improved controller.
1. INTRODUCTIONTraffic lights have become very popular in
controlling the traffic flow at many cities throughout the world. Significant increase in the number vehicles on the road has lead to severe traffic congestion especially during the peak hours in highly populated areas. The primary objectives of the traffic light system are improving the traffic flow at intersection, ensuring traffic safety, optimizing queues on the presence of vehicles at the intersection and reducing the delays.
Based on these factors, requirement for a precise, effective and robust traffic light controller is absolutely essential for environmental and economical betterment[1].
A typical traffic light navigates the oncoming vehiches at an intersection by frequently changing the lights at constant cycle time. There is also another type of traffic light controller which follows the concept of time-of-the-day. In this case, the controller has been preprogrammed to execute the instructions in a specified routine for peak hours and off-peak hours operation. In another case, the presence of the vehicles is detected by means of specialized sensors which are embedded on the road surface at the intersection. Vehicles triggers the sensor and the duration of the green light period will be adjusted accordingly between mimimum and maximum period based on the traffic movement. Minimum green light duration refers to the time when one vehicle passes through the intersection upon detection. The length of this duration is governed by the maximum green light duration. In this controller, a continuous evaluation takes place in order to control the traffic light switching time either to end the status of the current light and transfer to next light or to continue with the existing light. The continuous detection process of the vehiches is carried out consistently and based on the status, an appropriate decision will be made by the controller for non-stop operation.
There are some drawbacks in controlling the switching time of the traffic lights as discussed by Kulkarni and Waingankar[1] such as limited time interval in repeating the switching operation, accurate prediction in the next traffic condition is impossible, limited capability of the detectors in capturing the details of the traffic condition and inability to optimize the traffic parameters such as length of the queue, delays and the rate on stopping of vehicles at the intersection. When the traffic congestion becomes severe, a traffic police personnel will be stationed at the intersection to overwrite the traffic signals and control manually. In this occasion the police officer usually identifies the lane with longest queue and then prolongs the vehicle movements for approximately 5 to 7 minutes. After that vehicles will be stopped and allows the second longest queue to proceed within the same time frame. If the second lane queue is shorter than the first queue, the duration of flow will be reduced to approximately 3 to 4 minutes. This process will be repeated for the rest of the lanes to ensure a smooth traffic flow at the intersection.
An introduction of human labour in the traffic controlling system can cause intermittent and uncertainty in the traffic flow eventhough there is a
56
significant improvement in the reduction of traffic delays. However, this method is entirely impractical for daily routine for safety reasons of the vehicles and also the traffic personnel. Hence, an improved traffic light controller based on fuzzy inference system(FIS) can be utilized as an optimum controller for continuously varying traffic congestion. The main objective of this design of control system is to avoid long delays of traffic especially during peak hours and also to avoid any police personnel at the scene. Fuzzy inference system controller is a non-linear control system which is capable of executing variable and inaccurate traffic data for signal timings. The main idea in the implementation of the FIS is ‘to model the control strategy based on human expert knowledge rather than modelling of the process itself’[2]. Many researchers have contributed in developing the control of a suitable control strategy for the traffic light in order to improve the traffic congestion.
Pappis and Mamdani[3] implemented a fuzzy logic traffic light control system in a one intersection with two one-way lanes. Linguistic control statement were utilized in the design of fuzzy signal control. In this case, a set of linguistic rules have been derived to the traffic signal control by means of graded method of FIS. Each interval takes place at every 10s during every stage of the green light. Continuous decision making on the length of green light takes place at each interval.
Trabia, Kaseko and Ande [3] worked on the fuzzy logic traffic controller for 4-appraoch intersection with both straight and left turning directions. It measures the flow of oncoming vehicles and estimates the length of the queue at regular periods. There are 2 levels of control in this approach in which the first level estimates the intensity of traffic congestion for every lane. In the second level, based on this information, the controller decides either to extend or to terminate the existing phase.
This paper discusses on the implementation of FIS controller for intersection with three lanes using a minaturised traffic light model. The FIS controller is designed by using Fuzzy Logic toolbox in the MATLAB software. The final algorithm has been written in C code and uploaded onto Arduino Due board. This board controls the traffic light at the minaturised model of a three lane intersection. Data on the traffic light parameters is collected and monitored on the Arduino IDE open source platform that was utilised for conducting the experiment.
This paper is written as follows: Methodology discusses on the approach that has been utilized in designing the FIS traffic controller. The selection on the membership function rules have also been demonstrated under this section. Results and Discussion illustrates the collected data for the traffic light parameters. Analysis on the results is discussed to compare between the fixed timing controller versus FIS controller. Conclusion describes on the future work.
2. METHODOLOGYIn this research paper, the implementation of FIS
controller for the traffic light is discussed in detail. FIS has been selected for this project due to its advantage in accepting non-linear parameters that are similar to the
way human controls and behaves in activities such as traffic control. The fundamental theory in the design of FIS is based on methods graded in handling inaccuracies and uncertainties in the field of real-life applications.
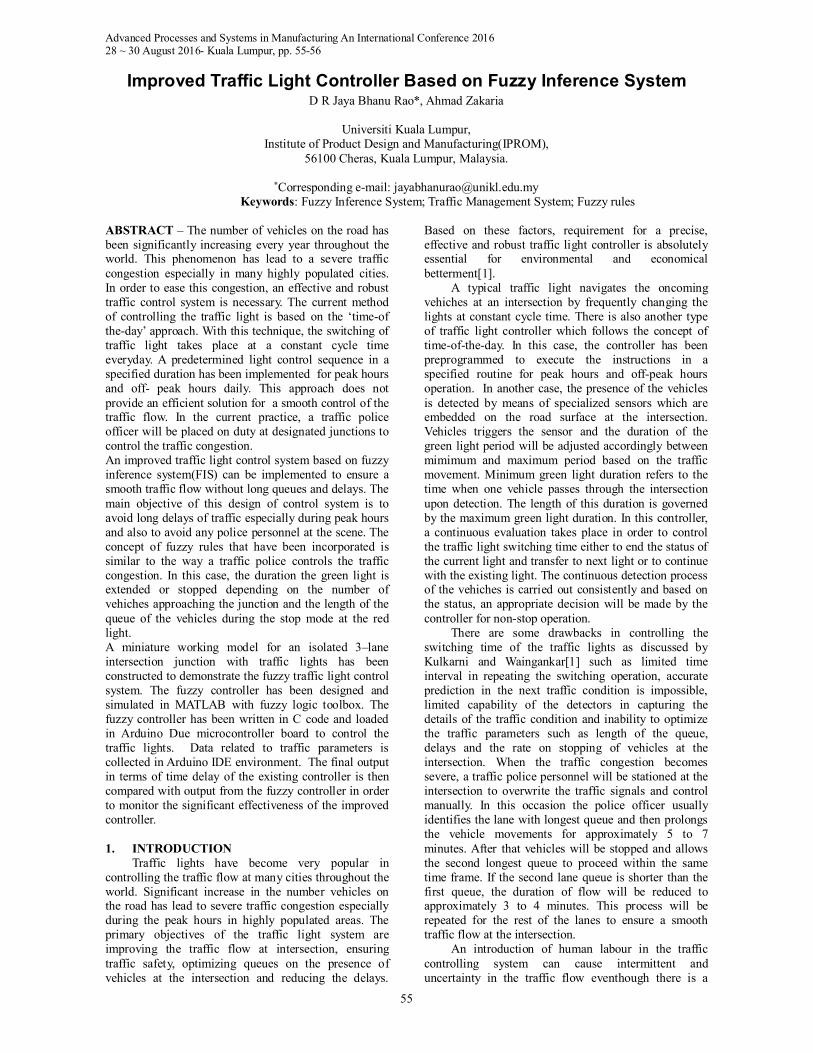
FIS permits linguistic and inexact data to be manipulated in determining the timing of the traffic signals. In this paper, a FIS traffic light controller is designed for 3-lane intersection as illustrated in Figure 1.
Figure 1 Configuration of 3-lane intersection with sensors
The miniturised 3-lane intersection has been constructed according to Figure 1. It consists of intersection with 3 signalling points in which each point represents each lane. Sensors are mounted on the road for each lane in order to detect the presence of the oncoming vehicles and also to count on the number of vehicles that passes through each lane. By taking into account on the frequency of detection for each vehicle, an estimated length of the queue can be easily calculated.
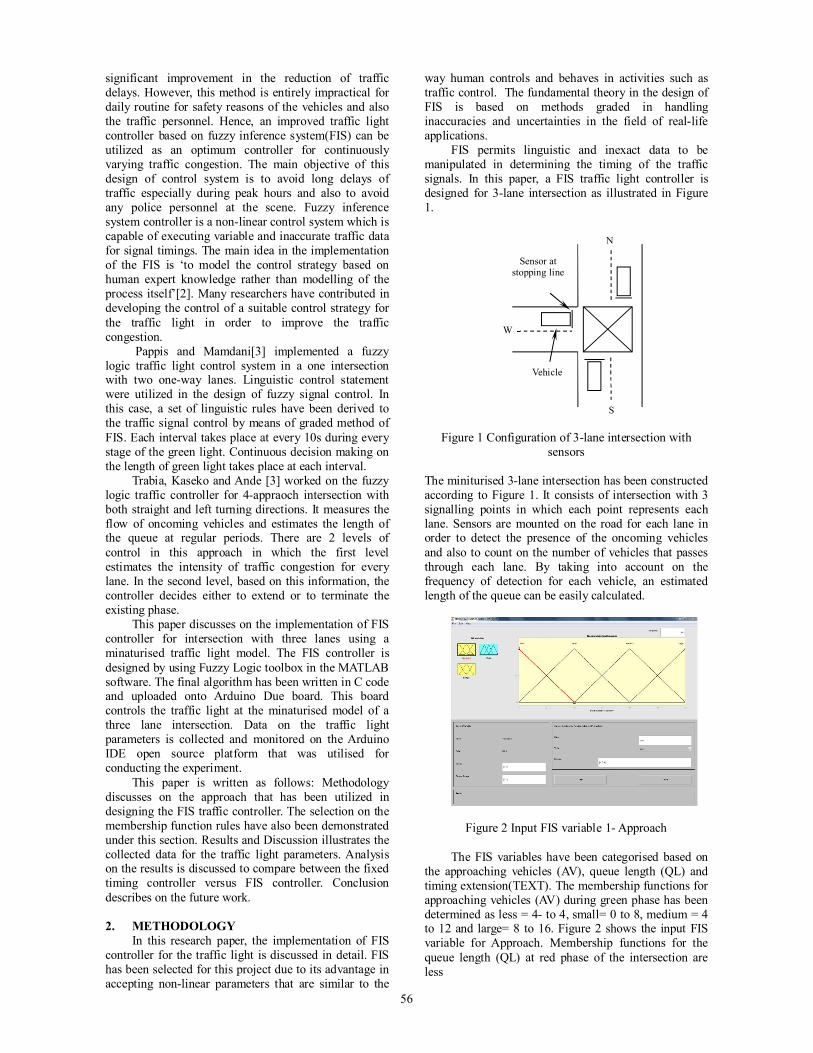
Figure 2 Input FIS variable 1- Approach
The FIS variables have been categorised based on the approaching vehicles (AV), queue length (QL) and timing extension(TEXT). The membership functions for approaching vehicles (AV) during green phase has been determined as less = 4- to 4, small= 0 to 8, medium = 4 to 12 and large= 8 to 16. Figure 2 shows the input FIS variable for Approach. Membership functions for the queue length (QL) at red phase of the intersection are less
N
S
W
Sensor at stopping line
Vehicle
Advanced Processes and Systems in Manufacturing An International Conference 2016 28 ~ 30 August 2016- Kuala Lumpur, pp. 57-58
57
The Simultaneous Influence of Product and Service Quality on Customer Satisfaction in Automotive After Sales Service
Omar Sabbagha*, Mohd Nizam Ab Rahmana*, Wan Rosmanira Ismailb, Wan Mohd Hirwani Wan Hussainc
a Department of Mechanical and Materials Engineering, Faculty of Engineering & Built Environment, Universiti Kebangsaan Malaysia, 43600 UKM Bangi, Selangor, Malaysia
b School of Mathematical Sciences, Faculty of Science and Technology, Universiti Kebangsaan Malaysia, 43600 UKM Bangi, Selangor, Malaysia
c Graduate School of Business, Universiti Kebangsaan Malaysia, 43600 UKM Bangi, Selangor, Malaysia * Corresponding Author: Tel.: +60 19 255 4406.
Email address: ([email protected], [email protected])
Keywords: Automotive after sales, customer satisfaction, service quality, product quality
ABSTRACT – Customer satisfaction value is a key differentiator in many economic sectors including the automotive industry. Literature reports the direct influence of product quality and service quality on the customer satisfaction, however, the implementation of these practices in dealerships context is a very challenging issue and it is distinctively investigated, thus it is worthy to investigate the simultaneous influence of these antecedents as they are remarkably interrelated. A survey based research methodology is adopted and randomly targeted the car owners in Malaysia who perform the required service in the authorized service centres. Of the 600 customers that are met in the automotive 389 complete questionnaires usable for the data analysis stage performed with the help of structural equation modelling SEM technique. Results demonstrate that the overall proposed model shows an adequate fit, while service quality is considered to be an important factor in leveraging the customer satisfaction; in contrary to product quality, which demonstrates less importance than with service quality. Notably, this study provides evidence that customer satisfaction value relies on metrics compromising operational measures for service and product quality. The model contributes to sensitising the decision makers from both manufacturing and service aspects to the interdependencies and the perquisite for overall collaborative development. Further, it addresses the interests of both the manufacturers and the dealers, who are attempting to preserve their quality level to influence repetitive purchase and service activities.
INTRODUCTION In the contemporary high intense of competition, customer satisfaction has been channelling the route to survive in the market, thus the firms focus on gaining a high rate of customer satisfaction and loyalty by optimizing their perception of service product quality [1]. Surprisingly, there is no consensus in the literature on the customer satisfaction measurable dimensions, whereas the researchers emphasize the multi-faceted essence of customer satisfaction paradigm [2]. Customer satisfaction is not a new research objective
and previous studies have encompassed an array of factors that have a direct influence on customer satisfaction such as service and product quality [3]. Although the service quality concept has been extensively examined in literature, the service quality measurable is still a controversial issue for the both academicians and practitioners [4]. Nevertheless, the quality concept continues to be elusive for many organizations [5]. This study aims to investigate the simultaneous influence of the both service and product quality on customer satisfaction. Thus the authors employ survey-based methodology with structural equation modelling SEM analysis tool to analyse the data collected from Malaysian automotive market.
1. LITERATURE REVIEW Customer satisfaction and service quality are highly related to each other [2], [6] and service quality isconsidered as an important antecedent of customersatisfaction [7]. in addition, there is a consensus inliterature on the direct influence of product quality andservice quality on the customer satisfaction, however,the implementation of these practices in dealershipscontext is a very challenging issue [8]. therefore wepropose the following hypotheses:H1. : Service quality influences positively the customersatisfactionH2. : Product quality has a positive effect on customersatisfaction
2. METHODOLOGYthe authors employ a quantitative survey basedmethodology accompanied with the analysis tool SEM to test empirically the proposed hypothesis, besides theauthors adopt Likert scale from 1 to 5 matching thecustomer's satisfaction levels. The survey isadministered to target randomly the car owners in Malaysia who perform the required service in theauthorized service centres. Of the 600 customers that
58
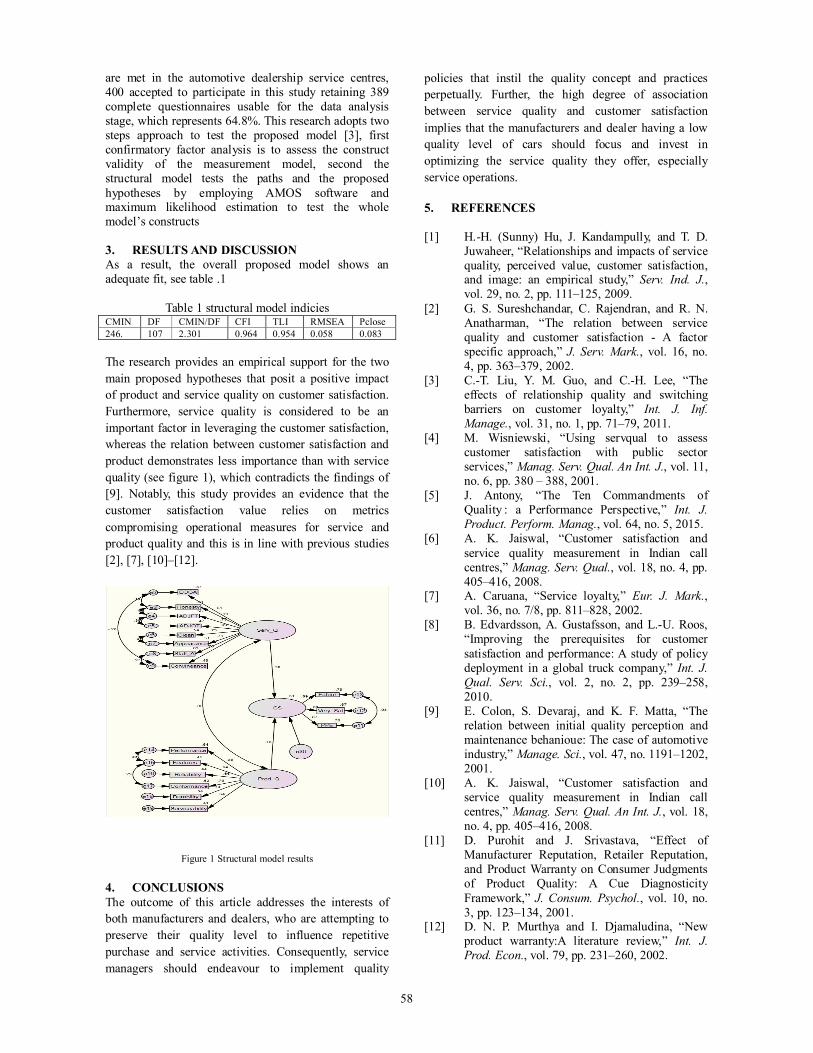
are met in the automotive dealership service centres, 400 accepted to participate in this study retaining 389 complete questionnaires usable for the data analysis stage, which represents 64.8%. This research adopts two steps approach to test the proposed model [3], first confirmatory factor analysis is to assess the construct validity of the measurement model, second the structural model tests the paths and the proposed hypotheses by employing AMOS software and maximum likelihood estimation to test the whole model’s constructs 3. RESULTS AND DISCUSSION As a result, the overall proposed model shows an adequate fit, see table .1
Table 1 structural model indicies CMIN DF CMIN/DF CFI TLI RMSEA Pclose 246. 107 2.301 0.964 0.954 0.058 0.083 The research provides an empirical support for the two main proposed hypotheses that posit a positive impact of product and service quality on customer satisfaction. Furthermore, service quality is considered to be an important factor in leveraging the customer satisfaction, whereas the relation between customer satisfaction and product demonstrates less importance than with service quality (see figure 1), which contradicts the findings of [9]. Notably, this study provides an evidence that the customer satisfaction value relies on metrics compromising operational measures for service and product quality and this is in line with previous studies [2], [7], [10]–[12].
Figure 1 Structural model results 4. CONCLUSIONS The outcome of this article addresses the interests of both manufacturers and dealers, who are attempting to preserve their quality level to influence repetitive purchase and service activities. Consequently, service managers should endeavour to implement quality
policies that instil the quality concept and practices perpetually. Further, the high degree of association between service quality and customer satisfaction implies that the manufacturers and dealer having a low quality level of cars should focus and invest in optimizing the service quality they offer, especially service operations. 5. REFERENCES [1] H.-H. (Sunny) Hu, J. Kandampully, and T. D.
Juwaheer, “Relationships and impacts of service quality, perceived value, customer satisfaction, and image: an empirical study,” Serv. Ind. J., vol. 29, no. 2, pp. 111–125, 2009.
[2] G. S. Sureshchandar, C. Rajendran, and R. N. Anatharman, “The relation between service quality and customer satisfaction - A factor specific approach,” J. Serv. Mark., vol. 16, no. 4, pp. 363–379, 2002.
[3] C.-T. Liu, Y. M. Guo, and C.-H. Lee, “The effects of relationship quality and switching barriers on customer loyalty,” Int. J. Inf. Manage., vol. 31, no. 1, pp. 71–79, 2011.
[4] M. Wisniewski, “Using servqual to assess customer satisfaction with public sector services,” Manag. Serv. Qual. An Int. J., vol. 11, no. 6, pp. 380 – 388, 2001.
[5] J. Antony, “The Ten Commandments of Quality : a Performance Perspective,” Int. J. Product. Perform. Manag., vol. 64, no. 5, 2015.
[6] A. K. Jaiswal, “Customer satisfaction and service quality measurement in Indian call centres,” Manag. Serv. Qual., vol. 18, no. 4, pp. 405–416, 2008.
[7] A. Caruana, “Service loyalty,” Eur. J. Mark., vol. 36, no. 7/8, pp. 811–828, 2002.
[8] B. Edvardsson, A. Gustafsson, and L.-U. Roos, “Improving the prerequisites for customer satisfaction and performance: A study of policy deployment in a global truck company,” Int. J. Qual. Serv. Sci., vol. 2, no. 2, pp. 239–258, 2010.
[9] E. Colon, S. Devaraj, and K. F. Matta, “The relation between initial quality perception and maintenance behanioue: The case of automotive industry,” Manage. Sci., vol. 47, no. 1191–1202, 2001.
[10] A. K. Jaiswal, “Customer satisfaction and service quality measurement in Indian call centres,” Manag. Serv. Qual. An Int. J., vol. 18, no. 4, pp. 405–416, 2008.
[11] D. Purohit and J. Srivastava, “Effect of Manufacturer Reputation, Retailer Reputation, and Product Warranty on Consumer Judgments of Product Quality: A Cue Diagnosticity Framework,” J. Consum. Psychol., vol. 10, no. 3, pp. 123–134, 2001.
[12] D. N. P. Murthya and I. Djamaludina, “New product warranty:A literature review,” Int. J. Prod. Econ., vol. 79, pp. 231–260, 2002.
Advanced Processes and Systems in Manufacturing An International Conference 2016 28 ~ 30August 2016- Kuala Lumpur, pp. 59-60
59
Shoulder and Leg Activation Pattern in Car Gearing Action Nor KamalianaKhamis1*,,Baba Md Deros1, Roslizawati Nawawi2
1) Department of Mechanical and Material Engineering,
Faculty of Engineering and Built Environment, UniversitiKebangsaan Malaysia, 43600 Bangi, Selangor, Malaysia.
2)Physiotherapy Department, Faculty of Health Science, Lincoln University College,
Petaling Jaya, Selangor, Malaysia.
*Corresponding e-mail: [email protected] Keywords: Gear; Driver; Car simulator; Shoulder; Leg; Amplitude analysis
ABSTRACT –Understanding of the muscle activity and its activation in driving task is very important. It can provide more knowledge to study the effects of the muscle when performing different styles of driving task with certain duration. The main objective of this study is to investigate the role of the main parts in shoulder and leg with regards to certain driving condition when performing gearing action. Two main muscle parts were selected in this study, namely, deltoid anterior (DA) and gastrocnemius medialis (GM). A simulator with manual transmission was used in this study. Two female subjects with more than three years driving experience participated in this study. All respondents were required to drive the car simulator for 15 minutes and the EMG signal was recorded during pre-driving and post-driving task. Research findings show that the left DA muscle has significant difference with respect to the signal pattern when changing and holding the gear from free gear to gear 1 and to gear 2, while the right DA and the left GM show no significant difference in its activation between each gear action. 1. INTRODUCTION
Driving tasks require physical demands from the driver to maintain their posture in a constrained space [1]. Therefore, there is frequent occurrence of complaints regarding muscle pain after driving [2]. Throughout the driving activity, drivers have direct physical contact with the car seat, steering wheel, gear and pedals [3].
In terms of gear transmission activity, changing the gear is expected to engage shoulder and left leg parts. Therefore, the changes in the muscle activity of shoulder and leg were observed. Up to this date, there are many past studies that investigate drivers’ comfort and discomfort while driving by using multiple methods. However, there is lack of research performed on gearing activity [2]. Knowledge of the muscle activation pattern and its development based on certain driving activities may provide more insights for future research. 2. METHODOLOGY
Two female subjects aged below 30 years old were recruited from the university population. Only female subjects were selected for consistency and convenience. Each subject was required to spend 30 to 40 minutes for this experiment, including the maximum voluntary contraction (MVC) measurement, the pre and post driving measurement and driving activity (15 minutes
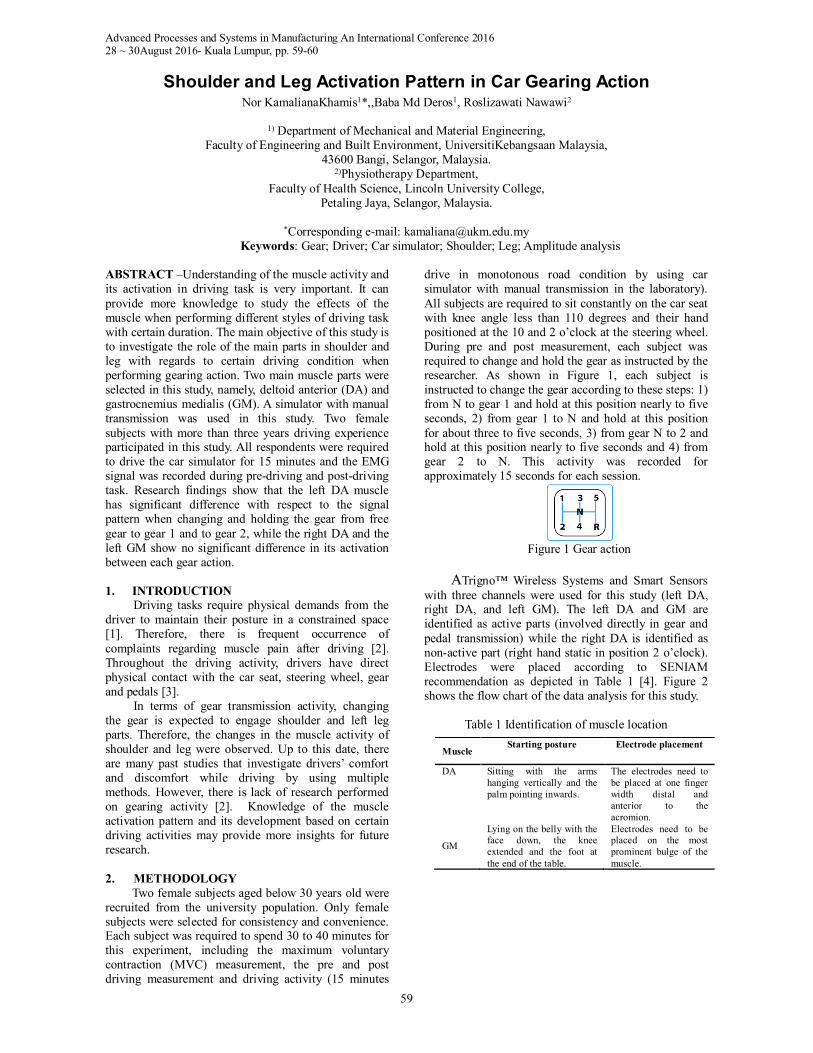
drive in monotonous road condition by using car simulator with manual transmission in the laboratory). All subjects are required to sit constantly on the car seat with knee angle less than 110 degrees and their hand positioned at the 10 and 2 o’clock at the steering wheel. During pre and post measurement, each subject was required to change and hold the gear as instructed by the researcher. As shown in Figure 1, each subject is instructed to change the gear according to these steps: 1) from N to gear 1 and hold at this position nearly to five seconds, 2) from gear 1 to N and hold at this position for about three to five seconds, 3) from gear N to 2 and hold at this position nearly to five seconds and 4) from gear 2 to N. This activity was recorded for approximately 15 seconds for each session.
Figure 1 Gear action
ATrigno™ Wireless Systems and Smart Sensors
with three channels were used for this study (left DA, right DA, and left GM). The left DA and GM are identified as active parts (involved directly in gear and pedal transmission) while the right DA is identified as non-active part (right hand static in position 2 o’clock). Electrodes were placed according to SENIAM recommendation as depicted in Table 1 [4]. Figure 2 shows the flow chart of the data analysis for this study.
Table 1 Identification of muscle location
Muscle Starting posture Electrode placement
DA Sitting with the arms hanging vertically and the palm pointing inwards.
The electrodes need to be placed at one finger width distal and anterior to the acromion.
GM
Lying on the belly with the face down, the knee extended and the foot at the end of the table.
Electrodes need to be placed on the most prominent bulge of the muscle.
60
Figure 2 Flow chart of data analysis
In this study, amplitude analysis was performed at time domain and the amplitude unit is in microvolt (μV). Amplitude analysis was conducted at the stipulated epoch. In this research, it was done at full-wave rectified sEMG signal and the Root Mean Square (RMS) value was used to evaluate the muscle contraction. The RMS equation in discrete time is defined in Equation 1, where N is the number of data and n is the EMG data.
. . = ∑ EMG [ ] (Equation 1)
3. RESULTS AND DISCUSSION
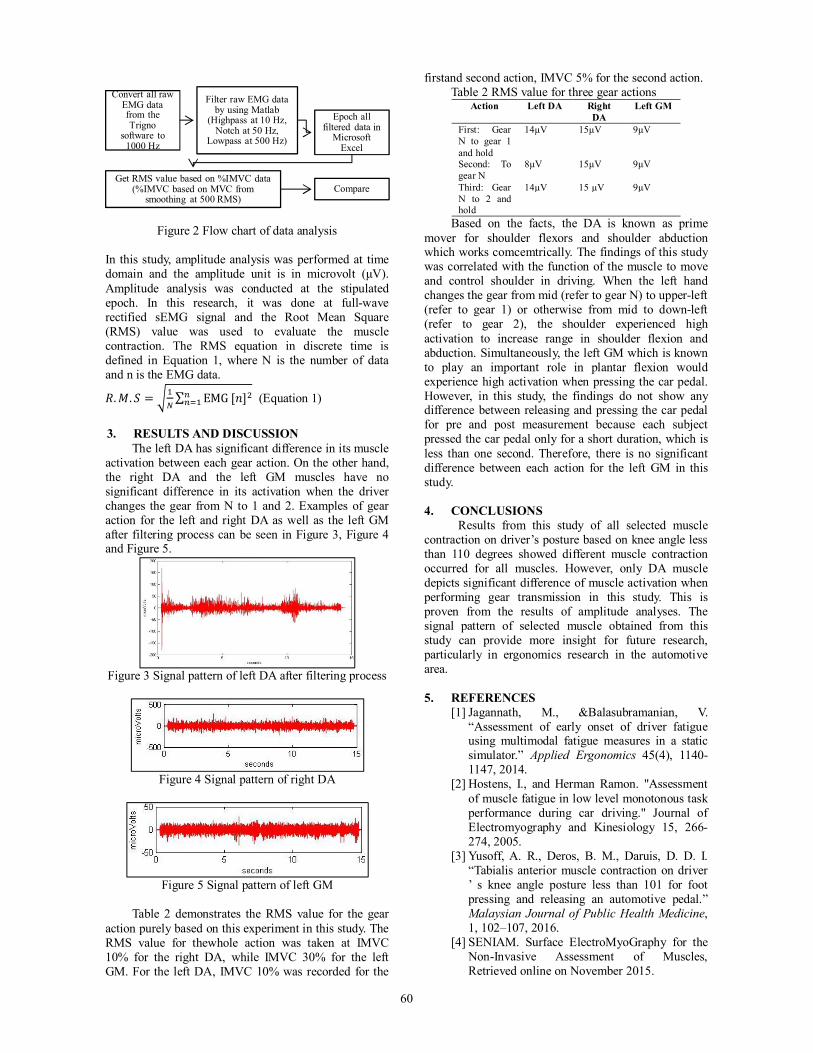
The left DA has significant difference in its muscle activation between each gear action. On the other hand, the right DA and the left GM muscles have no significant difference in its activation when the driver changes the gear from N to 1 and 2. Examples of gear action for the left and right DA as well as the left GM after filtering process can be seen in Figure 3, Figure 4 and Figure 5.
Figure 3 Signal pattern of left DA after filtering process
Figure 4 Signal pattern of right DA
Figure 5 Signal pattern of left GM
Table 2 demonstrates the RMS value for the gear
action purely based on this experiment in this study. The RMS value for thewhole action was taken at IMVC 10% for the right DA, while IMVC 30% for the left GM. For the left DA, IMVC 10% was recorded for the
firstand second action, IMVC 5% for the second action. Table 2 RMS value for three gear actions
Action Left DA Right DA
Left GM
First: Gear N to gear 1 and hold
14μV 15μV 9μV
Second: To gear N
8μV 15μV 9μV
Third: Gear N to 2 and hold
14μV 15 μV 9μV
Based on the facts, the DA is known as prime mover for shoulder flexors and shoulder abduction which works comcemtrically. The findings of this study was correlated with the function of the muscle to move and control shoulder in driving. When the left hand changes the gear from mid (refer to gear N) to upper-left (refer to gear 1) or otherwise from mid to down-left (refer to gear 2), the shoulder experienced high activation to increase range in shoulder flexion and abduction. Simultaneously, the left GM which is known to play an important role in plantar flexion would experience high activation when pressing the car pedal. However, in this study, the findings do not show any difference between releasing and pressing the car pedal for pre and post measurement because each subject pressed the car pedal only for a short duration, which is less than one second. Therefore, there is no significant difference between each action for the left GM in this study. 4. CONCLUSIONS
Results from this study of all selected muscle contraction on driver’s posture based on knee angle less than 110 degrees showed different muscle contraction occurred for all muscles. However, only DA muscle depicts significant difference of muscle activation when performing gear transmission in this study. This is proven from the results of amplitude analyses. The signal pattern of selected muscle obtained from this study can provide more insight for future research, particularly in ergonomics research in the automotive area.
5. REFERENCES [1] Jagannath, M., &Balasubramanian, V.
“Assessment of early onset of driver fatigue using multimodal fatigue measures in a static simulator.” Applied Ergonomics 45(4), 1140-1147, 2014.
[2] Hostens, I., and Herman Ramon. "Assessment of muscle fatigue in low level monotonous task performance during car driving." Journal of Electromyography and Kinesiology 15, 266-274, 2005.
[3] Yusoff, A. R., Deros, B. M., Daruis, D. D. I. “Tabialis anterior muscle contraction on driver ’ s knee angle posture less than 101 for foot pressing and releasing an automotive pedal.” Malaysian Journal of Public Health Medicine, 1, 102–107, 2016.
[4] SENIAM. Surface ElectroMyoGraphy for the Non-Invasive Assessment of Muscles, Retrieved online on November 2015.
Convert all raw EMG data from the Trigno
software to 1000 Hz
Filter raw EMG data by using Matlab
(Highpass at 10 Hz, Notch at 50 Hz,
Lowpass at 500 Hz)
Epoch all filtered data in
Microsoft Excel
Get RMS value based on %IMVC data (%IMVC based on MVC from
smoothing at 500 RMS)Compare
Advanced Processes and Systems in Manufacturing An International Conference 2016 28 ~ 30 August 2016- Kuala Lumpur, pp. 61-62
61
System Dynamics Approach in Supply Chain Management: a Review
Mohammad Azri Abdullah, Hawa Hishamuddin
Department of Mechanical and Material Engineering,
Faculty of Engineering and Built Environment, Universiti Kebangsaan Malaysia, 43600 Bangi, Selangor, Malaysia.
*Corresponding e-mail: [email protected]
Keywords: Supply chain, System dynamics
ABSTRACT – System Dynamics application in supply chain management has attracted the interest of current researchers due to its ability. Current research on system dynamics methodology in supply chain management focused on inventory decision, demand application, supply re-engineering, and supply chain design. This paper presents an overview of current research in this area, followed by taxonomy classification in system dynamics for supply chain management. Furthermore, the importance of including disruption in supply chain management by taking advantage of system dynamics specialty is also presented. 1. INTRODUCTION
Supply Chain Management (SCM) consists of multiple firms collaborating to influence strategic positioning and to improve operational efficiency. For each firm involved, the supply chain relationship reflects a strategic choice. A supply chain strategy is a channel and business organizational arrangement based on acknowledging dependency and collaboration. Supply chain operation requires managerial processes that span traditional functional areas within individual firms and link suppliers, trading partners and customers across business boundaries[1].
System dynamics (SD) methodology is used to solve many complex systems by using computer-aided simulation approach. The system is a problem-solving mechanism with focus on the design and policy analysis. SD methodology is used to understand the dynamics behavior of complex physical, biological and social system, by the aid of perspective based feedback and delay information[2].
SD has been widely used to solve various supply chain management (SCM) issues, including economic SC behavior[3], public management SC[4] and software engineering SC[5]. The original model is the model that was developed by Forrester in 1961, known as ‘Forrester Model’. This model is well known and includes 6 items of interacting flows in the system (information flow, materials, orders, money, and capital equipment). In addition, it is also known as a production-distribution system which explains, analyzes, and describes any issues surrounding the supply chain environment.
This paper conducts a review on the studies that are related to SCM recent works using SD as an approach. The paper is organized as follows. In section 2, the methodology is presented. The findings is presented in section 3. Finally, section 4 summarizes the paper and provide suggestions for future research.
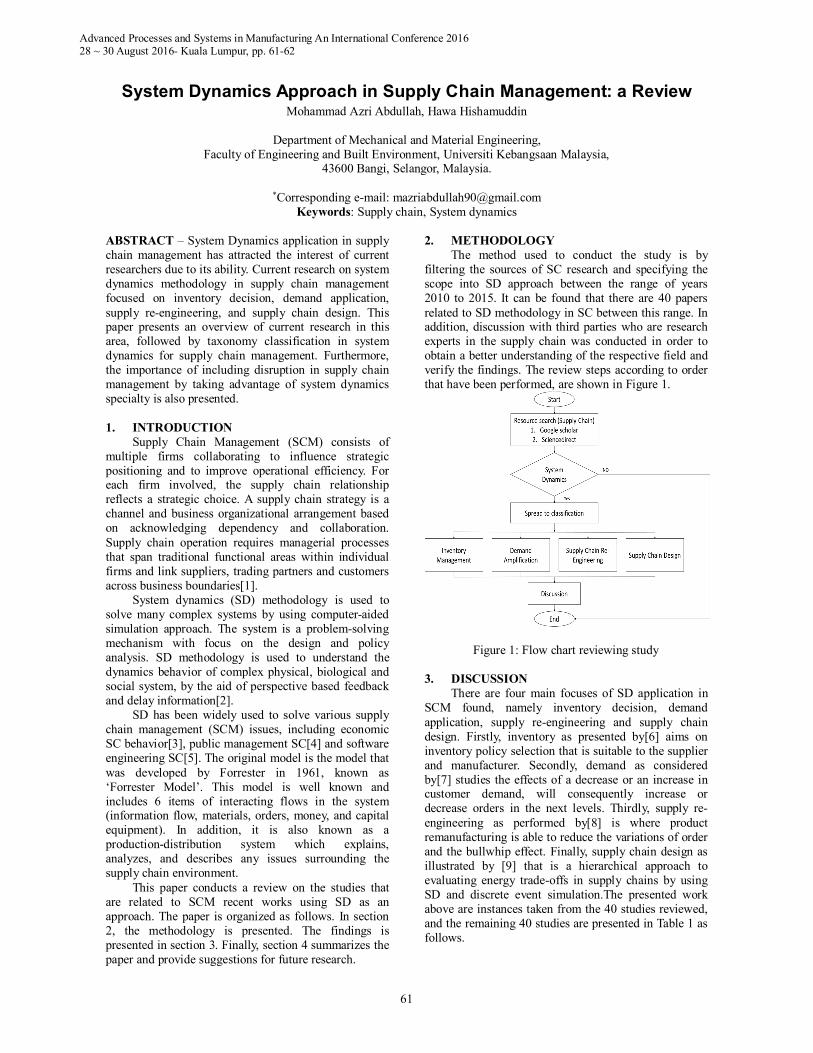
2. METHODOLOGY The method used to conduct the study is by
filtering the sources of SC research and specifying the scope into SD approach between the range of years 2010 to 2015. It can be found that there are 40 papers related to SD methodology in SC between this range. In addition, discussion with third parties who are research experts in the supply chain was conducted in order to obtain a better understanding of the respective field and verify the findings. The review steps according to order that have been performed, are shown in Figure 1.
Figure 1: Flow chart reviewing study 3. DISCUSSION
There are four main focuses of SD application in SCM found, namely inventory decision, demand application, supply re-engineering and supply chain design. Firstly, inventory as presented by[6] aims on inventory policy selection that is suitable to the supplier and manufacturer. Secondly, demand as considered by[7] studies the effects of a decrease or an increase in customer demand, will consequently increase or decrease orders in the next levels. Thirdly, supply re-engineering as performed by[8] is where product remanufacturing is able to reduce the variations of order and the bullwhip effect. Finally, supply chain design as illustrated by [9] that is a hierarchical approach to evaluating energy trade-offs in supply chains by using SD and discrete event simulation.The presented work above are instances taken from the 40 studies reviewed, and the remaining 40 studies are presented in Table 1 as follows.
62
Table 1: Taxonomy of System Dynamics in SCM. Research Area Ref. Number
Inventory Management [5] [10] [11] [12] [13] [6] [14] [15] [16] [17] [18] [19] [20] [21] [22] [23] [24]
Demand Amplification [3] [25] [7] [26] [27] [28] [29]
Supply Chain Re-Engineering
[8] [30] [29] [32] [33] [34] [35] [36]
Supply Chain Design [4] [9] [37] [38] [39] [40] [41]
Numerous study on SCM tabulated in Table 1
concluded that the SD simulation result leads to the new shape either structural or parametrical adaptation. For instance, ordering, inventory, operation and logistics policies as well as forecasting schedule. Fluctuations in the analysis done are more robust, which shows, demand, inventory, and information.
There is also a clear picture of variations regarding the typical objectives presented in every study or to define some functions or determine some purposes. For inventory, it is found that the most frequent objective used is cost reduction, or maximization of retailer’s revenue, while for demand amplification is on lead-time, inventory, production, productivity, and workforce. Each class of the SCM area presented different objectives, however studies in the same class mainly considered the same objective in their study.
Since 2010 to 2015, many disruption events have occurred with greater intensity and frequency. This has caused a subsequent greater negative impact on the SCM[23], therefore, forcing managers and practitioners of a supply chain to act in advance to the issue. A disruption is defined as an event that causes disability in ordinary SC. Consequently, as the behavior of a SC becomes more complex, it has to prepare itself for the negative impact to SC performance.
The presented studies typically investigated supply chain in terms of inventory and ordering policies. These are the two factors found in the model that carried main functions and deliver significant impacts on the whole SC. From the studies of SD in SCM, we found that in the scope of inventory, there exists only a small amount of work that considers disruption as shown in Table 2.
Table 2: Inventory Management with Disruption
Consideration. Reference No. Disruption
[11] [17] [21] [23] [5] [10] [11] [12] [13] [6] [14] [15] [16] [17] [18] [19] [20] [21] [22] [23] [24]
4. CONCLUSIONS
System dynamics is a reliable and useful method to deal with supply chain issues. SD is widely used across the global supply chain to cope with the various problems that exist in SCM. The complex behavior and abnormality in the supply chain as a whole due to disruption are often failed to be captured by
mathematical or analytical models due to the method’s constraints. Therefore, SD methodology is an appropriate tool to analyze the behavior and dynamics of SCM. However from the review conducted,the study of SD within SC disruption context is still scarce. For the purpose of further studies, it is worth to include disruption in SCM using SD approach and investigate multiple objectives. 5. REFERENCES [1] S. Seuring, “Cost Management in Supply
Chains – Different Research Approaches,” Cost Manag. supply Chain., p. 11, 2002.
[2] C. Lertpattarapong, “Applying System Dynamics Approach to the Supply Chain Management Problem,” Syst. Des. Manag. Progr., no. 1989, p. 104 leaves, 2002.
[3] M. Udenio, J. C. Fransoo, and R. Peels, “Destocking, the bullwhip effect, and the credit crisis: Empirical modeling of supply chain dynamics,” Int. J. Prod. Econ., vol. 160, pp. 34–46, 2015.
[4] M. G. Cedillo-Campos, G. Pérez-Salas, A. Bueno-Solano, R. G. González-Ramírez, and E. Jímenez-Sánchez, “Supply Chain Disruptions Propagation Caused by Criminal Acts,” J. Appl. Res. Technol., vol. 12, no. 4, pp. 684–694, Aug. 2014.
[5] S. R. Golroudbary and S. M. Zahraee, “System dynamics model for optimizing the recycling and collection of waste material in a closed-loop supply chain,” Simul. Model. Pract. Theory, vol. 53, pp. 88–102, 2015.
[6] B. Janamanchi, “Inventory policies for supply chains: A system dynamics model based study,” Conf. Proc. - IEEE Int. Conf. Syst. Man Cybern., no. October, pp. 4353–4359, 2010.
[7] R. R. P. Langroodi and M. Amiri, “A system dynamics modeling approach for a multi-level, multi-product, multi-region supply chain under demand uncertainty,” Expert Syst. Appl., vol. 51, pp. 231–244, 2016.
[8] D. Das and P. Dutta, “A system dynamics framework for integrated reverse supply chain with three way recovery and product exchange policy,” Comput. Ind. Eng., vol. 66, no. 4, pp. 720–733, 2013.
[9] S. Jain, E. Lindskog, J. Andersson, and B. Johansson, “A hierarchical approach for evaluating energy trade-offs in supply chains,” Int. J. Prod. Econ., vol. 146, no. 2, pp. 411–422, 2013.
[10] E. Briano, C. Caballini, P. Giribone, and R. Revetria, “Using a System Dynamics Approach for Designing and Simulation of Short Life-Cycle Products Supply Chain,” Ital. Cent. Excell. Integr. Logist., pp. 237–284, 2010.
[11] J. Li, J. Zhai, Y. Chen, and S. Liu, “System dynamic simulation approach for supply chain with capability limit,” J. Comput., vol. 5, no. 7, pp. 1125–1132, 2010.
[12] P. Vashirawongpinyo, “A System Dynamics Model to Analyze Behavior of Manufacturing in Supply Chain,” pp. 11–16, 2010.
Advanced Processes and Systems in Manufacturing An International Conference 2016 28 ~ 30 August 2016- Kuala Lumpur, pp. 63-64
63
System Identification of Brushed DC motor by Model-Based Design Mohd Aizat Ahmad Tarmizi*, Rizauddin Ramli, Sallehuddin Mohamed Haris
Department of Mechanical and Material Engineering,
Faculty of Engineering and Built Environment, Universiti Kebangsaan Malaysia, 43600 Bangi, Selangor, Malaysia.
*Corresponding e-mail: [email protected]
Keywords: DC Motor; Arduino; Simulink; System Identification. ABSTRACT – Direct Current (DC) motor has been widely employed in many application including as actuator for robotics structure. Today, model-based design method is regarded as a modern approach to design and control the DC motor systems. In this paper, we present a model-based design method which consists of first principle modeling and data-driven approach. Both approaches are parallelly implemented for validation and control design with a consideration of nonlinear behavior of the system such as dry friction and backlash. The system is excited by Arduino microcontroller and communicated serially via Matlab. The logged data obtained is employed into System Identification toolbox for model estimation before designing the closed-loop controller. The comparison between the reference signal, simulated response and actual hardware data validated the model of system. 1. INTRODUCTION
Electrical motor has been considered as the prime actuator in a wide area of applications in our daily life. The primary classification of electrical motor can be divided into two types, i.e, the DC motors and alternating current (AC) motors. The DC motor is categorized into two types which is brushed DC motor (BDC) and brushless DC motor (BLDC) [1]. Each of these types has its own different varieties, such as permanent magnet (PM) brushed DC motor, servo DC motor, synchronous AC motor, etc. Generally, the basic operation of DC motor consists of position and speed control mechanism depends on the purpose of the application. Most of the control mechanism of DC motor revolved around speed and torque operation [2].
In this paper, we present an experiment of position control by employing conventional brushed DC motor. The purpose of the experiment is to obtain the plant transfer function model of the DC motor. This transfer function model will be used as a sub-system of one joint for an automated 4 degree-of-freedom (DOF) reciprocating gait orthosis (RGO) [3]. The selection of the DC motor is due to its precision, comprehensiveness, straight forwardness and continuous control characteristics [4].
In order to achieve the control design for the DC motor, a model-based design is applied to find the plant transfer function. There are two approaches in dynamic systems modeling; the first approach is first-principle modeling which utilize a mathematical classic theory based on assumptions in the physical working mechanism [5]; and the second approach is data-driven (black box modeling) involves a real hardware
experiment and data processings [6][7]. The latter approach accentuate mathematical modeling with design, simulation, analyse and validation method to represents the coupling of the environment, i.e. embedded processes and hardware implementation [8]. The implementation of model-based design can be briefly explained by the following steps: modeling, simulation, generate executable application and finally real-time test on hardware [9].
In this study, the first-principle modeling (simulation model) and the data-driven (actual hardware experiment model) approaches are parallelly implemented. In the data-driven scheme, the open loop input and output data from experiment will be employed into a System Identification toolbox to generate a mathematical model of the system before designing the conventional proportional-integral-derivative (PID) controller [10]. The model obtained from actual hardware experiment is then being analysed and compared with the simulated model from the first-principle approach.
The hardware and software involved in this research are Arduino UNO microcontroller, DC motor, motor driver as the H-bridge component, quadrature position encoder, Matlab, Simulink, System Identification [11], Simscape, SimMechanic toolbox and Solidwork. This research is focused on the modeling of the DC motor, i.e. the transfer function of the plant via data-driven approach before implementing the controller design. 2. METHODOLOGY
The mathematical equation of the transfer function of DC motor, P(s) is shown in Eq. (1).The input signal is voltage, V(s) of the power source and the output signal is the angular position of the rotation of the shaft of the DC motor denoted as ɵ(s) which obtained by integration of angular speed. Both signals are expressed in terms of Laplace variable s. This equation will be used in System Identification toolbox to obtain the plant model.
( ) = ( )( ) = [( + )( + ) + ]
Eq. (1)
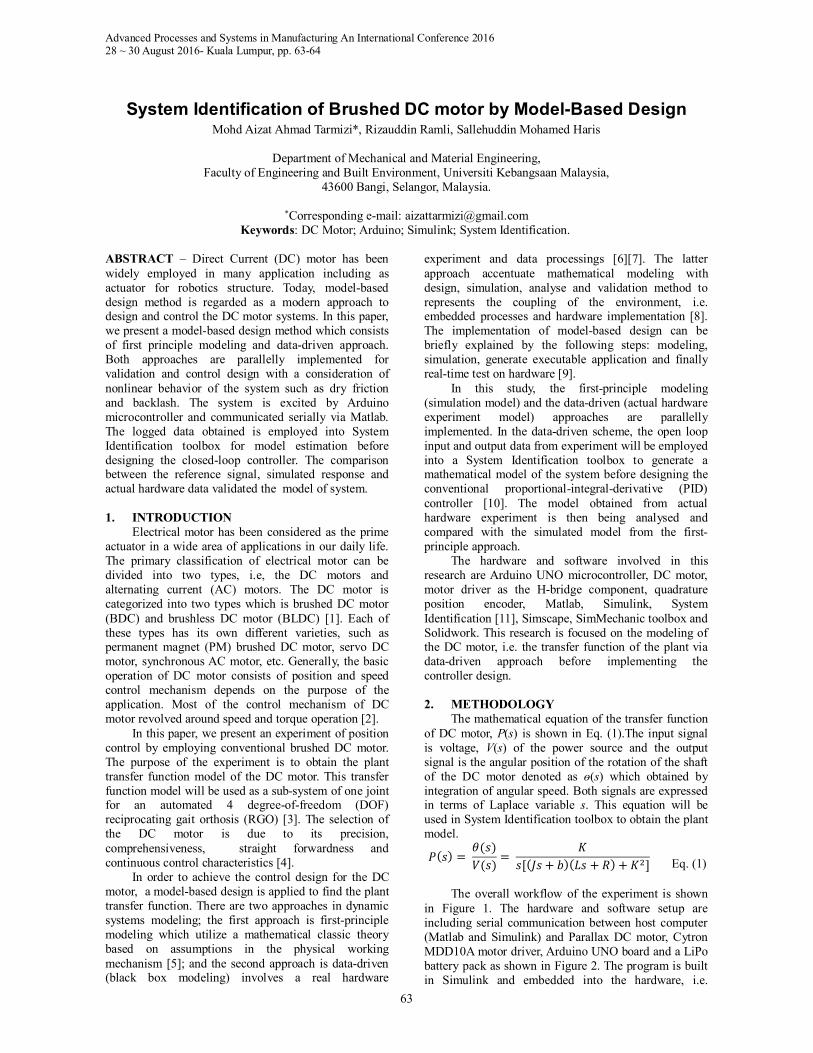
The overall workflow of the experiment is shown in Figure 1. The hardware and software setup are including serial communication between host computer (Matlab and Simulink) and Parallax DC motor, Cytron MDD10A motor driver, Arduino UNO board and a LiPo battery pack as shown in Figure 2. The program is built in Simulink and embedded into the hardware, i.e.
64
Arduino microcontroller board before running the experiment using signal input generated in Simulink.
Figure 1 Overall workflow
Figure 2 Hardware and software setup
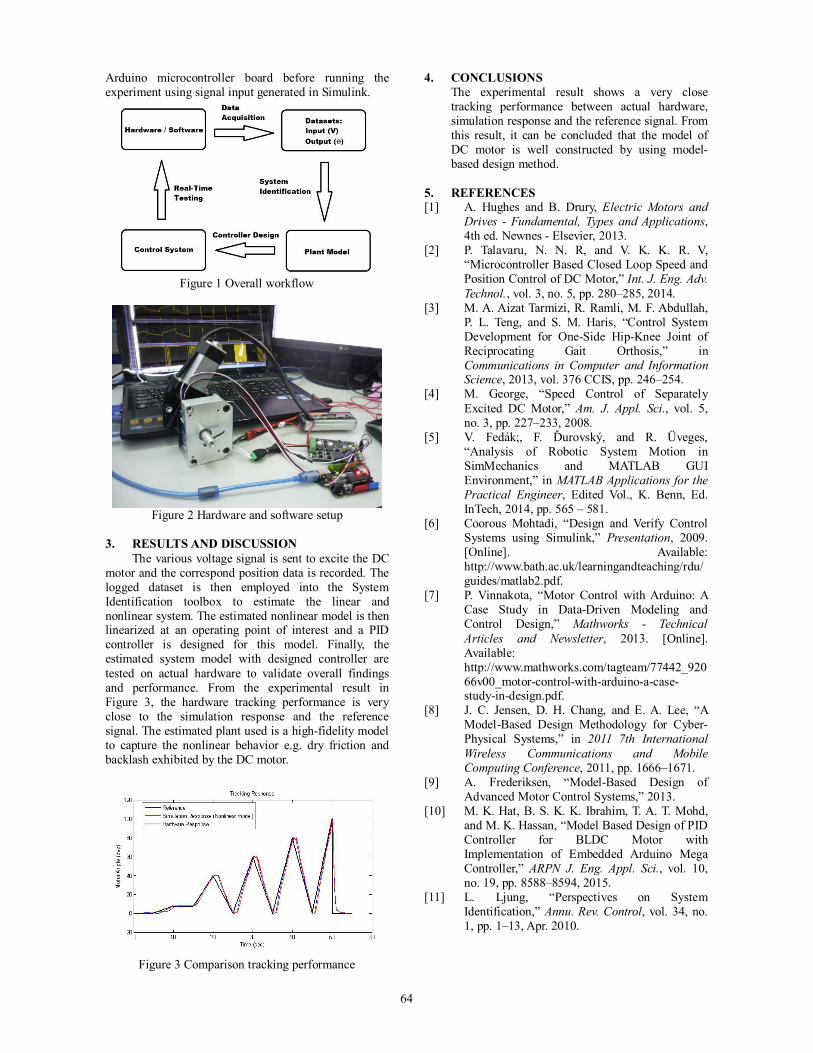
3. RESULTS AND DISCUSSION
The various voltage signal is sent to excite the DC motor and the correspond position data is recorded. The logged dataset is then employed into the System Identification toolbox to estimate the linear and nonlinear system. The estimated nonlinear model is then linearized at an operating point of interest and a PID controller is designed for this model. Finally, the estimated system model with designed controller are tested on actual hardware to validate overall findings and performance. From the experimental result in Figure 3, the hardware tracking performance is very close to the simulation response and the reference signal. The estimated plant used is a high-fidelity model to capture the nonlinear behavior e.g. dry friction and backlash exhibited by the DC motor.
Figure 3 Comparison tracking performance
4. CONCLUSIONS The experimental result shows a very close tracking performance between actual hardware, simulation response and the reference signal. From this result, it can be concluded that the model of DC motor is well constructed by using model-based design method.
5. REFERENCES [1] A. Hughes and B. Drury, Electric Motors and
Drives - Fundamental, Types and Applications, 4th ed. Newnes - Elsevier, 2013.
[2] P. Talavaru, N. N. R, and V. K. K. R. V, “Microcontroller Based Closed Loop Speed and Position Control of DC Motor,” Int. J. Eng. Adv. Technol., vol. 3, no. 5, pp. 280–285, 2014.
[3] M. A. Aizat Tarmizi, R. Ramli, M. F. Abdullah, P. L. Teng, and S. M. Haris, “Control System Development for One-Side Hip-Knee Joint of Reciprocating Gait Orthosis,” in Communications in Computer and Information Science, 2013, vol. 376 CCIS, pp. 246–254.
[4] M. George, “Speed Control of Separately Excited DC Motor,” Am. J. Appl. Sci., vol. 5, no. 3, pp. 227–233, 2008.
[5] V. Fedák;, F. Ďurovský, and R. Üveges, “Analysis of Robotic System Motion in SimMechanics and MATLAB GUI Environment,” in MATLAB Applications for the Practical Engineer, Edited Vol., K. Benn, Ed. InTech, 2014, pp. 565 – 581.
[6] Coorous Mohtadi, “Design and Verify Control Systems using Simulink,” Presentation, 2009. [Online]. Available: http://www.bath.ac.uk/learningandteaching/rdu/guides/matlab2.pdf.
[7] P. Vinnakota, “Motor Control with Arduino: A Case Study in Data-Driven Modeling and Control Design,” Mathworks - Technical Articles and Newsletter, 2013. [Online]. Available: http://www.mathworks.com/tagteam/77442_92066v00_motor-control-with-arduino-a-case-study-in-design.pdf.
[8] J. C. Jensen, D. H. Chang, and E. A. Lee, “A Model-Based Design Methodology for Cyber-Physical Systems,” in 2011 7th International Wireless Communications and Mobile Computing Conference, 2011, pp. 1666–1671.
[9] A. Frederiksen, “Model-Based Design of Advanced Motor Control Systems,” 2013.
[10] M. K. Hat, B. S. K. K. Ibrahim, T. A. T. Mohd, and M. K. Hassan, “Model Based Design of PID Controller for BLDC Motor with Implementation of Embedded Arduino Mega Controller,” ARPN J. Eng. Appl. Sci., vol. 10, no. 19, pp. 8588–8594, 2015.
[11] L. Ljung, “Perspectives on System Identification,” Annu. Rev. Control, vol. 34, no. 1, pp. 1–13, Apr. 2010.
Advanced Processes and Systems in Manufacturing An International Conference 2016 28 ~ 30 August 2016- Kuala Lumpur, pp. 65-66
65
Preliminary Survey of Ergonomics Effects Associated with Back Pain towards Return to Work Patients at PERKESO Rehabilitation Center
Ruzy Haryati Hambalia,1, Siti Khadijah Khalilb, Intan Fatihah Ahmadc, Seri Rahayu Kamatd,Syamimi Shamsuddine and Muhammad Salihin Md Pauzif,2
1Faculty of Manufacturing Engineering, Universiti Teknikal Malaysia Melaka, Hang Tuah Jaya,
76100 Durian Tunggal, Melaka, Malaysia. 2Pusat Rehabilitasi PERKESO, Lot PT7263, Hang Tuah Jaya, Bandar Hijau, 75450, Melaka, Malaysia.
a,Corresponding e-mail:[email protected]
Keywords: Back pain; Industrial workers; Working task. ABSTRACT Nowadays, many industrial workers suffer from back pain problems associated with their daily working tasks. This issue may lead to other health problems and prevent them from coming to work. Therefore, the aim of this study is to identify the working task which associated most to the back pain problem. Surveys were distributed to eight participants of back pain return to work patients at PERKESO Rehabilitation Centre (PRC). Results show manual handling and prolonged standing are the highest contributing factors leading to back pain problems in patients. It can be concluded that the workers who are required to perform prolonged standing and manual handling in a long duration have high potential to develop back pain problems. 1. INTRODUCTION
The highest common contributor in the filing of workers’ compensation is related to the issues of back pain. Back pain contribute for an estimated of one fourth of all claims and one third of total compensation cost [1]. Back pain is considered one of the most prevalent musculoskeletal complaints wherein remains as the highest complaints and main concern in the occupational diseases record in Europe. It is in the list of items of the occupational health and safety field, stated by the European Agency for the years between 2013 and 2020 [2].
Back pain is also common among the workers in which it is ranked as second to cold for the most frequent reason of sick leave which gives out about 40% of nonattendance to work [1]. According to the data from the National of Health Interview Survey conducted in America, within one year 22.4 million cases of back pain that last for a week or more (prevalence: 17.6%) is reported and resulted into a total of 149 million of absence from work [1].
Back pain often become the risk of physically demanding work in situations where the workers performing their work in awkward postures, repetitive work, lifting heavy loads, standing up for long periods of time and exposed to vibrations [2,6,7]. Blue collar worker are exposed to this risk since their job require more physical demand job and eventually leads to work disability and musculoskeletal pain [2]. Furthermore, back pain is listed as one of the four major musculoskeletal conditions that leads to disability besides osteoporosis, rheumatoid arthritis and osteoarthritis [3].
In Malaysia, the statistics provided by the
Department of Occupational Safety and Health Malaysia (DOSH), manufacturing sector contributed to the highest occupational accidents in the non-permanent disability category. Until February 2016, 60% of the occupational accidents investigated originate from the manufacturing sector [4]. In addition, statistic provided by Social Security Organization (PERKESO) shows that 675 cases of musculoskeletal diseases reported to the center in year 2015 which shows a significant increase compared to year 2005 where only 10 cases of musculoskeletal disease were reported [5].
This preliminary survey is conducted to study the ergonomic effects towards the patients that suffered from back pain whom are admitted in the PRC. These patients are currently in return to work (RTW) program in which they are in the last phase of rehabilitation before completely fit to go back to their job. 2. METHODOLOGY
There are five categories in the questionnaires which includes category A (personal information), category B (knowledge on ergonomic), category C (level of pain at all body part), category D (level of pain at insole) and category E (problems related to job activity). The questionnaire was asked by the researcher to each of the RTW patients. Figure 1 shows the flowchart of constructing and analyzing the questionnaire.
Figure 1: Methodology Flow Chart
3. RESULTS AND DISCUSSION In this preliminary survey successfully interviewed
eight case studies. These respondents are suffered and addressing back pain problems.
The respondents consist of two technicians, two
66
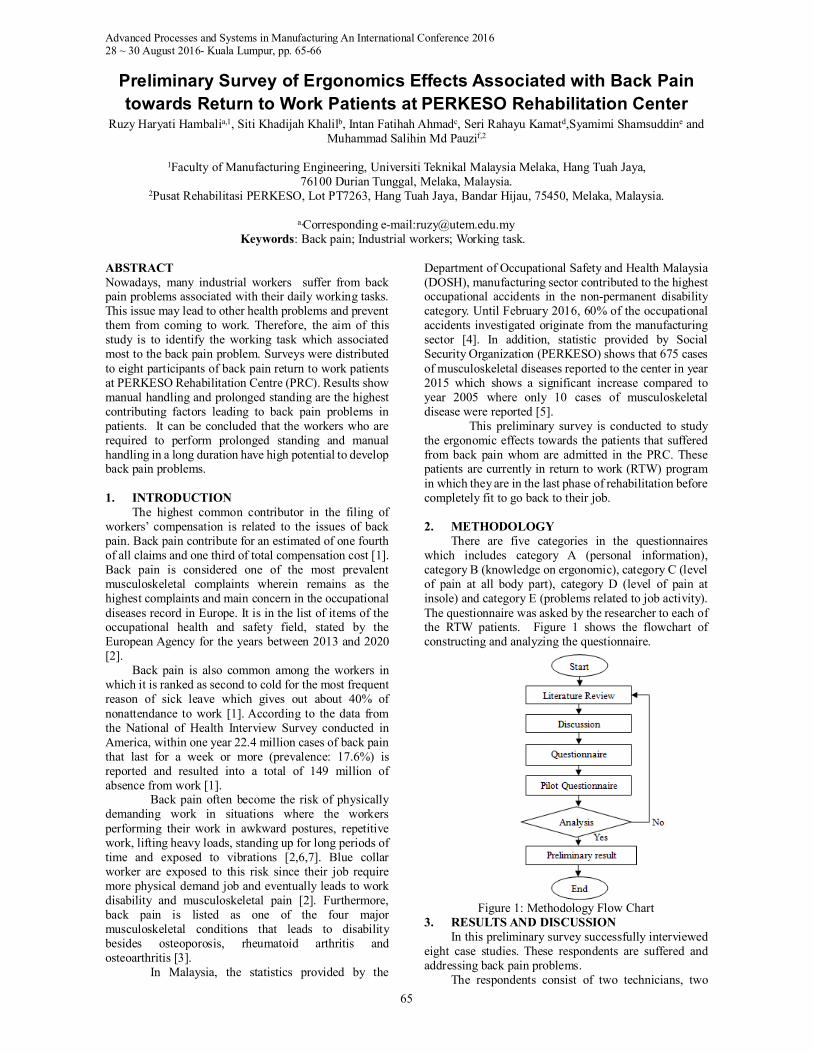
operators, one leader, one supervisor, one mechanic and one technical assistant working in multiple types of manufacturing industries in Malaysia. The age group of the respondents are four persons in between 30-39 years old, two persons in between 40-49 years old and another two persons in the range of 50 years old and above. The respondents have been employed in the similar position in a very long time in which the minimum experience is eight years and the maximum experience is 18 years. Figure 2 shows the respondents’ work activities versus number of respondents. According to the survey, it has been discovered that the respondents have reported with the health issues due to the physically demanding of their routine works such as manual lifting, prolonged standing, push, pull, prolonged sitting and others as shown in Figure 2. It is observed that manual lifting and prolonged standing have the highest work activities performed by the respondents. All of the eights respondents declared that their main work task is involving manual lifting and prolonged standing. Many studies that were done previously agree that prolonged standing and manual lifting will develop into lower back pain problem [6,7,8]. Work activities that included in others category are walking, moving and bending at narrow area.
Figure 2: Graph of Work Activities Versus Number of
Respondent
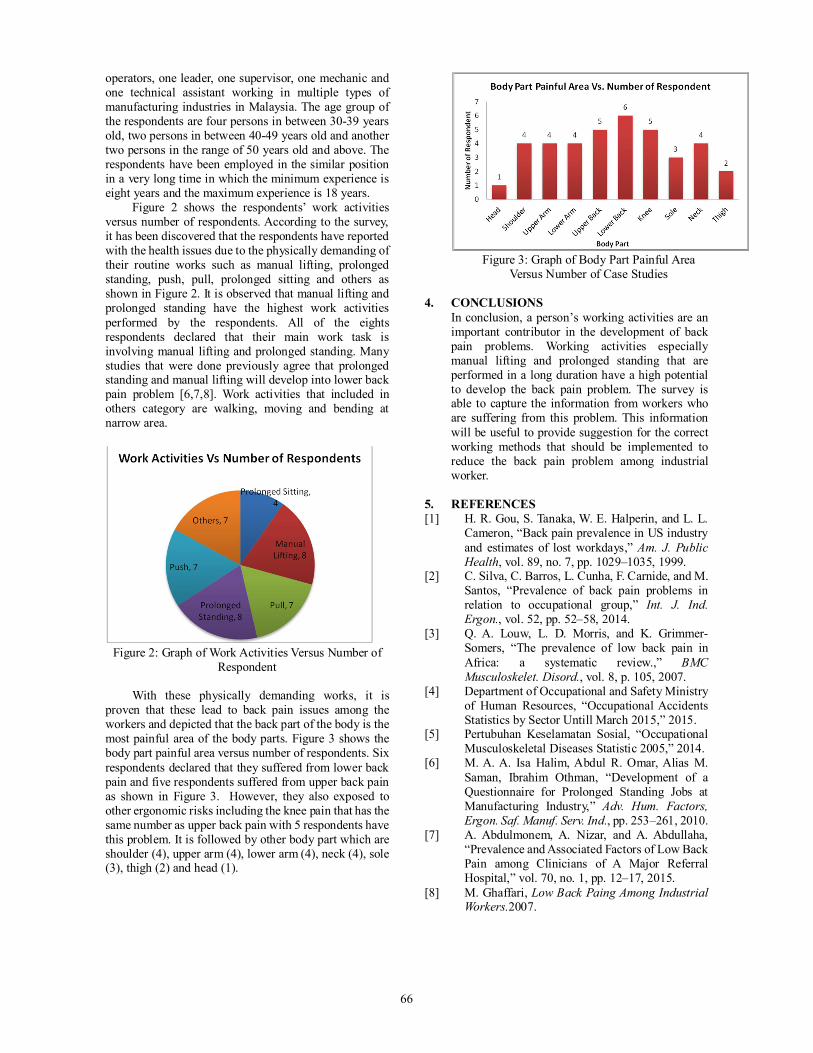
With these physically demanding works, it is proven that these lead to back pain issues among the workers and depicted that the back part of the body is the most painful area of the body parts. Figure 3 shows the body part painful area versus number of respondents. Six respondents declared that they suffered from lower back pain and five respondents suffered from upper back pain as shown in Figure 3. However, they also exposed to other ergonomic risks including the knee pain that has the same number as upper back pain with 5 respondents have this problem. It is followed by other body part which are shoulder (4), upper arm (4), lower arm (4), neck (4), sole (3), thigh (2) and head (1).
Figure 3: Graph of Body Part Painful Area
Versus Number of Case Studies
4. CONCLUSIONS In conclusion, a person’s working activities are an important contributor in the development of back pain problems. Working activities especially manual lifting and prolonged standing that are performed in a long duration have a high potential to develop the back pain problem. The survey is able to capture the information from workers who are suffering from this problem. This information will be useful to provide suggestion for the correct working methods that should be implemented to reduce the back pain problem among industrial worker.
5. REFERENCES [1] H. R. Gou, S. Tanaka, W. E. Halperin, and L. L.
Cameron, “Back pain prevalence in US industry and estimates of lost workdays,” Am. J. Public Health, vol. 89, no. 7, pp. 1029–1035, 1999.
[2] C. Silva, C. Barros, L. Cunha, F. Carnide, and M. Santos, “Prevalence of back pain problems in relation to occupational group,” Int. J. Ind. Ergon., vol. 52, pp. 52–58, 2014.
[3] Q. A. Louw, L. D. Morris, and K. Grimmer-Somers, “The prevalence of low back pain in Africa: a systematic review.,” BMC Musculoskelet. Disord., vol. 8, p. 105, 2007.
[4] Department of Occupational and Safety Ministry of Human Resources, “Occupational Accidents Statistics by Sector Untill March 2015,” 2015.
[5] Pertubuhan Keselamatan Sosial, “Occupational Musculoskeletal Diseases Statistic 2005,” 2014.
[6] M. A. A. Isa Halim, Abdul R. Omar, Alias M. Saman, Ibrahim Othman, “Development of a Questionnaire for Prolonged Standing Jobs at Manufacturing Industry,” Adv. Hum. Factors, Ergon. Saf. Manuf. Serv. Ind., pp. 253–261, 2010.
[7] A. Abdulmonem, A. Nizar, and A. Abdullaha, “Prevalence and Associated Factors of Low Back Pain among Clinicians of A Major Referral Hospital,” vol. 70, no. 1, pp. 12–17, 2015.
[8] M. Ghaffari, Low Back Paing Among Industrial Workers.2007.
Advanced Processes and Systems in Manufacturing An International Conference 2016 28 ~ 30 August 2016- Kuala Lumpur, pp. 67-68
67
Slip and Fall: Activity Risk Posture in Kitchen at Hotel
Seri Rahayu Kamat1 and Sharifah Aznee Syed Ali2
1,2Faculty of Manufacturing Engineering, Universiti Teknikal Malaysia Melaka, Hang Tuah Jaya, 76100 Durian Tunggal,
Melaka, Malaysia.
*Corresponding e-mail: [email protected] Keywords: workstation; hazard; slips and falls
ABSTRACT – The workstation is an area which equipped with the suitable tool and material for the task. The kitchen is one of the riskiest workstation areas to cause slips and falls incident. During the working period, the hazard comes from tools, material, floor, shoes, human and also task that can contribute to slips and falls accident. The aimed of this study to analyze the worst posture, activity at the commercial kitchen that contributes a risk to slips and falls. Forty students, training for their final semester were involved in a kitchen at the Kristal Restaurant of Polytechnic Merlimau, Melaka. The students were grouped by task. The training group has experienced at least 1 year in kitchen workplace. The result showed that there are seven critical activities of commercial kitchen produce a high RULA score 7. Findings from this study can help to reduce the risk activity posture especially at the commercial kitchen regarding on cognitive ergonomics. 1. INTRODUCTION
The workstation is a very hazardous area because employee spent almost 8 hours to 12 hours at their workplace. At the kitchen workstation, position standing is used for the whole working day. Those utensil using in the kitchen such as cookware set, wok set, and pan set and also lunch or dinner plate is provided with a different weight. The workplace environment condition such as footwear, flooring, machine, lighting, contaminants like water and oil are closely related to slip and fall accident to the employee.
The workplace environment in the kitchen similarly contributes to slips and falls accident. The more active and longer pathways will produce the most slip and fall problems [1],[2] and [3]. The surface roughness of the floor are measured and identifies to prove that if the surface roughness less than 10µm means that floor has a high potential for slips and falls to occur[4].
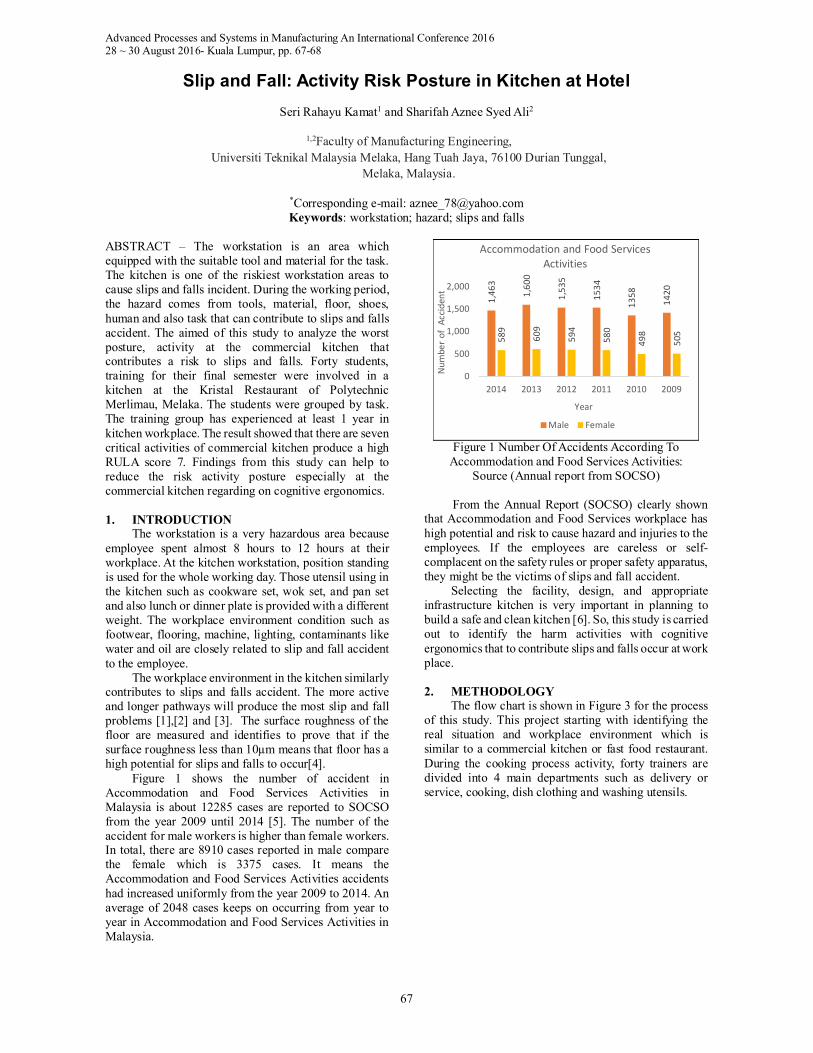
Figure 1 shows the number of accident in Accommodation and Food Services Activities in Malaysia is about 12285 cases are reported to SOCSO from the year 2009 until 2014 [5]. The number of the accident for male workers is higher than female workers. In total, there are 8910 cases reported in male compare the female which is 3375 cases. It means the Accommodation and Food Services Activities accidents had increased uniformly from the year 2009 to 2014. An average of 2048 cases keeps on occurring from year to year in Accommodation and Food Services Activities in Malaysia.
Figure 1 Number Of Accidents According To Accommodation and Food Services Activities:
Source (Annual report from SOCSO)
From the Annual Report (SOCSO) clearly shown that Accommodation and Food Services workplace has high potential and risk to cause hazard and injuries to the employees. If the employees are careless or self-complacent on the safety rules or proper safety apparatus, they might be the victims of slips and fall accident.
Selecting the facility, design, and appropriate infrastructure kitchen is very important in planning to build a safe and clean kitchen [6]. So, this study is carried out to identify the harm activities with cognitive ergonomics that to contribute slips and falls occur at work place. 2. METHODOLOGY
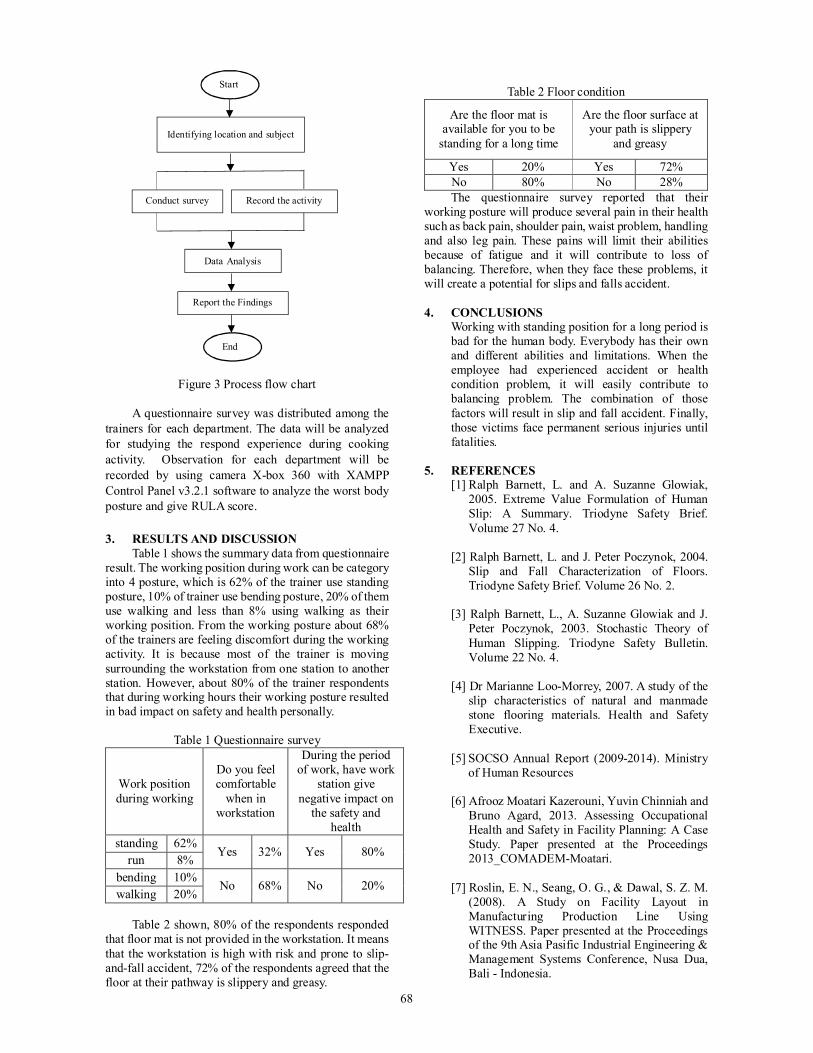
The flow chart is shown in Figure 3 for the process of this study. This project starting with identifying the real situation and workplace environment which is similar to a commercial kitchen or fast food restaurant. During the cooking process activity, forty trainers are divided into 4 main departments such as delivery or service, cooking, dish clothing and washing utensils.
1,46
3
1,60
0
1,53
5
1534
1358
1420
589
609
594
580
498
505
0
500
1,000
1,500
2,000
2014 2013 2012 2011 2010 2009
Num
ber
of A
ccid
ent
Year
Accommodation and Food Services Activities
Male Female
68
Figure 3 Process flow chart
A questionnaire survey was distributed among the trainers for each department. The data will be analyzed for studying the respond experience during cooking activity. Observation for each department will be recorded by using camera X-box 360 with XAMPP Control Panel v3.2.1 software to analyze the worst body posture and give RULA score.
3. RESULTS AND DISCUSSION
Table 1 shows the summary data from questionnaire result. The working position during work can be category into 4 posture, which is 62% of the trainer use standing posture, 10% of trainer use bending posture, 20% of them use walking and less than 8% using walking as their working position. From the working posture about 68% of the trainers are feeling discomfort during the working activity. It is because most of the trainer is moving surrounding the workstation from one station to another station. However, about 80% of the trainer respondents that during working hours their working posture resulted in bad impact on safety and health personally.
Table 1 Questionnaire survey
Work position during working
Do you feel comfortable
when in workstation
During the period of work, have work
station give negative impact on
the safety and health
standing 62% Yes 32% Yes 80% run 8%
bending 10% No 68% No 20% walking 20%
Table 2 shown, 80% of the respondents responded
that floor mat is not provided in the workstation. It means that the workstation is high with risk and prone to slip- and-fall accident, 72% of the respondents agreed that the floor at their pathway is slippery and greasy.
Table 2 Floor condition
Are the floor mat is available for you to be
standing for a long time
Are the floor surface at your path is slippery
and greasy
Yes 20% Yes 72% No 80% No 28% The questionnaire survey reported that their
working posture will produce several pain in their health such as back pain, shoulder pain, waist problem, handling and also leg pain. These pains will limit their abilities because of fatigue and it will contribute to loss of balancing. Therefore, when they face these problems, it will create a potential for slips and falls accident.
4. CONCLUSIONS
Working with standing position for a long period is bad for the human body. Everybody has their own and different abilities and limitations. When the employee had experienced accident or health condition problem, it will easily contribute to balancing problem. The combination of those factors will result in slip and fall accident. Finally, those victims face permanent serious injuries until fatalities.
5. REFERENCES [1] Ralph Barnett, L. and A. Suzanne Glowiak,
2005. Extreme Value Formulation of Human Slip: A Summary. Triodyne Safety Brief. Volume 27 No. 4.
[2] Ralph Barnett, L. and J. Peter Poczynok, 2004.
Slip and Fall Characterization of Floors. Triodyne Safety Brief. Volume 26 No. 2.
[3] Ralph Barnett, L., A. Suzanne Glowiak and J.
Peter Poczynok, 2003. Stochastic Theory of Human Slipping. Triodyne Safety Bulletin. Volume 22 No. 4.
[4] Dr Marianne Loo-Morrey, 2007. A study of the
slip characteristics of natural and manmade stone flooring materials. Health and Safety Executive.
[5] SOCSO Annual Report (2009-2014). Ministry
of Human Resources [6] Afrooz Moatari Kazerouni, Yuvin Chinniah and
Bruno Agard, 2013. Assessing Occupational Health and Safety in Facility Planning: A Case Study. Paper presented at the Proceedings 2013_COMADEM-Moatari.
[7] Roslin, E. N., Seang, O. G., & Dawal, S. Z. M.
(2008). A Study on Facility Layout in Manufacturing Production Line Using WITNESS. Paper presented at the Proceedings of the 9th Asia Pasific Industrial Engineering & Management Systems Conference, Nusa Dua, Bali - Indonesia.
Start
Conduct survey
Identifying location and subject
Record the activity
End
Data Analysis
Report the Findings
Advanced Processes and Systems in Manufacturing An International Conference 2016 28 ~ 30 August 2016- Kuala Lumpur, pp. 69-70
69
A Case Study On Deployment of Technology Combined Lean Implementation Framework in Automotive Sector through a Systematic
Planning Scheme Muhammad Zeeshan Rafique1*, Mohd Nizam Ab Rahman1, Raden Achmad Chairdino Leuveano1, Nizaroyani Saibani1,
Norhana Arsad2
1) Department of Mechanical and Materials Engineering, Faculty of Engineering & Built Environment, Universiti Kebangsaan Malaysia, Malaysia
2) Department of Electrical, Electronic and System Engineering, Faculty of Engineering & Built Environment, Universiti Kebangsaan Malaysia, Malaysia
*Corresponding E-mail: [email protected]
Keywords: Planning Scheme, Lean Manufacturing, Planning Implementation, Operational Research ABSTRACT – In this modern age, technologies like RFID (Radio Frequency Identification) works as a catalyst for lean implementation frameworks but a gap has been observed regarding the deployment of technology combined with a lean implementation framework which certainly requires a proper planning strategy. In order to fill this gap, the aims of this study is to propose a certain “Planning Scheme” that will be helpful to deploy and validate lean implementation framework in combination with technology. As lean has found its application in many fields, so through a short literature study, it has been observed that the sector which is carrying large number of stakes for lean application is automotive sector, and it seems more logical to design a planning scheme for a “case study”, selected from the automotive sector. Hence, in light of all these facts, a case study has been selected from one of the automotive parts manufacturing industry in Malaysia, which is willing to deploy a technology combined lean implementation framework and specialized planning scheme is proposed and implemented. The “planning scheme” carries originality in its structure and contributes by providing stage-wise implementation framework in three steps namely, proper team selection, phase distributions and access to lean tools, which provides the required outcome to implement framework in a systematic way. 1. INTRODUCTION Lean manufacturing is based on the theory of Just in Time (JIT) which provides support to companies to reduce the costs, inventory, down time and lead time. Lean is a continuous process which aims to reduce wastes and improve processes by minimizing queue lengths, lot sizes and setup times [1, 2]. These benefits of lean implementation have inspired different industries such as machine tool, wood, ceramics, electronics, healthcare and especially the automobile industry, to implement lean in their operations [3, 4]. With the advancement in technologies in this modern age, it has been observed that latest technologies like RFID are also being utilized in combination of lean and considered as a catalyst for lean implementation[2]. Hence in order to deploy lean with new ideologies, many different lean implementation approaches have
been considered in manufacturing divisions by previous researchers [5, 6]. 2. METHODOLOGY The authors of this research have studied the previous methodoliges utilized and agreed on mutual consensus that a “Case study” based research methodology will be utilized for this study. Since the case study methodology carries two types i.e., longitudinal/single case study (which involves deep study of operations) and multiple case study (which involves study of different companies and thier operations in general). Hence, based on the requirement to study operations in deep, the authors have planed to utilize longitudinal case study type and selected a company named as “ABC automotive parts”(the original name and details can’t be provided due to confidentiality issues) as a case study. ABC Automotive is basically a automotive parts manufacturing company in Malaysia and producing automotive parts for leading automobile companies of Malaysia. The case company is basically owned by one multinational group which also have plant in China. 3. RESULTS AND DISCUSSION Vinodh, et al. [7] in their research work clearly mentioned that “Project Charter” is one of the leading requirements for any lean implementation framework deployment. Hence keeping this requirement in view, the detailed “Planning Scheme” that have been designed and utilized by the selected case study based on their data collection, observations, and current credentials of implementation framework and to fulfil the requirement of company as mentioned in Table 1. It clearly indicates that the leading requirement for any framework deployment is the selection of proper lean team. So the designing of lean team for this case study is divided into four tiers which are planning Expert for planning forecast, engineering members for engineering implementations, ERP support for technology study and HR. After designing of lean team, The next section is scheduling of the whole project and distribution of time. The implementation framework is divided into 4 phases which are conceptual phase, preparation phase, implementation phase and completion phase.
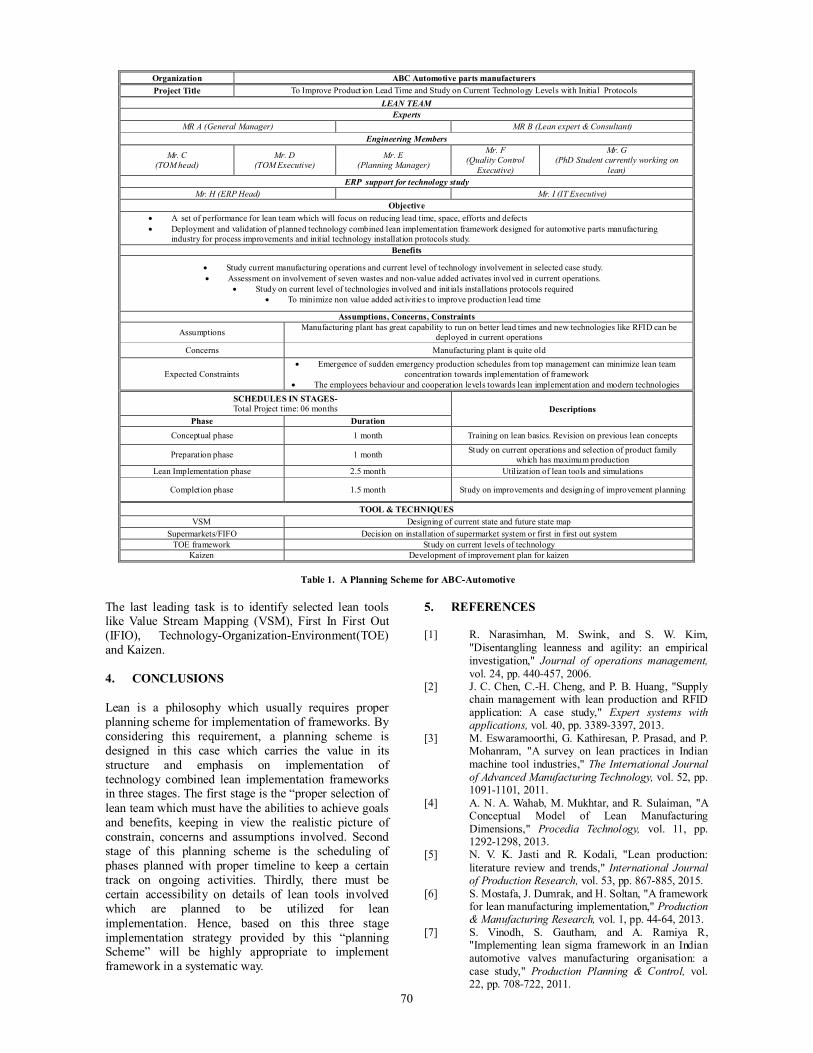
70
Organization ABC Automotive parts manufacturers Project Title To Improve Product ion Lead Time and Study on Current Technology Levels with Initial Protocols
LEAN TEAM Experts
MR A (General Manager) MR B (Lean expert & Consultant) Engineering Members
Mr. C (TOM head)
Mr. D (TOM Executive)
Mr. E (Planning Manager)
Mr. F (Quality Control
Executive)
Mr. G (PhD Student currently working on
lean) ERP support for technology study
Mr. H (ERP Head) Mr. I (IT Executive) Objective
A set of performance for lean team which will focus on reducing lead time, space, efforts and defects Deployment and validation of planned technology combined lean implementation framework designed for automotive parts manufacturing
industry for process improvements and initial technology installation protocols study. Benefits
Study current manufacturing operations and current level of technology involvement in selected case study. Assessment on involvement of seven wastes and non-value added activates involved in current operations.
Study on current level of technologies involved and init ials installations protocols required To minimize non value added activities to improve production lead time
Assumptions, Concerns, Constraints
Assumptions Manufacturing plant has great capability to run on better lead times and new technologies like RFID can be deployed in current operations
Concerns Manufacturing plant is quite old
Expected Constraints Emergence of sudden emergency production schedules from top management can minimize lean team
concentration towards implementation of framework The employees behaviour and cooperation levels towards lean implementation and modern technologies
SCHEDULES IN STAGES- Total Project time: 06 months Descriptions
Phase Duration Conceptual phase 1 month Training on lean basics. Revision on previous lean concepts
Preparation phase 1 month Study on current operations and selection of product family which has maximum production
Lean Implementation phase 2.5 month Utilization of lean tools and simulations
Completion phase 1.5 month Study on improvements and designing of improvement planning
TOOL & TECHNIQUES VSM Designing of current state and future state map
Supermarkets/FIFO Decision on installation of supermarket system or first in first out system TOE framework Study on current levels of technology
Kaizen Development of improvement plan for kaizen
Table 1. A Planning Scheme for ABC-Automotive
The last leading task is to identify selected lean tools like Value Stream Mapping (VSM), First In First Out (IFIO), Technology-Organization-Environment(TOE) and Kaizen. 4. CONCLUSIONS Lean is a philosophy which usually requires proper planning scheme for implementation of frameworks. By considering this requirement, a planning scheme is designed in this case which carries the value in its structure and emphasis on implementation of technology combined lean implementation frameworks in three stages. The first stage is the “proper selection of lean team which must have the abilities to achieve goals and benefits, keeping in view the realistic picture of constrain, concerns and assumptions involved. Second stage of this planning scheme is the scheduling of phases planned with proper timeline to keep a certain track on ongoing activities. Thirdly, there must be certain accessibility on details of lean tools involved which are planned to be utilized for lean implementation. Hence, based on this three stage implementation strategy provided by this “planning Scheme” will be highly appropriate to implement framework in a systematic way.
5. REFERENCES [1] R. Narasimhan, M. Swink, and S. W. Kim,
"Disentangling leanness and agility: an empirical investigation," Journal of operations management, vol. 24, pp. 440-457, 2006.
[2] J. C. Chen, C.-H. Cheng, and P. B. Huang, "Supply chain management with lean production and RFID application: A case study," Expert systems with applications, vol. 40, pp. 3389-3397, 2013.
[3] M. Eswaramoorthi, G. Kathiresan, P. Prasad, and P. Mohanram, "A survey on lean practices in Indian machine tool industries," The International Journal of Advanced Manufacturing Technology, vol. 52, pp. 1091-1101, 2011.
[4] A. N. A. Wahab, M. Mukhtar, and R. Sulaiman, "A Conceptual Model of Lean Manufacturing Dimensions," Procedia Technology, vol. 11, pp. 1292-1298, 2013.
[5] N. V. K. Jasti and R. Kodali, "Lean production: literature review and trends," International Journal of Production Research, vol. 53, pp. 867-885, 2015.
[6] S. Mostafa, J. Dumrak, and H. Soltan, "A framework for lean manufacturing implementation," Production & Manufacturing Research, vol. 1, pp. 44-64, 2013.
[7] S. Vinodh, S. Gautham, and A. Ramiya R, "Implementing lean sigma framework in an Indian automotive valves manufacturing organisation: a case study," Production Planning & Control, vol. 22, pp. 708-722, 2011.
Advanced Processes and Systems in Manufacturing An International Conference 2016 28 ~ 30 August 2016- Kuala Lumpur, pp. 71-72
71
A Review of the Lighting Effects Towards Ergonomics Zuraini Gani 1*, Baba Md Deros1, Dian Darina Indah Daruis2
1) Department of Mechanical and Material Engineering,
Faculty of Engineering and Built Environment, Universiti Kebangsaan Malaysia, 43600 Bangi, Selangor, Malaysia.
2) Faculty Of Engineering, Universiti Pertahanan Malaysia, Kem Sungai Besi, 57000
Kuala Lumpur, Malaysia.
*Corresponding e-mail: [email protected] Keywords: Lighting, workspace, productivity, ergonomics
ABSTRACT – Lighting is one of the important factors that must be considered in the environmental factors that needed in the industry. The objective of this study was to investigate the influence of light on the productivity. Past studies showed that low environmental studies could reduce workers’ productivity and increase health problems among them. Excessive exposure to light will cause discomfort in terms of human and emotional satisfaction Light is essential in a work space to allow a person to view and do work. Adequate light in a room will be decisive for comfort and productivity. This paper presents a review of studies related to the effect of lighting towards productivity. 1. INTRODUCTION
Ergonomics or human factors is a scientific discipline on relevant understanding of the interaction between the human and environmental factors within the system and related professions theory, principles, data and methods of design to optimize human well-being and overall system performance, Therefore, environmental factors such as brightness, sound, temperature, and humidity should be emphasized and prioritized. In an ergonomic work environment, there is a continuous and dynamic interaction between workers and their environment and this resulted in several physiological and psychological responses which in turn affect workers’ comforts, performance, productivity, safety and health [1]. Lighting is also one of the elements in the environmental factors that is ergonomic. Good lighting is needed for good vision and therefore, it is a requirement to have an environment that has sufficient light and user-friendly which is suitable for performing visual tasks. 2. LIGHTING
Light is an electromagnetic radiation comprising wavelengths of light that can be seen by the naked human eye (400-700 nm) [2]. Light has a speed of 300 million km/s there is a vacuum and the speed will be reduced in accordance with the transparency of a space or medium [2]. An intelligent lighting system which is a combination of a light source, detector, communication networks and information systems that are intended to meet the user's visual and non-visual experience while minimizing the impact on the environment [3]. The workers believed that bad lighting in the workplace may cause eye strain, fatigue, headaches, stress, and accidents. In addition, too much light can also cause
health and safety problems such as glaring, headaches and stress. All can cause errors while working and lead to the decline in productivity.
3. STUDY OF LIGHTING
Various studies show that good lighting can increase productivity, and reduce errors. Good lighting does not mean that we need more light but it is more towards providing lights that are clean and that they are in good condition. The lamp should also be positioned in the right circumstances for each task. A lighting system for an ergonomic workstation must ensure that the lighting could help to expedite the implementation of a task that has been set. According to [4], lighting refers to luminaires used in an organization. It includes the perception of respondents about the lighting in helping to launch the implementation of a task that has been set.
In conclusion, 4 effects of light on the human body are a) light has a great impact on the biological functions including human rate warning b) factors such as the duration of the exposure rate of lighting, time and wavelength is the main thing in response to give warning c) the lights can affect brain activity in nerves involving regulations in wake up and d) sleep and behavioural factors and ophthalmologic status must be taken into account when treating patients with diseases that sleepy throughout the day and chronic fatigue syndrome.
A study concerning lighting in the workplace has been done by [5], the aim was to study the lighting environment in the workplace which can guarantee the performance and comfort of individuals at the office. From their study, it was found that quality of lighting could improve the performance of individuals in carrying out their tasks. 4. THE RELATIONSHIP OF LIGHTING AND
PRODUCTIVITY Ergonomics’ objectives are health and
productivity. It is related to the design of things such as an interface that is easy to use in machines and equipment. A good ergonomic design is necessary to prevent injury and repetitive strain. Light pollution science can help us to avoid the negative impact of unnecessary lighting [6]. Lack of lighting will give some effects such as low productivity, high rate of mistakes, failure in selecting the right colours that involve colour selection, sore eyes and lethargy that will eventually lead to the employee feels unmotivated to
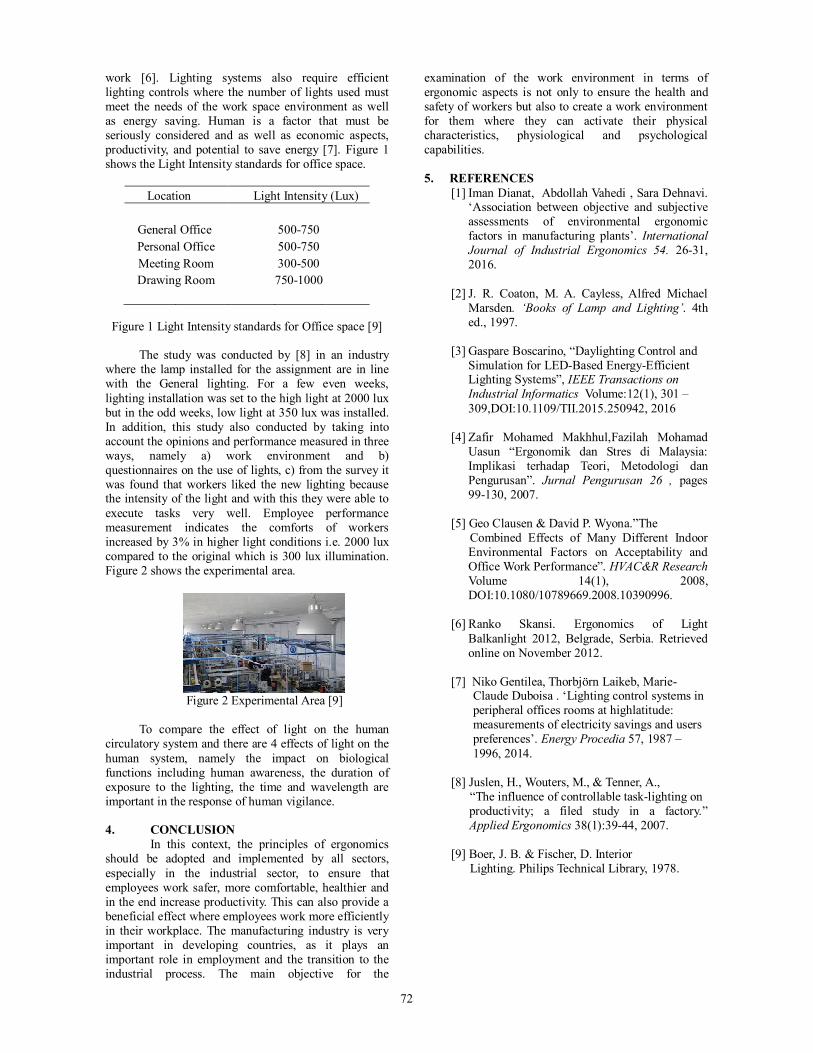
72
work [6]. Lighting systems also require efficient lighting controls where the number of lights used must meet the needs of the work space environment as well as energy saving. Human is a factor that must be seriously considered and as well as economic aspects, productivity, and potential to save energy [7]. Figure 1 shows the Light Intensity standards for office space.
Location Light Intensity (Lux)
General Office 500-750 Personal Office 500-750 Meeting Room 300-500 Drawing Room 750-1000
Figure 1 Light Intensity standards for Office space [9] The study was conducted by [8] in an industry
where the lamp installed for the assignment are in line with the General lighting. For a few even weeks, lighting installation was set to the high light at 2000 lux but in the odd weeks, low light at 350 lux was installed. In addition, this study also conducted by taking into account the opinions and performance measured in three ways, namely a) work environment and b) questionnaires on the use of lights, c) from the survey it was found that workers liked the new lighting because the intensity of the light and with this they were able to execute tasks very well. Employee performance measurement indicates the comforts of workers increased by 3% in higher light conditions i.e. 2000 lux compared to the original which is 300 lux illumination. Figure 2 shows the experimental area.
Figure 2 Experimental Area [9]
To compare the effect of light on the human
circulatory system and there are 4 effects of light on the human system, namely the impact on biological functions including human awareness, the duration of exposure to the lighting, the time and wavelength are important in the response of human vigilance.
4. CONCLUSION In this context, the principles of ergonomics should be adopted and implemented by all sectors, especially in the industrial sector, to ensure that employees work safer, more comfortable, healthier and in the end increase productivity. This can also provide a beneficial effect where employees work more efficiently in their workplace. The manufacturing industry is very important in developing countries, as it plays an important role in employment and the transition to the industrial process. The main objective for the
examination of the work environment in terms of ergonomic aspects is not only to ensure the health and safety of workers but also to create a work environment for them where they can activate their physical characteristics, physiological and psychological capabilities. 5. REFERENCES [1] Iman Dianat, Abdollah Vahedi , Sara Dehnavi.
‘Association between objective and subjective assessments of environmental ergonomic factors in manufacturing plants’. International Journal of Industrial Ergonomics 54. 26-31, 2016.
[2] J. R. Coaton, M. A. Cayless, Alfred Michael
Marsden. ‘Books of Lamp and Lighting’. 4th ed., 1997.
[3] Gaspare Boscarino, “Daylighting Control and
Simulation for LED-Based Energy-Efficient Lighting Systems”, IEEE Transactions on Industrial Informatics Volume:12(1), 301 – 309,DOI:10.1109/TII.2015.250942, 2016
[4] Zafir Mohamed Makhhul,Fazilah Mohamad
Uasun “Ergonomik dan Stres di Malaysia: Implikasi terhadap Teori, Metodologi dan Pengurusan”. Jurnal Pengurusan 26 , pages 99-130, 2007.
[5] Geo Clausen & David P. Wyona.”The Combined Effects of Many Different Indoor
Environmental Factors on Acceptability and Office Work Performance”. HVAC&R Research Volume 14(1), 2008, DOI:10.1080/10789669.2008.10390996.
[6] Ranko Skansi. Ergonomics of Light
Balkanlight 2012, Belgrade, Serbia. Retrieved online on November 2012.
[7] Niko Gentilea, Thorbjörn Laikeb, Marie- Claude Duboisa . ‘Lighting control systems in peripheral offices rooms at highlatitude: measurements of electricity savings and users preferences’. Energy Procedia 57, 1987 – 1996, 2014. [8] Juslen, H., Wouters, M., & Tenner, A., “The influence of controllable task-lighting on
productivity; a filed study in a factory.” Applied Ergonomics 38(1):39-44, 2007.
[9] Boer, J. B. & Fischer, D. Interior Lighting. Philips Technical Library, 1978.
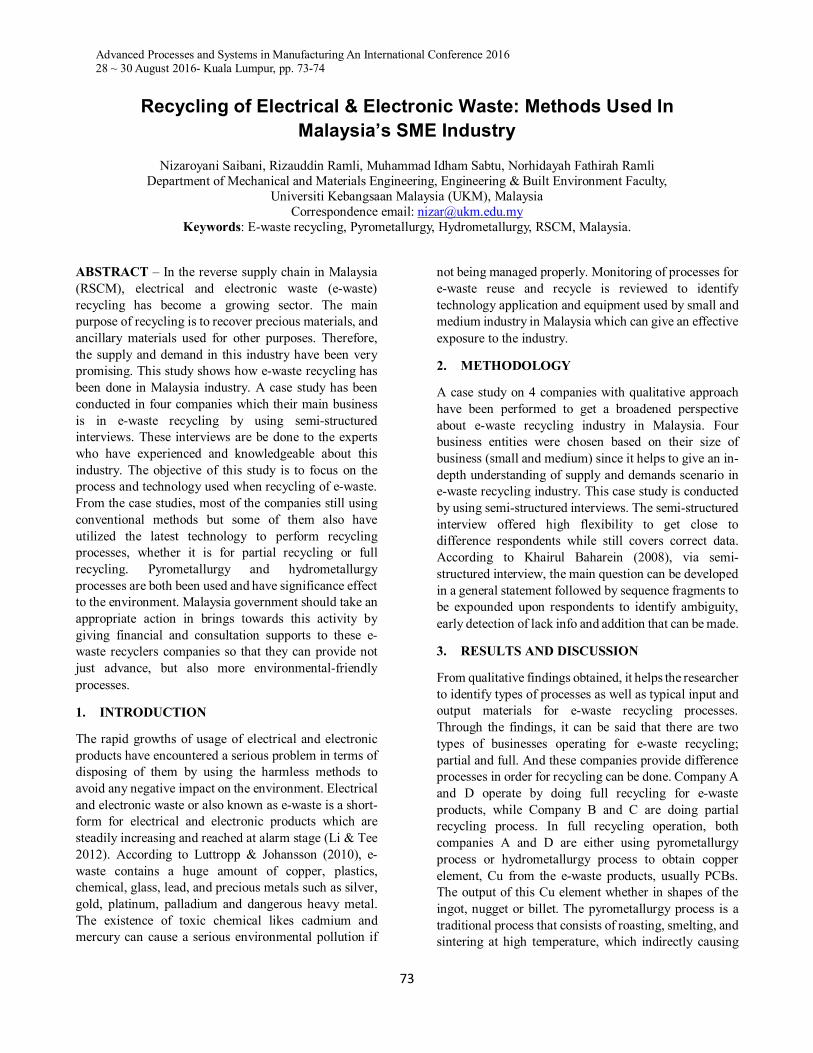
Advanced Processes and Systems in Manufacturing An International Conference 2016 28 ~ 30 August 2016- Kuala Lumpur, pp. 73-74
73
Recycling of Electrical & Electronic Waste: Methods Used In Malaysia’s SME Industry
Nizaroyani Saibani, Rizauddin Ramli, Muhammad Idham Sabtu, Norhidayah Fathirah Ramli Department of Mechanical and Materials Engineering, Engineering & Built Environment Faculty,
Universiti Kebangsaan Malaysia (UKM), Malaysia Correspondence email: [email protected]
Keywords: E-waste recycling, Pyrometallurgy, Hydrometallurgy, RSCM, Malaysia.
ABSTRACT – In the reverse supply chain in Malaysia (RSCM), electrical and electronic waste (e-waste) recycling has become a growing sector. The main purpose of recycling is to recover precious materials, and ancillary materials used for other purposes. Therefore, the supply and demand in this industry have been very promising. This study shows how e-waste recycling has been done in Malaysia industry. A case study has been conducted in four companies which their main business is in e-waste recycling by using semi-structured interviews. These interviews are be done to the experts who have experienced and knowledgeable about this industry. The objective of this study is to focus on the process and technology used when recycling of e-waste. From the case studies, most of the companies still using conventional methods but some of them also have utilized the latest technology to perform recycling processes, whether it is for partial recycling or full recycling. Pyrometallurgy and hydrometallurgy processes are both been used and have significance effect to the environment. Malaysia government should take an appropriate action in brings towards this activity by giving financial and consultation supports to these e-waste recyclers companies so that they can provide not just advance, but also more environmental-friendly processes.
1. INTRODUCTION
The rapid growths of usage of electrical and electronic products have encountered a serious problem in terms of disposing of them by using the harmless methods to avoid any negative impact on the environment. Electrical and electronic waste or also known as e-waste is a short-form for electrical and electronic products which are steadily increasing and reached at alarm stage (Li & Tee 2012). According to Luttropp & Johansson (2010), e-waste contains a huge amount of copper, plastics, chemical, glass, lead, and precious metals such as silver, gold, platinum, palladium and dangerous heavy metal. The existence of toxic chemical likes cadmium and mercury can cause a serious environmental pollution if
not being managed properly. Monitoring of processes for e-waste reuse and recycle is reviewed to identify technology application and equipment used by small and medium industry in Malaysia which can give an effective exposure to the industry.
2. METHODOLOGY
A case study on 4 companies with qualitative approach have been performed to get a broadened perspective about e-waste recycling industry in Malaysia. Four business entities were chosen based on their size of business (small and medium) since it helps to give an in-depth understanding of supply and demands scenario in e-waste recycling industry. This case study is conducted by using semi-structured interviews. The semi-structured interview offered high flexibility to get close to difference respondents while still covers correct data. According to Khairul Baharein (2008), via semi-structured interview, the main question can be developed in a general statement followed by sequence fragments to be expounded upon respondents to identify ambiguity, early detection of lack info and addition that can be made.
3. RESULTS AND DISCUSSION
From qualitative findings obtained, it helps the researcher to identify types of processes as well as typical input and output materials for e-waste recycling processes. Through the findings, it can be said that there are two types of businesses operating for e-waste recycling; partial and full. And these companies provide difference processes in order for recycling can be done. Company A and D operate by doing full recycling for e-waste products, while Company B and C are doing partial recycling process. In full recycling operation, both companies A and D are either using pyrometallurgy process or hydrometallurgy process to obtain copper element, Cu from the e-waste products, usually PCBs. The output of this Cu element whether in shapes of the ingot, nugget or billet. The pyrometallurgy process is a traditional process that consists of roasting, smelting, and sintering at high temperature, which indirectly causing
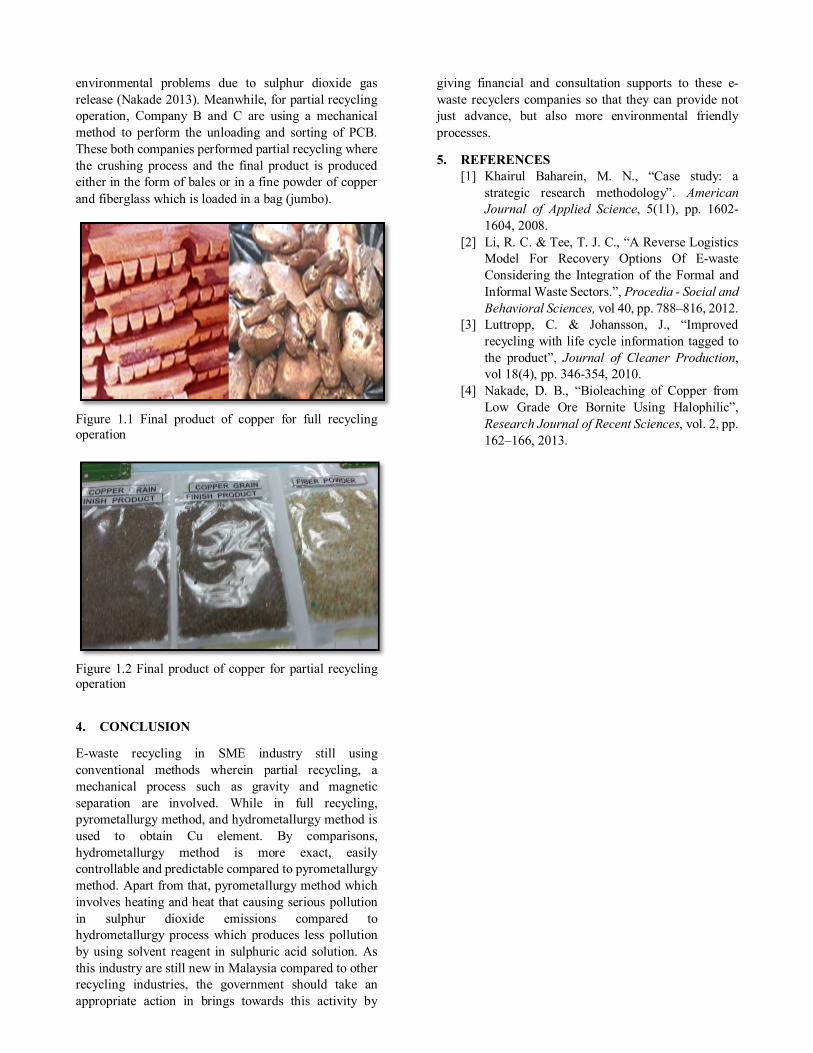
environmental problems due to sulphur dioxide gas release (Nakade 2013). Meanwhile, for partial recycling operation, Company B and C are using a mechanical method to perform the unloading and sorting of PCB. These both companies performed partial recycling where the crushing process and the final product is produced either in the form of bales or in a fine powder of copper and fiberglass which is loaded in a bag (jumbo).
Figure 1.1 Final product of copper for full recycling operation
Figure 1.2 Final product of copper for partial recycling operation
4. CONCLUSION
E-waste recycling in SME industry still using conventional methods wherein partial recycling, a mechanical process such as gravity and magnetic separation are involved. While in full recycling, pyrometallurgy method, and hydrometallurgy method is used to obtain Cu element. By comparisons, hydrometallurgy method is more exact, easily controllable and predictable compared to pyrometallurgy method. Apart from that, pyrometallurgy method which involves heating and heat that causing serious pollution in sulphur dioxide emissions compared to hydrometallurgy process which produces less pollution by using solvent reagent in sulphuric acid solution. As this industry are still new in Malaysia compared to other recycling industries, the government should take an appropriate action in brings towards this activity by
giving financial and consultation supports to these e-waste recyclers companies so that they can provide not just advance, but also more environmental friendly processes.
5. REFERENCES [1] Khairul Baharein, M. N., “Case study: a
strategic research methodology”. American Journal of Applied Science, 5(11), pp. 1602-1604, 2008.
[2] Li, R. C. & Tee, T. J. C., “A Reverse Logistics Model For Recovery Options Of E-waste Considering the Integration of the Formal and Informal Waste Sectors.”, Procedia - Social and Behavioral Sciences, vol 40, pp. 788–816, 2012.
[3] Luttropp, C. & Johansson, J., “Improved recycling with life cycle information tagged to the product”, Journal of Cleaner Production, vol 18(4), pp. 346-354, 2010.
[4] Nakade, D. B., “Bioleaching of Copper from Low Grade Ore Bornite Using Halophilic”, Research Journal of Recent Sciences, vol. 2, pp. 162–166, 2013.
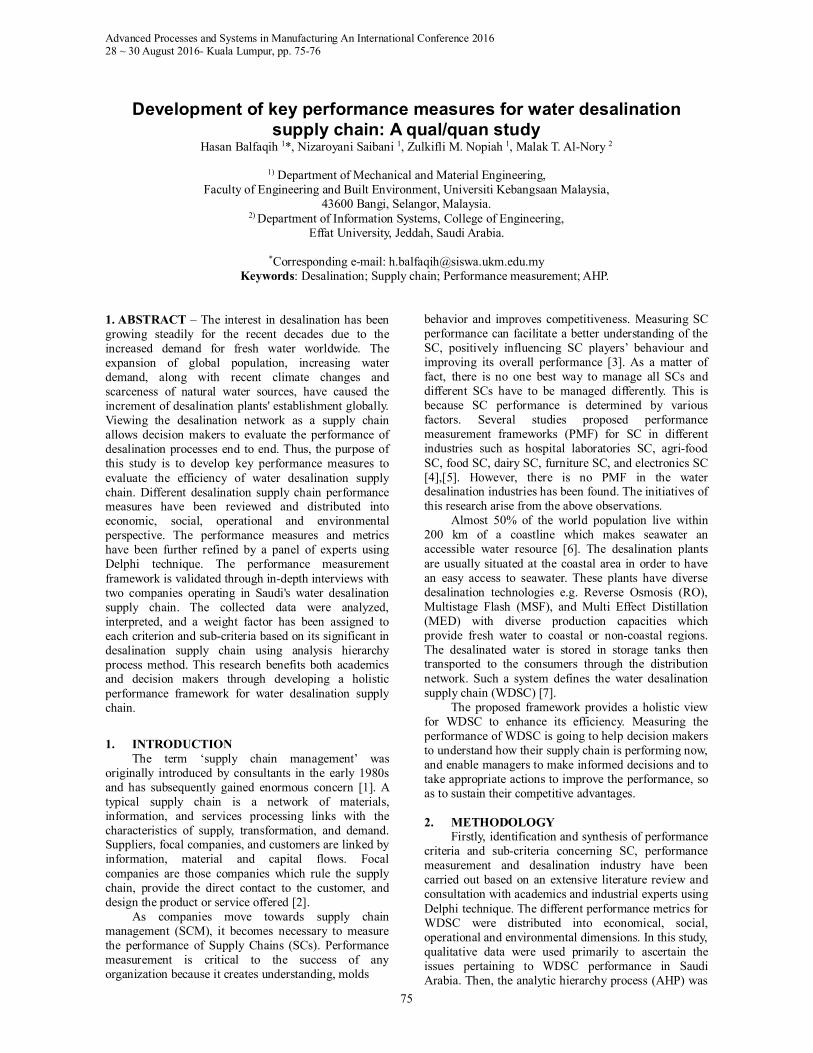
Advanced Processes and Systems in Manufacturing An International Conference 2016 28 ~ 30 August 2016- Kuala Lumpur, pp. 75-76
75
Development of key performance measures for water desalination supply chain: A qual/quan study
Hasan Balfaqih 1*, Nizaroyani Saibani 1, Zulkifli M. Nopiah 1, Malak T. Al-Nory 2
1) Department of Mechanical and Material Engineering,
Faculty of Engineering and Built Environment, Universiti Kebangsaan Malaysia, 43600 Bangi, Selangor, Malaysia.
2) Department of Information Systems, College of Engineering, Effat University, Jeddah, Saudi Arabia.
*Corresponding e-mail: [email protected]
Keywords: Desalination; Supply chain; Performance measurement; AHP.
1. ABSTRACT – The interest in desalination has been growing steadily for the recent decades due to the increased demand for fresh water worldwide. The expansion of global population, increasing water demand, along with recent climate changes and scarceness of natural water sources, have caused the increment of desalination plants' establishment globally. Viewing the desalination network as a supply chain allows decision makers to evaluate the performance of desalination processes end to end. Thus, the purpose of this study is to develop key performance measures to evaluate the efficiency of water desalination supply chain. Different desalination supply chain performance measures have been reviewed and distributed into economic, social, operational and environmental perspective. The performance measures and metrics have been further refined by a panel of experts using Delphi technique. The performance measurement framework is validated through in-depth interviews with two companies operating in Saudi's water desalination supply chain. The collected data were analyzed, interpreted, and a weight factor has been assigned to each criterion and sub-criteria based on its significant in desalination supply chain using analysis hierarchy process method. This research benefits both academics and decision makers through developing a holistic performance framework for water desalination supply chain.
1. INTRODUCTION
The term ‘supply chain management’ was originally introduced by consultants in the early 1980s and has subsequently gained enormous concern [1]. A typical supply chain is a network of materials, information, and services processing links with the characteristics of supply, transformation, and demand. Suppliers, focal companies, and customers are linked by information, material and capital flows. Focal companies are those companies which rule the supply chain, provide the direct contact to the customer, and design the product or service offered [2].
As companies move towards supply chain management (SCM), it becomes necessary to measure the performance of Supply Chains (SCs). Performance measurement is critical to the success of any organization because it creates understanding, molds
behavior and improves competitiveness. Measuring SC performance can facilitate a better understanding of the SC, positively influencing SC players’ behaviour and improving its overall performance [3]. As a matter of fact, there is no one best way to manage all SCs and different SCs have to be managed differently. This is because SC performance is determined by various factors. Several studies proposed performance measurement frameworks (PMF) for SC in different industries such as hospital laboratories SC, agri-food SC, food SC, dairy SC, furniture SC, and electronics SC [4],[5]. However, there is no PMF in the water desalination industries has been found. The initiatives of this research arise from the above observations.
Almost 50% of the world population live within 200 km of a coastline which makes seawater an accessible water resource [6]. The desalination plants are usually situated at the coastal area in order to have an easy access to seawater. These plants have diverse desalination technologies e.g. Reverse Osmosis (RO), Multistage Flash (MSF), and Multi Effect Distillation (MED) with diverse production capacities which provide fresh water to coastal or non-coastal regions. The desalinated water is stored in storage tanks then transported to the consumers through the distribution network. Such a system defines the water desalination supply chain (WDSC) [7].
The proposed framework provides a holistic view for WDSC to enhance its efficiency. Measuring the performance of WDSC is going to help decision makers to understand how their supply chain is performing now, and enable managers to make informed decisions and to take appropriate actions to improve the performance, so as to sustain their competitive advantages. 2. METHODOLOGY
Firstly, identification and synthesis of performance criteria and sub-criteria concerning SC, performance measurement and desalination industry have been carried out based on an extensive literature review and consultation with academics and industrial experts using Delphi technique. The different performance metrics for WDSC were distributed into economical, social, operational and environmental dimensions. In this study, qualitative data were used primarily to ascertain the issues pertaining to WDSC performance in Saudi Arabia. Then, the analytic hierarchy process (AHP) was
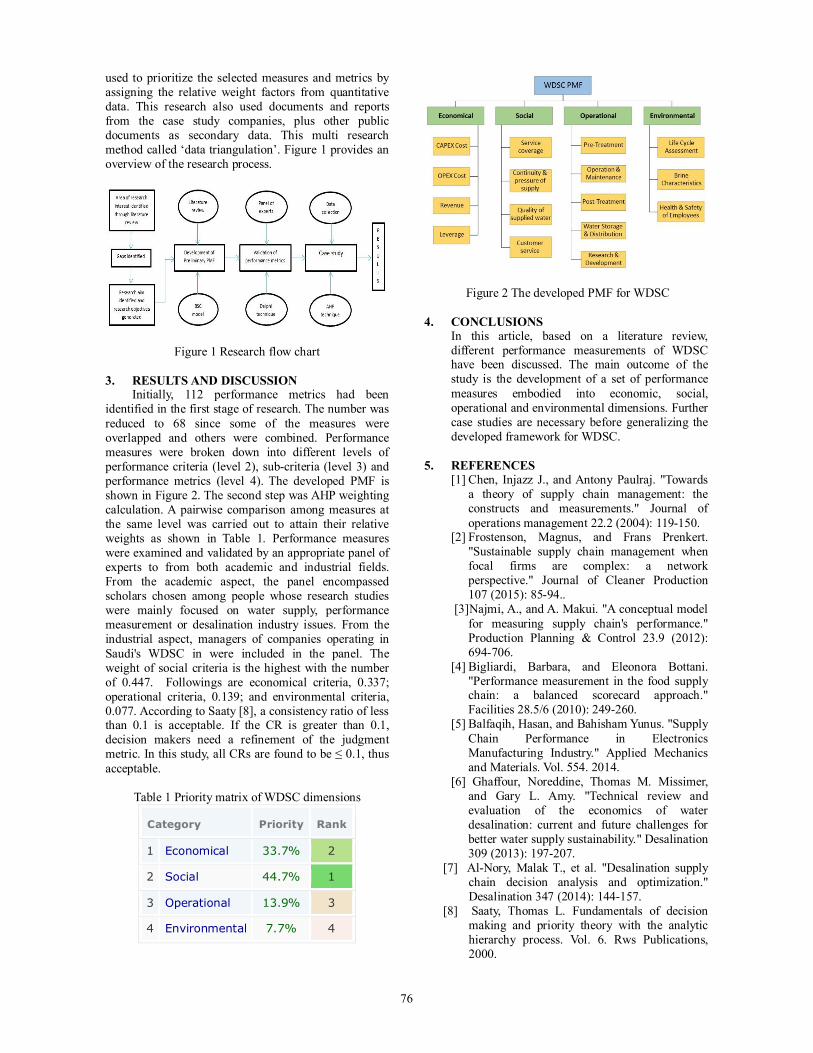
76
used to prioritize the selected measures and metrics by assigning the relative weight factors from quantitative data. This research also used documents and reports from the case study companies, plus other public documents as secondary data. This multi research method called ‘data triangulation’. Figure 1 provides an overview of the research process.
Figure 1 Research flow chart
3. RESULTS AND DISCUSSION Initially, 112 performance metrics had been
identified in the first stage of research. The number was reduced to 68 since some of the measures were overlapped and others were combined. Performance measures were broken down into different levels of performance criteria (level 2), sub-criteria (level 3) and performance metrics (level 4). The developed PMF is shown in Figure 2. The second step was AHP weighting calculation. A pairwise comparison among measures at the same level was carried out to attain their relative weights as shown in Table 1. Performance measures were examined and validated by an appropriate panel of experts to from both academic and industrial fields. From the academic aspect, the panel encompassed scholars chosen among people whose research studies were mainly focused on water supply, performance measurement or desalination industry issues. From the industrial aspect, managers of companies operating in Saudi's WDSC in were included in the panel. The weight of social criteria is the highest with the number of 0.447. Followings are economical criteria, 0.337; operational criteria, 0.139; and environmental criteria, 0.077. According to Saaty [8], a consistency ratio of less than 0.1 is acceptable. If the CR is greater than 0.1, decision makers need a refinement of the judgment metric. In this study, all CRs are found to be ≤ 0.1, thus acceptable.
Table 1 Priority matrix of WDSC dimensions
Category Priority Rank
1 Economical 33.7% 2
2 Social 44.7% 1
3 Operational 13.9% 3
4 Environmental 7.7% 4
Figure 2 The developed PMF for WDSC 4. CONCLUSIONS
In this article, based on a literature review, different performance measurements of WDSC have been discussed. The main outcome of the study is the development of a set of performance measures embodied into economic, social, operational and environmental dimensions. Further case studies are necessary before generalizing the developed framework for WDSC.
5. REFERENCES [1] Chen, Injazz J., and Antony Paulraj. "Towards
a theory of supply chain management: the constructs and measurements." Journal of operations management 22.2 (2004): 119-150.
[2] Frostenson, Magnus, and Frans Prenkert. "Sustainable supply chain management when focal firms are complex: a network perspective." Journal of Cleaner Production 107 (2015): 85-94..
[3] Najmi, A., and A. Makui. "A conceptual model for measuring supply chain's performance." Production Planning & Control 23.9 (2012): 694-706.
[4] Bigliardi, Barbara, and Eleonora Bottani. "Performance measurement in the food supply chain: a balanced scorecard approach." Facilities 28.5/6 (2010): 249-260.
[5] Balfaqih, Hasan, and Bahisham Yunus. "Supply Chain Performance in Electronics Manufacturing Industry." Applied Mechanics and Materials. Vol. 554. 2014.
[6] Ghaffour, Noreddine, Thomas M. Missimer, and Gary L. Amy. "Technical review and evaluation of the economics of water desalination: current and future challenges for better water supply sustainability." Desalination 309 (2013): 197-207.
[7] Al-Nory, Malak T., et al. "Desalination supply chain decision analysis and optimization." Desalination 347 (2014): 144-157.
[8] Saaty, Thomas L. Fundamentals of decision making and priority theory with the analytic hierarchy process. Vol. 6. Rws Publications, 2000.