Embed Size (px)
Citation preview
J Water SRTÐ Aqua Vol. 48, No. 3, pp. 73±83, 1999
Life cycle assessment of drinking water and rain water for toilets
¯ushing
P. Crettaz*, O. Jolliet*, J.-M. Cuanillon{ and S. Orlando{, *Ecole Polytechnique FeÂdeÂrale de Lausanne, Institutd'AmeÂnagement des Terres et des Eaux, CH-1015 Lausanne, Suisse; {RWB SA IngeÂnieurs-conseils SIA/ASIC, CH-2900 Porrentruy, Suisse
ABSTRACT: Systems using rain water or reducing water consumption have been recently developed as an
alternative to conventional toilet ¯ushing. This article aims to quantify the environmental impacts of these
systems and to identify key factors in each system. A Life Cycle Assessment (LCA) has been carried out to
reach these goals.
Scenarios with conventional water supplies present a lower energy requirement and lower environmental
loads than recuperation scenarios. Sensitivity analyses indicate that recuperation is energetically favourable
only when the energy required for the water supply is higher than 0.8 kWh/m3, assuming a complex drinking
water treatment. The study also reveals that low-¯ow toilets should be promoted as they lead to signi®cant
reductions in energy consumption and in pollutant emissions. A combination of a conventional water
supply and low water consumption (scenario CONVeco) is advantageous for all environmental problems.
INTRODUCTION
Regions where water shortages may occur are limited in
countries like Switzerland. However, unpolluted water is
becoming more of a scare resource and the cost of water
supply and treatment is constantly increasing. A moderated
use of water is therefore recommended by the Swiss water
protection regulation [1]. Di�erent ways to diminish water
consumption have been proposed, among them the use of low-
¯ow toilets (called `economic toilets' in this article). Moreover,
rain water recuperation has been proposed as an alternative to
its evacuation in the sewage system when in®ltration is not
possible. Di�erent systems using rain water or reducing water
consumption have been recently developed as an alternative to
conventional toilet supply.
Rain water recuperation is a much debated subject. For its
supporters, it does not make any sense to transport water on
long distances, to treat it, and then to use it for toilet ¯ushing.
Instead, rain water could be used as part of a sustainable
management of water resources [2,3]. For the opponents of
rain water recuperation, its use is questionable in areas where
there is no shortage of water. Their arguments are that the
energy savings are illusory and that some hygienic problems
may occur [4].
No study with an overall view of the issues involved on the
whole chain of water production and treatment has ever been
presented, neither by supporters nor by opponents of the rain
water recuperation. To ®ll this gap and to go beyond the
dogmatic position concerning this subject, the research pro-
gramme CYCLEAUPE I has been launched following a
request from the Swiss Environmental Protection Agency
(BUWAL). The environmental tool Life Cycle Assessment
(LCA) has been selected, as it allows for a quanti®cation of
the environmental burdens on the whole chain of processes
required for toilet ¯ushing. The structure of this article is based
on the four steps of an LCA, which are: goal de®nition,
inventory, impact assessment and interpretation analysis [5].
The goal de®nition de®nes the aim and the scope of the study as
well as the functional unit and the system boundaries. The
inventory lists the pollutant emissions and the consumption of
resources. The impact assessment evaluates the environmental
impact of these emissions on both humans and ecosystems. The
interpretation analysis ®nally discusses the results and carries
out some sensitivity analyses.
GOAL DEFINITION
Aims
The study aims at quantifying the environmental impacts of
systems which are using rain water or are reducing water
consumption for toilet ¯ushing. The advantages and disadvan-
tages of these systems are identi®ed. Conditions making each
system interesting from an environmental point of view are also
determined, as well as the processes responsible for the main
environmental burdens.
It should be noted that this study was restricted to rain water
use for toilet ¯ushing. Garden watering is only studied in a
sensitivity analysis and washing machine supply will be con-
sidered in a further project.
Scenarios
The main ®ve scenarios presented in this article are described
below. Variants of the drinking water treatment and supply, as
well as variants of the storage tank and the pump, are discussed
# 1999 IWSA 73
in the sensitivity analysis. (See `Comparison with the economic
study' below.)
Conventional scenario: CONV
This scenario is characterised by a conventional water supply
for toilets. Rain water is in®ltrated in the soil. As reference
values for this study, we selected:
. A complex drinking water treatment (treatment with chlor-
ine, activated carbon, ozone and ¯occulation).
. A Swiss average energy requirement of 0.35 kWh/m3 for the
water supply [6].
. A classic wastewater treatment plant.
. A two-level house (two families of four persons per level,
100m2 of living area for each family).
. A Swiss electricity supply for the water supply, as well as for
the drinking water and the wastewater plant. Major energy
sources for Swiss electricity generation are hydroelectricity
(58.7%) and nuclear energy (38.3%) [7].
. Conventional toilets are characterised by a water consump-
tion of 9L/¯ushing [8]. An average of six ¯ushings per person
per day is assumed, leading to a water consumption of 54L/
personal-day.
Recuperation scenario: REC10
In this scenario, rain water is stored in a individual storage tank
made of polyester and pumped towards the toilets (Fig. 1).
Other additional sanitary installations such as ®lter pipes are
required. As calculated in [9], a 10m3 storage tank leads to a
recovery fraction of 57%. This fraction means that 57% of the
water consumption for toilet ¯ushing can be provided by the
recuperation system; 43% of the consumption would be pro-
vided by the conventional water supply system. The house is
still connected to the conventional water supply in order to
¯ush the toilets when the storage tank is empty.
As a reference value for this study, an energy requirement of
0.09 kWh/m3 for pumping the rain water from the storage tank
to the toilets has been chosen [8].
Independent recuperation scenario, economic toilets: REC100%
A 20m3 storage tank leads to a recovery fraction of 100% if
economic toilets are used [9]. This means that 100% of the
water consumption for toilet ¯ushing is provided by the
recuperation system. Independence from the conventional
water supply is therefore provided, allowing a reduction in the
size of this.
Conventional scenario with economic toilets: CONVeco
This scenario is based on the same water supply system as that
of the CONV scenario. The only di�erence is that economic
toilets, characterised by a reduced consumption of 3.5 L/¯ush-
ing, are selected in this case.
Recuperation scenario with economic toilets: REC10eco
This scenario is similar to the REC10 scenario. The only
di�erence is that economic toilets are selected here, leading to
a recovery fraction of 97% [9].
Functional unit and system boundaries
The goal of the system is to have ¯ushing toilets with a
satisfactory level of hygiene. The functional unit is therefore
Flushing per Person per Day, abbreviated to `FPD'. All
inventory emissions must be reported to this unit.
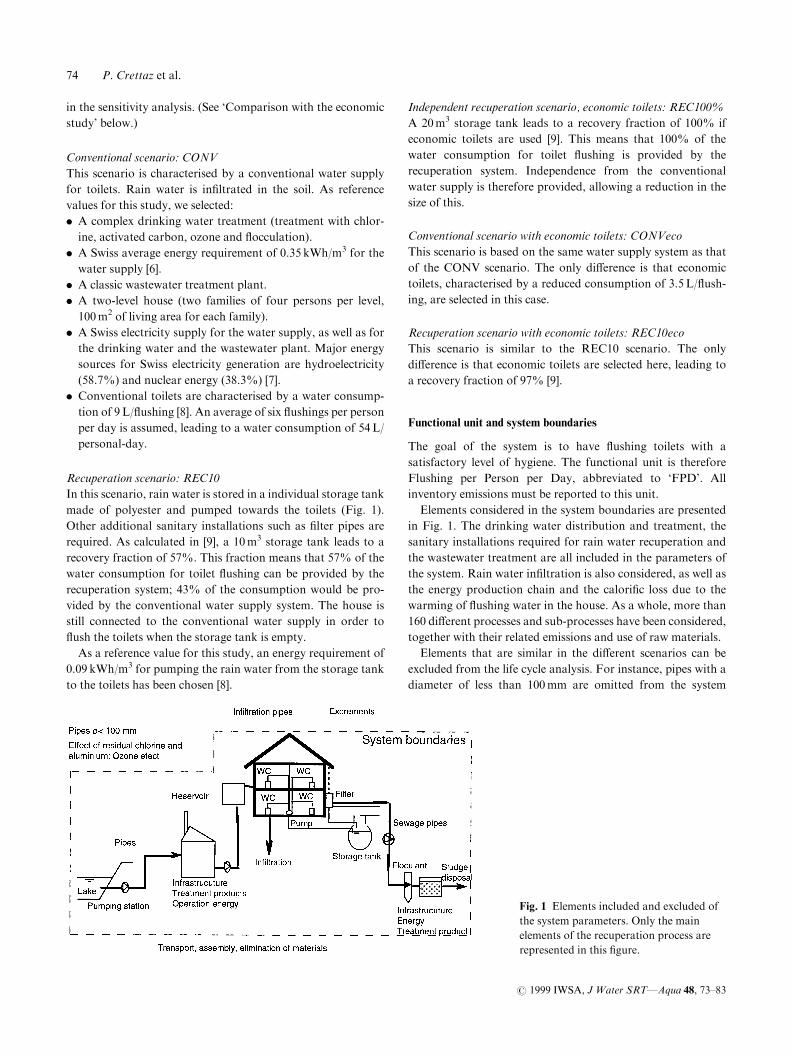
Elements considered in the system boundaries are presented
in Fig. 1. The drinking water distribution and treatment, the
sanitary installations required for rain water recuperation and
the wastewater treatment are all included in the parameters of
the system. Rain water in®ltration is also considered, as well as
the energy production chain and the calori®c loss due to the
warming of ¯ushing water in the house. As a whole, more than
160 di�erent processes and sub-processes have been considered,
together with their related emissions and use of raw materials.
Elements that are similar in the di�erent scenarios can be
excluded from the life cycle analysis. For instance, pipes with a
diameter of less than 100mm are omitted from the system
Fig. 1 Elements included and excluded of
the system parameters. Only the main
elements of the recuperation process are
represented in this ®gure.
74 P. Crettaz et al.
# 1999 IWSA, J Water SRTÐAqua 48, 73±83
boundaries as their sizing depends on the requirements for ®re
protection. In addition, excrement and in®ltration pipes are
excluded from the system parameters as they are similar in each
scenario. The transport, assembly and elimination of the
di�erent inputs are also excluded because of a lack of informa-
tion (except for the wastewater treatment plant). The e�ect of
residual chlorine and aluminium resulting from the drinking
water treatment are excluded in the ®rst stage, as well as the
e�ect of ozone emissions at the drinking water treatment plant.
INVENTORY
Method
Emissions of air, water and soil pollutants, as well as energy
consumption can be deduced from input ¯ows and emission
factors.
Input ¯ows are the quantities of materials, energy or trans-
port required for each sub-process. The input ¯ows for the
wastewater treatment plant are available in the study con-
ducted by [10]. This study has determined the energy and
product requirements as a function of wastewater quality. For
drinking water distribution and treatment, as well as for the
sanitary installations required for recuperation, input ¯ows
have been determined in a previous technical project [8].
Emission factors quantify the emissions and energy con-
sumption per input unit. The emission factors proposed by [7]
(1996) are retained. For products speci®c to drinking water
treatment such as activated carbon, hydrogen peroxide and
WAC (chemicals used for ¯occulation), speci®c research by the
producers has been carried out.
The input requirements have been reported per m3 for each
infrastructure. The speci®c emissions in m3 can then be auto-
matically calculated. The fraction F of these emissions for each
scenario, as well as the details of the inventory calculations, are
presented in [9]. The basic concept is that the elements that are
related in size to peak water demand (general reservoir, infra-
structure of the drinking water treatment plant) can only be
reduced if the supply to toilets is independent from the conven-
tional water distribution system, even during dry periods. On
the other hand, elements that are sized in relation to the mean
¯ow in the water distribution system (pumping station, energy
and product requirements for the drinking water treatment
plant, energy for the water supply) can be reduced, even if the
recuperation does not yield a recovery fraction of 100%.
Direct transfer of rain water pollutants
In addition to the emissions related to the various inputs, the
direct transfer of pollutants contained in water should be
evaluated. Pollutant concentrations in rain and drinking water
have been evaluated on the basis of values reported by [11] and
[12]. It appears that heavy metal content is much greater in rain
water than in drinking water for some pollutants (Pb, Cu) and
only slightly higher for other heavy metals (Zn, Cd) [9].
This di�erence in heavy metal concentrations in rain water
and drinking water has to be considered as the fate of
pollutants contained in water changes from one scenario to
another. In conventional scenarios, rain water is in®ltrated and
drinking water used for toilet ¯ushing is transferred to the
waste water treatment plant. Pollutants arriving at the waste-
water treatment plant are transferred to air, water and sludges.
A transfer into food products occurs if sludges are used as a
fertiliser in agriculture. In recuperation scenarios, rain water is
sent to the wastewater treatment plant as long as the storage
tank is not empty. In that latter case, drinking water is sent to
the wastewater treatment plant. In®ltration occurs only when
the storage tank is full.
It should be emphasised that pollutants contained in rain
water are emitted by processes such as cars, industries and
heating and could therefore be allocated to these activities.
However, rain water recuperation modi®es the fate of these
pollutants. Therefore, the impact of these pollutants is pre-
sented in this article separately from the other processes.
Inventory results
Energy
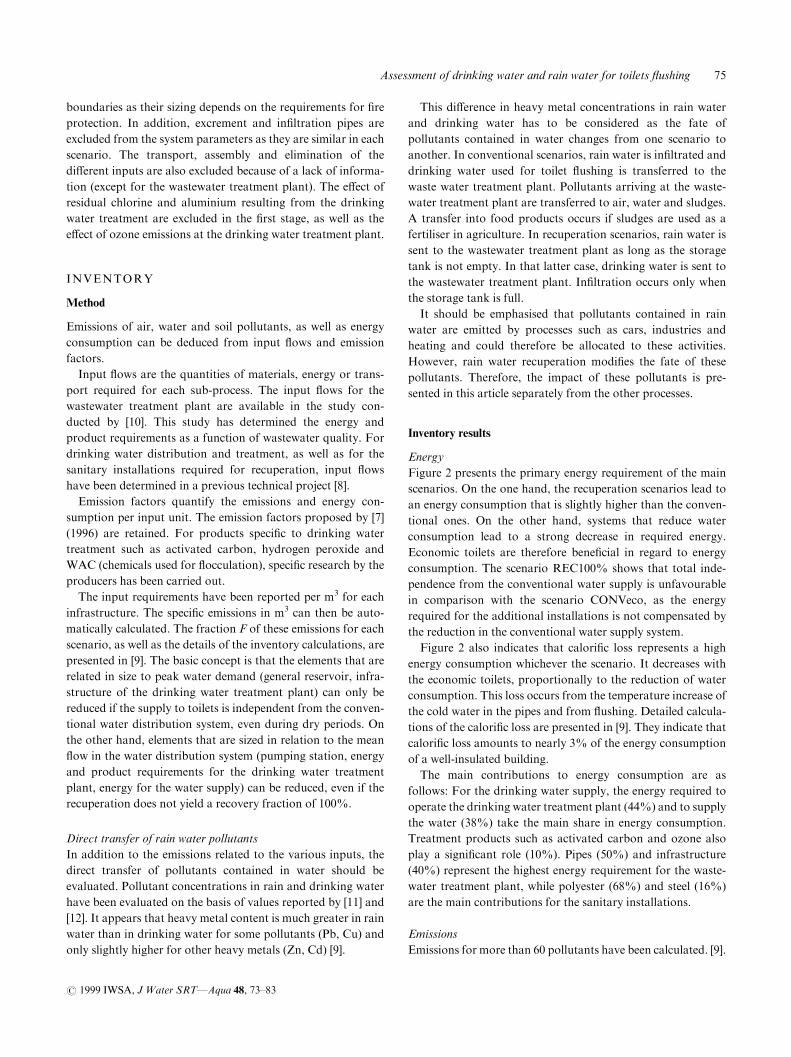
Figure 2 presents the primary energy requirement of the main
scenarios. On the one hand, the recuperation scenarios lead to
an energy consumption that is slightly higher than the conven-
tional ones. On the other hand, systems that reduce water
consumption lead to a strong decrease in required energy.
Economic toilets are therefore bene®cial in regard to energy
consumption. The scenario REC100% shows that total inde-
pendence from the conventional water supply is unfavourable
in comparison with the scenario CONVeco, as the energy
required for the additional installations is not compensated by
the reduction in the conventional water supply system.
Figure 2 also indicates that calori®c loss represents a high
energy consumption whichever the scenario. It decreases with
the economic toilets, proportionally to the reduction of water
consumption. This loss occurs from the temperature increase of
the cold water in the pipes and from ¯ushing. Detailed calcula-
tions of the calori®c loss are presented in [9]. They indicate that
calori®c loss amounts to nearly 3% of the energy consumption
of a well-insulated building.
The main contributions to energy consumption are as
follows: For the drinking water supply, the energy required to
operate the drinking water treatment plant (44%) and to supply
the water (38%) take the main share in energy consumption.
Treatment products such as activated carbon and ozone also
play a signi®cant role (10%). Pipes (50%) and infrastructure
(40%) represent the highest energy requirement for the waste-
water treatment plant, while polyester (68%) and steel (16%)
are the main contributions for the sanitary installations.
Emissions
Emissions for more than 60 pollutants have been calculated. [9].
Assessment of drinking water and rain water for toilets ¯ushing 75
# 1999 IWSA, J Water SRTÐAqua 48, 73±83
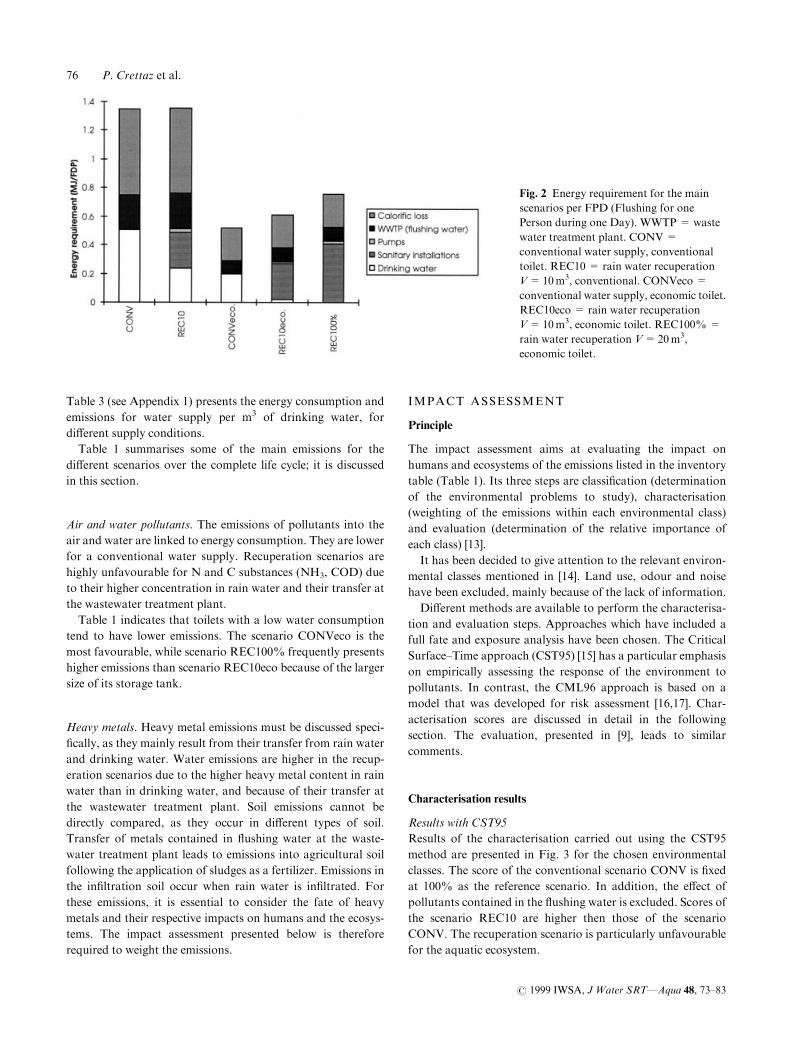
Table 3 (see Appendix 1) presents the energy consumption and
emissions for water supply per m3 of drinking water, for
di�erent supply conditions.
Table 1 summarises some of the main emissions for the
di�erent scenarios over the complete life cycle; it is discussed
in this section.
Air and water pollutants. The emissions of pollutants into the
air and water are linked to energy consumption. They are lower
for a conventional water supply. Recuperation scenarios are
highly unfavourable for N and C substances (NH3, COD) due
to their higher concentration in rain water and their transfer at
the wastewater treatment plant.
Table 1 indicates that toilets with a low water consumption
tend to have lower emissions. The scenario CONVeco is the
most favourable, while scenario REC100% frequently presents
higher emissions than scenario REC10eco because of the larger
size of its storage tank.
Heavy metals. Heavy metal emissions must be discussed speci-
®cally, as they mainly result from their transfer from rain water
and drinking water. Water emissions are higher in the recup-
eration scenarios due to the higher heavy metal content in rain
water than in drinking water, and because of their transfer at
the wastewater treatment plant. Soil emissions cannot be
directly compared, as they occur in di�erent types of soil.
Transfer of metals contained in ¯ushing water at the waste-
water treatment plant leads to emissions into agricultural soil
following the application of sludges as a fertilizer. Emissions in
the in®ltration soil occur when rain water is in®ltrated. For
these emissions, it is essential to consider the fate of heavy
metals and their respective impacts on humans and the ecosys-
tems. The impact assessment presented below is therefore
required to weight the emissions.
IMPACT ASSESSMENT
Principle
The impact assessment aims at evaluating the impact on
humans and ecosystems of the emissions listed in the inventory
table (Table 1). Its three steps are classi®cation (determination
of the environmental problems to study), characterisation
(weighting of the emissions within each environmental class)
and evaluation (determination of the relative importance of
each class) [13].
It has been decided to give attention to the relevant environ-
mental classes mentioned in [14]. Land use, odour and noise
have been excluded, mainly because of the lack of information.
Di�erent methods are available to perform the characterisa-
tion and evaluation steps. Approaches which have included a
full fate and exposure analysis have been chosen. The Critical
Surface±Time approach (CST95) [15] has a particular emphasis
on empirically assessing the response of the environment to
pollutants. In contrast, the CML96 approach is based on a
model that was developed for risk assessment [16,17]. Char-
acterisation scores are discussed in detail in the following
section. The evaluation, presented in [9], leads to similar
comments.
Characterisation results
Results with CST95
Results of the characterisation carried out using the CST95
method are presented in Fig. 3 for the chosen environmental
classes. The score of the conventional scenario CONV is ®xed
at 100% as the reference scenario. In addition, the e�ect of
pollutants contained in the ¯ushing water is excluded. Scores of
the scenario REC10 are higher then those of the scenario
CONV. The recuperation scenario is particularly unfavourable
for the aquatic ecosystem.
Fig. 2 Energy requirement for the main
scenarios per FPD (Flushing for one
Person during one Day). WWTP = waste
water treatment plant. CONV=
conventional water supply, conventional
toilet. REC10 = rain water recuperation
V=10m3, conventional. CONVeco =
conventional water supply, economic toilet.
REC10eco = rain water recuperation
V=10m3, economic toilet. REC100%=
rain water recuperation V=20m3,
economic toilet.
76 P. Crettaz et al.
# 1999 IWSA, J Water SRTÐAqua 48, 73±83
Economic toilets clearly appear to be advantageous for all
environmental problems. This is in accordance with the energy
requirement and the emissions discussed above. The scenario
CONVeco is the most favourable from an environmental point
of view. This scenario is even more favourable than it appears
in Fig. 3 if the e�ect of pollutants contained in ¯ushing water is
included. Indeed, these pollutants are transferred at the waste-
water treatment plant. As this transfer is proportional to the
water contamination, and as rain water is more polluted than
drinking water, recuperation induces an extra load on the
toxicity and eutrophisation classes. The hypothesis of whether
to allocate heavy metals to the recuperation process or not is
therefore crucial for the toxicity classes.
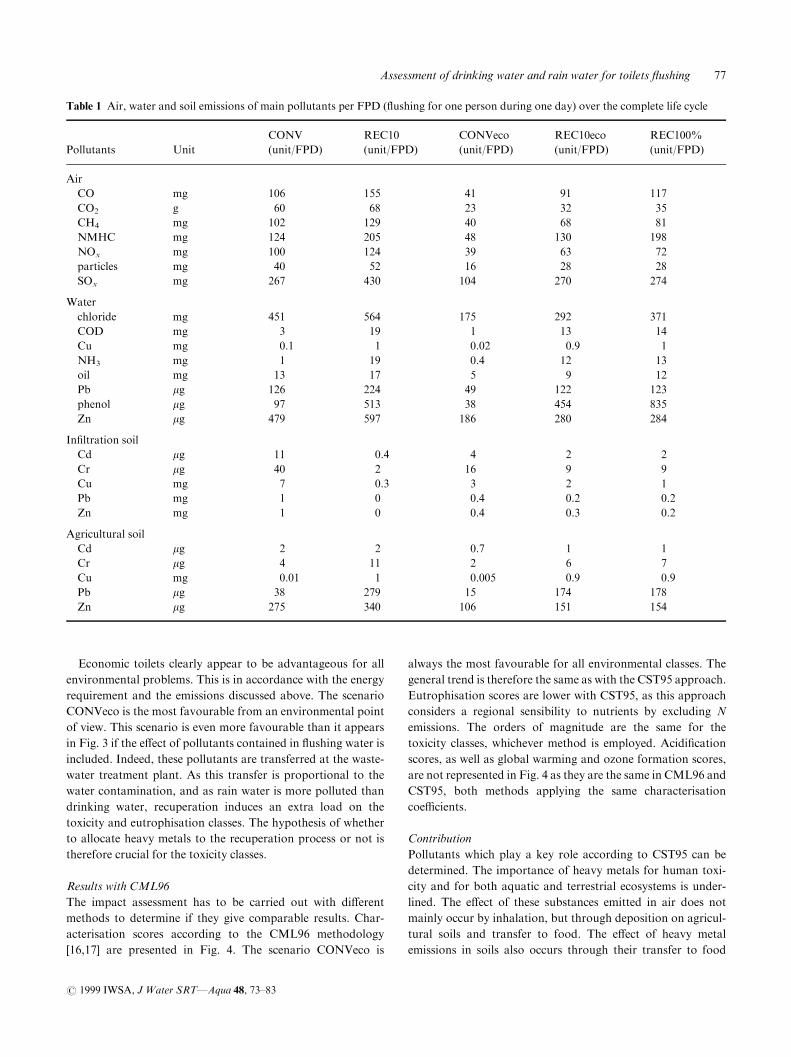
Results with CML96
The impact assessment has to be carried out with di�erent
methods to determine if they give comparable results. Char-
acterisation scores according to the CML96 methodology
[16,17] are presented in Fig. 4. The scenario CONVeco is
always the most favourable for all environmental classes. The
general trend is therefore the same as with the CST95 approach.
Eutrophisation scores are lower with CST95, as this approach
considers a regional sensibility to nutrients by excluding N
emissions. The orders of magnitude are the same for the
toxicity classes, whichever method is employed. Acidi®cation
scores, as well as global warming and ozone formation scores,
are not represented in Fig. 4 as they are the same in CML96 and
CST95, both methods applying the same characterisation
coe�cients.
Contribution
Pollutants which play a key role according to CST95 can be
determined. The importance of heavy metals for human toxi-
city and for both aquatic and terrestrial ecosystems is under-
lined. The e�ect of these substances emitted in air does not
mainly occur by inhalation, but through deposition on agricul-
tural soils and transfer to food. The e�ect of heavy metal
emissions in soils also occurs through their transfer to food
Table 1 Air, water and soil emissions of main pollutants per FPD (¯ushing for one person during one day) over the complete life cycle
CONV REC10 CONVeco REC10eco REC100%
Pollutants Unit (unit/FPD) (unit/FPD) (unit/FPD) (unit/FPD) (unit/FPD)
Air
CO mg 106 155 41 91 117
CO2 g 60 68 23 32 35
CH4 mg 102 129 40 68 81
NMHC mg 124 205 48 130 198
NOx mg 100 124 39 63 72
particles mg 40 52 16 28 28
SOx mg 267 430 104 270 274
Water
chloride mg 451 564 175 292 371
COD mg 3 19 1 13 14
Cu mg 0.1 1 0.02 0.9 1
NH3 mg 1 19 0.4 12 13
oil mg 13 17 5 9 12
Pb mg 126 224 49 122 123
phenol mg 97 513 38 454 835
Zn mg 479 597 186 280 284
In®ltration soil
Cd mg 11 0.4 4 2 2
Cr mg 40 2 16 9 9
Cu mg 7 0.3 3 2 1
Pb mg 1 0 0.4 0.2 0.2
Zn mg 1 0 0.4 0.3 0.2
Agricultural soil
Cd mg 2 2 0.7 1 1
Cr mg 4 11 2 6 7
Cu mg 0.01 1 0.005 0.9 0.9
Pb mg 38 279 15 174 178
Zn mg 275 340 106 151 154
Assessment of drinking water and rain water for toilets ¯ushing 77
# 1999 IWSA, J Water SRTÐAqua 48, 73±83
products. In addition to heavy metals, oil and phenol are also
important contributors to the aquatic ecosystem score.
It should be mentioned that the average Swiss disposal of
sludge (49% agriculture, 32% incineration and 19% land®ll)
has been chosen in the calculations. The e�ect on humans
would be lower if a 100% incineration scenario were selected.
In addition, it has been assumed that rain water in®ltration has
no e�ect on the terrestrial ecosystem, as the in®ltration is
localised and occurs in deep soil layers.
INTERPRETATION
Sensitivity analysis
Inventory and characterisation results have been presented for
the ®ve main scenarios. Sensitivity analyses have been carried
out to ®nd out how changes in key parameters in¯uence the
results. Only economic toilets are investigated here, as it has
been shown that they are clearly favourable.
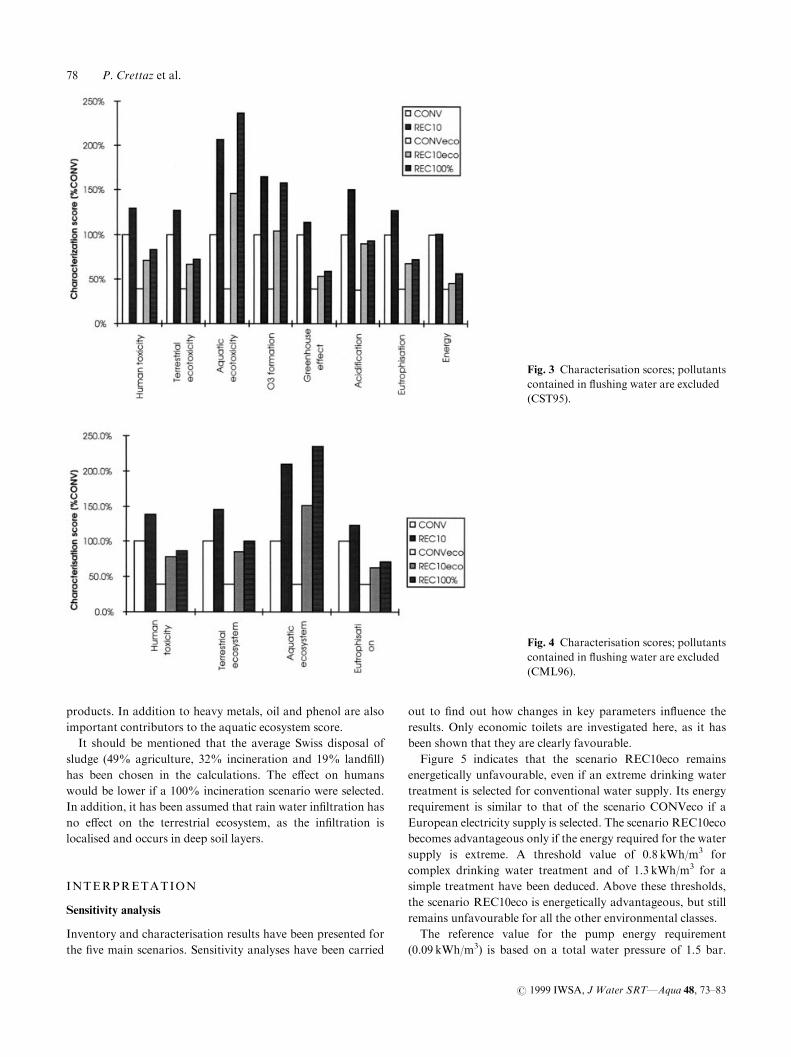
Figure 5 indicates that the scenario REC10eco remains
energetically unfavourable, even if an extreme drinking water
treatment is selected for conventional water supply. Its energy
requirement is similar to that of the scenario CONVeco if a
European electricity supply is selected. The scenario REC10eco
becomes advantageous only if the energy required for the water
supply is extreme. A threshold value of 0.8 kWh/m3 for
complex drinking water treatment and of 1.3 kWh/m3 for a
simple treatment have been deduced. Above these thresholds,
the scenario REC10eco is energetically advantageous, but still
remains unfavourable for all the other environmental classes.
The reference value for the pump energy requirement
(0.09 kWh/m3) is based on a total water pressure of 1.5 bar.
Fig. 3 Characterisation scores; pollutants
contained in ¯ushing water are excluded
(CST95).
Fig. 4 Characterisation scores; pollutants
contained in ¯ushing water are excluded
(CML96).
78 P. Crettaz et al.
# 1999 IWSA, J Water SRTÐAqua 48, 73±83
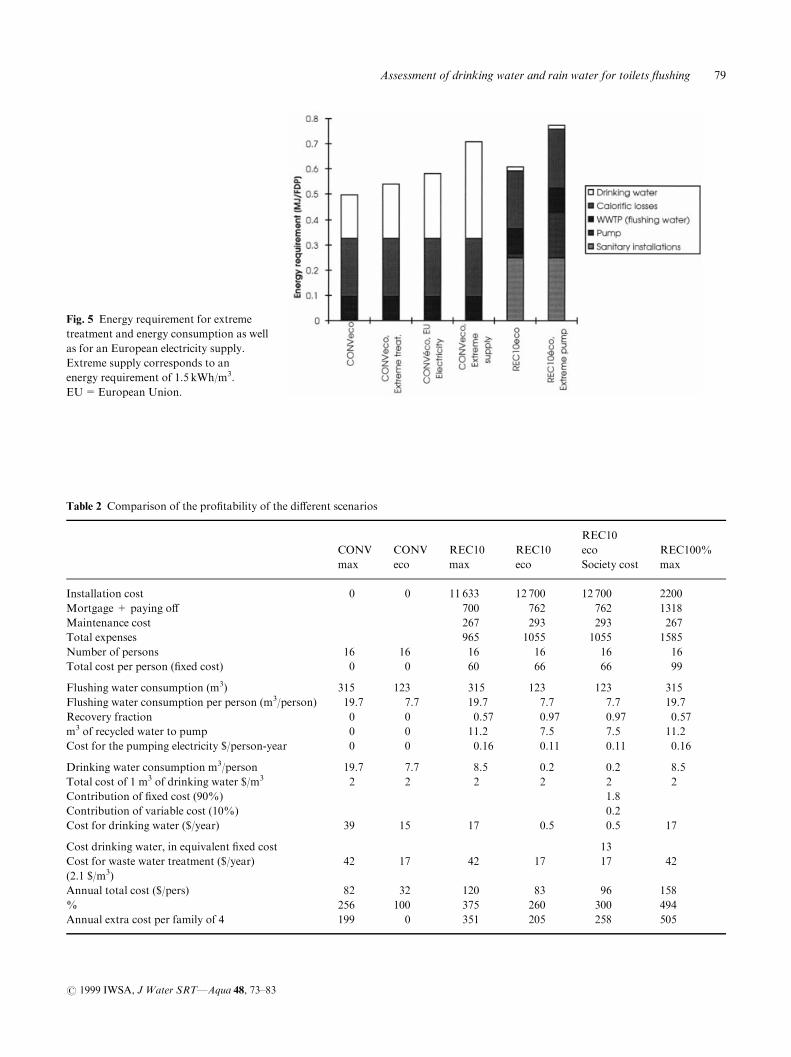
Fig. 5 Energy requirement for extreme
treatment and energy consumption as well
as for an European electricity supply.
Extreme supply corresponds to an
energy requirement of 1.5 kWh/m3.
EU=European Union.
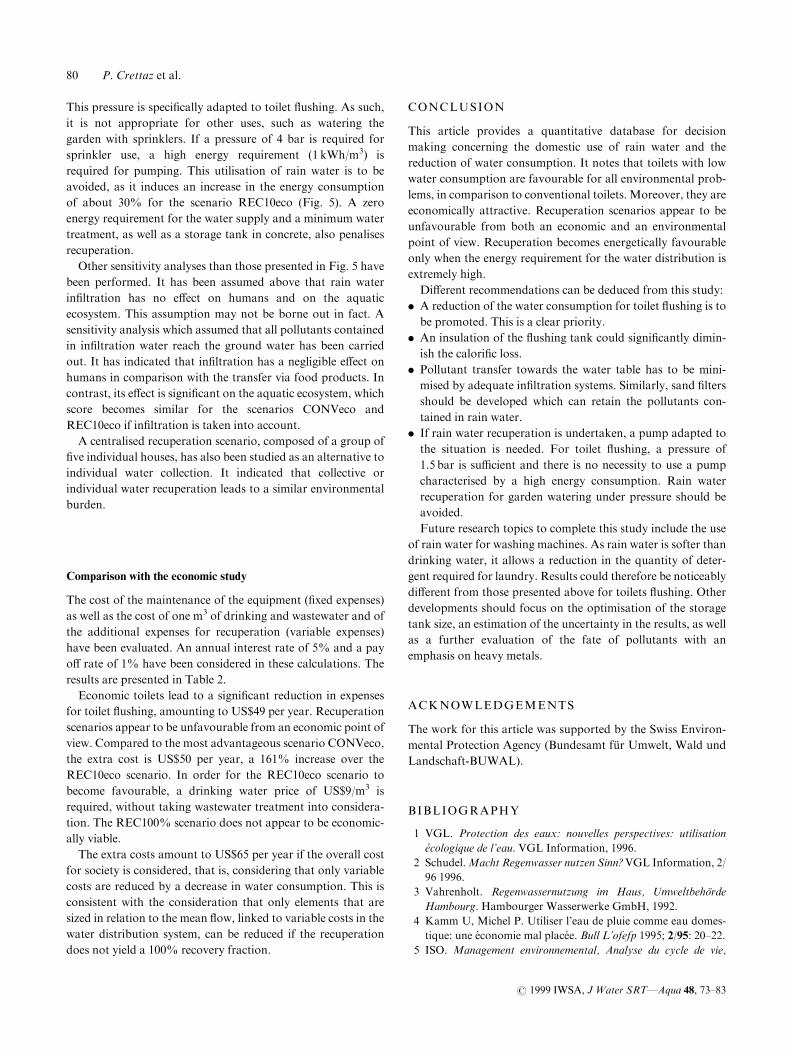
Table 2 Comparison of the pro®tability of the di�erent scenarios
REC10
CONV CONV REC10 REC10 eco REC100%
max eco max eco Society cost max
Installation cost 0 0 11 633 12 700 12 700 2200
Mortgage + paying o� 700 762 762 1318
Maintenance cost 267 293 293 267
Total expenses 965 1055 1055 1585
Number of persons 16 16 16 16 16 16
Total cost per person (®xed cost) 0 0 60 66 66 99
Flushing water consumption (m3) 315 123 315 123 123 315
Flushing water consumption per person (m3/person) 19.7 7.7 19.7 7.7 7.7 19.7
Recovery fraction 0 0 0.57 0.97 0.97 0.57
m3 of recycled water to pump 0 0 11.2 7.5 7.5 11.2
Cost for the pumping electricity $/person-year 0 0 0.16 0.11 0.11 0.16
Drinking water consumption m3/person 19.7 7.7 8.5 0.2 0.2 8.5
Total cost of 1 m3 of drinking water $/m3 2 2 2 2 2 2
Contribution of ®xed cost (90%) 1.8
Contribution of variable cost (10%) 0.2
Cost for drinking water ($/year) 39 15 17 0.5 0.5 17
Cost drinking water, in equivalent ®xed cost 13
Cost for waste water treatment ($/year) 42 17 42 17 17 42
(2.1 $/m3)
Annual total cost ($/pers) 82 32 120 83 96 158
% 256 100 375 260 300 494
Annual extra cost per family of 4 199 0 351 205 258 505
Assessment of drinking water and rain water for toilets ¯ushing 79
# 1999 IWSA, J Water SRTÐAqua 48, 73±83
This pressure is speci®cally adapted to toilet ¯ushing. As such,
it is not appropriate for other uses, such as watering the
garden with sprinklers. If a pressure of 4 bar is required for
sprinkler use, a high energy requirement (1 kWh/m3) is
required for pumping. This utilisation of rain water is to be
avoided, as it induces an increase in the energy consumption
of about 30% for the scenario REC10eco (Fig. 5). A zero
energy requirement for the water supply and a minimum water
treatment, as well as a storage tank in concrete, also penalises
recuperation.
Other sensitivity analyses than those presented in Fig. 5 have
been performed. It has been assumed above that rain water
in®ltration has no e�ect on humans and on the aquatic
ecosystem. This assumption may not be borne out in fact. A
sensitivity analysis which assumed that all pollutants contained
in in®ltration water reach the ground water has been carried
out. It has indicated that in®ltration has a negligible e�ect on
humans in comparison with the transfer via food products. In
contrast, its e�ect is signi®cant on the aquatic ecosystem, which
score becomes similar for the scenarios CONVeco and
REC10eco if in®ltration is taken into account.
A centralised recuperation scenario, composed of a group of
®ve individual houses, has also been studied as an alternative to
individual water collection. It indicated that collective or
individual water recuperation leads to a similar environmental
burden.
Comparison with the economic study
The cost of the maintenance of the equipment (®xed expenses)
as well as the cost of one m3 of drinking and wastewater and of
the additional expenses for recuperation (variable expenses)
have been evaluated. An annual interest rate of 5% and a pay
o� rate of 1% have been considered in these calculations. The
results are presented in Table 2.
Economic toilets lead to a signi®cant reduction in expenses
for toilet ¯ushing, amounting to US$49 per year. Recuperation
scenarios appear to be unfavourable from an economic point of
view. Compared to the most advantageous scenario CONVeco,
the extra cost is US$50 per year, a 161% increase over the
REC10eco scenario. In order for the REC10eco scenario to
become favourable, a drinking water price of US$9/m3 is
required, without taking wastewater treatment into considera-
tion. The REC100% scenario does not appear to be economic-
ally viable.
The extra costs amount to US$65 per year if the overall cost
for society is considered, that is, considering that only variable
costs are reduced by a decrease in water consumption. This is
consistent with the consideration that only elements that are
sized in relation to the mean ¯ow, linked to variable costs in the
water distribution system, can be reduced if the recuperation
does not yield a 100% recovery fraction.
CONCLUSION
This article provides a quantitative database for decision
making concerning the domestic use of rain water and the
reduction of water consumption. It notes that toilets with low
water consumption are favourable for all environmental prob-
lems, in comparison to conventional toilets. Moreover, they are
economically attractive. Recuperation scenarios appear to be
unfavourable from both an economic and an environmental
point of view. Recuperation becomes energetically favourable
only when the energy requirement for the water distribution is
extremely high.
Di�erent recommendations can be deduced from this study:
. A reduction of the water consumption for toilet ¯ushing is to
be promoted. This is a clear priority.
. An insulation of the ¯ushing tank could signi®cantly dimin-
ish the calori®c loss.
. Pollutant transfer towards the water table has to be mini-
mised by adequate in®ltration systems. Similarly, sand ®lters
should be developed which can retain the pollutants con-
tained in rain water.
. If rain water recuperation is undertaken, a pump adapted to
the situation is needed. For toilet ¯ushing, a pressure of
1.5 bar is su�cient and there is no necessity to use a pump
characterised by a high energy consumption. Rain water
recuperation for garden watering under pressure should be
avoided.
Future research topics to complete this study include the use
of rain water for washing machines. As rain water is softer than
drinking water, it allows a reduction in the quantity of deter-
gent required for laundry. Results could therefore be noticeably
di�erent from those presented above for toilets ¯ushing. Other
developments should focus on the optimisation of the storage
tank size, an estimation of the uncertainty in the results, as well
as a further evaluation of the fate of pollutants with an
emphasis on heavy metals.
ACKNOWLEDGEMENTS
The work for this article was supported by the Swiss Environ-
mental Protection Agency (Bundesamt fuÈ r Umwelt, Wald und
Landschaft-BUWAL).
BIBLIOGRAPHY
1 VGL. Protection des eaux: nouvelles perspectives: utilisation
eÂcologique de l'eau. VGL Information, 1996.
2 Schudel.Macht Regenwasser nutzen Sinn?VGL Information, 2/
96 1996.
3 Vahrenholt. Regenwassernutzung im Haus, UmweltbehoÈrde
Hambourg. Hambourger Wasserwerke GmbH, 1992.
4 Kamm U, Michel P. Utiliser l'eau de pluie comme eau domes-
tique: une e conomie mal place e. Bull L'ofefp 1995; 2/95: 20±22.
5 ISO. Management environnemental, Analyse du cycle de vie,
80 P. Crettaz et al.
# 1999 IWSA, J Water SRTÐAqua 48, 73±83
Principes et cadre. Norme internationale ISO/FDIS 14040,
1997.
6 Pelli T, Spreng D, Gujet W, Kamm U, Bonoli F, Nipkow J,
Rosemayr D. L'eÂpargne eÂnergeÂtique dans les services d'approvi-
sionnement en eau. O�ce fe de ral des questions conjoncturelles,
RAVEL, 1996: 100.
7 Frischknecht R, Ho�stetter P, Knoepfel I, Me nard M. koinven-
tare von Energiesystemen. Gruppe Energie-Sto�-Umwelt
ETHZ, Sektion Ganzheitliche Systemanalysen PSI, 1996: 1800.
8 Orlando S, Cuanillon J-M. Avant projet technique: inventaire
des mateÂriaux utiliseÂs, projet CYCLEAUPE. Bureau Inge nieur-
Conseil RWB S.A., 1997.
9 Crettaz P, Jolliet O, Cuanillon J-M, Orlando S. Projet
CYCLAUPE. Analyse du cycle de l'eau et gestion de l'eau
potable et reÂcupeÂration de l'eau pluviale. Information de
l'OFEFP concernant la protection des eaux; en pre paration,
1998.
10 Zimmermann P, Doka G, Huber F, Lahardt A, Me nard M.
koinventare von Entsorgungsprozessen. Grundlagen zur Integra-
tion des Entsorgung in kobilanzen, 1996: 356.
11 Tru�er. Fax du 14.11.97. Sation de traitement des eaux de
Lutry, Commune de Lausanne, direction des services indus-
triels, 1997.
12 Mottier. Qualitative aspects of roof runno�. Eight Junior Work-
shop Urban Rainwater: Resourcefully used; Deventer, Nether-
lands, 22±25 September 1995.
13 SETAC. Guidelines for Life Cycle Assessment: a Code of
Practice. Society of Environmental Toxicology and Chemistry,
Brussels, 1993: 69.
14 Udo De Haes HA. Discussion of general principles and guide-
lines for practical use, published in `Towards a methodology for
Life Cycle Impact Assessment'. Report of the Europe working
group on Life cycle Impact Assessment. With written contribu-
tions from Bovy, Finnveden G, Frischknecht R, Giegrich J,
Guine e JB, Hauschild M, Heijungs R, Hofstetter P, Jensen AA,
Jolliet O, Lindeijer E, MuÈ ller-Wenk R, Nichols Ph, Potting J,
Wenzel Christensen H, White P. SETAC 1996; pp. 1±30.
15 Jolliet O, Crettaz P. Critical surface-time 95, an impact Life
Cycle Assessment methodology including exposure and fate.
Swiss Federal Insitute of Technology, 1997: 79.
16 Heijungs R, Guine e JB, Huppes G, Lankreijer RM, Udo de
Haes HA, Wegener Sleeswijk A, Ansems AMM, Eggels PG,
van Duin R, Goede HP. Environmental Life Cycle Assesment of
products, Background and Guide. Centre for Environmental
Science (CML), NL-2300 RA Leiden, 1992.
17 Guine e, Heijungs Van Oers, Van de Meent, Vermeire Rikken.
LCA impact assessment of toxic release, generic modelling of
fate, exposure and e�ect for ecosystems and human beings with
data for about 100 chemicals. Center of Environmental Science
(CML), NL-2300 RA Leiden, 1996.
APPENDIX 1
Table 3 (overleaf) presents the energy consumption and sub-
stance emissions to air, water and soil, for di�erent drinking
water supply conditions, excluding used and wastewater treat-
ment. The contribution of the infrastructure (pumping and
reservoir) is given separately. Emissions are given for average
Swiss conditions (0.35 kWh/m3 for pumping), both with and
without treatment, as well as for the extremes of the Swiss
conditions (1.5 kWh/m3 for pumping). European and Swiss
electricity supply are distinguished.
Assessment of drinking water and rain water for toilets ¯ushing 81
# 1999 IWSA, J Water SRTÐAqua 48, 73±83
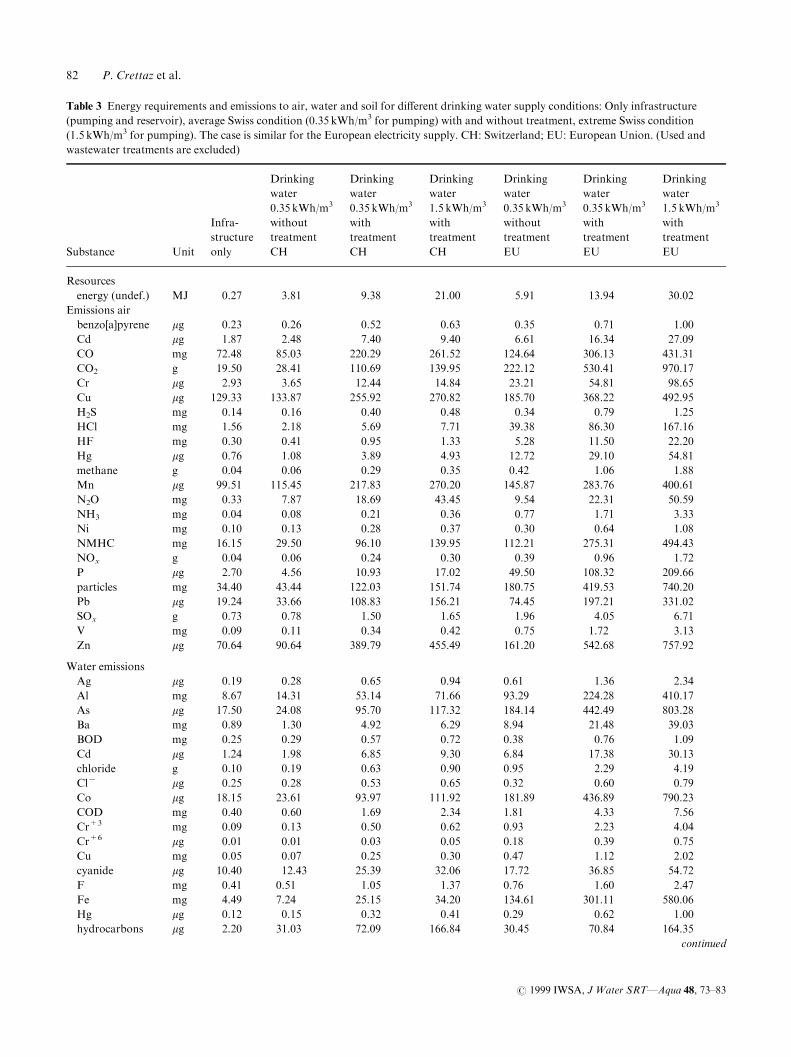
Table 3 Energy requirements and emissions to air, water and soil for di�erent drinking water supply conditions: Only infrastructure
(pumping and reservoir), average Swiss condition (0.35 kWh/m3 for pumping) with and without treatment, extreme Swiss condition
(1.5 kWh/m3 for pumping). The case is similar for the European electricity supply. CH: Switzerland; EU: European Union. (Used and
wastewater treatments are excluded)
Drinking Drinking Drinking Drinking Drinking Drinking
water water water water water water
0.35 kWh/m3 0.35 kWh/m3 1.5 kWh/m3 0.35 kWh/m3 0.35 kWh/m3 1.5 kWh/m3
Infra- without with with without with with
structure treatment treatment treatment treatment treatment treatment
Substance Unit only CH CH CH EU EU EU
Resources
energy (undef.) MJ 0.27 3.81 9.38 21.00 5.91 13.94 30.02
Emissions air
benzo[a]pyrene mg 0.23 0.26 0.52 0.63 0.35 0.71 1.00
Cd mg 1.87 2.48 7.40 9.40 6.61 16.34 27.09
CO mg 72.48 85.03 220.29 261.52 124.64 306.13 431.31
CO2 g 19.50 28.41 110.69 139.95 222.12 530.41 970.17
Cr mg 2.93 3.65 12.44 14.84 23.21 54.81 98.65
Cu mg 129.33 133.87 255.92 270.82 185.70 368.22 492.95
H2S mg 0.14 0.16 0.40 0.48 0.34 0.79 1.25
HCl mg 1.56 2.18 5.69 7.71 39.38 86.30 167.16
HF mg 0.30 0.41 0.95 1.33 5.28 11.50 22.20
Hg mg 0.76 1.08 3.89 4.93 12.72 29.10 54.81
methane g 0.04 0.06 0.29 0.35 0.42 1.06 1.88
Mn mg 99.51 115.45 217.83 270.20 145.87 283.76 400.61
N2O mg 0.33 7.87 18.69 43.45 9.54 22.31 50.59
NH3 mg 0.04 0.08 0.21 0.36 0.77 1.71 3.33
Ni mg 0.10 0.13 0.28 0.37 0.30 0.64 1.08
NMHC mg 16.15 29.50 96.10 139.95 112.21 275.31 494.43
NOx g 0.04 0.06 0.24 0.30 0.39 0.96 1.72
P mg 2.70 4.56 10.93 17.02 49.50 108.32 209.66
particles mg 34.40 43.44 122.03 151.74 180.75 419.53 740.20
Pb mg 19.24 33.66 108.83 156.21 74.45 197.21 331.02
SOx g 0.73 0.78 1.50 1.65 1.96 4.05 6.71
V mg 0.09 0.11 0.34 0.42 0.75 1.72 3.13
Zn mg 70.64 90.64 389.79 455.49 161.20 542.68 757.92
Water emissions
Ag mg 0.19 0.28 0.65 0.94 0.61 1.36 2.34
Al mg 8.67 14.31 53.14 71.66 93.29 224.28 410.17
As mg 17.50 24.08 95.70 117.32 184.14 442.49 803.28
Ba mg 0.89 1.30 4.92 6.29 8.94 21.48 39.03
BOD mg 0.25 0.29 0.57 0.72 0.38 0.76 1.09
Cd mg 1.24 1.98 6.85 9.30 6.84 17.38 30.13
chloride g 0.10 0.19 0.63 0.90 0.95 2.29 4.19
Cl7 mg 0.25 0.28 0.53 0.65 0.32 0.60 0.79
Co mg 18.15 23.61 93.97 111.92 181.89 436.89 790.23
COD mg 0.40 0.60 1.69 2.34 1.81 4.33 7.56
Cr+3 mg 0.09 0.13 0.50 0.62 0.93 2.23 4.04
Cr+6 mg 0.01 0.01 0.03 0.05 0.18 0.39 0.75
Cu mg 0.05 0.07 0.25 0.30 0.47 1.12 2.02
cyanide mg 10.40 12.43 25.39 32.06 17.72 36.85 54.72
F mg 0.41 0.51 1.05 1.37 0.76 1.60 2.47
Fe mg 4.49 7.24 25.15 34.20 134.61 301.11 580.06
Hg mg 0.12 0.15 0.32 0.41 0.29 0.62 1.00
hydrocarbons mg 2.20 31.03 72.09 166.84 30.45 70.84 164.35
continued
82 P. Crettaz et al.
# 1999 IWSA, J Water SRTÐAqua 48, 73±83
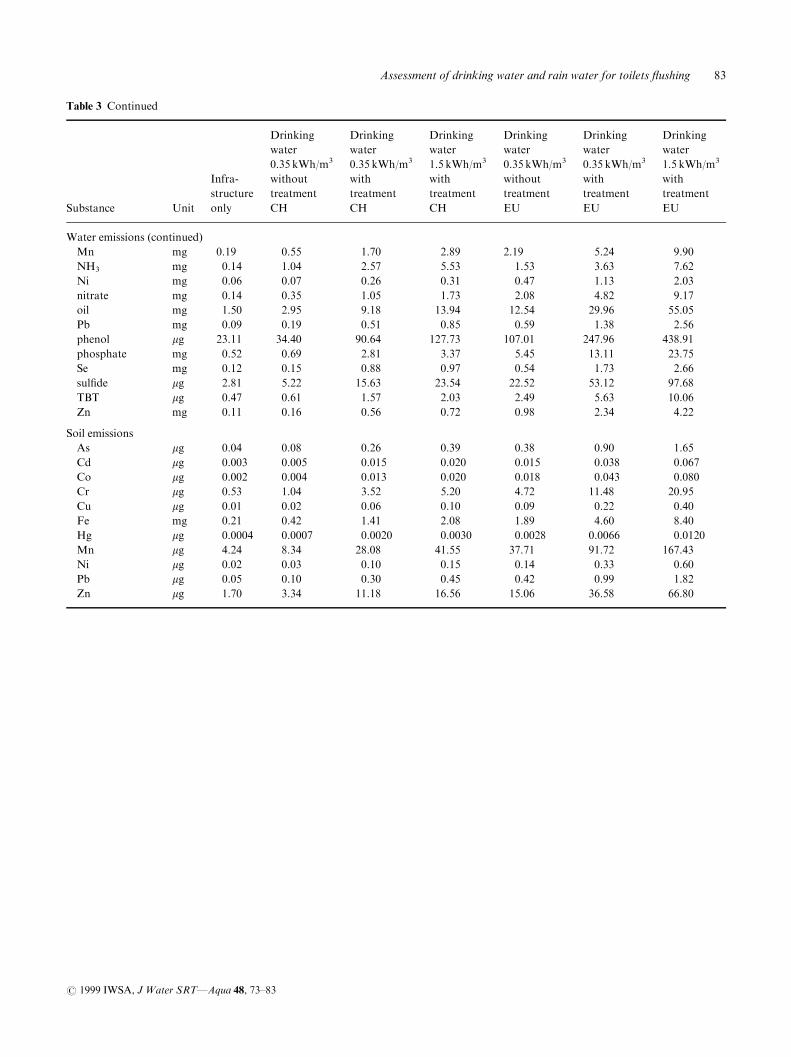
Table 3 Continued
Drinking Drinking Drinking Drinking Drinking Drinking
water water water water water water
0.35 kWh/m3 0.35 kWh/m3 1.5 kWh/m3 0.35 kWh/m3 0.35 kWh/m3 1.5 kWh/m3
Infra- without with with without with with
structure treatment treatment treatment treatment treatment treatment
Substance Unit only CH CH CH EU EU EU
Water emissions (continued)
Mn mg 0.19 0.55 1.70 2.89 2.19 5.24 9.90
NH3 mg 0.14 1.04 2.57 5.53 1.53 3.63 7.62
Ni mg 0.06 0.07 0.26 0.31 0.47 1.13 2.03
nitrate mg 0.14 0.35 1.05 1.73 2.08 4.82 9.17
oil mg 1.50 2.95 9.18 13.94 12.54 29.96 55.05
Pb mg 0.09 0.19 0.51 0.85 0.59 1.38 2.56
phenol mg 23.11 34.40 90.64 127.73 107.01 247.96 438.91
phosphate mg 0.52 0.69 2.81 3.37 5.45 13.11 23.75
Se mg 0.12 0.15 0.88 0.97 0.54 1.73 2.66
sul®de mg 2.81 5.22 15.63 23.54 22.52 53.12 97.68
TBT mg 0.47 0.61 1.57 2.03 2.49 5.63 10.06
Zn mg 0.11 0.16 0.56 0.72 0.98 2.34 4.22
Soil emissions
As mg 0.04 0.08 0.26 0.39 0.38 0.90 1.65
Cd mg 0.003 0.005 0.015 0.020 0.015 0.038 0.067
Co mg 0.002 0.004 0.013 0.020 0.018 0.043 0.080
Cr mg 0.53 1.04 3.52 5.20 4.72 11.48 20.95
Cu mg 0.01 0.02 0.06 0.10 0.09 0.22 0.40
Fe mg 0.21 0.42 1.41 2.08 1.89 4.60 8.40
Hg mg 0.0004 0.0007 0.0020 0.0030 0.0028 0.0066 0.0120
Mn mg 4.24 8.34 28.08 41.55 37.71 91.72 167.43
Ni mg 0.02 0.03 0.10 0.15 0.14 0.33 0.60
Pb mg 0.05 0.10 0.30 0.45 0.42 0.99 1.82
Zn mg 1.70 3.34 11.18 16.56 15.06 36.58 66.80
Assessment of drinking water and rain water for toilets ¯ushing 83
# 1999 IWSA, J Water SRTÐAqua 48, 73±83