Embed Size (px)
Citation preview

Linking Services Turnover/Output and Prices to the National
Macroeconomic Framework
Session Leader: Mary Beth Garneau Statistics Canada

Session Overview § Highlights from VG 2008 presentation by Matt Berger – Mary Beth
Garneau § Linking Services Turnover/Output Prices to the National
Macroeconomic Framework– Alain Gallais § Beyond the National Accounts – other important uses for the data
Jakob Kalko § Eurostat Task Force of an Index of Services Production – Dorothee
Blang § Services Statistics in New Zealand § Discussion of Country Issues
2013-10-02 Statistics Canada 2
National accounts & measurement of constant price output of the service sector
Based on slides from the 2008 presentation by Matt Berger at the 23rd Voorburg Group, Aguascalientes, Mexico Updates by Mary Beth Garneau with special thanks to Joumana Harfouche, Andreas Trau and Robert Campbell of the Canadian SNA
2013-10-02 Statistics Canada 3
Statistics Canada 4
NA prefer SPPIs for deflation § Deflation of output by SPPI is the preferred
approach of NSOs • SPPIs measure prices at constant quality
• Changes in resulting constant price output measures
are changes in volumes
2013-10-02
Statistics Canada 5
SPPIs used for other purposes § SPPIs also have uses beyond output of the
service sector • Adopted in some circumstances in compilation of the
expenditure approach
§ SPPIs not generally used for non-market outputs
§ SPPIs enable the study of the evolution of price dynamics
2013-10-02
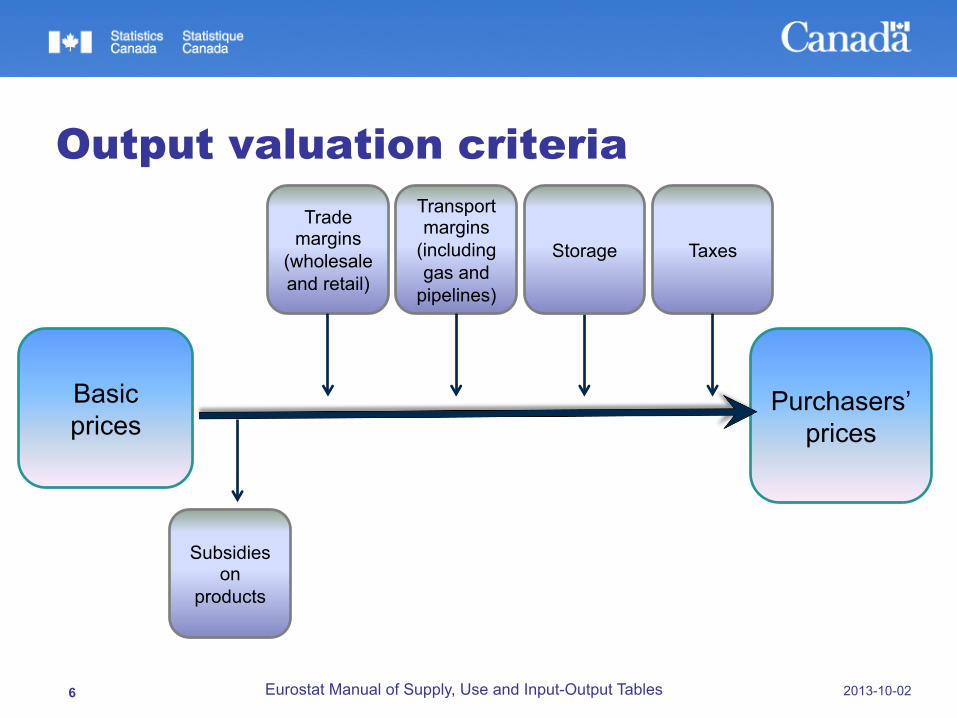
Output valuation criteria
2013-10-02 Eurostat Manual of Supply, Use and Input-Output Tables 6
Taxes
Trade margins
(wholesale and retail)
Transport margins
(including gas and
pipelines)
Subsidies on
products
Basic prices
Purchasers’ prices
Storage
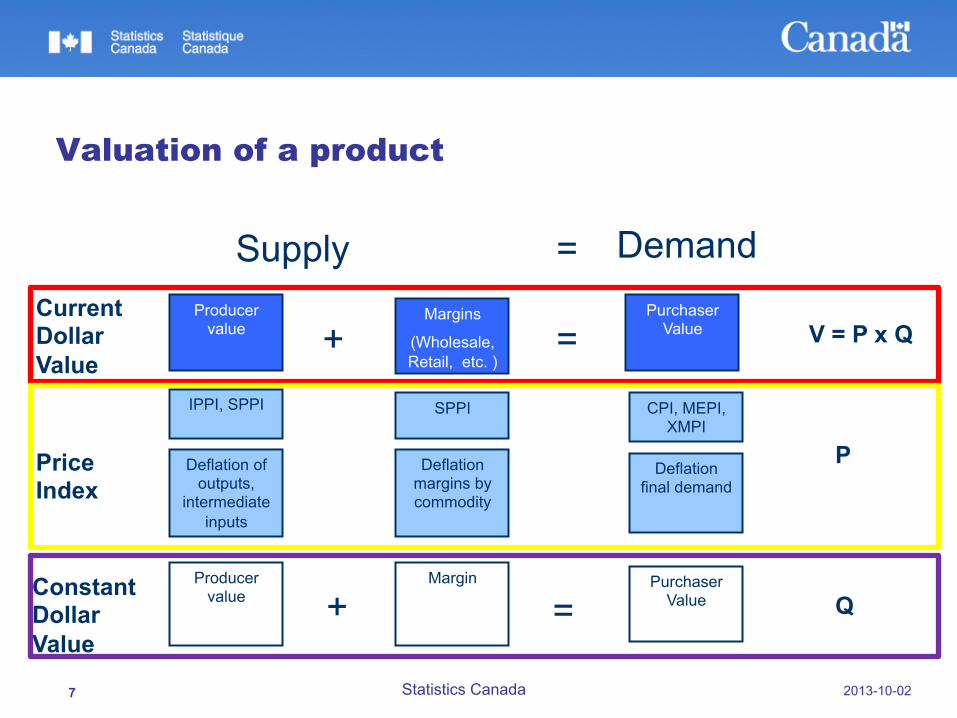
Valuation of a product
2013-10-02 7
IPPI, SPPI
Deflation of outputs,
intermediate inputs
Margins
(Wholesale, Retail, etc. )
Purchaser Value
Deflation margins by commodity
Deflation final demand
Producer value
Current Dollar Value
+ =
Price Index
SPPI CPI, MEPI, XMPI
Supply = Demand
Producer value
Margin
Purchaser Value
Constant Dollar Value
+ =
V = P x Q
P
Q
Statistics Canada
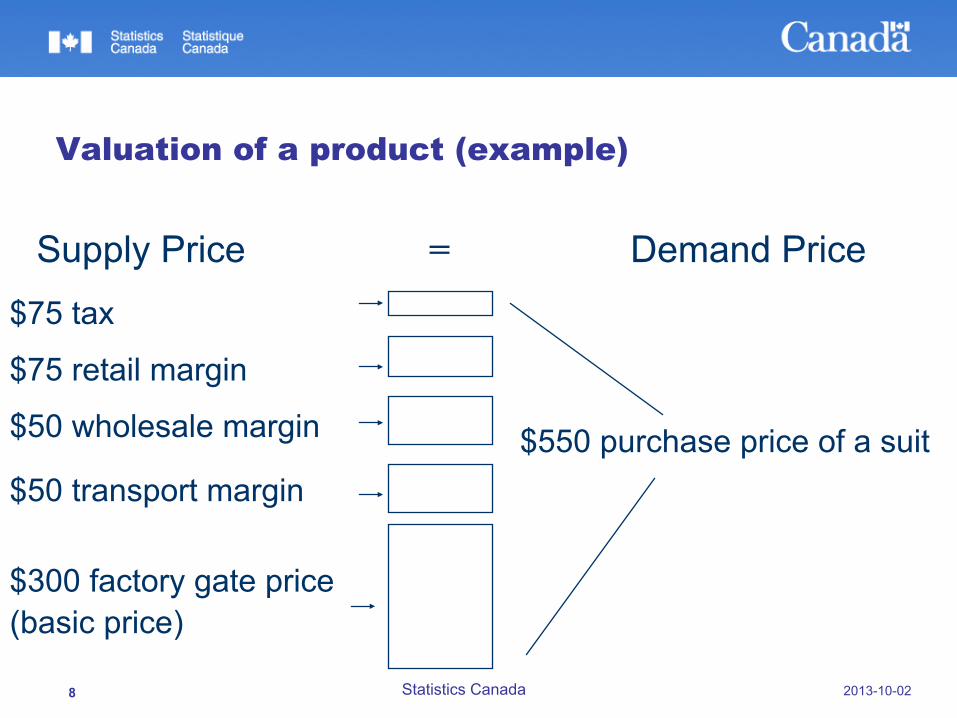
Valuation of a product (example)
2013-10-02 8
$300 factory gate price
$50 transport margin
$75 retail margin
$550 purchase price of a suit $50 wholesale margin
(basic price)
$75 tax
Supply Price Demand Price =
Statistics Canada
Statistics Canada 9
Output § All domestic output
• Not just business-to-business
• Not just sales to domestic customers
2013-10-02
Statistics Canada 10
Double deflation § Production approach uses double deflation
• Outputs measured to constant price
• Inputs measured to constant price
• Constant price value added equals Constant price outputs less Constant price inputs
2013-10-02
Statistics Canada 11
Product based SPPIs § National accountants require a product focus for
SPPIs • Industry SPPIs are not satisfactory (in general)
2013-10-02
Statistics Canada 12
When SPPIs are not available … § In the absence of suitable SPPIs, national accountants
• Use nearest CPI (where applicable)
• Construct output measures based on input costs
• Use “nearest” PPI’s (for distributive trade)
§ Reluctant solution (for the production approach)
• Not priced to constant quality or on correct pricing basis • Using inputs for outputs is a concern when using the value added
approach to GDP
2013-10-02
Statistics Canada 13
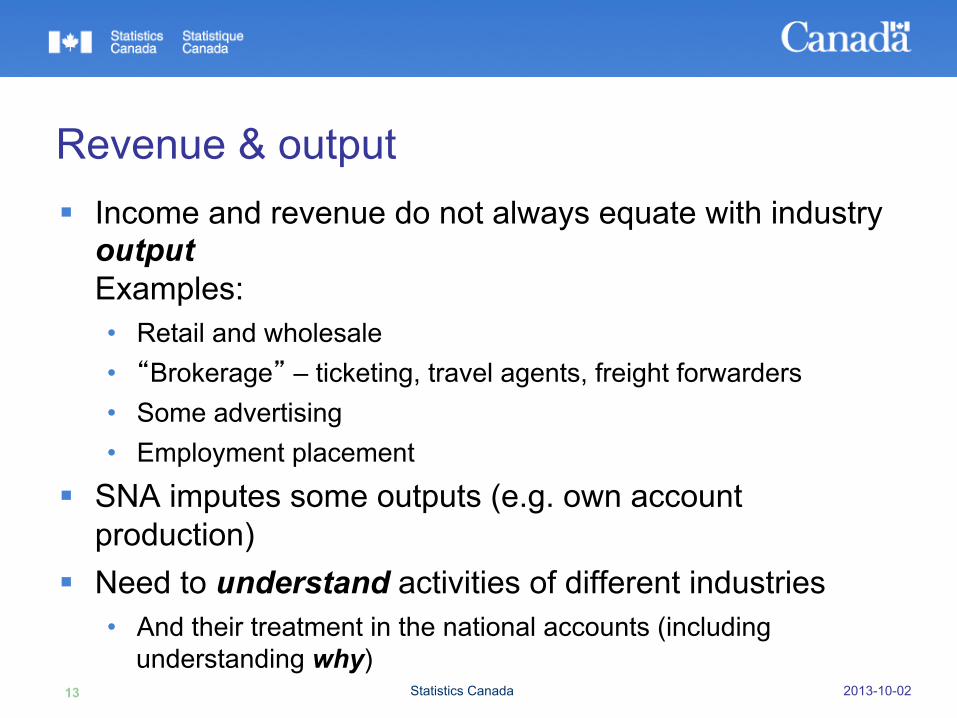
Revenue & output § Income and revenue do not always equate with industry
output Examples: • Retail and wholesale • “Brokerage” – ticketing, travel agents, freight forwarders • Some advertising • Employment placement
§ SNA imputes some outputs (e.g. own account production)
§ Need to understand activities of different industries • And their treatment in the national accounts (including
understanding why) 2013-10-02
Statistics Canada 14
Supply Use Framework § Key tool in the compilation of the national
accounts
§ Shows flows of goods & services • From different types of producers … • … through different types of intermediate use … • … to final demand
2013-10-02
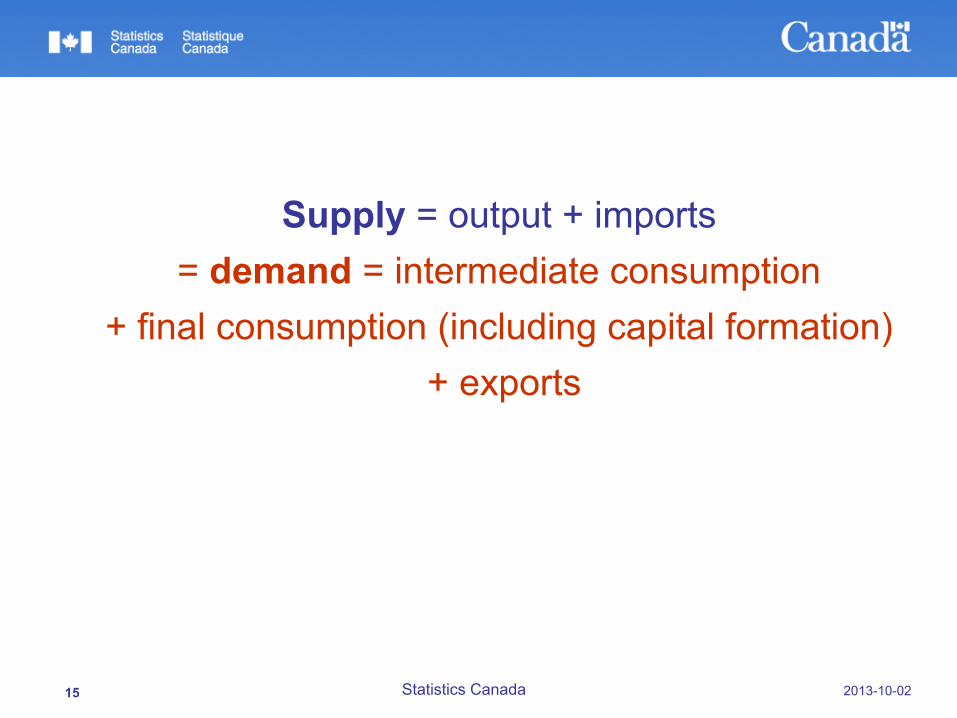
Supply = output + imports = demand = intermediate consumption
+ final consumption (including capital formation) + exports
2013-10-02 Statistics Canada 15
2013-10-02 Statistics Canada 16
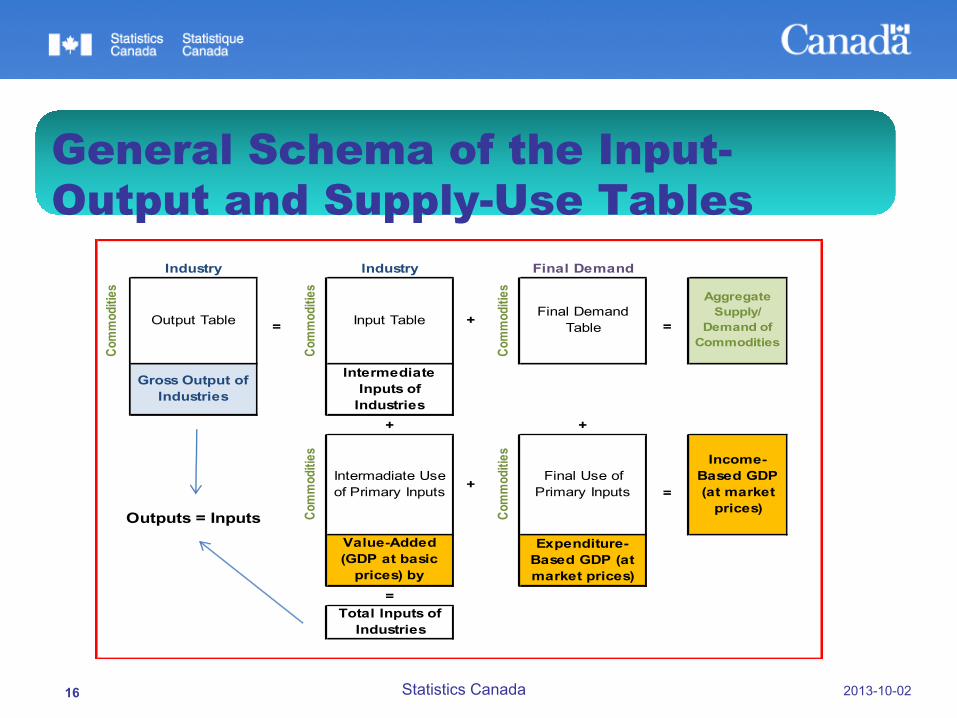
General Schema of the Input-Output and Supply-Use Tables
Industry Industry Final Demand
= + =
+ +
+ =
Outputs = Inputs
=
Value-Added (GDP at basic
prices) by Industry
Expenditure-Based GDP (at market prices)
Total Inputs of Industries
Aggregate Supply/
Demand of Commodities
Gross Output of Industries
Intermediate Inputs of
Industries
Com
mod
ities
Intermadiate Use of Primary Inputs
Com
mod
ities
Final Use of Primary Inputs
Income-Based GDP (at market
prices)
Final Demand Table
Com
mod
ities
Output Table Co
mm
oditie
sInput Table
Com
mod
ities
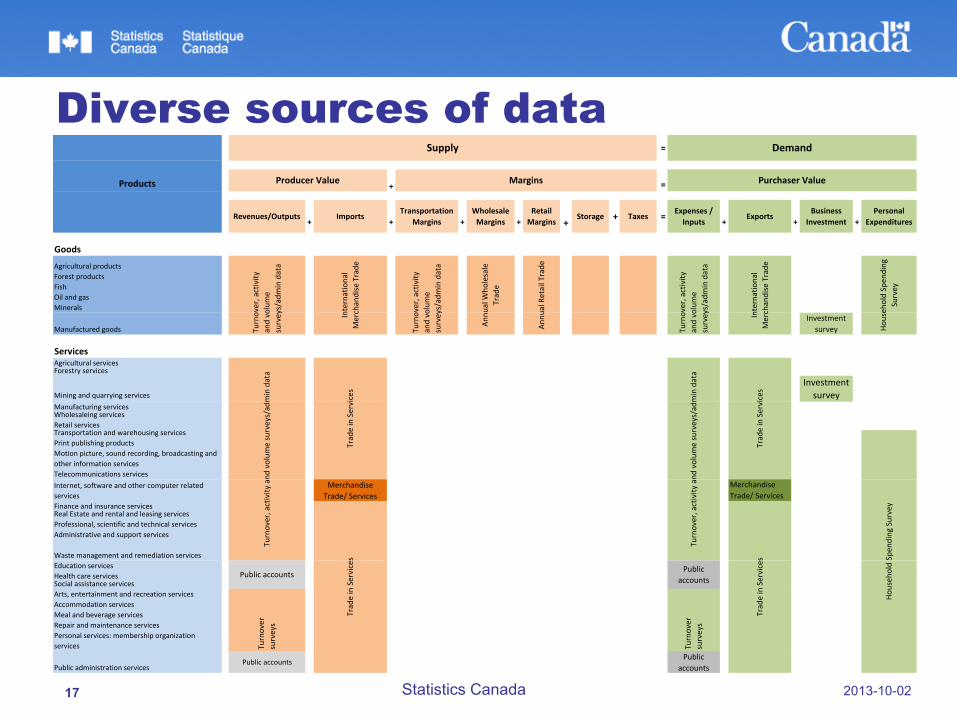
Diverse sources of data
2013-10-02 Statistics Canada 17
=
+ =
Revenues/Outputs +
Imports +
Transportation Margins
+
Wholesale Margins
+
Retail Margins
+
Storage + Taxes = Expenses / Inputs
+
Exports +
Business Investment
+
Personal Expenditures
Goods
Agricultural productsForest productsFishOil and gasMinerals
Manufactured goodsInvestment survey
ServicesAgricultural servicesForestry services
Mining and quarrying servicesInvestment survey
Manufacturing servicesWholesaleing servicesRetail servicesTransportation and warehousing servicesPrint publishing productsMotion picture, sound recording, broadcasting and other information servicesTelecommunications servicesInternet, software and other computer related services
Merchandise Trade/ Services
Merchandise Trade/ Services
Finance and insurance servicesReal Estate and rental and leasing servicesProfessional, scientific and technical servicesAdministrative and support services
Waste management and remediation servicesEducation servicesHealth care servicesSocial assistance servicesArts, entertainment and recreation servicesAccommodation servicesMeal and beverage servicesRepair and maintenance servicesPersonal services: membership organization services
Public administration servicesPublic accounts
Public accounts
Products
Public accounts
International
Merchandise Trade
Trade in Services
Trade in Services
Turnover, activity
and volume
surveys/admin data
Turnover, activity
and
volum
e surveys/admin data
Turnover
surveys
Supply
Househ
old Spen
ding Survey
Trade in Services
Trade in Services
Annu
al W
holesale
Trade
Househ
old Spen
ding
Survey
International
Merchandise Trade
Annu
al Retail Trade
Turnover, activity
and volume
surveys/admin data
Turnover, activity
and
volum
e surveys/admin data
Public accounts
Turnover
surveys
Purchaser Value
Demand
Producer Value
Turnover, activity
and volume
surveys/admin data
Margins
2013-10-02 Statistics Canada 18
Challenges SNA faces with source data
• Converting enterprise-based data into establishment-based data • Converting activity-based data into establishment-based data
e.g. publishing as an activity is much broader than publishing as an output of the publishing industry
• The treatment of ancillary units such as head offices and warehouses
Canadian System of National Accounts § Canadian Supply-Use tables provide the estimates
required to calculate GDP according to each of the three methods by calculating • the valued added by industry: • the flow of goods to final demand sectors (the GDP by
expenditure method) • the cost to industries of the primary inputs (the GDP by income
method)
§ Output and intermediate consumption are estimated at a detailed industry level (NAICS) which is used to benchmark other calculations of GDP
2013-10-02 Statistics Canada 19
Canadian System of National Accounts § Supply-Use Accounts § GDP by Income and Expenditure Accounts
(benchmarked to Supply-Use Accounts) • National data published quarterly • Provincial/territorial data published annually
§ Monthly Real GDP by industry (National level) • Calculated by projecting the relationship between real gross
output and real value-added ( Assumes that the volume of value added generated from a given volume of output for a specific industry is generally constant over short periods of time)
• Uses indicators of real output, employment or real input to project the relationship between these characteristics and value added, as determined from the deflated Input-Output tables
2013-10-02 Statistics Canada 20