Embed Size (px)
Citation preview

Department of Statistics and Information Management
Linking Trade and Business Statistics in India:
Compilation of Foreign Affiliates Trade Statistics (FATS)
Regional Seminar on International Trade Statistics
Nov 3–6, 2014
New Delhi

Department of Statistics and Information Management
Information on Foreign Technical / Financial
Collaboration of Indian Companies
The Reserve Bank of India instituted the Survey on Foreign
Collaboration in Indian Industry (FCS) in 1965, with the object of
collecting information on the operations of Indian companies having
foreign participation in equity capital and technical collaboration with
foreign companies.
With more details on foreign liabilities / assets for Direct investment
companies being collected in the modified Annual Return on
Foreign Liabilities and Assets (FLA) on census basis, FCS now
focuses on getting details of technical collaboration with foreign
companies.
Department of Statistics and Information Management
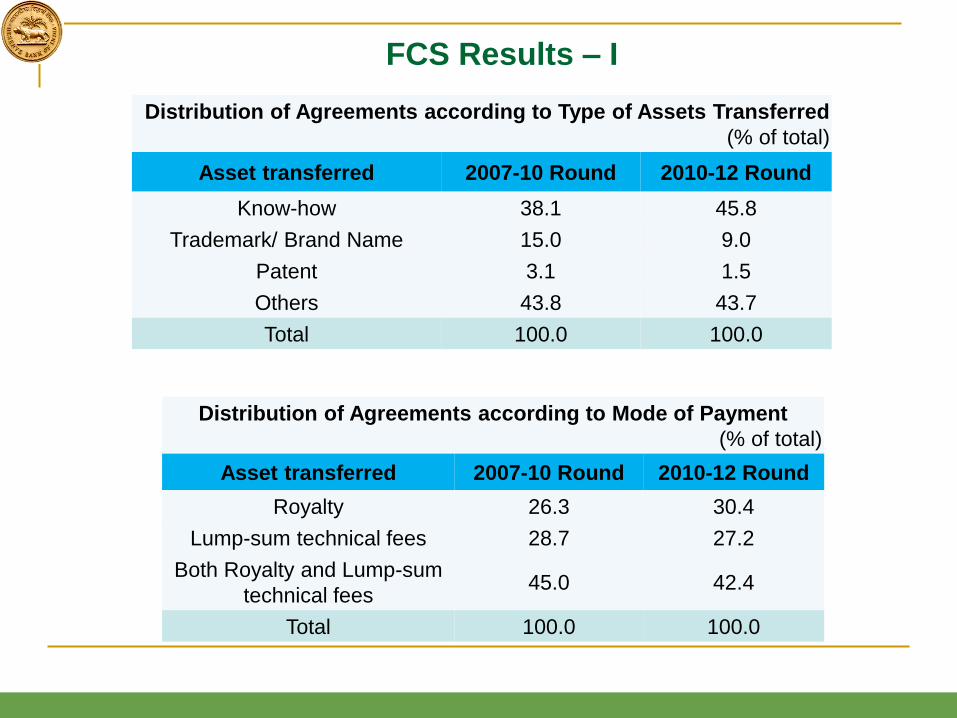
Distribution of Agreements according to Type of Assets Transferred
(% of total)
Asset transferred 2007-10 Round 2010-12 Round
Know-how 38.1 45.8
Trademark/ Brand Name 15.0 9.0
Patent 3.1 1.5
Others 43.8 43.7
Total 100.0 100.0
Distribution of Agreements according to Mode of Payment
(% of total)
Asset transferred 2007-10 Round 2010-12 Round
Royalty 26.3 30.4
Lump-sum technical fees 28.7 27.2
Both Royalty and Lump-sum
technical fees 45.0 42.4
Total 100.0 100.0
FCS Results – I

Department of Statistics and Information Management
% of Agreements with Export Restrictive Clauses
A. Agriculture-related, Plantations & Allied activities 0.0
B. Mining and quarrying -
C. Manufacturing 35.9
D. Electricity, gas, steam and air conditioning supply 0.0
E. Water supply; sewerage, waste mgt. & remediation activities 0.0
F. Construction 20.0
G. Services 7.8
Total 27.5
Profitability Ratio of FTC Companies
Year Average Profitability Ratio
(gross profit to the capital %)
2007-2010 round 11.3
2010-2012 round 10.0
FCS Results – II
Department of Statistics and Information Management
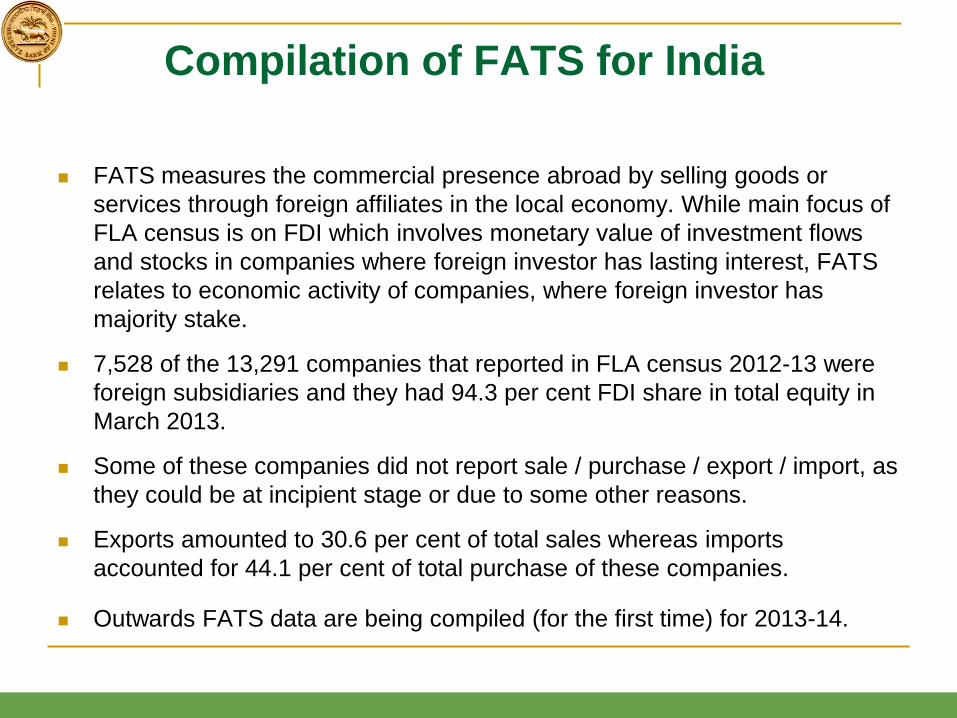
Compilation of FATS for India
FATS measures the commercial presence abroad by selling goods or
services through foreign affiliates in the local economy. While main focus of
FLA census is on FDI which involves monetary value of investment flows
and stocks in companies where foreign investor has lasting interest, FATS
relates to economic activity of companies, where foreign investor has
majority stake.
7,528 of the 13,291 companies that reported in FLA census 2012-13 were
foreign subsidiaries and they had 94.3 per cent FDI share in total equity in
March 2013.
Some of these companies did not report sale / purchase / export / import, as
they could be at incipient stage or due to some other reasons.
Exports amounted to 30.6 per cent of total sales whereas imports
accounted for 44.1 per cent of total purchase of these companies.
Outwards FATS data are being compiled (for the first time) for 2013-14.
Department of Statistics and Information Management
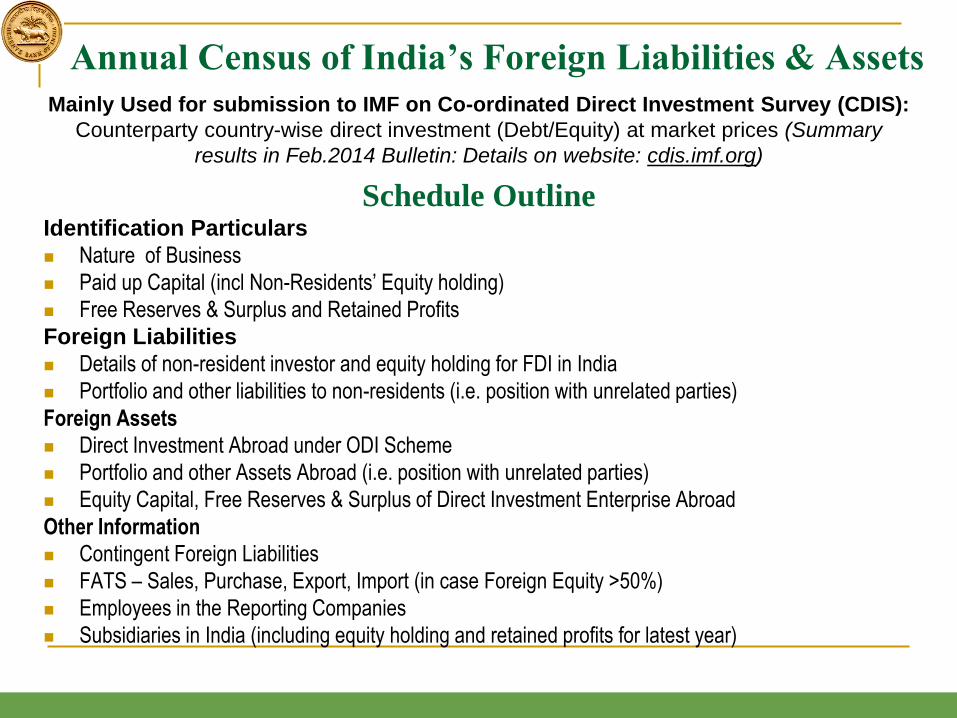
Annual Census of India’s Foreign Liabilities & Assets
Mainly Used for submission to IMF on Co-ordinated Direct Investment Survey (CDIS):
Counterparty country-wise direct investment (Debt/Equity) at market prices (Summary
results in Feb.2014 Bulletin: Details on website: cdis.imf.org)
Schedule Outline Identification Particulars
Nature of Business
Paid up Capital (incl Non-Residents’ Equity holding)
Free Reserves & Surplus and Retained Profits
Foreign Liabilities
Details of non-resident investor and equity holding for FDI in India
Portfolio and other liabilities to non-residents (i.e. position with unrelated parties)
Foreign Assets
Direct Investment Abroad under ODI Scheme
Portfolio and other Assets Abroad (i.e. position with unrelated parties)
Equity Capital, Free Reserves & Surplus of Direct Investment Enterprise Abroad
Other Information
Contingent Foreign Liabilities
FATS – Sales, Purchase, Export, Import (in case Foreign Equity >50%)
Employees in the Reporting Companies
Subsidiaries in India (including equity holding and retained profits for latest year)

Department of Statistics and Information Management
Information Collected on FATS in FLA
Inwards FATS
(To be filled in by company where single foreign direct investor holding is more than 50% in total equity (i.e. if reporting
Indian company is subsidiary of foreign company).
Item Amount
Previous Year Latest Year
1 Domestic Sales
2 Exports
3 Total Sales (= 1+ 2)
4 Domestic purchases
5 Imports
6 Total Purchases (= 4 + 5)
-------------------------------------------------------------------------------------------------------------------------------------------------------------
Outward FATS
(Imports, Exports, Total Sales and Total Purchase of Direct Investment Enterprise (DIE) Abroad (more than 50% equity
holding by Indian reporting company): Amount to be provided in foreign currency
Name of the DIE Item Currency Amount in Foreign Currency actual (During the year)
Previous Year Latest Year
1 Total Sales
1.1 of which Exports
2 Total Purchases
2.1 of which Imports

Department of Statistics and Information Management
Activity-wise Sales of 7,528 Subsidiary Companies of the 13,291 companies with Inward FDI Amount in ₹ billion
Activity No. of
Companies
Sales % Share in Total
(2012-13) 2011-12 2012-13
A. Agriculture-related, Plantations & Allied activities 20 35.3 43.7 0.5
B. Mining 34 129.7 148.3 1.3
C. Manufacturing 1,762 6,123.2 7,307.7 63.7
D. Electricity, gas, steam and air conditioning supply 56 62.7 72.0 0.6
E. Water supply; sewerage, waste management & remediation activities 30 7.8 9.9 0.1
F. Construction 150 217.4 223.1 2.0
G. Services 4,092 3,030.1 3,659.2 31.9
Total 6,144* 9,606.2 11,463.9 100.0
SERVICES SECTOR No. of
Companies
% Share in
Total
1.Wholesale and retail trade; repair of motor
vehicles and motorcycles 641 8.3
2.Transportation and storage 139 1.3
3.Accommodation and Food service activities 80 0.2
4.Information and communication 1,548 16.8
5.Financial and insurance activities 238 1.1
6.Real estate activities 31 0.1
7.Other Services activities 1,415 4.1
INDUSTRY No. of
Companies
% Share in
Total
1. Food products 72 3.5
2. Beverages 10 0.9
3.Tobacco products 0 0.0
4. Textiles 26 0.3
5. Wearing Apparel 13 0.1
6. Leather and related products 5 0.2
7. Wood and wood products, except furniture;
manufacture of articles of straw and plaiting materials 5 0.0
8. Manufacture of paper and paper products 16 0.5
9. Printing and reproduction of recorded media 6 0.0
10.Coke and refined petroleum products 9 8.1
11.Chemicals and chemical products 134 3.4
12. Pharmaceuticals, medicinal and chemical products 96 2.4
13.Rrubber and plastics products 72 0.9
14.Other non-metallic mineral products 22 1.0
15.Basic metals 21 2.8
16. Fabricated metal products, except machinery and
equipment 58 0.2
17.Computer, electronic and optical products 48 7.0
18. Electrical equipment 119 4.2
19.Machinery and equipment n.e.c. 299 4.1
20. Other manufacturing 731 24.1
* Of the 13,291 companies, 7528 companies were
subsidiary companies, of which 6,144 reported sales

Department of Statistics and Information Management
0
2,000
4,000
6,000
8,000
10,000
12,000
14,000
Exports Imports Sales Purchase
India’s FATS Statistics (Rs. Billion)
2011-12
2012-13

Department of Statistics and Information Management
23
18.3
48 11.9
6.7
14.6
36.3
Sector-wise Imports of India (per cent)
Agriculture-related, Plantations &Allied activities
Mining
Manufacturing
Electricity, gas, steam and airconditioning supply
Water supply; sewerage, wastemanagement and remediationactivitiesConstruction
Department of Statistics and Information Management
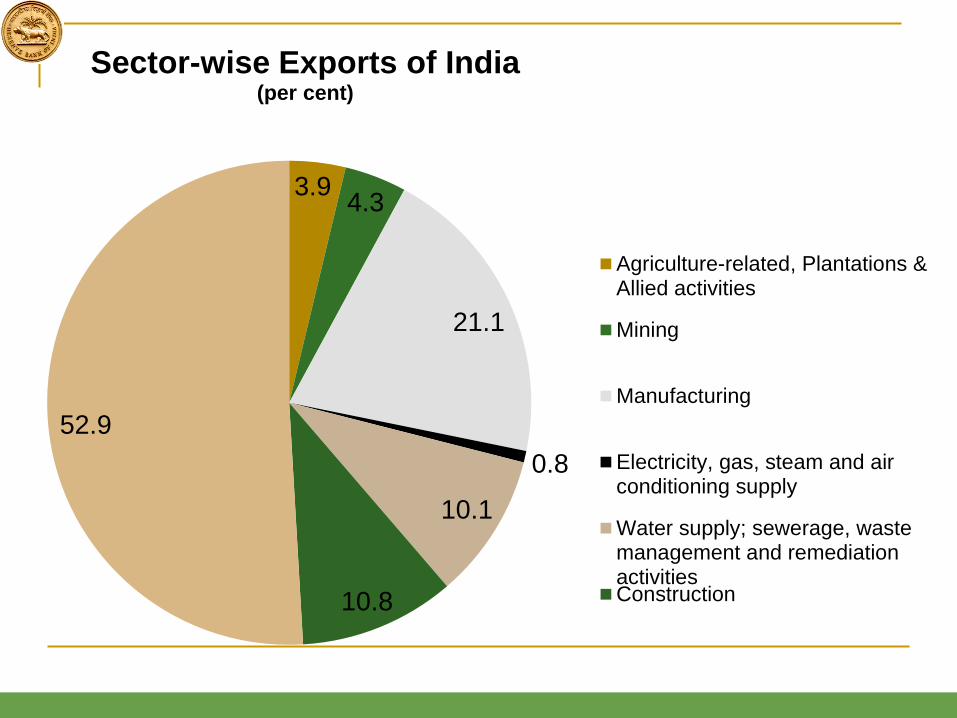
3.9 4.3
21.1
0.8
10.1
10.8
52.9
Sector-wise Exports of India (per cent)
Agriculture-related, Plantations &Allied activities
Mining
Manufacturing
Electricity, gas, steam and airconditioning supply
Water supply; sewerage, wastemanagement and remediationactivitiesConstruction

Department of Statistics and Information Management
Activity-wise Export and Import of 7,528 Subsidiary Companies during 2012-13
Activity
Amount (₹ billion) Share (per cent)
Export Import Export in
Sales
Import in
Purchase
A. Agriculture-related, Plantations & Allied activities 1.7 6.3 3.9 23
B. Mining 6.4 16.6 4.3 18.3
C. Manufacturing 1,539.6 2,642.70 21.1 48.0
of which:
Food products 80.2 63.1 20.0 23.5
Coke and refined petroleum products 312.3 706.5 33.5 79.1
Chemicals and chemical products 84.9 115.3 21.6 51.3
Pharmaceuticals, medicinal and chemical products 91.5 82.3 33.4 52.5
Basic metals 39.8 186.4 12.4 52.7
Computer, electronic and optical products 190.1 492 23.8 79.4
Electrical equipment 90.4 146.9 18.7 38.8
Machinery and equipment n.e.c. 115.9 97.9 24.8 33.2
D. Electricity, gas, steam and air conditioning supply 0.6 6.3 0.8 11.9
E. Water supply, sewerage, waste mgt. and remediation activities 1.0 0.3 10.1 6.7
F. Construction 24.1 18.5 10.8 14.6
G. Services 1,936.1 625.3 52.9 36.3
of which:
Wholesale and retail trade; repair of motor vehicles & motorcycles 116.6 395.2 12.3 47
Transportation and storage 50.7 19.5 33.8 25.9
Information and communication 1510 160.5 78.6 30.6
Financial and insurance activities 61.1 5.0 47 11.5
Total 3,509.50 3,316.00 30.6 44.1
* Of the 7,528 subsidiary companies, 4,470 reported export.

Department of Statistics and Information Management
Integrated Economic Statistics
Trade Statistics • Trade figures, e.g. geographic location, goods
for trading, mode of trading, trading partner
Business Statistics
• Business characteristics such as size, employment, economic activities
FATS Statistics • FATS data from foreign subsidiaries on inward
and outward activity of foreign affiliates, for measuring commercial presence
Better information base to aid analysis of
cross-border economic activity.

Department of Statistics and Information Management