Embed Size (px)
Citation preview
Local Government Border Congruence and the Fiscal Commons: Evidence from Ohio School Districts*
Joshua C. Hall
Associate Professor of Economics Faculty Research Associate, Regional Research Institute
West Virginia University Morgantown, WV 26506 [email protected]
Abstract
School district and municipal borders do not always align. Non-congruent borders can create a fiscal commons problem where new development does not entirely “pay its way.” In response, frustrated citizens often respond by voting for lower school spending. Using GIS data on Ohio school districts, the degree of non-congruence between school district and municipal territory is calculated. The results indicate that school districts with non-congruent borders generate less revenue from local sources and that these effects seem to increase with the degree of non-congruence. The findings are robust between OLS and treatment effects regression.
Running Head: Local Government Border Congruence and the Fiscal Commons
JEL Codes: I210, I280, R120
Keywords: congruency; public education; polycentrism
* An earlier version of this paper with Justin Ross circulated as “The Effect of Non-Congruent School Borders on Class Sizes and Local Revenue: Evidence from Ohio.” The author would like to thank him for his numerous conversations about this topic over the years and his assistance on the earlier draft. In addition, he would like to thank participants at the Workshop in Political Theory and Policy Analysis at Indiana University, where the early version of this paper was presented.
1
Local Government Border Congruence and the Fiscal Commons: Evidence from Ohio School Districts
1. Introduction
There exists a rich literature studying the normative and positive implications of overlapping
jurisdictional boundaries of public governance structures in economics, political science,
regional science, and public administration (Isard, 1956; Ostrom et al., 1961; Turnbull and
Djoundourian, 1994; Oates, 1999; Feiock, 2007). In the United States, one of the most prolific
examples of overlapping jurisdictions at the same hierarchical level is found in the separation of
local government borders from those of the school district (Campbell et al., 1965). In his 2009
book on the economic evolution of American school districts, Fischel estimates that less than
one-quarter of all U.S. cities over 50,000 in population had borders congruent with a local school
district.
An important implication of noncongruence is that each local government and school
district will have a different median voter.1 If the policies of municipalities had no spillovers on
school districts then this would not be problematic. However, the actions of municipalities affect
school districts by shaping the structure and composition of residential and commercial
development (Fischel, 2001). Different median voters creates a potential moral hazard problem
as the median voter in a noncongruent municipality does not face the full fiscal cost of zoning
decisions.2
1 The median voter model is the workhorse empirical model employed to explain government behavior at the local level (Turnbull and Mitias, 1999; Turnbull and Djoundourian, 1994). 2 An expanded description and graphic model of why the median voter in the zoning authority does not face the full fiscal cost of zoning decisions can be found in Ross et al. (2014).
2
To illustrate the potential problem, consider the decision to rezone a parcel of agricultural
land for residential purposes. In the case where municipal borders were congruent with the local
school district, the median voter would balance the fiscal benefits of additional development
against the fiscal costs—including higher school district expenditures associated with the new
development. With border congruency, the median voter has the incentive to consider all the
costs associated with zoning decisions, including higher school district expenditures. Should the
parcel of agricultural land lie in a city that shares a school district with seven other
municipalities, however, the median voter will continue to factor in all the benefits of rezoning
residential but face only a fraction (one-seventh) of the cost of educating the children that will
live in the new development.
While school district-municipality border noncongruence implies increased total school
district spending due to the incentive to “overzone” residential, the implications on spending per
pupil are less clear. This is especially true in states like Ohio where nearly half of school district
spending comes from local sources.3 In Ohio, increased local revenue to schools is not automatic
when population or property values increase as local revenue increases must be voted on by
residents of the school district. Individuals unhappy with higher school costs due to rampant
development in a neighboring municipality with which they share a school district have the
ability to reject additional local spending on schools by voting down school levies for new
school construction and ongoing spending. A May 2003 editorial by the Columbus Dispatch on
the Pickerington (OH) school district provides direct evidence of such punishment in action. A
portion of the city of Columbus lies with the Pickerington School District, which is also
comprised of portions of several smaller governments. From 1990 to 2000, the number of
3 Ohio is one of only two states that let school districts levy an income tax in addition to the property tax (Hall and Ross, 2010).
3
Columbus residents in Pickerington schools grew tenfold due to rapid residential development
resulting from high-density zoning in the Columbus portion of Pickerington School District. In
response, the voters of the Pickerington School District rejected multiple school levies that
would have increased spending and helped to relieve school overcrowding.
In this article I investigate the impact of congruency between municipality and school
district borders on local revenue generation. My reasoning for choosing local revenue per capita
is straightforward following from the Pickerington example. In that case non-congruency led to
local voters rejecting additional local revenues for schools, which combined with increased
residential development, led to less local revenue per pupil. I use Geographic Information
Systems (GIS) data from Ohio school districts and municipalities in the year 2000 to identify
both congruent and non-congruent school district borders as well as a measure of the degree of
fragmentation among different municipalities.4 The influence of these unique measures of
municipal-school border congruency on local revenue per-pupil is estimated using OLS and at
two-stage treatment effect regression approach. For local revenue per pupil, I am able to reject
the null hypothesis that noncongruent borders have no effect. This finding is robust to
alternative specifications and self-selection treatment effects.
2. Literature Review
Within the United States, school districts have received a great deal of attention in the literature
on overlapping government boundaries at the same hierarchical level (for e.g., see Fischel
4 This approach to measuring border congruence was previously employed in Ross et al. (2014).
4
(2009)).5 This is in no small part due to the large number of public school district consolidations
that reduced the total number of school districts from the hundreds-of-thousands to the tens-of-
thousands during the 20th century (Kenny and Schmidt, 1994). Though consolidation and
congruency are different concepts, the two subjects are closely related because consolidation can
either increase or decrease congruency. In the school consolidation paper most closely related to
mine, Brasington (2004) looks at the impact of local government structure on housing prices. In
a hedonic regression, he finds that consolidation (measured as a dummy variable if communities
share a school district) was associated with a with a 3.5 percent decline in housing values,
presumably due to increased heterogeneity in the consolidated district (i.e., more voters with
preferences farther away from the median).6 It is important to note, however, that Brasington’s
work does not directly provide evidence on border congruency since consolidation can either
increase or decrease border congruence depending on the starting structure of local communities.
In addition to the public finance literature on consolidation, border congruency is related
to the public administration literature on polycentric order and overlapping jurisdictions at the
same hierarchical level.7 Polycentrism deals more broadly with the notion of how systems of
public administration should be coordinated within a given region, typically a metropolitan area.
Ostrom et al. (1961, 836) bring up the issue of border congruency with respect to jurisdictional
issues surrounding the issue of political community:
An ideal solution, assuming criteria of responsibility and accountability consonant with democratic theory, would require that these three boundaries be coterminous.
5 Please note that while the literature on fiscal federalism (Oates, 1999; Stansel, 2005) also deals with overlapping jurisdictions, the main concern in that literature is with the proper vertical level of provision. Dowding and Mergoupis (2003) provide a helpful discussion of the distinction between the fiscal federalism literature and the literature on overlapping jurisdictions at the same hierarchical level. 6 This finding is consistent with school district residents needing to be compensated through lower housing prices in order to accept greater heterogeneity over the public provision of schooling. In addition, consolidated school districts tend to be larger and larger schools tend to have lower performance on test scores, which depresses property values (Brasington, 1997). For more on scale economies in education, see Lewis and Chakraborty (1996). 7 Across disciplines, polycentrism is also sometimes described with the terms “fragmentation” or “decentralization.”
5
Where in fact the boundary conditions differ, scale problems arise....Nevertheless, the statement that a government is “too large (or too small) to deal with a problem” often overlooks the possibility that the scale of the public and the political community need not coincide with that of the formal boundaries of a public organization...It would be a mistake to conclude that public organizations are of an inappropriate size until the informal mechanisms, which might permit larger or smaller political communities, are investigated.
A monocentric system, in this context, would be one in which a metropolitan area coordinates all
public services through a single public agency. A polycentric one would likely have more local
governments or other similar special districts, as well as complicated and overlapping
boundaries. The literature on polycentrism provides an explanation why overlapping
jurisdictions and the resulting noncongruency of borders may not be inefficient when
consideration of all regional services is considered.
Finally, the only paper to directly measure border congruency among local governments
is Ross et al. (2014). Using data on Ohio school districts and municipalities, the authors measure
the extent to which school district borders are congruent with a local municipality. They argue
that the higher residential development in noncongruent school districts is likely to lead to school
overcrowding as voters refuse to pay for new school construction for what they see as excessive
development. In that respect, the motivation of Ross et al. (2014) is identical to the one in this
paper except their concern is with increased students leading to higher class sizes instead of
reduced local revenue. They find that school districts where the borders are noncongruent have
higher class sizes, ceteris paribus, suggesting that noncongruence might matter for school district
revenue since higher class sizes are typically associated with attempting to keep school costs
low. Building off their work, I will look at the impact of border noncongruence between Ohio
school districts and municipalities on their ability to raise local revenue per pupil.
6
3. Ohio School Districts and Congruency Measurement
This paper draws on cross-sectional data from Ohio K-12 school districts for the year 2000. As
noted in Ross et al. (2014), school districts borders in Ohio have changed very little since the
mid-1960s due to concerns surrounding racial segregation and white flight.8 School borders
determined and fixed decades ago can likely be treated as exogenous. In addition, many
important socioeconomic variables necessary as controls are only available from the 2000
Census. Using GIS data from the 2000 Census on both municipalities and school districts, the
extent to which a school district is divided among municipalities according to area of overlap
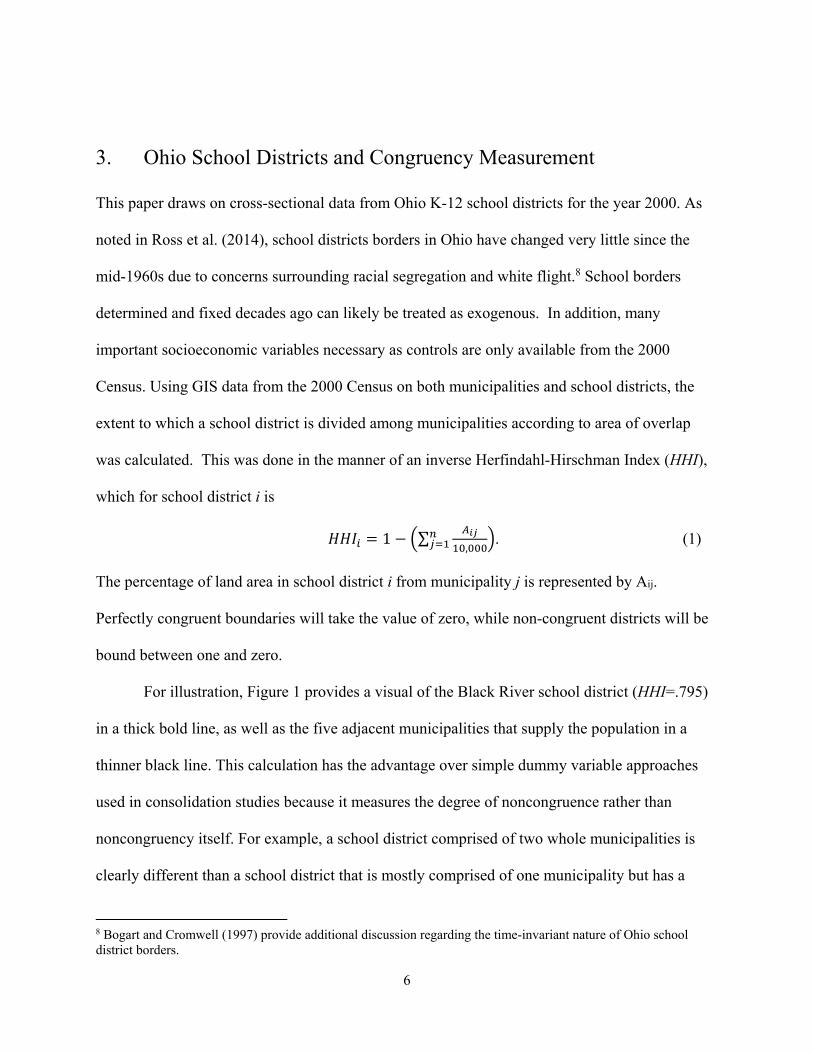
was calculated. This was done in the manner of an inverse Herfindahl-Hirschman Index (HHI),
which for school district i is
1 ∑,
. (1)
The percentage of land area in school district i from municipality j is represented by Aij.
Perfectly congruent boundaries will take the value of zero, while non-congruent districts will be
bound between one and zero.
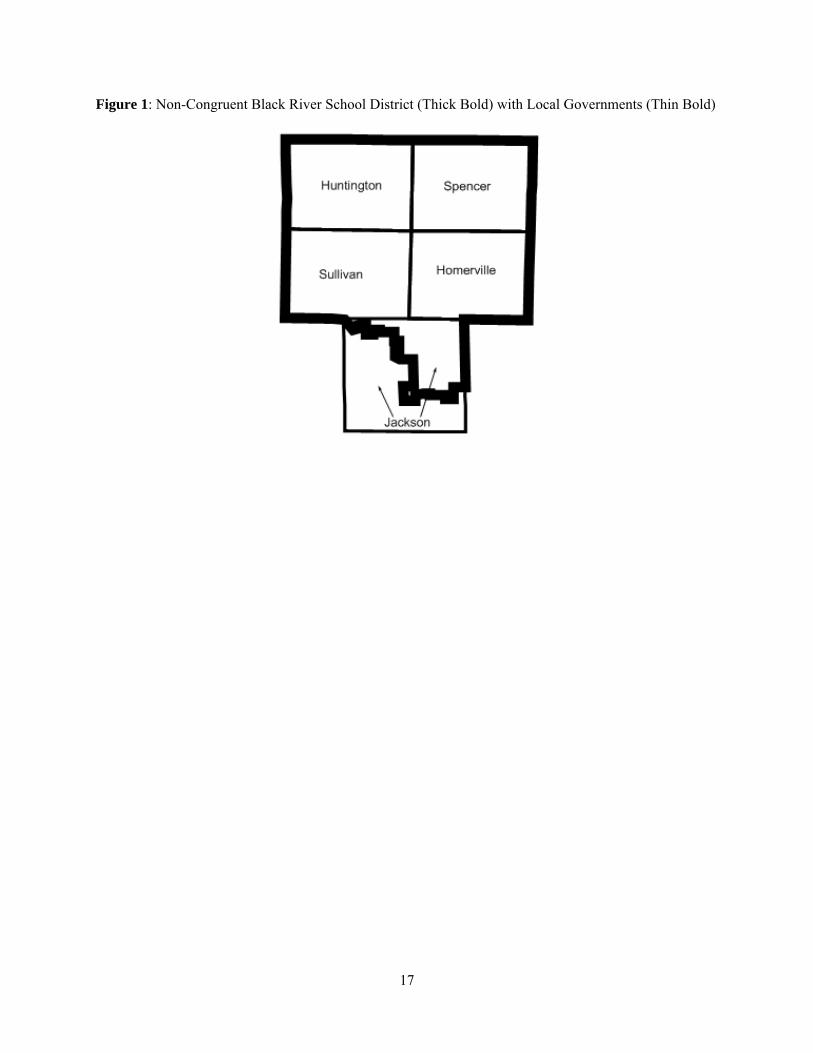
For illustration, Figure 1 provides a visual of the Black River school district (HHI=.795)
in a thick bold line, as well as the five adjacent municipalities that supply the population in a
thinner black line. This calculation has the advantage over simple dummy variable approaches
used in consolidation studies because it measures the degree of noncongruence rather than
noncongruency itself. For example, a school district comprised of two whole municipalities is
clearly different than a school district that is mostly comprised of one municipality but has a
8 Bogart and Cromwell (1997) provide additional discussion regarding the time-invariant nature of Ohio school district borders.
7
small portion serving another municipality. In the former case, the HHI score would be 0.5 and
in the latter case it would be close to zero, depending on how little area came from another
municipality. Therefore the lower the HHI score the more congruent the school district is with a
single municipality.9
While Ohio has 611 school districts, my analysis excludes four districts as being
unrepresentative. Three of the districts serve a handful of students living year-round on islands in
Lake Erie and the fourth school district is a joint Ohio-Indiana school district and thus has a
unique financing structure. Of the 607 districts remaining, 126 are congruent and 481 are
noncongruent of various degrees. In terms of demographics such as student enrollment, income,
income inequality, population, and racial diversity there is little difference on average between
congruent and noncongruent school districts.10
4. Empirical Approach
The empirical model is motivated by the intention to capture the effect of non-congruency on
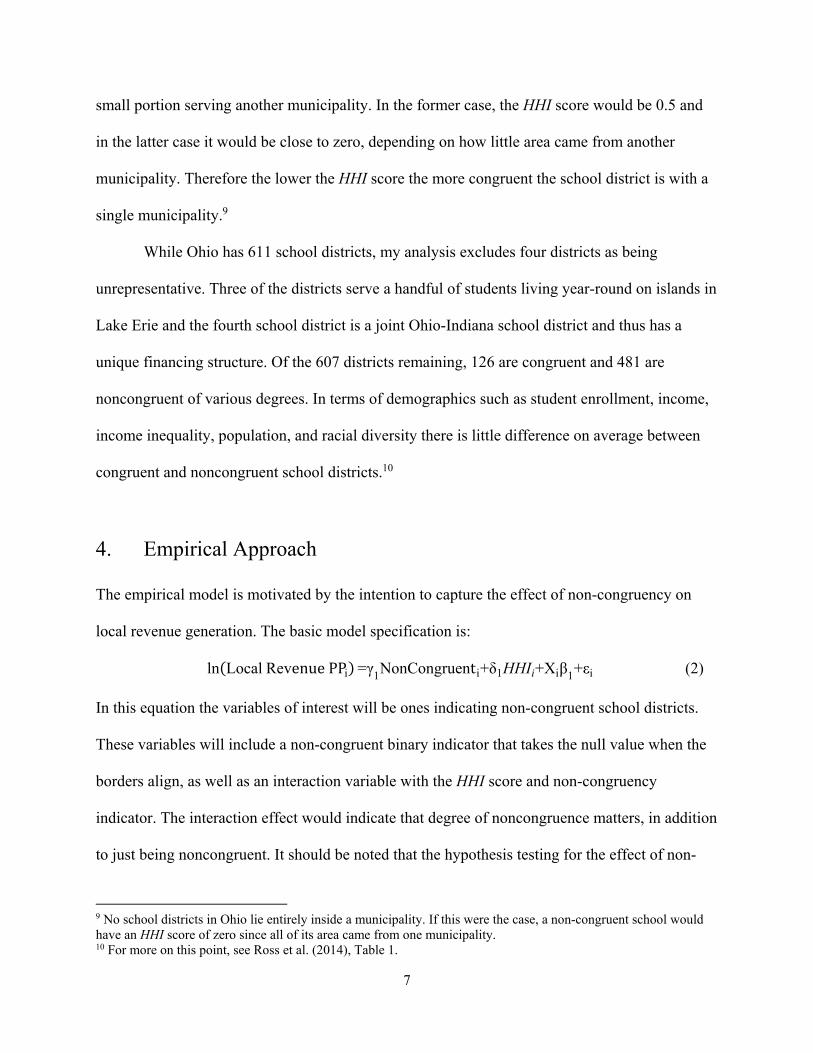
local revenue generation. The basic model specification is:
ln LocalRevenuePPi =γ1NonCongruenti+δ1HHIi+Xiβ1+εi (2)
In this equation the variables of interest will be ones indicating non-congruent school districts.
These variables will include a non-congruent binary indicator that takes the null value when the
borders align, as well as an interaction variable with the HHI score and non-congruency
indicator. The interaction effect would indicate that degree of noncongruence matters, in addition
to just being noncongruent. It should be noted that the hypothesis testing for the effect of non-
9 No school districts in Ohio lie entirely inside a municipality. If this were the case, a non-congruent school would have an HHI score of zero since all of its area came from one municipality. 10 For more on this point, see Ross et al. (2014), Table 1.
8
congruency will require a test of joint significance of both the non-congruent indicator and its
interaction effect with HHI, the degree of non-congruency.11
The remaining control variables represented by Xi and Zi in equation (2) is largely
motivated by the intuition that the dependent variables are determined by voter preferences, voter
wealth, and other social or institutional factors. This motivation is consistent with the median
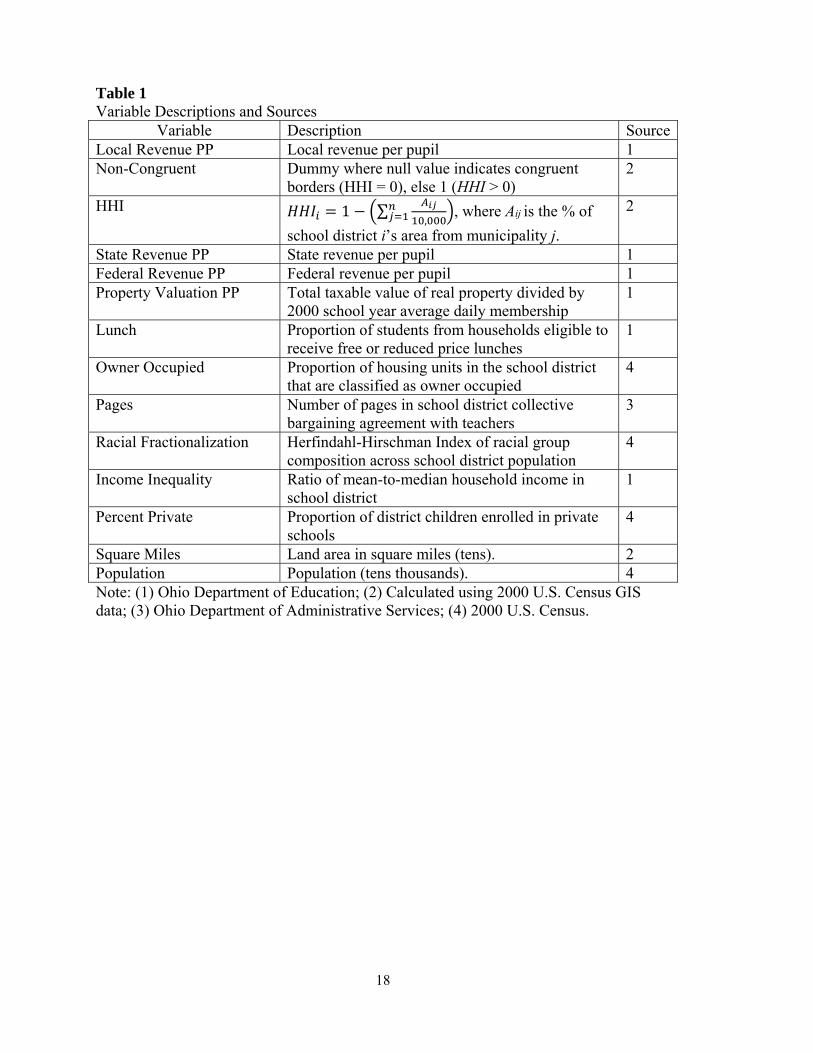
voter model and how it has been employed in the economics of education literature. Table 1
provides a full list of variables employed in this paper, as well as full definitions and sources.
The inclusion of Racial Fractionalization and Income Inequality is motivated the work of
ethnic, racial, and income divisions and the support for local publicly-provided goods (Alesina et
al., 1999; Hall and Leeson, 2010). Competition from private schools (Percent Private) is
generally thought to lower local revenue per pupil as the increased availability of private
substitutes will lower support for local public schools (Flowers, 1975; Denzau and Grier, 1984;
Hall, 2007). The sign on this variable is ambiguous, however, since within some range families
choosing private school will not affect local public school demand but will reduce the number of
students, increasing local revenue per pupil. The sign on Owner Occupied is also theoretical
ambiguous as property owners could have higher demand for spending per pupil (Ladd and
Murray, 2001) or lower demand because of “renter’s illusion” as discussed by Denzau and Grier
(1984). Pages is simply the number of pages in the district’s collective bargaining agreement
with its teachers union. This is a proxy variable for the strength of the local teachers union which
should positively influence local revenue per pupil (Duplantis et al., 1995). Beyond the basic
specification, State Revenue PP and Federal Revenue PP are motivated by a large literature
interested in uncovering intergovernmental transfers that experience a “flypaper effect” of
11 For this marginal effect, an F-test will be conducted on the null hypothesis that for a given HHI score, γ HHI ∙δ 0.
9
sticking to their intended use, rather than causing substitution effects in the form of reduced local
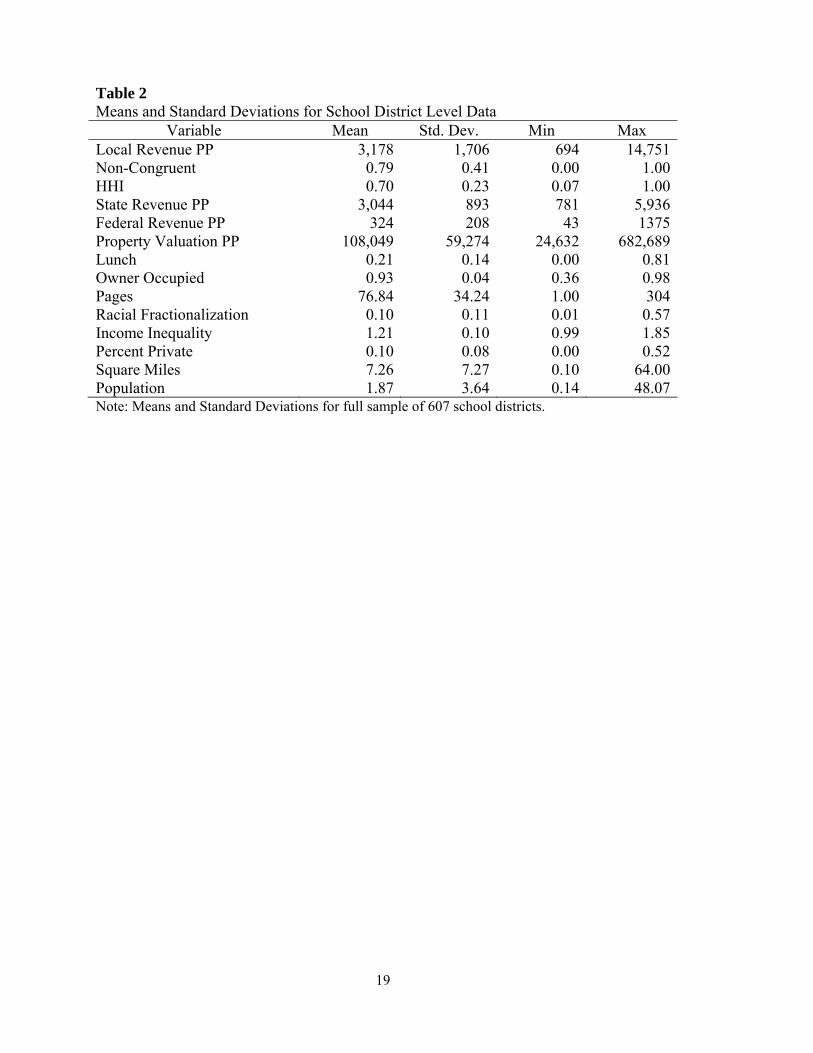
spending (Stevens and Mason, 1996; Card and Payne, 2002). Summary statistics for all
dependent and independent variables are provided in Table 2.
In addition to the OLS estimates of equation (2), the possibility of endogeneity and self-
selection bias will be considered in the empirical analysis. Non-congruent school districts are
sometimes, though not always, the result of historical consolidations of smaller districts for the
purpose of increasing revenues and to capture the economies of scale necessary to support school
buildings in a system of grades. This likely caused these school districts to be much larger
geographically than their contemporary counterparts, as they needed to cover more parcels of
land that represented both students and taxable property. These biases would likely direct the
parameter estimates closer to zero. It is with this motivation that we employ both land area and
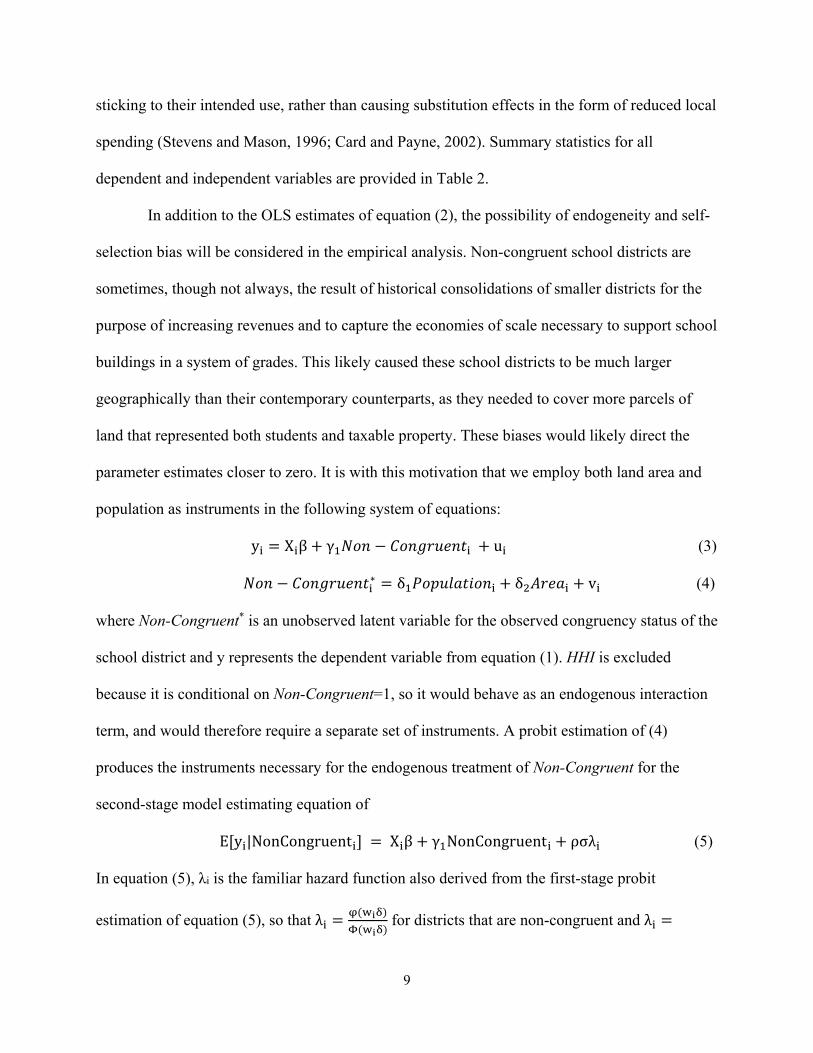
population as instruments in the following system of equations:
y X β γ u (3)
∗ δ δ v (4)
where Non-Congruent* is an unobserved latent variable for the observed congruency status of the
school district and y represents the dependent variable from equation (1). HHI is excluded
because it is conditional on Non-Congruent=1, so it would behave as an endogenous interaction
term, and would therefore require a separate set of instruments. A probit estimation of (4)
produces the instruments necessary for the endogenous treatment of Non-Congruent for the
second-stage model estimating equation of
E y |NonCongruent X β γ NonCongruent ρσλ (5)
In equation (5), λi is the familiar hazard function also derived from the first-stage probit
estimation of equation (5), so that λ for districts that are non-congruent and λ
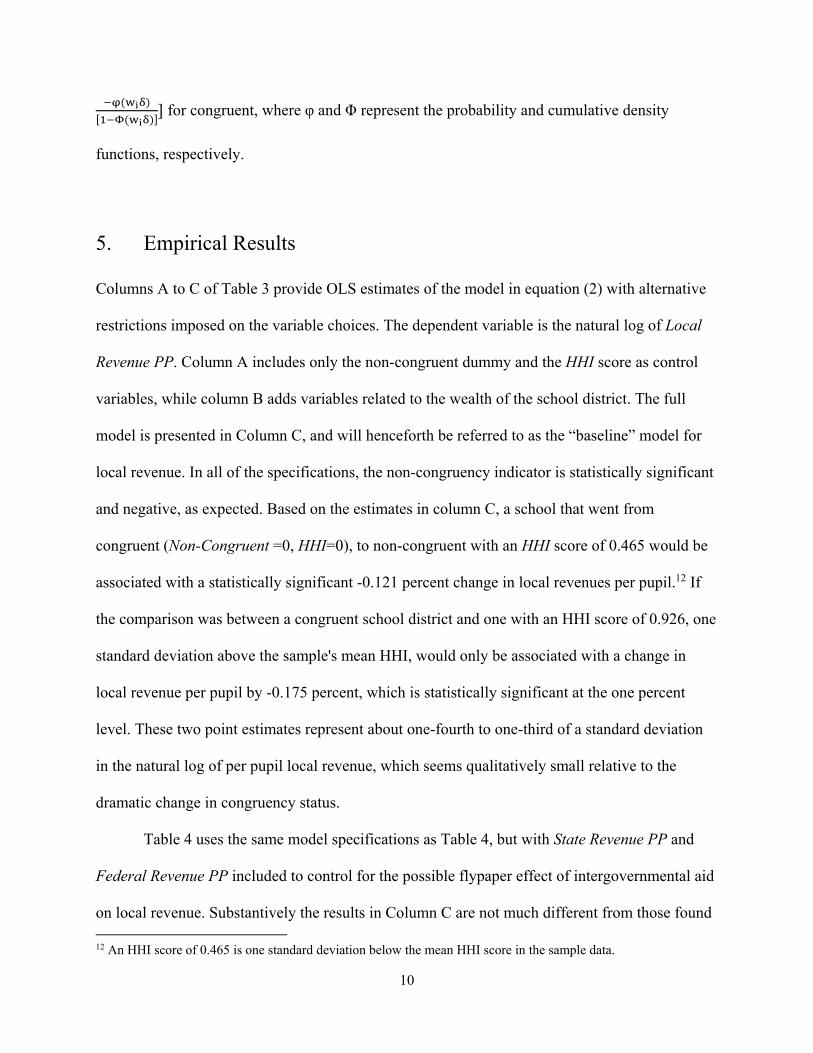
10
for congruent, where φ and Φ represent the probability and cumulative density
functions, respectively.
5. Empirical Results
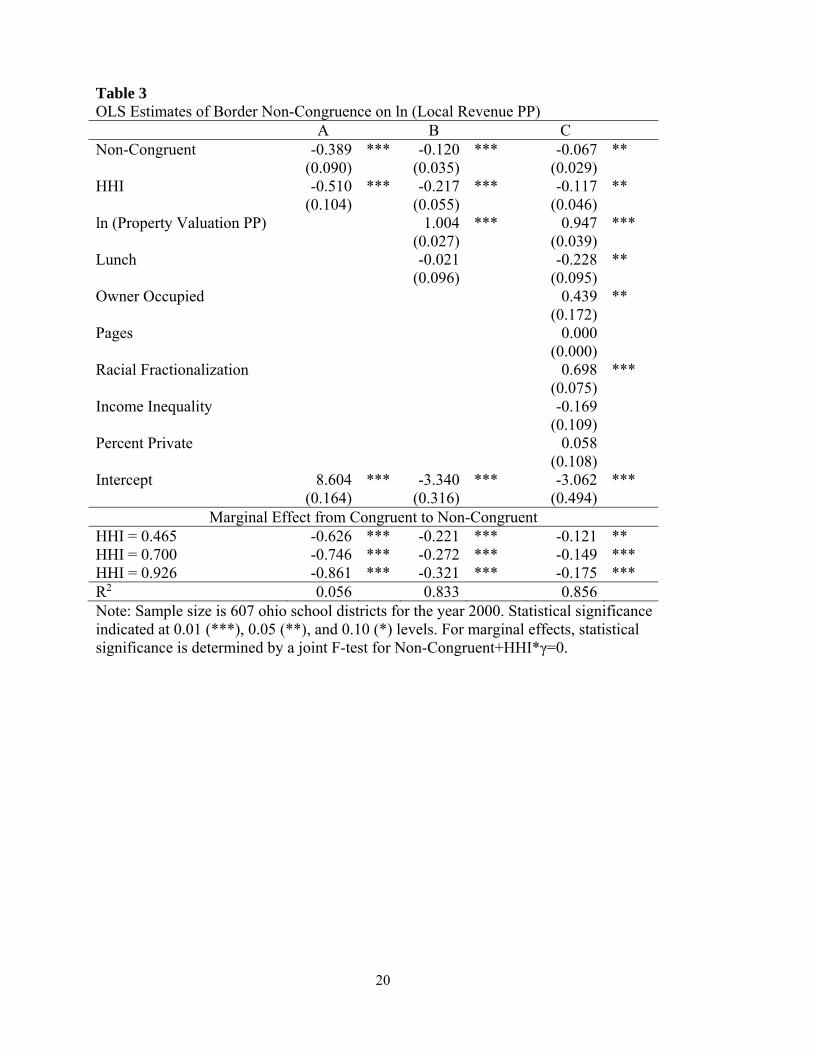
Columns A to C of Table 3 provide OLS estimates of the model in equation (2) with alternative
restrictions imposed on the variable choices. The dependent variable is the natural log of Local
Revenue PP. Column A includes only the non-congruent dummy and the HHI score as control
variables, while column B adds variables related to the wealth of the school district. The full
model is presented in Column C, and will henceforth be referred to as the “baseline” model for
local revenue. In all of the specifications, the non-congruency indicator is statistically significant
and negative, as expected. Based on the estimates in column C, a school that went from
congruent (Non-Congruent =0, HHI=0), to non-congruent with an HHI score of 0.465 would be
associated with a statistically significant -0.121 percent change in local revenues per pupil.12 If
the comparison was between a congruent school district and one with an HHI score of 0.926, one
standard deviation above the sample's mean HHI, would only be associated with a change in
local revenue per pupil by -0.175 percent, which is statistically significant at the one percent
level. These two point estimates represent about one-fourth to one-third of a standard deviation
in the natural log of per pupil local revenue, which seems qualitatively small relative to the
dramatic change in congruency status.
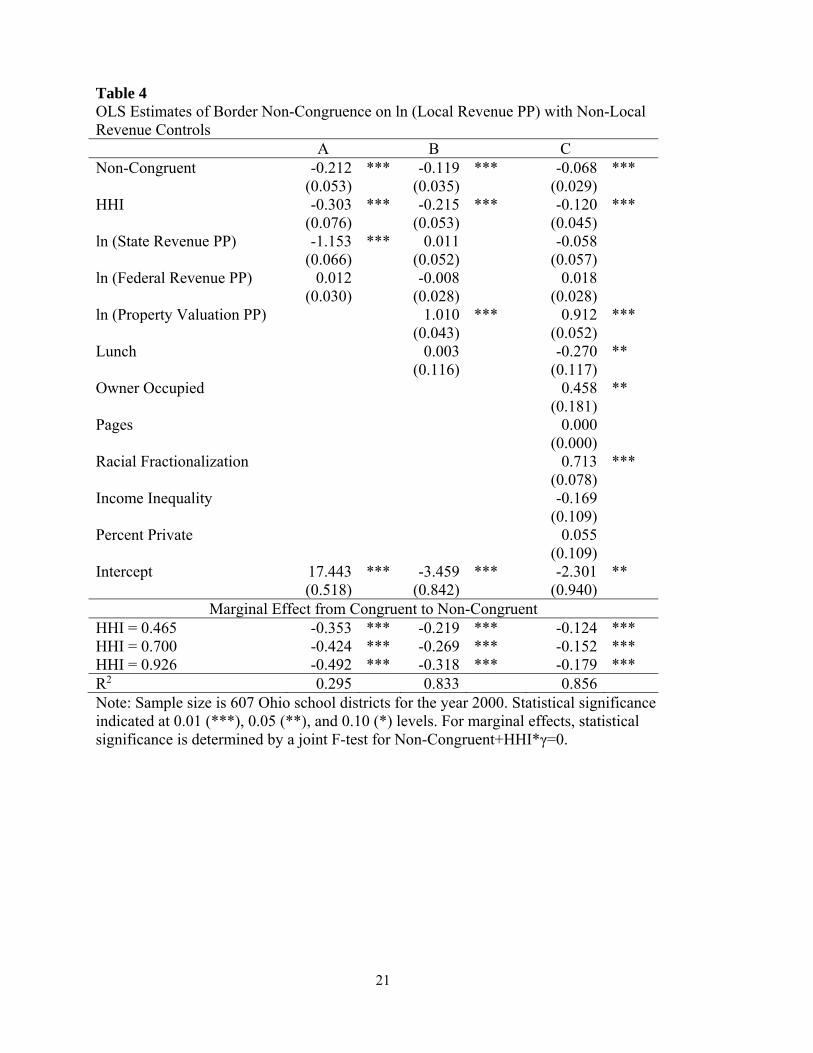
Table 4 uses the same model specifications as Table 4, but with State Revenue PP and
Federal Revenue PP included to control for the possible flypaper effect of intergovernmental aid
on local revenue. Substantively the results in Column C are not much different from those found 12 An HHI score of 0.465 is one standard deviation below the mean HHI score in the sample data.
11
in the counterpart specifications of Table 4, though the marginal effects of the two non-
congruency measures become slightly more negative. Since there does not seem to be much
evidence for the flypaper effect, I drop State Revenue PP and Federal Revenue PP from further
analysis.13
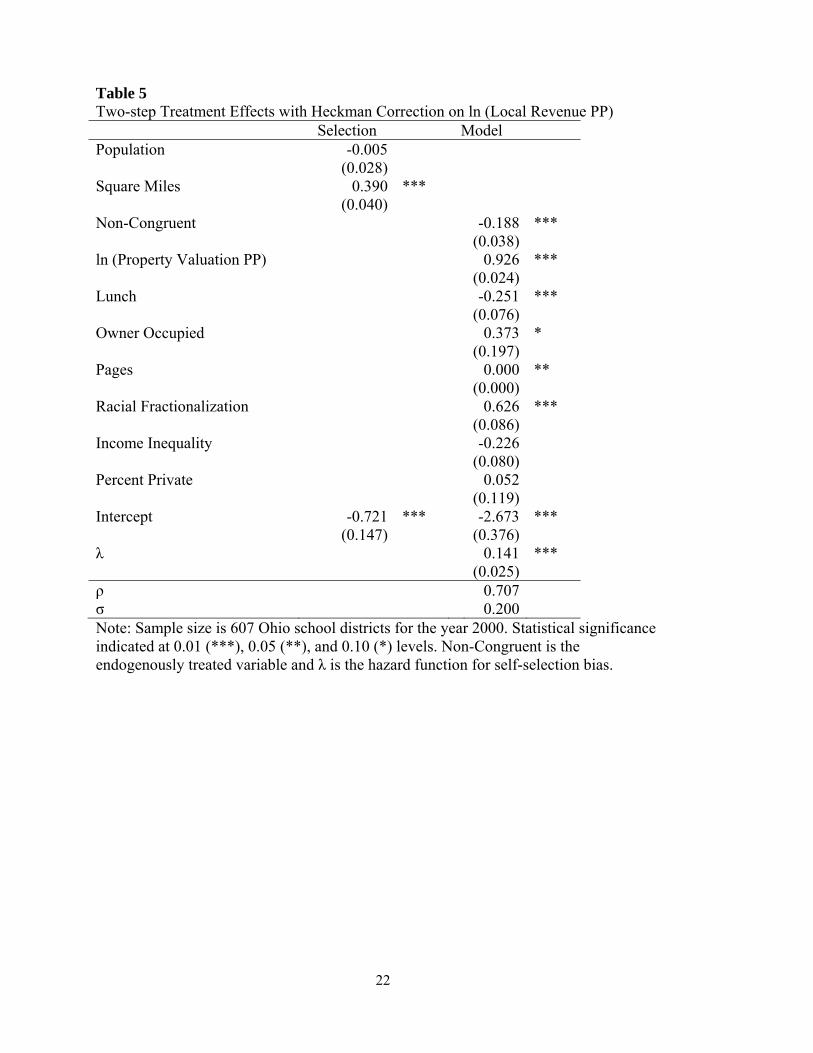
Table 5 presents both the selection stage and the model estimates for the endogenous
treatment of congruency status, as well as for the hazard function to test for self-selection.14 The
results are substantively the same, and the marginal estimate for non-congruency is larger than
its OLS counterpart in Column C of Table 3. The point estimates in Table 5 indicate that
changing from congruent to non-congruent would reduce local revenue by -0.188 percent. This
estimate represents about 37 percent of a standard deviation in the dependent variable, and
evaluated at the mean this would represent about $572 per pupil in revenue. In both models the
hazard function is statistically significant and therefore indicative of self-selection bias. The
positive sign on ρ indicates that the direction of the bias would push congruency towards zero,
consistent with the expectation that OLS estimates would underestimate the impact of non-
congruency status because of self-selection.
6. Conclusion
The goal of this paper was to empirically determine if there was any evidence for the notion that
non-congruent borders between school districts and their adjoining municipalities resulted in a
13 While there might be no flypaper effect, state or federal aid might be important for test scores (Cebula, 1977). 14 This model can be sensitive to the choice of variables excluded from the selection stage. In this case, however, the estimates are not particularly sensitive to the choice of variables to exclude in the first stage. In the results all model-stage independent variables are excluded, but inclusion of all independent variables does not qualitatively change the results.
12
fiscal commons problem that led to lower school spending. In order to avoid problems associated
with border endogeneity, data on Ohio school districts was employed because school borders
have been left largely unchanged since the mid-1960s. Drawing on 607 school districts in the
year 2000, I present evidence that supports the view that border non-congruence leads to less
local revenue per pupil, ceteris paribus. The effect can be seen in a multivariate regression and
an instrument variable treatment effects regression that corrects for self-selection bias. In
addition, as school districts become more fragmented and thus more non-congruent, the
influence of non-congruency on local revenue increases.
The policy implications of these results are not entirely clear. One the one hand, non-
congruent school districts generate less local revenue per pupil than districts whose borders are
congruent with a municipality. While seemingly problematic, this could be the price paid for
other benefits associated with noncongruence. For example, noncongruence could allow cities to
have a large enough school district to have Advanced Placement courses at the high school level.
In addition, noncongruence could be an important factor in Tiebout sorting as it allows for more
jurisdictional diversity.15 Jurisdictional diversity has been shown by Grassmueck et al. (2008) to
help states retain residents. And while it is not necessarily a direct factor in attracting interstate
migrants, jurisdictional diversity has been shown to lead to other things migrants want like better
schools (Blair and Staley, 1995).16 Future research should explore these other trade-offs made by
school districts and municipalities to get a more complete picture of the overall effect that
15 The seminal paper on Tiebout and migration is Cebula (1978). 16 For more on the determinants of interstate migration, see Cebula and Alexander (2006) for a good overview and Mulholland and Hernández-Julián (2013) for a more recent paper focused on education.
13
essentially fixed school district border, some of which are noncongruent, have on the welfare of
individuals within these communities.17
17 For example, what relationship, if any, is there between polycentrism within a metropolitan area and that area’s economic freedom (Stansel, 2013)?
14
References
Alesina, A., R. Baqir, and W. Easterly. 1999. Public goods and ethnic divisions. Quarterly Journal of Economics 114(4): 1243-1284.
Blair, J., and S. Staley. 1995. Quality competition and public schools: Further evidence.
Economics of Education Review 14(2): 193-198. Brasington, D. 1997. School district consolidation, student performance, and housing values.
Journal of Regional Analysis & Policy 27(2): 43-54. Brasington, D. 2004. House prices and the structure of local government: An application of
spatial statistics. Journal of Real Estate Finance and Economics 29(2): 211-231. Bogart, W., and B. Cromwell. 1997. How much more is a good school district worth? National
Tax Journal 70(2): 215-232.
Campbell, R., L. Cunningham, and R. McPhee. 1965. The Organization and Control of American Schools. Columbus: Charles E. Merrill.
Card, D., and A. Payne. 2002. School finance reform, the distribution of school spending, and
the distribution of student test scores. Journal of Public Economics 83(1): 49-82. Cebula, R. 1977. A note on determinants of local government provision of an impure public
good: The case of education. Annals of Regional Science 11(2): 97-101. Cebula, R. 1978. An empirical note on the Tiebout-Tullock hypothesis. Quarterly Journal of
Economics 92(4): 705-711. Cebula, R., and G. Alexander. 2006. Determinants of net interstate migration, 2000-2004.
Journal of Regional Analysis & Policy 36(2): 116-123. Columbus Dispatch. 2003. Columbus, suburbs must cooperate to curb growth. Columbus
Dispatch, August 2. Denzau, A., and K. Grier. 1984. Determinants of local school spending: Some consistent
estimates. Public Choice 44(2): 375-83. Dowding, K., and T. Mergoupis. 2003. Fragmentation, fiscal mobility, and efficiency. Journal of
Politics 65(4): 1190-1207. Duplantis, M., T. Chandler, and T. Geske. 1995. The growth and impact of teacher’s unions in
states without collective bargaining legislation. Economics of Education Review 14(2): 167-178.
15
Feiock, R. 2007. Rational choice and regional governance. Journal of Urban Affairs 29(1): 47-63.
Fischel, W. 2001. Homevoters, muncipal corporate governance, and the benefit view of the
property tax. National Tax Journal 54(1): 157-173. Fischel, W. 2009. Making the Grade: The Economic Evolution of American School Districts.
Chicago: University of Chicago Press. Flowers, M. 1975. The possibility of double-peaked preference rankings for public school
expenditures. Public Choice 23(1): 81-85. Grassmueck, G. S. Goetz, and M. Shields. 2008. Youth out-migration from Pennsylvania: The
roles of government fragmentation vs. the beaten path effect. Journal of Regional Analysis & Policy 38(1): 77-88.
Hall, J. 2007. Local school finance and productive efficiency: Evidence from Ohio. Atlantic
Economic Journal 35(3): 289-301. Hall, J., and Peter T. Leeson. 2010. “Racial Fractionalization and School Performance.”
American Journal of Economics and Sociology 69(2), 736-758. Hall, J., and J. Ross. 2010. Tiebout competition, yardstick competition, and tax instrument
choice: Evidence from Ohio school districts. Public Finance Review 38(6): 710-737. Isard, W. 1956. Regional science, the concept of region, and regional structure. Papers in
Regional Science 2(1): 13-26. Kenny, L., and A. Schmidt. 1994. The decline in the number of school districts in the United
States. Public Choice 79(1-2): 1-18. Ladd, H., and S. Murray. 2001. Intergenerational conflict reconsidered: County demographic
structure and the demand for public education. Economics of Education Review 20(4): 343-357.
Lewis, W., and K. Chakraborty. 1996. Scale economies in public education. Journal of Regional
Analysis & Policy 26(1): 23-35. Mulholland, S., and R. Hernández-Julián. 2013. Does economic freedom lead to selective
migration by education? Journal of Regional Analysis & Policy 43(1): 65-87. Oates, W. 1999. An essay on fiscal federalism. Journal of Economic Literature 37(3): 1120-
1149. Ostrom, V., C. Tiebout, and R. Warren. 1961. The organization of government in metropolitan
areas: A theoretical inquiry. American Political Science Review 55(4): 831-842.
16
Ross, J., J. Hall, and W. Resh. 2014. Frictions in polycentric administration with noncongruent
borders: Evidence from Ohio school district class sizes. Journal of Public Administration, Research, and Theory 24(3): 623-649.
Stansel, D. 2005. Local decentralization and local economic growth: A cross-sectional
examination of U.S. metropolitan areas. Journal of Urban Economics 57(1): 55-72. Stansel, D. 2013. An economic freedom index for U.S. metropolitan areas. Journal of Regional
Analysis & Policy 43(1): 3-20. Stevens, J., and R. Mason. 1996. Political markets, property tax referenda, and local school
spending. Public Choice 86(3-4): 257-277. Turnbull, G., and S. Djoundourian. 1994. The median voter hypothesis: Evidence from general
purpose local governments. Public Choice 81(3-4): 223-240. Turnbull, G., and P. Mitias. 1999. The median voter model across levels of government. Public
Choice 99(1-2): 119-138.
17
Figure 1: Non-Congruent Black River School District (Thick Bold) with Local Governments (Thin Bold)
18
Table 1 Variable Descriptions and Sources
Variable Description SourceLocal Revenue PP Local revenue per pupil 1 Non-Congruent Dummy where null value indicates congruent
borders (HHI = 0), else 1 (HHI > 0) 2
HHI 1 ∑,
, where Aij is the % of
school district i’s area from municipality j.
2
State Revenue PP State revenue per pupil 1 Federal Revenue PP Federal revenue per pupil 1 Property Valuation PP Total taxable value of real property divided by
2000 school year average daily membership 1
Lunch Proportion of students from households eligible to receive free or reduced price lunches
1
Owner Occupied Proportion of housing units in the school district that are classified as owner occupied
4
Pages Number of pages in school district collective bargaining agreement with teachers
3
Racial Fractionalization Herfindahl-Hirschman Index of racial group composition across school district population
4
Income Inequality Ratio of mean-to-median household income in school district
1
Percent Private Proportion of district children enrolled in private schools
4
Square Miles Land area in square miles (tens). 2 Population Population (tens thousands). 4 Note: (1) Ohio Department of Education; (2) Calculated using 2000 U.S. Census GIS data; (3) Ohio Department of Administrative Services; (4) 2000 U.S. Census.
19
Table 2 Means and Standard Deviations for School District Level Data
Variable Mean Std. Dev. Min Max Local Revenue PP 3,178 1,706 694 14,751Non-Congruent 0.79 0.41 0.00 1.00HHI 0.70 0.23 0.07 1.00State Revenue PP 3,044 893 781 5,936Federal Revenue PP 324 208 43 1375Property Valuation PP 108,049 59,274 24,632 682,689Lunch 0.21 0.14 0.00 0.81Owner Occupied 0.93 0.04 0.36 0.98Pages 76.84 34.24 1.00 304Racial Fractionalization 0.10 0.11 0.01 0.57Income Inequality 1.21 0.10 0.99 1.85Percent Private 0.10 0.08 0.00 0.52Square Miles 7.26 7.27 0.10 64.00Population 1.87 3.64 0.14 48.07Note: Means and Standard Deviations for full sample of 607 school districts.
20
Table 3 OLS Estimates of Border Non-Congruence on ln (Local Revenue PP) A B C Non-Congruent -0.389 *** -0.120 *** -0.067 ** (0.090) (0.035) (0.029) HHI -0.510 *** -0.217 *** -0.117 ** (0.104) (0.055) (0.046) ln (Property Valuation PP) 1.004 *** 0.947 *** (0.027) (0.039) Lunch -0.021 -0.228 ** (0.096) (0.095) Owner Occupied 0.439 ** (0.172) Pages 0.000 (0.000) Racial Fractionalization 0.698 *** (0.075) Income Inequality -0.169 (0.109) Percent Private 0.058 (0.108) Intercept 8.604 *** -3.340 *** -3.062 *** (0.164) (0.316) (0.494)
Marginal Effect from Congruent to Non-Congruent HHI = 0.465 -0.626 *** -0.221 *** -0.121 ** HHI = 0.700 -0.746 *** -0.272 *** -0.149 *** HHI = 0.926 -0.861 *** -0.321 *** -0.175 *** R2 0.056 0.833 0.856 Note: Sample size is 607 ohio school districts for the year 2000. Statistical significance indicated at 0.01 (***), 0.05 (**), and 0.10 (*) levels. For marginal effects, statistical significance is determined by a joint F-test for Non-Congruent+HHI*γ=0.
21
Table 4 OLS Estimates of Border Non-Congruence on ln (Local Revenue PP) with Non-Local Revenue Controls A B C Non-Congruent -0.212 *** -0.119 *** -0.068 *** (0.053) (0.035) (0.029) HHI -0.303 *** -0.215 *** -0.120 *** (0.076) (0.053) (0.045) ln (State Revenue PP) -1.153 *** 0.011 -0.058 (0.066) (0.052) (0.057) ln (Federal Revenue PP) 0.012 -0.008 0.018 (0.030) (0.028) (0.028) ln (Property Valuation PP) 1.010 *** 0.912 *** (0.043) (0.052) Lunch 0.003 -0.270 ** (0.116) (0.117) Owner Occupied 0.458 ** (0.181) Pages 0.000 (0.000) Racial Fractionalization 0.713 *** (0.078) Income Inequality -0.169 (0.109) Percent Private 0.055 (0.109) Intercept 17.443 *** -3.459 *** -2.301 ** (0.518) (0.842) (0.940)
Marginal Effect from Congruent to Non-Congruent HHI = 0.465 -0.353 *** -0.219 *** -0.124 *** HHI = 0.700 -0.424 *** -0.269 *** -0.152 *** HHI = 0.926 -0.492 *** -0.318 *** -0.179 *** R2 0.295 0.833 0.856 Note: Sample size is 607 Ohio school districts for the year 2000. Statistical significance indicated at 0.01 (***), 0.05 (**), and 0.10 (*) levels. For marginal effects, statistical significance is determined by a joint F-test for Non-Congruent+HHI*γ=0.
22
Table 5 Two-step Treatment Effects with Heckman Correction on ln (Local Revenue PP) Selection Model Population -0.005 (0.028) Square Miles 0.390 *** (0.040) Non-Congruent -0.188 *** (0.038) ln (Property Valuation PP) 0.926 *** (0.024) Lunch -0.251 *** (0.076) Owner Occupied 0.373 * (0.197) Pages 0.000 ** (0.000) Racial Fractionalization 0.626 *** (0.086) Income Inequality -0.226 (0.080) Percent Private 0.052 (0.119) Intercept -0.721 *** -2.673 *** (0.147) (0.376) λ 0.141 *** (0.025) ρ 0.707 σ 0.200 Note: Sample size is 607 Ohio school districts for the year 2000. Statistical significance indicated at 0.01 (***), 0.05 (**), and 0.10 (*) levels. Non-Congruent is the endogenously treated variable and λ is the hazard function for self-selection bias.