Embed Size (px)
Citation preview
J. exp. Biol. (1981), 9a, 305-321
With 9 figures
printed in Great Britain
LOCOMOTION IN BURROWING AND VAGRANTWOLF SPIDERS (LYCOSIDAE)
BY T. M. WARD AND W. F. HUMPHREYS*
School of Biological Sciences, Bath University,Bath, Avon BA2 7A Y, England
(Received 19 September 1980)
SUMMARY
Locomotion in the vagrant wolf spider Trochosa ruricola is comparedto that in the burrow dwelling wolf spider Lycosa tarentula (Araneae:Lycosidae). L. tarentula takes relatively shorter steps than T. ruricola. Athigh speeds T. ruricola approximates an alternating tetrapod gait but thisdoes not occur in L. tarentula. Phase lag differs between species and variesmarginally with speed except for ipsilateral phase lags in L. tarentula whichare erratic if they include leg 1. In both species the protraction/retractionratio is directly related to both running speed and stepping frequency, butthe relationship is more marked in L. tarentula. The protraction/retractionratio is more variable in leg 1 and varies between legs along the body butby a greater amount in L. tarentula. In these spiders, in contrast to thesituation in many insects, both the duration of protraction and retractionshow marked inverse relationships to stepping frequency. The power stroke(retraction) occupies a variable proportion of the stepping cycle, which isnot the case in other spiders, and this proportion is lower than for otherspiders.
It is suggested that the first pair of legs is used more for sensory thanfor locomotory purpose and that this is more marked in the burrowdwelling species, L. tarentula.
INTRODUCTION
The characteristic gaits determined from studies of arthropod locomotion fallinto two basic models; the metachronal wave and the alternating tripod gait (Wilson,1966; Graham, 1972; Pearson & lies, 1973). The former predominates in the non-insect uniramid groups (Manton, 1973) and is epitomised in the gait of millipedes.The alternating tripod gait is seen in insects (Hughes, 1952) and is essentiallysimilar to the alternating tetrapod gait of octopodal arthropods since both are basedon the alternation of ipsilateral and contralateral legs. Arthropod locomotion hasbeen studied extensively to examine evolutionary relationships (Manton, 1953, 1973)and intensively to elucidate the underlying neural control of locomotion. The latterworkers have concentrated on insects (reviews by Wilson, 1967; Bowerman, 1977),although Crustacea (Burrows & Hoyle, 1973; Barnes, 1975; MacMillan, 1975; Ayres
. • Present and reprint address: Western Australian Museum, Francis Street, Perth, W.A. 6000,Bistralia.
306 T. M. WARD AND W. F. HUMPHREYS
& Davis, 1977) and arachnids (Bowerman, 1975 a; Wilson, 1967; Land, 1972) h a ^been examined.
Amongst octopods the alternating tetrapod gait predominates (scorpions - Bower-man, 1975 a; Root & Bowerman, 1978; spiders - Wilson, 1967) although in fiddlercrabs aspects of both alternating and metachronal gaits were present (Barnes, 1975).Stepping patterns may vary within individuals to compensate for irregular surfaces(Pearson & lies, 1973), inclines (Spirito & Mushrush, 1979) and missing legs(spiders - Wilson, 1967; scorpions - Bowerman, 19756; cockroach - Delcomyn,1971 b). Additionally steps may be missing from the stepping cycle of grasshoppers(Graham, 1978) and the stepping cycle may change between instars (stick insects -Graham, 1972). Stereotyped burying behaviour is present in a Skarus spider(Reiskind, 1969).
Such variation suggests that gaits may be adapted to the life style of closelyrelated species and this report compares the stepping pattern of vagrant and burrowingwolf spiders.
MATERIALS AND METHODS
Two species of wolf spiders were investigated. Trochosa ruricola (DeGeer, 1778)is typically vagrant in habit and the spiders move over the substrate at night but,like many lycosids, are probably sit and wait predators relying on prey movementfor initial contact. They were collected from peat workings on Shapwick Heath,Somerset. Lycosa tarentula (Linne", 1758) lives in burrows and spends most of theday at the mouth of the burrow awaiting prey contact and thermoregulatingbehaviourally (Humphreys, unpublished) like many burrow inhabiting lycosids(Humphreys, 1978). They were collected from old talc workings at Arnissa in northernGreece. This should not be confused with the new world tarantulas which aremygalomorph rather than araeneomorph spiders.
A 'Hycam' rotating prism camera was used for filming at between 250 and 400frames per sec, f.p.s. (interval between frames 4-2-5 ms). A neon light inside thecamera placed time marks on the film at 10 ms intervals. Double perforated Kodak 4 Xnegative film was used and rated at 400 ASA for hand processing in D 76 developer.
The spiders were run in an arena from a holding area across a grid beneath thecamera lens and illuminated through heat filters by two 150 W slide projectorslocated 1 m away on either side of the arena. This provided hard shadows of thespiders legs to give a precise indication of lift-off and touch-down. To encouragestraight runs with T. ruricola the lights were placed perpendicular to the directionof movement and the spiders ran to the darkened receiving area in more than halfthe runs. L. tarentula tended to run towards the light so for runs with thisspecies the lights were rotated by 900 so that the projectors shone along rather thanacross the expected path of the spider. All filming was done at laboratory tempera-tures of about 23 °C.
Terminology
The terminology used in the literature to describe stepping patterns is confused.Burns (1973) uses the term 'stepping period' to describe the same thing that Wilsoa
Locomotion in burrowing and vagrant wolf spiders 307
^967) calls 'interval1 and Graham (1977) calls simply 'period'. These studies allWise the time from lift-off to lift-off to define period. To avoid confusion, the termsused in this paper are defined below.
Protraction (/>) leg raised and moved forward.
Retraction (r) leg down, moved backward.
Period (T) the time taken (ms) for one leg to complete a steppingcycle. For this paper it was measured from touch downto touch down. Any other phase could have been usedbut this cycle could be most precisely determined.*
Lag (/) the time difference (ms) between touch down for differentspecified legs (*see above).
Phase lag (O) lag/period.
p/r ratio duration of protraction/duration of retraction.
Stepping frequency (v) the number of steps/s.
Leg numbering legs are number in sequence from 1 (front legs) to 4 (hindlegs) and the left (L) and right (R) sides distinguishedwhere appropriate.
Analysts
Two methods are commonly used to represent stepping patterns. The first recordsthe position of the tarsal segments relative to the body (Hughes, 1952; Manton,1953) whilst the second records whether the legs are on or off the ground (Wilson,1967). The latter method was adopted here as it is better suited to quantitativeanalysis.
Stepping patterns were drawn from frame by frame analysis (~ 4000 frames)using a stop motion projector and the time corrected every ten frames to correct forthe varying film speed through the camera. The movement of a single leg wasfollowed through an entire run before further legs were analysed to prevent bias.In both species the hind legs dragged for part of the stepping cycle. The drag wasrecorded on the stepping patterns but for quantitative analysis the drag was takento be a constituent part of protraction as a dragged leg cannot provide propulsion.Ground speeds were calculated from the movement of the spiders across the gridusing the time marks on the film. Frame numbers were converted to time from thestart of a run before quantitative analysis.
Analysis is presented only for juvenile and mature female spiders. Successfulruns were defined as those in which the spider ran at constant speed and turnedless than 300 in one field of view of the camera (9 cm for T. ruricola and 20 cm forL. tarentula). Data are presented for 27 successful runs for T. ruricola and 17 forL. tarentula obtained from three individuals of each species, although for one ofthe individuals of each species only one run was successful. Because more than onestepping cycle per run was analysed, the number of data used in analysis was higher,varving with the parameter analysed up to N = 85.
308 T. M. WARD AND W. F. HUMPHREYS
Trochosa runcola
P(drag)
Lycosa tar en tula
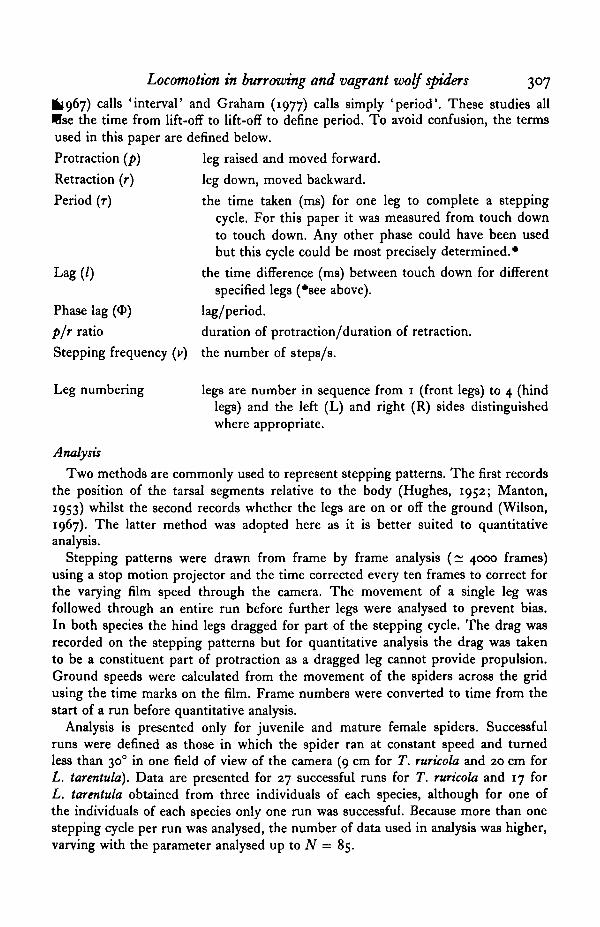
Fig. i. Typical leg arrangements during running, traced from film.P = protraction, R = retraction.
Statistical treatment
In biology the application of statistics for circular distributions is widely employedin studies of animal orientation but is equally applicable to the analysis of periodicfluctuations. Their application to locomotory rhythms was first suggested by Graham(1977) and they are used here. Mean direction and angular standard deviation weredetermined from standard algorithms (Batschelet, 1965; Mardia, 1972). The RayleighTest and the Two Sample Test were used for tests of significance and the criticalvalues read from the tables of Watson and Williams (in Mardia, 1972).
Mardia (1972) suggests that if the range of values considered does not exceedn/z radians (0-25 phase lag units) then the data may be treated as for linear normaldistributions. Since in this study the range of values exceeds 77/2 radians the circularnormal distribution has been applied throughout.
To aid continuity probability values only are presented in the text for somestatistical tests. Least-squares regressions were tested for significant slopes by t testand their slopes compared by analysis of variance and a posteriori STP. Multiplecomparison of means was conducted a priori using least significant difference anda posteriori by least significant range following analysis of variance. All tests followedSokal&Rohlf(i969).
RESULTS
Leg movements and size
Leg movements appear similar in both species. The movements of legs 1 and 2are similar (Fig. 1); the leg is lifted, extended in front of the spider, touched downand then flexed to provide the propulsive force. Flexion in leg 1 brings the tarsalsegments almost under the cephalothorax while leg 2 touches down further to
Locomotion in burrowing and vagrant zvolf spiders 309
30
20
10
10 15Body length (mm)
20 25
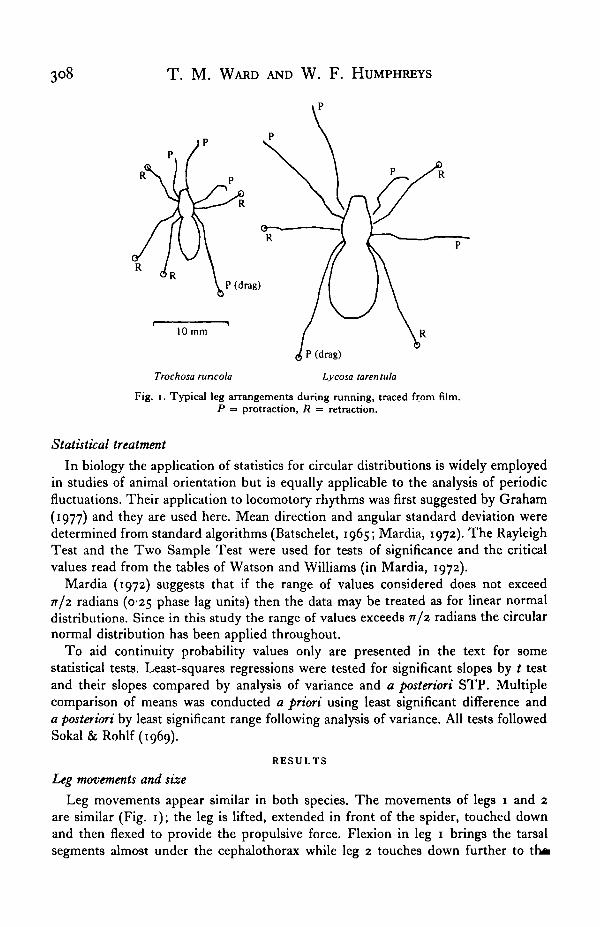
Fig. a. The relationship between body length and the lengths of leg 1 ( • ) andleg 4 (*) in T. ruricola ( ) and L. tarentula (—).
16
1•I
10 20 30Length (mm)
Fig. 3. The relationship between stepping frequency (Hz) at a speed of 0-2 m s"1 and body(•> D), leg 1 (©, O) and leg 4 ( • , • ) lengths in T. ruricola and L. tarentula. The threesmaller individuals are T. ruricola and the larger three L. tarentula. • , Estimated from thecommon slope of the lines in Fig. 9.
side and flexion brings the tarsal segments level with the front of the abdomen.Leg 3 is swept backward whilst held straight, with the coxa to tarsal distance remainingrelatively constant, although some twisting occurs. In leg 4 propulsion results fromextension of the leg. While running, both species move their body from side to side,but the significance of this would require analysis of forces exerted on the substrate,using photoelastic substrate transduction (Harris, 1978).
In T. ruricola the legs become proportionately shorter as body length increases(allometric mean slope = 078, Fig. 2) while in L. tarentula leg lengths increaserelative to body length (allometric mean slope = 1-76, Fig. 2). In both species, at aliven speed (0-2 m s-1), stepping frequency is inversely related to both body and leg
310 T. M. WARD AND W. F. HUMPHREYS
—0-21 ms'1
— v = 8-5Hz
100 200 300 ms
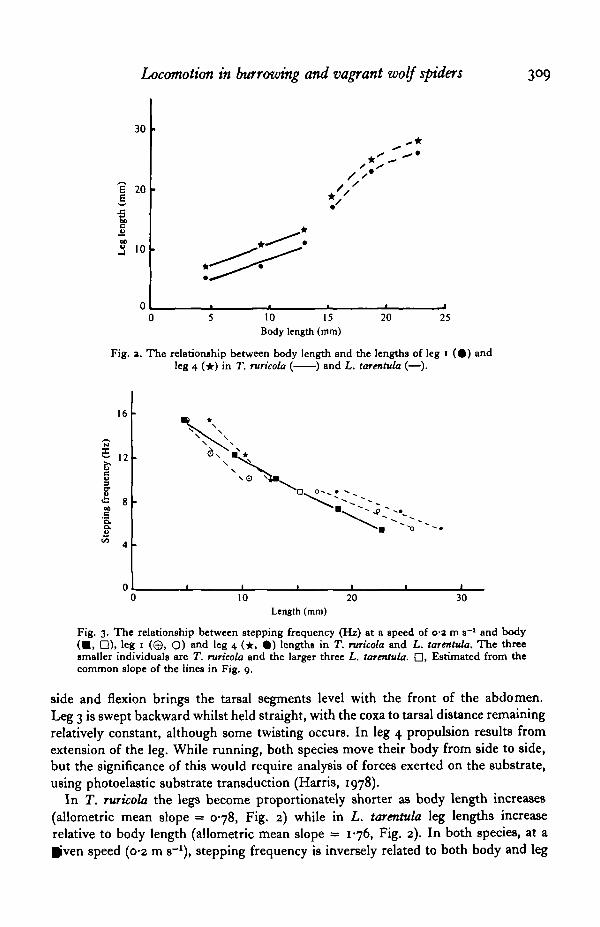
Fig. 4. Stepping pattern diagrams at the stepping frequencies (v) and velocities (5) indicated.Solid bars denote protraction and hatched bars indicate leg drag. Diagrams on the left arefor T. ruricola and on the right for L. tarentula. v and v increase down the page for bothspecies.
length (Fig. 3). For either species body length is a good predictor of stepping frequency(Fig. 3) but stepping frequency decreases more rapidly with increasing leg lengthin T. ruricola than in L. tarentula (Fig. 3).
Stepping pattern
Stepping pattern diagrams (Fig. 4) for a range of speeds (v) show that the period(7) decreases and the stepping frequency (v) increases as the speed increases andthat the larger and longer legged L. tarentula has a longer period for a given speed.In T. ruricola the gait becomes close to an alternating tetrapod gait at higher speedsbut in L. tarentula a true alternating tetrapod gait is not achieved even at the highestspeeds filmed. The stepping pattern is highly variable so visual inspection is oflittle value and quantitative analysis was made using the stepping pattern diagrams.
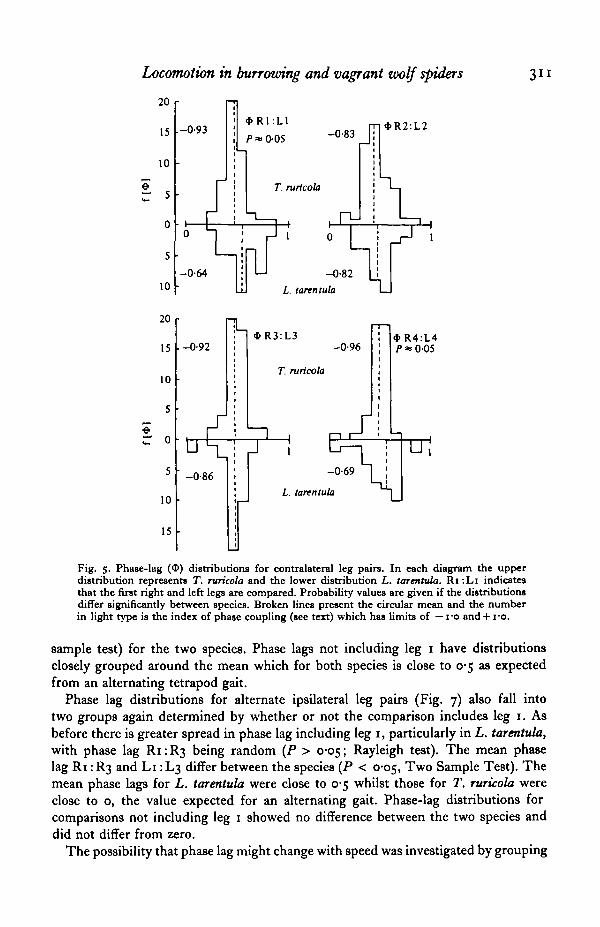
Phase lag (<D)
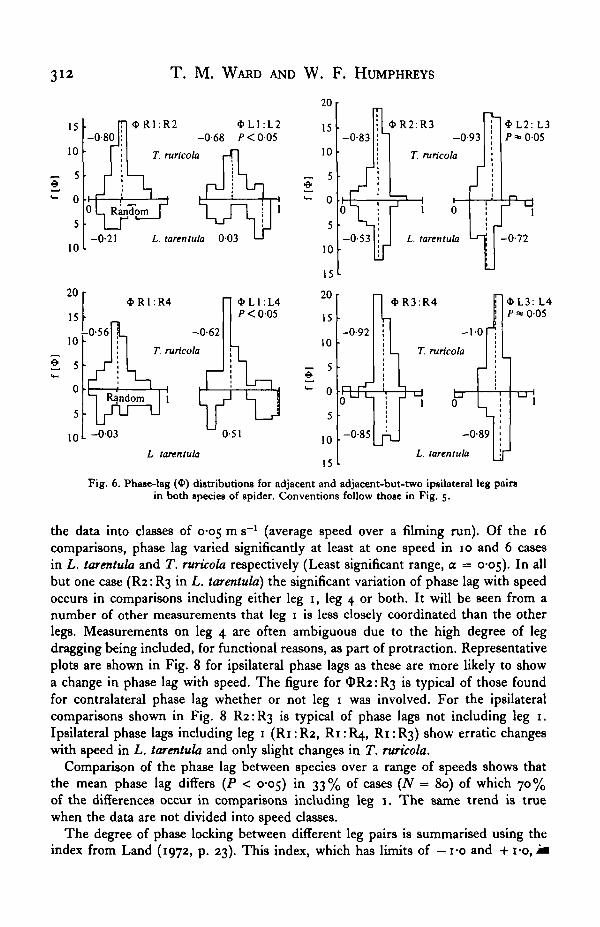
Both species show contralateral phase lag distributions closely grouped aroundthe mean (i.e. 0-5, the value expected from an alternating tetrapod gait; Fig. 5).Contralateral phase lags are greater in L. tarentula than T. ruricola for R I : L I andR4:L,4 (two-sample test; P as 005). Phase lag distributions for adjacent ipsilateralleg pairs (Fig. 6) fall into two main groups; those including leg 1 and those notincluding leg 1. Phase lags including leg 1 have greater spread especially in L. tarentulawhere the distributions of phase lags Ri:R2 and Ri:R4 are random (P > 0-05,Rayleigh test). The non-random phase lags have different means (P < 0-05, two*
Locomotion in burrowing and vagrant zvolf spiders
.-0-93*R1:L1
/>*O-05 -0-83 JlT. ruricola
*R2:L2
-0-64
-0-92
-0-82
L. tarentula ^ J
tr4-0-86
* R 3 : L 3-0-96
T. ruricola
<t>R4:L4/>*005
-0-69
20
15
10
5
0
5
10
20
15
10
5
0
5
10
15
Fig. 5. Phase-lag (<1>) distributions for contralateral leg pairs. In each diagram the upperdistribution represents T. ruricola and the lower distribution L. tarentula. Ri :Li indicatesthat the first right and left legs are compared. Probability values are given if the distributionsdiffer significantly between species. Broken lines present the circular mean and the numberin light type is the index of phase coupling (see text) which has limits of — i-o and+ i-o.
sample test) for the two species. Phase lags not including leg i have distributionsclosely grouped around the mean which for both species is close to 0-5 as expectedfrom an alternating tetrapod gait.
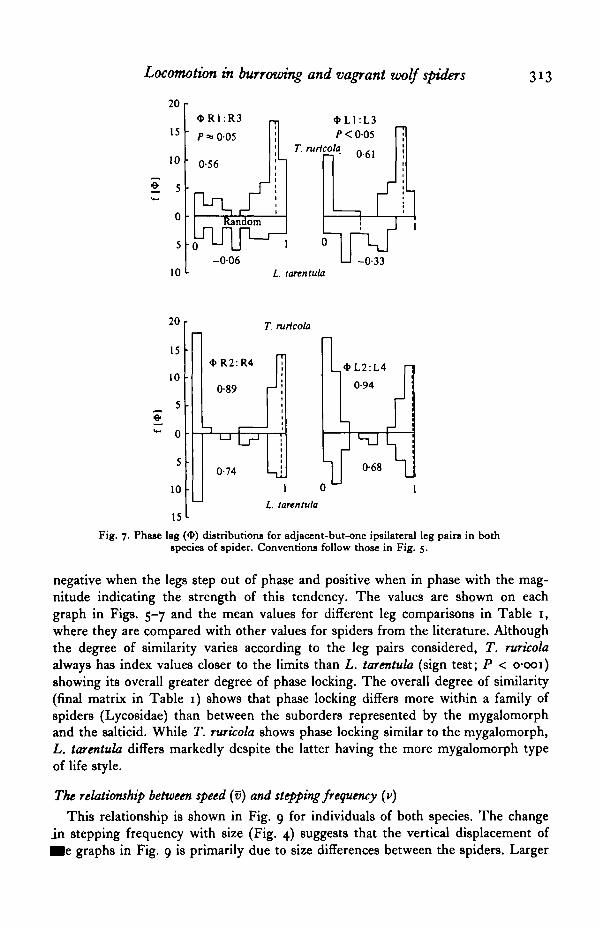
Phase lag distributions for alternate ipsilateral leg pairs (Fig. 7) also fall intotwo groups again determined by whether or not the comparison includes leg 1. Asbefore there is greater spread in phase lag including leg 1, particularly in L. tarentula,with phase lag Ri:R3 being random (P > 005; Rayleigh test). The mean phaselag Ri :R3 and Li :L-3 differ between the species (P < 0-05, Two Sample Test). Themean phase lags for L. tarentula were close to 0-5 whilst those for T. ruricola wereclose to o, the value expected for an alternating gait. Phase-lag distributions forcomparisons not including leg 1 showed no difference between the two species anddid not differ from zero.
The possibility that phase lag might change with speed was investigated by grouping
L. tarentula
312 T. M. WARD AND W. F. HUMPHREYS
* L 2 : L 3
* L 3 : L 4P * 005
L tarentula
Fig. 6. Phase-lag (*) distributions for adjacent and adjacent-but-two ipsilateral leg painin both species of spider. Conventions follow those in Fig. 5.
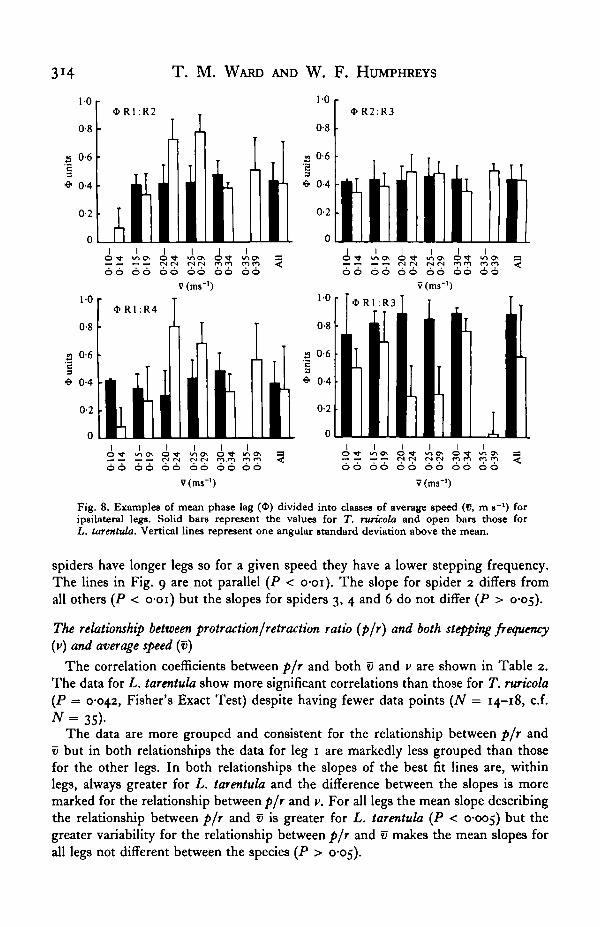
the data into classes of 0-05 m s- 1 (average speed over a filming run). Of the 16comparisons, phase lag varied significantly at least at one speed in 10 and 6 casesin L. tarentula and T. ruricola respectively (Least significant range, a = 0-05). In allbut one case (R2: R3 in L. tarentula) the significant variation of phase lag with speedoccurs in comparisons including either leg 1, leg 4 or both. It will be seen from anumber of other measurements that leg 1 is less closely coordinated than the otherlegs. Measurements on leg 4 are often ambiguous due to the high degree of legdragging being included, for functional reasons, as part of protraction. Representativeplots are shown in Fig. 8 for ipsilateral phase lags as these are more likely to showa change in phase lag with speed. The figure for OR2: R3 is typical of those foundfor contralateral phase lag whether or not leg 1 was involved. For the ipsilateralcomparisons shown in Fig. 8 R2:R3 is typical of phase lags not including leg 1.Ipsilateral phase lags including leg 1 (Ri: R2, Ri: R4, Ri: R3) show erratic changeswith speed in L. tarentula and only slight changes in T. ruricola.
Comparison of the phase lag between species over a range of speeds shows thatthe mean phase lag differs (P < 0-05) in 33% of cases {N = 80) of which 70%of the differences occur in comparisons including leg 1. The same trend is truewhen the data are not divided into speed classes.
The degree of phase locking between different leg pairs is summarised using theindex from Land (1972, p. 23). This index, which has limits of —10 and +i-o, im
Locomotion in burrowing and vagrant wolf spiders
20
3*3
15
10
I 5
0
5
10
* R 1 : R 3
P* 005
0-56
Random
-006
* L 1 : L 3P < 005
T. ruricola n .,u-ol
d-0-33
L. tartntula
20
15
10
5
0
5
10
15
T. ruricola
*R2:R4
0-89
0-74
1 0
L. tartntula
Fig. 7. Phase lag (<1>) distributions for adjacent-but-one ipsilateral leg pairs in bothspecies of spider. Conventions follow those in Fig. 5.
negative when the legs step out of phase and positive when in phase with the mag-nitude indicating the strength of this tendency. The values are shown on eachgraph in Figs. 5-7 and the mean values for different leg comparisons in Table 1,where they are compared with other values for spiders from the literature. Althoughthe degree of similarity varies according to the leg pairs considered, T. ruricolaalways has index values closer to the limits than L. tarentula (sign test; P < o-ooi)showing its overall greater degree of phase locking. The overall degree of similarity(final matrix in Table 1) shows that phase locking differs more within a family ofspiders (Lycosidae) than between the suborders represented by the mygalomorphand the salticid. While T. ruricola shows phase locking similar to the mygalomorph,L. tarentula differs markedly despite the latter having the more mygalomorph typeof life style.
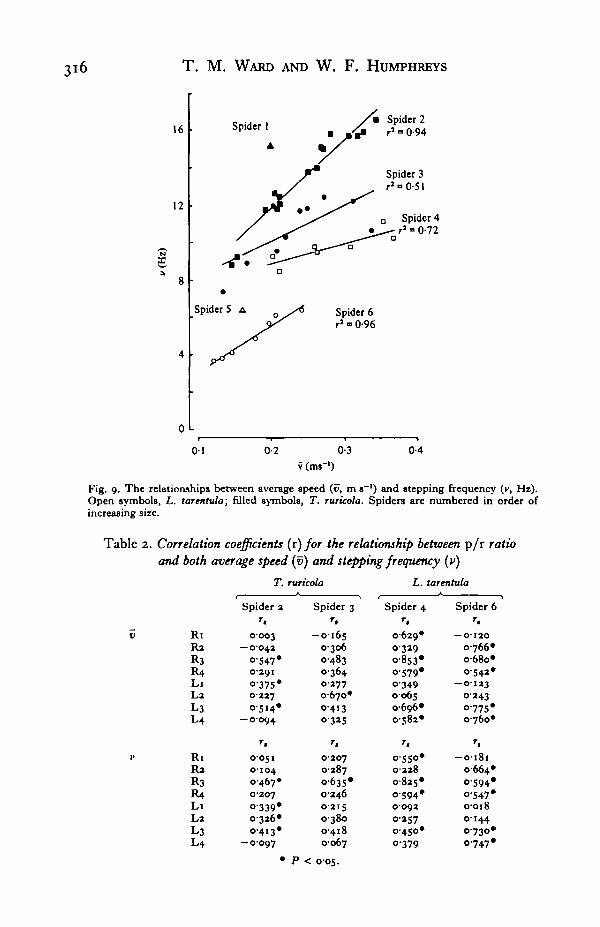
The relationship between speed (v) and stepping frequency (v)
This relationship is shown in Fig. 9 for individuals of both species. The changeIn stepping frequency with size (Fig. 4) suggests that the vertical displacement of• e graphs in Fig. 9 is primarily due to size differences between the spiders. Larger
T. M. WARD AND W. F. HUMPHREYS
10
0-8
a 0-6
1«• 0-4
0-2
0
* R 1 : R 2
II10
0-8
a 0-6•5«• 0-4
0-2
*R2:R3
11111 II l l I I I
6 6 6 6 6 6 66 66 66v (ms-1)
* R 1 : R 3
I1
I I I I I IO^t »OO O^J- W) O* O^l" ""» O
66 66 66 66 o o 66
I IO
I
oo oo oo oo oo oo
V(ms-')
Fig. 8. Examples of mean phase lag ($) divided into classes of average speed (V, m s~l) foripsilateral legs. Solid bars represent the values for T. ruricola and open bars those forL. tarentula. Vertical lines represent one angular standard deviation above the mean.
spiders have longer legs so for a given speed they have a lower stepping frequency.The lines in Fig. 9 are not parallel (P < o-oi). The slope for spider 2 differs fromall others (P < o-oi) but the slopes for spiders 3, 4 and 6 do not differ (P > 0-05).
The relationship between protraction/retraction ratio (p/r) and both stepping frequency(v) and average speed (v)
The correlation coefficients between p/r and both v and v are shown in Table 2.The data for L. tarentula show more significant correlations than those for T. ruricola(P = 0-042, Fisher's Exact Test) despite having fewer data points (N = 14-18, c.f.
N = 35)-The data are more grouped and consistent for the relationship between p/r and
v but in both relationships the data for leg 1 are markedly less grouped than thosefor the other legs. In both relationships the slopes of the best fit lines are, withinlegs, always greater for L. tarentula and the difference between the slopes is moremarked for the relationship between p/r and v. For all legs the mean slope describingthe relationship between p/r and v is greater for L. tarentula (P < 0-005) but thegreater variability for the relationship between p/r and v makes the mean slopes forall legs not different between the species (P > 0-05).
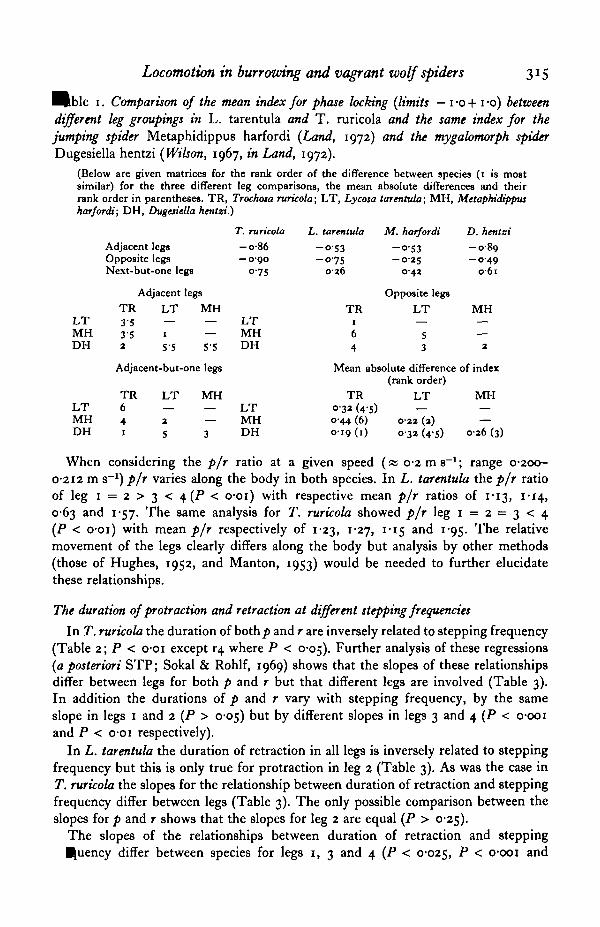
Locomotion in burrowing and vagrant loolf spiders 315
e 1. Comparison of the mean index for phase locking (limits — i-o+ i-o) betweendifferent leg groupings in L. tarentula and T. ruricola and the same index for thejumping spider Metaphidippus harfordi (Land, 1972) and the mygalomorph spiderDugesiella hentzi (Wilson, 1967, in Land, 1972).
(Below are given matrices for the rank order of the difference between species (1 is mostsimilar) for the three different leg comparisons, the mean absolute differences and theirrank order in parentheses. TR, Trochota ruricola; LT, Lycosa tarentula; MH, Metaphidippusharfordi; DH, Dugesiella hentzi.)
LTMHDH
LTMHDH
Vher
Adjacent legsOpposite legsNext-but-one legs
Adjacent legsTR LT MH35 — —35 i —a 5'5 5'5
Adjacent-but-one legs
TR LT MH6 — —4 a —' 5 3
i considering the p/r
T. rurtcola-o -86— 0-90
075
LTMHDH
LTMHDH
ratio at a
L. tarentula
- O - 5 3-075
0 2 6
TR1
64
M. harfordi-0-53-0-25
0 4 2
Opposite legsLT
53
D. hentzi-089-049
0 6 1
MH
—2
Mean absolute difference of index
TR03a (45)044 (6)0 1 9 (1)
given speed
(rank order)LT—
022 (a)032 (45)
(x 0-2 m s-1;
MH——
026 (3)
range 0-200-0212 m s-1) p/r varies along the body in both species. In L. tarentula the p/r ratioof leg 1 = 2 > 3 < 4 (P < o-oi) with respective mean p/r ratios of 1-13, 1-14,0-63 and 1-57. The same analysis for T. ruricola showed p/r leg 1 = 2 = 3 < 4(P < o-oi) with mean p/r respectively of 1-23, 1-27, 1-15 and 1-95. The relativemovement of the legs clearly differs along the body but analysis by other methods(those of Hughes, 1952, and Manton, 1953) would be needed to further elucidatethese relationships.
The duration of protraction and retraction at different stepping frequencies
In T. ruricola the duration of both/) and r are inversely related to stepping frequency(Table 2; P < o-oi except r4 where P < 0-05). Further analysis of these regressions(a posteriori STP; Sokal & Rohlf, 1969) shows that the slopes of these relationshipsdiffer between legs for both p and r but that different legs are involved (Table 3).In addition the durations of p and r vary with stepping frequency, by the sameslope in legs 1 and 2 (P > 0-05) but by different slopes in legs 3 and 4 (P < o-ooiand P < o-oi respectively).
In L. tarentula the duration of retraction in all legs is inversely related to steppingfrequency but this is only true for protraction in leg 2 (Table 3). As was the case inT. ruricola the slopes for the relationship between duration of retraction and steppingfrequency differ between legs (Table 3). The only possible comparison between theslopes for p and r shows that the slopes for leg 2 are equal (P > 0-25).
The slopes of the relationships between duration of retraction and stepping^uency differ between species for legs 1, 3 and 4 (P < 0-025, P < °-ooi and
T. M. WARD AND W. F. HUMPHREYS
16
12
Spider 1Spider 2r1 = 0-94
Spider 3r ' - O S l
D Spider 4• r1» 0-72
o
Spider 6r1 - 0-96
0-1 0-2 0-3 0-4
v(ms ')
Fig. 9. The relationships between average speed (u, m s"1) and stepping frequency (v, Hz).Open symbols, L. tarentula; filled symbols, T. ruricola. Spiders are numbered in order ofincreasing size.
Table 2. Correlation coefficients (r)for the relationship between p / r ratioand both average speed (v) and stepping frequency (v)
T. ruricola L. tarentula
R iR2
R3R4L iL 2L3L4
R iR2
R3R4L iL 2
L3L4
Spider 2
0003— 0-042
0-547*0-291O-37S*02270-514*
-0094
r,
00510-1040-467*0207O-339*0-326*0-413*
- 0 0 9 7
Spider 3
— 0-1650-3060483036402770-670*04130325
r,0-20702870-635*0-2460-215038004180067
Spider 4
0-629*03290-853*O-579*o-3490-0650-696*0-582*
r.
0-550*02280-825*O-594*0-09202570-450*0-379
Spider 6
— 0-1200-766*o-68o*0-542*
— 0-12302430-775*0-760*
r,
-01810-664*0-594*O-547*00180-1440-730*0-747*
p < 005.
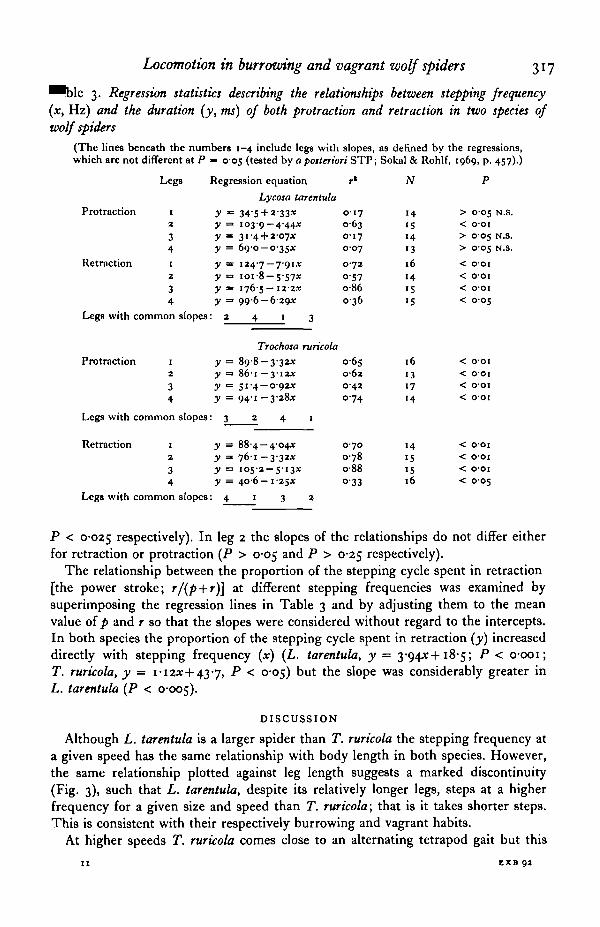
Locomotion in burrowing and vagrant wolf spiders 317
3. Regression statistics describing the relationships between stepping frequency(x, Hz) and the duration (y, ms) of both protraction and retraction in two species ofwolf spiders
(The lines beneath the numbers 1-4 include legs with slopes, as defined by the regressions,which are not different at P — 005 (tested by a posteriori STP; Sokal & Rohlf, 1969, p. 457).)
Legs Regression equation N
Protraction 12
34
Retraction 12
34
Legs with common slopes
Protraction 12
34
Legs with common slopes
Retraction 12
34
Legs with common slopes
Lycota tarentulay = 34-5 + 233*y =. 103-9-4-44*y - 31-4 + 2-07*y = 69-0 — 0-35*y = 124-7-7-91*y = 101-8-5-57*y - 176-5-12-2*y = 99-6 — 6-29*
: 2 4 1 3
Trochosa ruricola
y = 89-8-3-32*y = 861 —3-12*y = 51-4-0-92*y = 94-1-3-28*
: 3 2 4 1
y = 88-4 — 4-04*y = 76-1-3-32*y = 105-2-5-13*y = 406— 125*
• • 4 1 3 2
0 1 70 6 30 1 70 0 7
0 7 2
°-570 8 60 3 6
0 6 5
0-620 4 20 7 4
0 7 00 7 8
o-88o-33
14IS1413
16
1415>S
16
131714
14151516
> OO5 N.S< 001
> 005 N.S> 005 N.S< OOI< OOI< OOI< OO5
< o-oi< o-oi< o-oi< o-oi
< OOI< o-oi< o-oi< 0-05
P < 0-025 respectively). In leg 2 the slopes of the relationships do not differ eitherfor retraction or protraction (P > 0-05 and P > 0-25 respectively).
The relationship between the proportion of the stepping cycle spent in retraction[the power stroke; r/(p + r)] at different stepping frequencies was examined bysuperimposing the regression lines in Table 3 and by adjusting them to the meanvalue of p and r so that the slopes were considered without regard to the intercepts.In both species the proportion of the stepping cycle spent in retraction (y) increaseddirectly with stepping frequency (x) (L. tarentula, y = 3'94x+i8-5; P < o-coi;T. ruricola, y = 1-12*+437, P < 0-05) but the slope was considerably greater inL. tarentula (P < 0-005).
DISCUSSION
Although L. tarentula is a larger spider than T. ruricola the stepping frequency ata given speed has the same relationship with body length in both species. However,the same relationship plotted against leg length suggests a marked discontinuity(Fig. 3), such that L. tarentula, despite its relatively longer legs, steps at a higherfrequency for a given size and speed than T. ruricola; that is it takes shorter steps.This is consistent with their respectively burrowing and vagrant habits.
At higher speeds T. ruricola comes close to an alternating tetrapod gait but this
II KXB 92
318 T . M. WARD AND W. F. HUMPHREYS
does not occur in L. tarentula. Comparison of the phase lags shows that they vaflmarginally with speed in both species but that ipsilateral phase lags including leg iare erratic in L. tarentula, that they differ significantly between species, and thatin both species leg i is less closely coordinated than the other legs (Wilcoxon's signedrank test P < 0-05 in both species: mean absolute phase lock index +S.E.M. foiipsilateral leg comparisons including leg 1 - T. ruricola = 0-64 ± 0-04, L. tarentula =020±008; not including leg 1 - T. ruricola 0-92 + 0-02, L. tarentula 074 + 0-05).
The protraction/retraction ratio is directly related to running speed and steppi'ngfrequency in both species but both relationships increase more rapidly with speedin L. tarentula. The ratio is more variable in leg 1 than in the other legs and it variesbetween legs along the body in both species but this tendency is more marked inL. tarentula.
The two species differ in their relationships between the duration of both protractionand retraction and the stepping frequency. In T. ruricola, both p and r are inverselyrelated to stepping frequency, unlike in many insects where the duration of p ismuch less sensitive to stepping frequency (Burns, 1973; Harris & Ghiradella, 1980)and are thus more similar to L. tarentula. This inverse relationship between theduration of protraction and stepping frequency may result from the inclusion ofleg-drag as part of protraction but this interpretation is functionally realistic. Whereasthe jumping spider (Land, 1972) and mygalomorph (Wilson, 1967) engaged inretraction (power stroke) for about 70% of the stepping cycle irrespective of therate of stepping, in both L. tarentula and T. ruricola retraction as a proportion ofthe stepping cycle increased directly with stepping frequency but neither specie9reached the 70% reported for the other species [mean and range of r/(p + r): L.tarentula 0-56 (0-47-0-66); T. ruricola 0-58 (0-54-0-62)].
Some of the differences between the parameters measured here and those inother studies may result from the lower filming speeds used in most other studies,particularly p/r ratios as they are very sensitive to filming speed. The effects offilming speed on interpretation of gait is considered elsewhere (Ward & Humphreys,1981) where it is shown that the maximum sampling error in this study is about3%-
The main interspecific difference is the lower ipsilateral coordination of leg 1 inL. tarentula, which suggests that this species relies mainly on the hind three pairsof legs for support and propulsion during locomotion. A gait which used only threeleg pairs would be similar to the alternating tripod gait of insects. This gait hascontralateral and adjacent ipsilateral phase lag close to 05 and alternate ipsilateralphase lag close to zero. The mean contralateral and adjacent ipsilateral phase lagfor the three hind-leg pairs are close to 0-5 in both species. This suggests that bothspecies are adapted to use leg 1 for purposes other than support. Figs 5 and 6 supportthis by showing that legs 2, 3 and 4 alternate with a phase lag of 05 but that leg 1has a variable phase lag during runs. The markedly lower coordination of leg 1 inL. tarentula indicates that this species uses this pair of legs more for non locomotorypurposes, possibly sensory, than does T. ruricola but in both species support andpropulsion are provided mainly by the hind three pairs of legs.
The above interpretation is similar to that proposed by Burns (1973) in hiacomparison of locusts and grasshoppers. Locusts have short antennae which am
Locomotion in burrowing and vagrant zvolf spiders 319in flight but do not function as tactile receptors while walking so this function
is taken over by the prothoracic legs. The long antennae of grasshoppers are usedduring walking so the prothoracic legs are not required for sensory input. He con-sidered that these functional differences could account for the different gait character-istics of the prothoracic legs in the locust. Using force-print analysis Harris &Ghiradella (1980) concluded that the prothoracic legs of the cricket Acheta domesticuswere more involved in balancing or searching than in propulsion.
Hexapody has been reported amongst the arachnids in amblypygids (Manton,1973) where leg 1 is greatly elongated and has a sensory function, being able toswing and feel all around the animal. Locomotory function is thus restricted to thethree hind pairs of legs. The sensitive antennae characteristic of insects are notpresent in arachnids so a multipurpose front leg including a major sensory componentwould seem a practical adaptation for the arachnids. In lycosids agonistic behaviouroften includes stereotyped movement of the front legs. Front leg waving forms animportant part of the precopulatory display in Lycosa rabida and during forelegwaving the female may take several steps (Rovner, 1968). Anterior legs provideinitial contact during prey capture and adhesive hairs are localized on them (Rovner,1978). Spiders detect web vibrationp using the lyriform organs on their legs (Walcott,1969) and with such sensory input they can orientate towards their prey (Barth &Seyfarth, 1971).
The tarantula (Dugesiella hcntzi) shows a wide range of gaits and, although alter-nating patterns dominate, coordination across the body is poor (Wilson, 1967). Re-examination of his data for normal animals shows modal values for adjacent ipsilateralphase lag close to 0-375, the value expected for an animal using eight legs for locomotionbut which has only three legs on the ground at any moment. Wilson's data do notsuggest any differences between the coordination of leg 1 and the other legs butthey do show such a difference for the pedipalps. This suggests that the pedipalps,which are much longer than in the lycosids, may perform the same (sensory?) functionas the first leg pair in L. tarentula.
Comparison of the data reported here with those of Manton (1973) shows severalareas of disagreement. This is probably due to the inadequate sampling speedsused by Manton (Ward & Humphreys, 1981). The p/r ratios she quoted for thelow speeds in T. ruricola seem in general agreement with extrapolations of valuesobtained here. However, the maximum p/r she quotes is 0-87; the lack of valuesgreater than i-o suggests that the filming speed was too low and 32 f.p.s. is clearlytoo slow to determine accurately p/r ratios (Ward & Humphreys, 1981).
Manton reported phase lags close to 0-5 but did not consider phase lag differencesbetween different legs. Phase lag varied marginally but significantly with speed inboth T. ruricola and L. tarentula except when the phase lag included leg 1, in whichcases the change with speed was both considerable and erratic for ipsilateral legs ofL. tarentula. These observations are not consistent with other data for spiders(Wilson, 1967) or cockroaches (Delcomyn, 1971a) where no change in phase lagwas detected with varying stepping frequency.
Hexapody has been reported in some arachnid groups (Pedipalpi and Solifugae)|rom observation of limb use rather than film analysis (Manton, 1973) and can now"be extended to the lycosidae. The different degrees of hexapody seen in the two
320 T . M. WARD AND W. F. HUMPHREYS
species of lycosids suggest that the mechanism for generating gaits is highly adaptabUand this is supported by the ease with which spiders compensate for limb loss(Wilson, 1967).
We thank John Wilson of the Educational Services Department for advice onfilming and assistance with equipment, Jim Knight for his patient technical support,and Dr Merrett and Professor Tongiorgi for confirming the species. Beverley Riddelldrew some of the figures and Eva Ioannidis typed the manuscript. Lycosa tarentulawere collected while W. F. Humphreys was in receipt of a Royal Society TravelGrant.
REFERENCES
AYERS, J. L. & DAVIS, W. J. (1977). Neuronal control of locomotion in the lobster Homarui americanus:I. Motor programmes for forward and backward walking. J. comp. Physiol. A 115, 1-28.
BARNES, W. J. P. (1975). Leg coordination during walking in the crab, Uca pugnux. J. comp. Phytiol.96, 237-356.
BARTH, F. G. & SEYFARTH, E. A. (1971). Slit sense organs and kinesthetic orientation. Z. vergl. Pkyriol.74, 32^-328.
BATSCHELET, E. (1965). Statistical Methods for the Analysis of Problems in Animal Orientation andCertain Biological Rhythms. American Institute of Biological Science, Washington.
BOWBRMAN, R. F. (1975 a). The control of walking in the Scorpion I. Leg movements during normalwalking. J. comp. Physiol. ioo, 183-196.
BOWERMAN, R. F. (19756). The control of walking in the Scorpion II. Coordination modification asa consequence of appendage ablation. J. comp. Physiol. 100, 197-200.
BOWERMAN, R. F. (1977). The control of arthropod walking. Comp. Biochem. Physiol. 56./!, 231-247.BURNS, M. D. (1973). The control of walking in Orthoptera I, leg movements during normal walking.
Jf. exp. Biol. 58, 45-58.BURROWS, M. & HOYLE, G. (1973). The mechanism of rapid running in the ghost crab (Octpode
ceratophthalma). J. exp. Biol. 58, 327-349.DBLCOMYN, F. (1971a). The locomotion of the cockroach Periplancta americana J. exp. Biol. $4,
443-452-DELCOMYN, F. (1971 b). The effect of limb amputation in the cockroach, Peripljneta americana J. exp.
Biol. 54. 453-469.GRAHAM, D. (1972). A behavioural analysis of the temporal organisation of walking movements in
the fifth instar adult stickinsect. J. comp. Physiol. 81, 23-52.GRAHAM, D. (1977). The effect of amputation and leg restraint on the free walking coordination of
the stickinsect Carausius morosus. J. comp. Physiol. A 116, 91—116.GRAHAM, D. (1978). Unusual step patterns in the free walking grasshopper, Neoconocephalus robustus.
I. general features of the step patterns. J. exp. Biol. 73, 147—157.HARRIS, J. (1978). A photoelastic substrate technique for dynamic measurements of forces exerted by
moving organisms. J. Microscopy 114, pt 2, 219—228.HARRIS, J. & GHIRADBLLA, H. (1980). The forces exerted on the substrate by walking and stationary
crickets. J. exp. Biol. 85, 263-279.HUGHES, G. M. (1952). The coordination of insect movements. I. The walking movements of insects.
J. exp. Biol. 29, 267-284.HUMPHREYS, W. F. (1978). The thermal biology of Geolycosa godeffroyi and other burrow inhabiting
Lycosidae (Araneae) in Australia. Oecologia, Berl. 31, 319—347.LAND, M. F. (1972). Stepping movements made by jumping spiders during turns mediated by the
lateral eyes. J. exp. Biol. 57, 15-40.MACMIIXAN, D. L. (1975). A physiological analysis of walking in the american lobster (Homarut
americanus). Phil. Trans. R. Soc. B 270, 1-59.MANTON, S. M. (1953). Locomotory habits and the evolution of the larger arthropodan groups. Symp.
Soc. exp. Biol. no. 7, 339-376.MANTON, S. M. (1973). The evolution of arthropodan lcomotory mechanisms. II. Zool. J. Unn. Soc.
53. 257-375-MARDIA, K. V. (1972). Statistics of Directional Data. London and New York: Academic Press.PEARSON, K. G. & ILES, J. F. (1973). Nervous mechanisms underlying inter segmental coordination
on leg movements during walking in the cockroach. J. exp. Biol. 58, 725-744.REISKIND, J. (1969). Stereotyped burying behaviour in Sicarhts. Am. Zool. 9, 195-200.
Locomotion in burrowing and vagrant zoolf spiders 321
•boT, T. M. & BOWERMAN, R. F. (1978). Intra-appendage movements during walking in the scorpionHadrurus arizonensis. Comp. Biochem. Physiol. 59 A, 49-56.
ROVNBR, J. S. (1968). Analysis of display in the lycosid spider Lycota rabida. Amm. Behav. 16, 358—369-
ROVNER, J. S. (1978). Adhesive hairs in spiders. Behavioural functions and hydraulically mediatedmovements. Symp. Zoo. Soc. Lond. 4a, 99-108.
SOKAL, R. R. & ROHLF, F. J. (1969). Biometry - the Principles and Practice of Statistic! in BiologicalResearch. San Francisco: W. H. Freeman.
SPIRITO, C. P. & MUSHRUSH, D. L. (1979). Interlimb coordination during slow walking in the cock-roach. I. Effects of substrate alterations. J. exp. Biol. 78, 233-243.
WALCOTT, C. (1969). A spider's vibration receptor: its anatomy and physiology. Am. Zool. 9, 133-144.WARD, T. M. & HUMPHREYS, M. F. (1981). The effect of filming speed on the interpretation of arthropod
locomotion. J. exp. Biol. 9a, 323-331.WILSON, D . M. (1966). Insect walking. A. Rev. Ent. II, 103-122.WILSON, D. M. (1967). Stepping patterns in tarantula spiders. J. exp. Biol. 47, 133-151.