Embed Size (px)
Citation preview

• Gazdaságtudományi Kar• Gazdaságelméleti és Módszertani Intézet
Logistic regression
Quantitative Statistical MethodsDr. Szilágyi Roland

• Gazdaságtudományi Kar• Gazdaságelméleti és Módszertani Intézet
Independent variable(x)
Qualitative Quantitative
De
pe
nd
en
t(y
)
Qu
alit
ativ
e
crosstabsDiscriminant-analysis,
Logistic regression
Qu
anti
t
ativ
e
ANOVACorrelation-, regression
analysis
Connection Analysis

• Gazdaságtudományi Kar• Gazdaságelméleti és Módszertani Intézet
Logistic regression• The Logistic regression is a multivariate method
that helps to predict the classification of casesinto groups on the basis of independent variables.So those independent variables (x) are identifiedin the analysis, which cause significant differencein the dependent variables categories .
– binary (the dependent variable has two categories)
– Multinomial

• Gazdaságtudományi Kar• Gazdaságelméleti és Módszertani Intézet
Logistic regression in practice
• Market research
• Modelling (by or no)
• Segmentation reliability
• Enterprise analysis (default, non default)
• etc.

• Gazdaságtudományi Kar• Gazdaságelméleti és Módszertani Intézet
Stages of Analysis
1• General Purpose
2• Assumptions
3• Estimaton of Function Coefficients
4• Interpretation of Results
5• Validity Tests

• Gazdaságtudományi Kar• Gazdaságelméleti és Módszertani Intézet
General purposes• To create logistic regresion function, which is the best
split of the categories of dependent variables as linear combination of independent variables.
• To determine whether there is a significant difference among groups according to independent variables.
• To determine which independent variables explain the most the differences among groups.
• Based on the experience obtained by a known classification, we can predict the group membership of new cases analyzing their independent variables.
• To measure the accuracy of classification

• Gazdaságtudományi Kar• Gazdaságelméleti és Módszertani Intézet
The Assumptions for Logistic regression1. Measure of variables
• The dependent variable should be categorized by m (at least 2) text values (e.g.: 1-good student, 2-bad student; or 1-prominent student, 2-average, 3-bad student).
• Independent variables could be measuredon whatever scale.

• Gazdaságtudományi Kar• Gazdaságelméleti és Módszertani Intézet
The Assumptions for Logistic regression2. Independence
Not only the explanatory variables, but also all
cases must be independent. Therefore,
panel, longitudinal research, or pre-test data
cannot be used for logistic regression
analysis.

• Gazdaságtudományi Kar• Gazdaságelméleti és Módszertani Intézet
The Assumptions for Logistic regression3. Sample size
It is a general rule, that the larger is the sample size, the more significant is the model. The ratio of number of data to the number of variables is also important. The results can be more generalized if we have at least 60 observations.

• Gazdaságtudományi Kar• Gazdaságelméleti és Módszertani Intézet
The Assumptions for Logistic regression4. Multivariate normal distribution
In case of normal distribution, the estimation of parameters are easier, because the parameters can be defined according to the density or distribution function. It can be tested by histograms of frequency distributions or hypothesis testing.

• Gazdaságtudományi Kar• Gazdaságelméleti és Módszertani Intézet
The Assumptions for Logistic regression5. Multicollinearity
Independent variables should be correlated to the dependent variable, however there must be no correlation between the independent variables, because it can bias the results of analysis.

• Gazdaságtudományi Kar• Gazdaságelméleti és Módszertani Intézet
Binary Logistic Regression• The logistic function is useful because it can take any
input linear combination of independent variables (Xi),
whereas the output always takes values between zero
and one and hence is interpretable as a probability. The
logistic function is defined as follows:
• Note that F(x) is interpreted as the probability of the
dependent variable equaling a "success" or "case" ratherthan a failure or non-case.
pp
pp
xx
xx
xe
eF
...
...
)(110
110
1
)1( XYP i

• Gazdaságtudományi Kar• Gazdaságelméleti és Módszertani Intézet
Binary Logistic Regression
• We can now define the inverse of the logistic
function, the „logit” (log odds):
pp
x
xxx
F
FY ...
1ln 110
)(
)(
ppxx
x eodds
...110
after exponentiating

• Gazdaságtudományi Kar• Gazdaságelméleti és Módszertani Intézet
Binary Logistic Regression
• „The odds of the dependent variable
equaling a case (given some linearcombination xi of the predictors) is
equivalent to the exponential function of
the linear regression expression
x
x
xP
Podds
1

• Gazdaságtudományi Kar• Gazdaságelméleti és Módszertani Intézet
Binary Logistic Regression
pp
pp
xx
xx
xe
eP
...
...
110
110
1
x
x
xP
Podds
1

• Gazdaságtudományi Kar• Gazdaságelméleti és Módszertani Intézet
Maximum Likelihood Method
• The maximum likelihood method finds a set of coefficients (β), called the maximum likelihood estimates, at which the log-likelihood function attains its local maximum:
Forrás: Hajdu Ottó: Többváltozós statisztikai számítások; KSH, Budapest, 2003.
max11
...
...
110
110
n
ixx
xx
pp
pp
e
eL

• Gazdaságtudományi Kar• Gazdaságelméleti és Módszertani Intézet
Tests of Model Fit
The Binary Logistic Regression procedure reports the Hosmer-Lemeshow goodness-of-fit statistic. Ithelps you to determine whether the model adequately describes the dataHo: model fitsH1: model don’t fitThe Hosmer–Lemeshow test specifically identifies subgroups deciles of fitted risk values. Models for which expected and observed event rates in subgroups are similar (khi square) are called fitted (well calibrated).

• Gazdaságtudományi Kar• Gazdaságelméleti és Módszertani Intézet
Testinf of parameters (β)
0:
0:
1
0
i
i
H
H
2
i
ii
)s(b
b=Wald
• Gazdaságtudományi Kar• Gazdaságelméleti és Módszertani Intézet
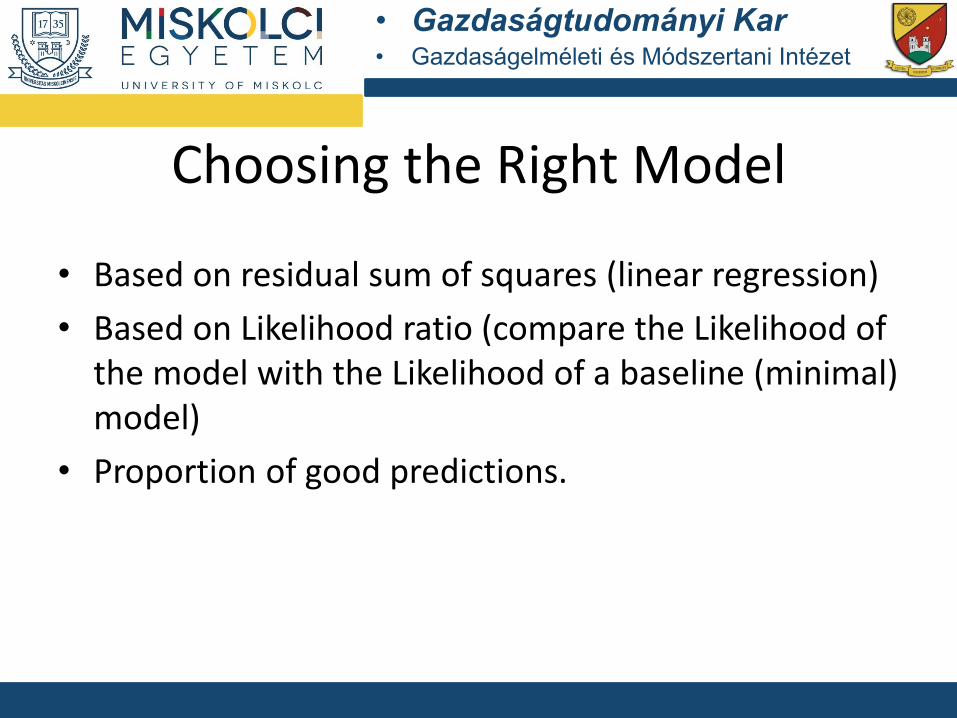
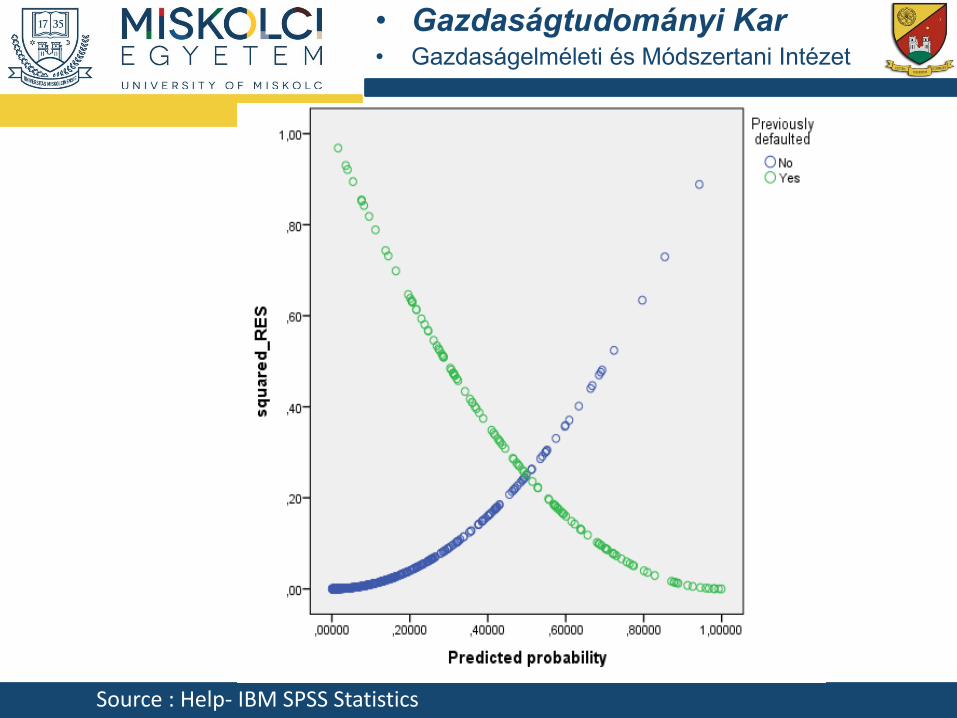
Choosing the Right Model
• Based on residual sum of squares (linear regression)
• Based on Likelihood ratio (compare the Likelihood of the model with the Likelihood of a baseline (minimal) model)
• Proportion of good predictions.

• Gazdaságtudományi Kar• Gazdaságelméleti és Módszertani Intézet
Pseudo R2
• Cox and Snell's R2 is based on the log likelihood for the model compared to the log likelihood for a baseline model. However, with categorical outcomes, it has a theoretical maximum value of less than 1, even for a "perfect" model.
• Nagelkerke's R2 is an adjusted version of the Cox & Snell R-square that adjusts the scale of the statistic to cover the full range from 0 to 1.

• Gazdaságtudományi Kar• Gazdaságelméleti és Módszertani Intézet
Example
• If you are a loan officer at a bank, then you want to be able to identify characteristics that are indicative of people who are likely to default on loans, and use those characteristics to identify good and bad credit risks. Variables
Age in years
Level of education
Years with current employer
Years at current address
Household income in thousands
Debt to income ratio (x100)
Credit card debt in thousands
Other debt in thousands
Previously defaulted

• Gazdaságtudományi Kar• Gazdaságelméleti és Módszertani Intézet
Outputs
Classification Tablea,b
Observed
Predicted
Selected Casesc Unselected Casesd,e
Previously defaulted Percenta
ge Correct
Previously defaulted Percenta
ge CorrectNo Yes No Yes
Step 0Previouslydefaulted
No 375 0 100,0 142 0 100,0
Yes 124 0 ,0 59 0 ,0
Overall Percentage 75,2 70,6
a. Constant is included in the model.
b. The cut value is ,500
Source: Help- IBM SPSS Statistics

• Gazdaságtudományi Kar• Gazdaságelméleti és Módszertani Intézet
Hosmer and Lemeshow TestStep Chi-square df Sig.1 3,292 8 ,9152 11,866 8 ,1573 9,447 8 ,3064 4,027 8 ,855
Source: Help- IBM SPSS Statistics

• Gazdaságtudományi Kar• Gazdaságelméleti és Módszertani Intézet
Model Summary
Step-2 Log
likelihoodCox & Snell R
SquareNagelkerke R
Square1 498,012a ,116 ,172
2 447,301b ,201 ,299
3 411,553b ,257 ,381
4 394,721c ,281 ,417
Source : Help- IBM SPSS Statistics

• Gazdaságtudományi Kar• Gazdaságelméleti és Módszertani Intézet
Classification Tablea
Observed
Predicted
Selected Casesb Unselected Casesc,d
Previously defaultedPercentage
Correct
Previously defaultedPercentage
CorrectNo Yes No Yes
Step 1
Previouslydefaulted
No 361 14 96,3 137 5 96,5Yes 100 24 19,4 45 14 23,7
Overall Percentage 77,2 75,1
Step 2
Previously defaulted
No 351 24 93,6 136 6 95,8Yes 80 44 35,5 36 23 39,0
Overall Percentage 79,2 79,1
Step 3
Previously defaulted
No 348 27 92,8 135 7 95,1Yes 72 52 41,9 28 31 52,5
Overall Percentage 80,2 82,6
Step 4
Previously defaulted
No 352 23 93,9 130 12 91,5Yes 67 57 46,0 27 32 54,2
Overall Percentage 82,0 80,6
a. The cut value is ,500

• Gazdaságtudományi Kar• Gazdaságelméleti és Módszertani Intézet
Classification table (Confusion matrix)
(predicted)
no (0) yes (1)
(observed)
no (0) true negative (TN)False positive (FP)
Type I
→specificity
TN/(TN+FP)
yes (1)False negative (FN)
Type IITrue positive (TP)
→ sensitivity
TP/(FN+TP)
↓
negative predictive
value
TN/(TN+FN)
↓
positive predictive
value (precision)
TP/(FP+TP)
accuracy
(TP+TN)/
(TN+FP+FN+TP)

• Gazdaságtudományi Kar• Gazdaságelméleti és Módszertani Intézet
Variables in the Equation
B S.E. Wald df Sig. Exp(B)95% C.I.for EXP(B)Lower Upper
Step 1a Debt to income ratio (x100) ,121 ,017 52,676 1 ,000 1,129 1,092 1,166
Constant -2,476 ,230 116,315
1 ,000 ,084
Step 2b Years with current employer -,140 ,023 38,158 1 ,000 ,869 ,831 ,909
Debt to income ratio (x100) ,134 ,018 54,659 1 ,000 1,143 1,103 1,185
Constant -1,621 ,259 39,038 1 ,000 ,198
Step 3c Years with current employer -,244 ,033 54,676 1 ,000 ,783 ,734 ,836
Debt to income ratio (x100) ,069 ,022 9,809 1 ,002 1,072 1,026 1,119
Credit card debt in thousands ,506 ,101 25,127 1 ,000 1,658 1,361 2,021
Constant -1,058 ,280 14,249 1 ,000 ,347
Step 4d Years with current employer -,247 ,034 51,826 1 ,000 ,781 ,731 ,836
Years at current address -,089 ,023 15,109 1 ,000 ,915 ,875 ,957
Debt to income ratio (x100) ,072 ,023 10,040 1 ,002 1,074 1,028 1,123
Credit card debt in thousands ,602 ,111 29,606 1 ,000 1,826 1,470 2,269
Constant -,605 ,301 4,034 1 ,045 ,546

• Gazdaságtudományi Kar• Gazdaságelméleti és Módszertani Intézet
Meaning of coefficients
• The meaning of a logistic regression coefficient is not as straightforward as that of a linear regression coefficient. While B is convenient for testing the usefulness of predictors, Exp(B) is easier to interpret. Exp(B) represents the ratio-change in the odds of the event of interest for a one-unit change in the predictor (Xi ) CeterisParibus (all other things being equal).
Source : Help- IBM SPSS Statistics
• Gazdaságtudományi Kar• Gazdaságelméleti és Módszertani Intézet
Source : Help- IBM SPSS Statistics

• Gazdaságtudományi Kar• Gazdaságelméleti és Módszertani Intézet
Thank you for your attention!
email: [email protected]


![The Logistic Function - mygeodesy.id.au Logistic Function.pdf · courbe logistique [the logistic curve]. The properties of the logistic curve are derived and a general equation developed](https://img.pdfslide.net/doc/110x75/5b95cda609d3f2c2678cb9ab/the-logistic-function-logistic-functionpdf-courbe-logistique-the-logistic.jpg)