Embed Size (px)
Citation preview
1
LONG FIBER ORIENTATION AND STRUCTURAL ANALYSIS USING MOLDEX3D, DIGIMAT AND ABAQUS SIMULATIONS Huan-Chang Tseng, Chia-Hsiang Hsu, and Rong-Yeu Chang
CoreTech System (Moldex3D) Co., Ltd., ChuPei City, Hsinchu, 30265, Taiwan
Abstract
Long fiber-reinforced thermoplastic composites open up exciting new possibilities for the green automotive industry, owing to excellent mechanical properties, advantageous weight reduction, and economical fuel consumption. However, fiber microstructure including fiber orientation and fiber length, is a very critical issue to cause anisotropy in mechanical properties and warps. For an injection-molded, long-glass fiber composite part, we use Moldex3D to obtain an accurate fiber orientation prediction. Thus, mechanical properties depending on the predicted orientation is calculated via Digimat. It is ultimate to explore changes in stress with respect to strain in the ABAQUS structural analysis. All of the predictions are compared with experiments herein.
Introduction
The use of long fiber-reinforced thermoplastics (LFRT) now has continued growth, especially in automotive application. The most commonly used LFRT composites are usually processed by injection molding with ease, rapid, and economics. Reinforcements added to thermoplastics result in a composite material having greatly enhanced mechanical properties. However, fiber microstructure, which includes fiber orientation (alignment) and fiber degradation (breakage), markedly affects the mechanical properties, namely, strength, stiffness, and impact. It is important to get insight into the change of fiber microstructure during flow.
Fiber orientation in a general fluid is very complex. Over the last three decades, great efforts in fiber suspension rheology of theoretical research have been successfully able to describe the flowing-induced variation in fiber orientation. Previously, the famous fiber orientation models, which contain the Folgar-Tucker model [1], the RSC (Reduced Strain Closure) model [2], and ARD (Anisotropic Rotary Diffusion) model [3], have been used available in computer-aided engineering (CAE) software of injection molding. Based on the ARD-RSC [3], the iARD-RPR model (known as Improved Anisotropic Rotary Diffusion model combined with Retarding Principal Rate model) developed by Tseng et
al. [4] is suitable for predicting the core-shell structure orientation structure of both short and long fibers filled materials.
Fiber breakage always occurs during the molding process. In order to measure fiber length, both number-average and weight-average methods are adopted. It is significant that the number average fiber length can be reduced from 12mm to about 1 mm. Some benefits of long FRT products, such as better mechanical properties, better impact resistance, and enhanced creep performance, have been reported. Therefore, this length reduction decreases the reinforcement efficiency of the fibers. During injection molding process, the screw-induced attribution in fiber length is more violent than mold filling stage. For theoretical research, the fiber length attrition model [5] along with fiber orientation models was significantly implemented by Phelps et al.
Currently, accurate 3D mesh computation has been found to be preferable for analyzing complex geometric parts since it is superior to the Hele-Shaw approximation. Unfortunately, thus far, commercial injection molding programs based on these famous theoretical models of fiber orientation in 3D numerical simulations of injection molding have not proved satisfactory. Also, the attrition or breakage history of fiber length or fiber aspect ratio on mechanical properties has not yet been discussed in relation to the theoretical predictions.
For a familiar long-fiber composite, our primary objective is therefore to promulgate accurate predictions regarding fiber orientation and fiber length in 3D injection molding simulations by using the iARD-RPR model and the Tucker-Phelps fiber length attrition model. These predicted microstructure data are further provided to calculate the mechanical properties. The ultimate result is to present mechanical testing of stress-strain response depending on the microstructures. In addition, all of the predictions, including: fiber orientation, fiber length, mechanical properties and stress-strain response, are compared to related experimental validations.
SPE ANTEC® Anaheim 2017 / 939
- 2 -
Theory of Fluid Mechanics Polymeric fluids are generally assumed as
Generalized Newtonian Fluid (GNF). The governing equations to describe the transient and non-isothermal flow motion for center gated disk are shown, as follows:
0=r×Ñ+¶r¶ ut
, (1)
gσuuu rrr =-×Ñ+¶¶ )()(t
, (2)
)( Tp uuIσ Ñ+Ñ+-= h , (3)
2γ)( !hr +Ñ×Ñ=÷øö
çèæ Ñ×+¶¶ TkTtTCP u , (4)
where r is density; u is velocity vector; t is time; σ
is total stress tensor; u is acceleration vector of gravity; p
is pressure; h is viscosity; Cp is specific heat; T is
temperature; k is thermal conductivity; γ! is shear rate.
Finite Volume Method (FVM) due to its robustness and
efficiency is employed to solve the transient flow field in
a three-dimensional geometry with complex.
Model of Fiber Orientation
A single fiber is regarded as an axisymmetric bond
with rigidness. The bond’s unit vector p along its axis
direction can describe fiber orientation. Advani and
Tucker [6] defined the second order orientation tensor as:
ò= ppppA d)(y (5)
where )(py is the probability density distribution
function over orientation space.
Tseng et al. [4] developed the a new fiber
orientation model to couple with Jeffery's hydrodynamic
(HD) model, namely, the iARD-RPR model (known as
Improved Anisotropic Rotary Diffusion model combined
with Retarding Principal Rate model),
)(),( RPRiARDHD aAAAA !!!! ++= MI CC (6)
where A! represents the material derivative of A.
Parameters CI and CM describe the fiber-fiber interaction
and fiber-matrix interaction, while parameter α can slow
down a response of fiber orientation. Details of the RPR
model and the iARD model are available elsewhere [4].
A mean fiber length is described by number average LN and weight average LW, as follows:
å
å
=
== N
ii
N
iii
N
N
lNL
1
1 (7)
å
å
=
== N
iii
N
iii
W
lN
lNL
1
1
2
(8)
where Ni represent the expected value of the number of fibers of length li in a sample taken from a small region. Note that lili D= , lD is the discretized length
segment, namely, NLl t /=D , Lt is the initial total length, N is number of segment.
Phelps et al. [5] described the change rate of the number of fibers with length li, called as the fiber length attrition model:
å=
+-=N
kkikiii NRNPN
1
! (9)
),2,( kk
inormik SlllNR = (10)
ikiki RR )( -= (11)
å=
=N
kiji PR
1
2 (12)
where Pi is a breakage probability for parent fibers of
length li at time Δt; Rik is the rate of production of child
fibers of length li by breaking parent fibers of length lk,
thus with the mass conservation law. Rik is given by the
normal distribution function with mean and variance.
Furthermore, the probability of fiber breakage can be expressed by the Dinh-Armstrong hydrodynamic compression force Fi and the Euler critical buckling force Fcrit , as below,
)]1exp(1[crit
ibi F
FCP --= g! (13)
where bC is a scales of the breakage rate [5]; Details of fiber length attrition model are available elsewhere.
SPE ANTEC® Anaheim 2017 / 940
- 3 -
Results and Discussion
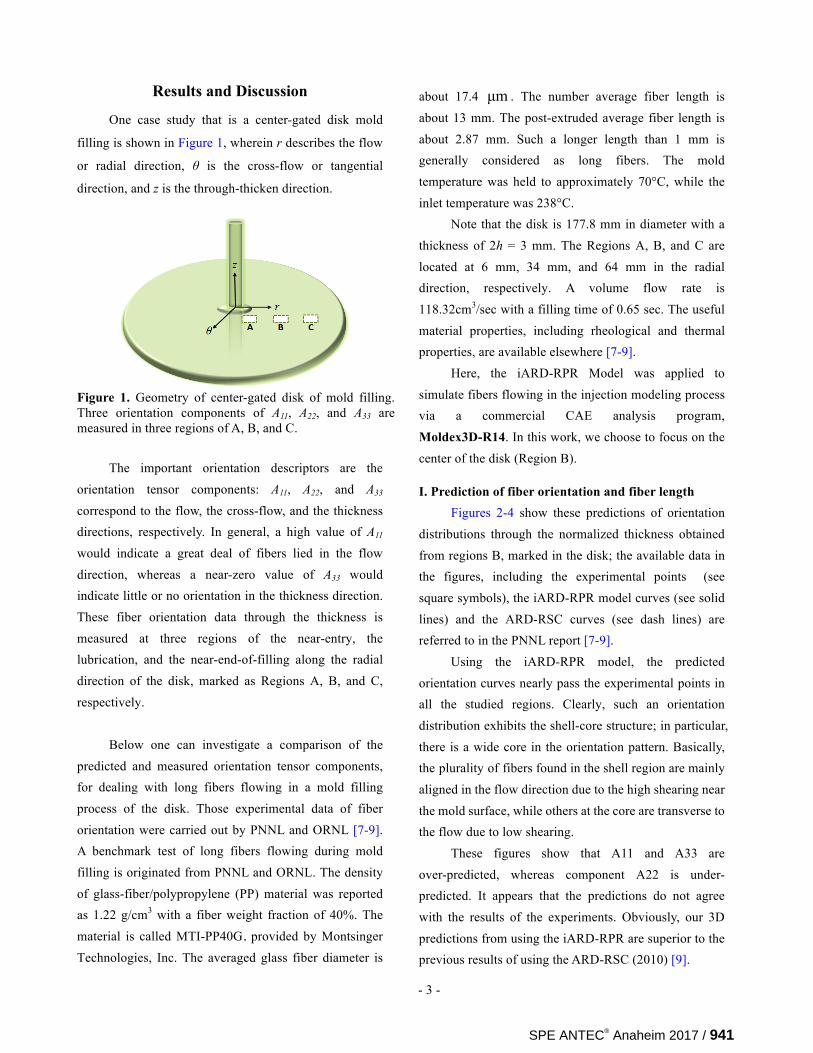
One case study that is a center-gated disk mold
filling is shown in Figure 1, wherein r describes the flow
or radial direction, θ is the cross-flow or tangential
direction, and z is the through-thicken direction.
Figure 1. Geometry of center-gated disk of mold filling. Three orientation components of A11, A22, and A33 are measured in three regions of A, B, and C.
The important orientation descriptors are the
orientation tensor components: A11, A22, and A33 correspond to the flow, the cross-flow, and the thickness directions, respectively. In general, a high value of A11 would indicate a great deal of fibers lied in the flow direction, whereas a near-zero value of A33 would indicate little or no orientation in the thickness direction. These fiber orientation data through the thickness is measured at three regions of the near-entry, the lubrication, and the near-end-of-filling along the radial direction of the disk, marked as Regions A, B, and C, respectively.
Below one can investigate a comparison of the
predicted and measured orientation tensor components, for dealing with long fibers flowing in a mold filling process of the disk. Those experimental data of fiber orientation were carried out by PNNL and ORNL [7-9]. A benchmark test of long fibers flowing during mold filling is originated from PNNL and ORNL. The density of glass-fiber/polypropylene (PP) material was reported as 1.22 g/cm3 with a fiber weight fraction of 40%. The material is called MTI-PP40G, provided by Montsinger Technologies, Inc. The averaged glass fiber diameter is
about 17.4 µm . The number average fiber length is about 13 mm. The post-extruded average fiber length is about 2.87 mm. Such a longer length than 1 mm is generally considered as long fibers. The mold temperature was held to approximately 70°C, while the inlet temperature was 238°C.
Note that the disk is 177.8 mm in diameter with a thickness of 2h = 3 mm. The Regions A, B, and C are located at 6 mm, 34 mm, and 64 mm in the radial direction, respectively. A volume flow rate is 118.32cm3/sec with a filling time of 0.65 sec. The useful material properties, including rheological and thermal properties, are available elsewhere [7-9].
Here, the iARD-RPR Model was applied to simulate fibers flowing in the injection modeling process via a commercial CAE analysis program, Moldex3D-R14. In this work, we choose to focus on the center of the disk (Region B).
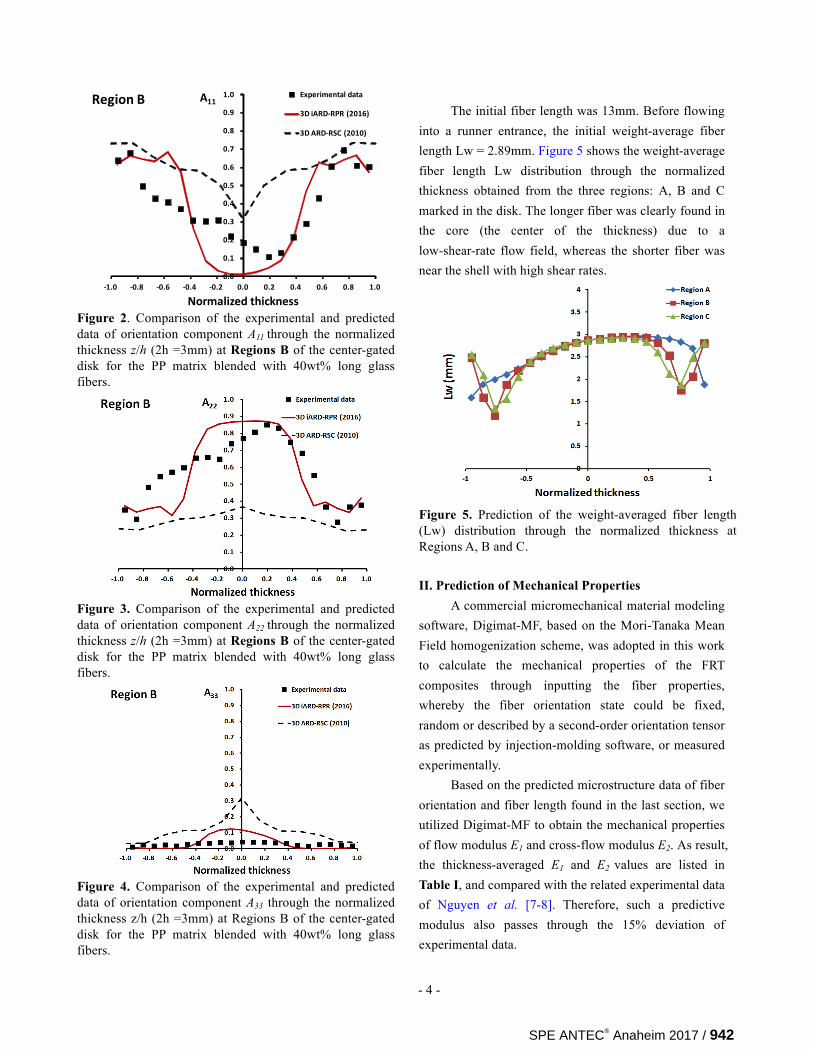
I. Prediction of fiber orientation and fiber length Figures 2-4 show these predictions of orientation
distributions through the normalized thickness obtained from regions B, marked in the disk; the available data in the figures, including the experimental points (see square symbols), the iARD-RPR model curves (see solid lines) and the ARD-RSC curves (see dash lines) are referred to in the PNNL report [7-9]. Using the iARD-RPR model, the predicted orientation curves nearly pass the experimental points in all the studied regions. Clearly, such an orientation distribution exhibits the shell-core structure; in particular, there is a wide core in the orientation pattern. Basically, the plurality of fibers found in the shell region are mainly aligned in the flow direction due to the high shearing near the mold surface, while others at the core are transverse to the flow due to low shearing.
These figures show that A11 and A33 are over-predicted, whereas component A22 is under- predicted. It appears that the predictions do not agree with the results of the experiments. Obviously, our 3D predictions from using the iARD-RPR are superior to the previous results of using the ARD-RSC (2010) [9].
SPE ANTEC® Anaheim 2017 / 941
- 4 -
0.0
0.1
0.2
0.3
0.4
0.5
0.6
0.7
0.8
0.9
1.0
-1.0 -0.8 -0.6 -0.4 -0.2 0.0 0.2 0.4 0.6 0.8 1.0
A11
Normalizedthickness
Experimentaldata
3DiARD-RPR(2016)
3DARD-RSC(2010)
Region B
Figure 2. Comparison of the experimental and predicted data of orientation component A11 through the normalized thickness z/h (2h =3mm) at Regions B of the center-gated disk for the PP matrix blended with 40wt% long glass fibers.
Figure 3. Comparison of the experimental and predicted data of orientation component A22 through the normalized thickness z/h (2h =3mm) at Regions B of the center-gated disk for the PP matrix blended with 40wt% long glass fibers.
Figure 4. Comparison of the experimental and predicted data of orientation component A33 through the normalized thickness z/h (2h =3mm) at Regions B of the center-gated disk for the PP matrix blended with 40wt% long glass fibers.
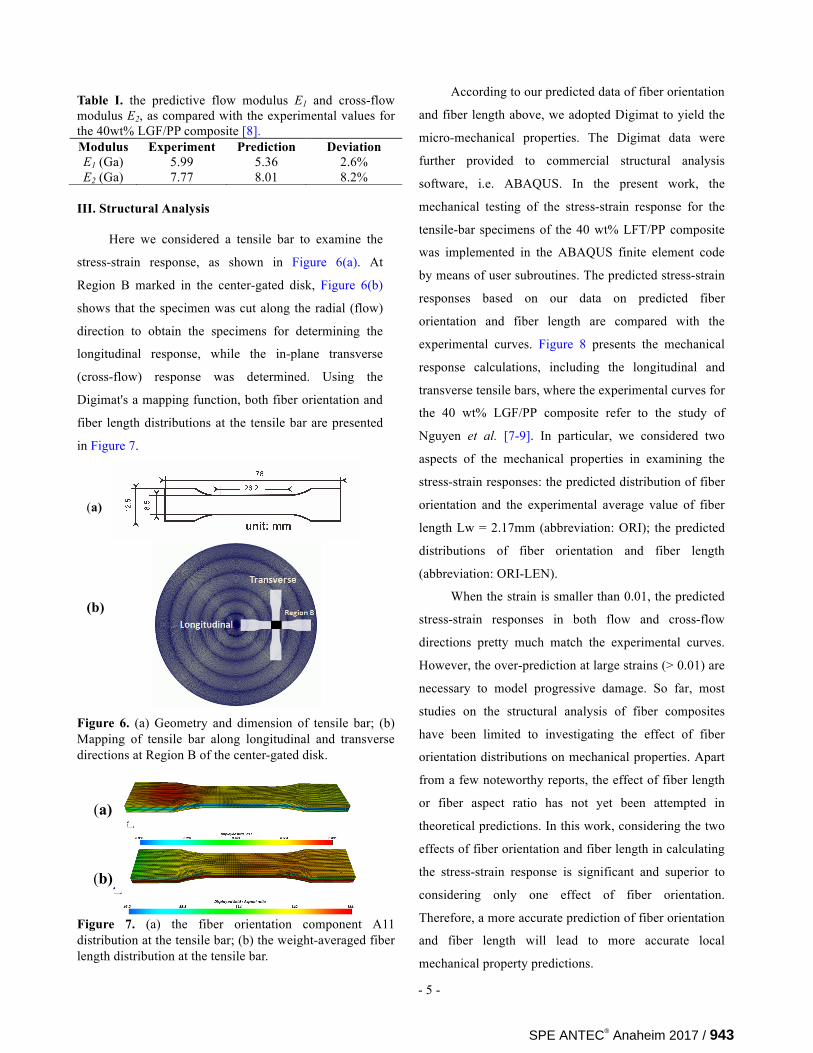
The initial fiber length was 13mm. Before flowing into a runner entrance, the initial weight-average fiber length Lw = 2.89mm. Figure 5 shows the weight-average fiber length Lw distribution through the normalized thickness obtained from the three regions: A, B and C marked in the disk. The longer fiber was clearly found in the core (the center of the thickness) due to a low-shear-rate flow field, whereas the shorter fiber was near the shell with high shear rates.
Figure 5. Prediction of the weight-averaged fiber length (Lw) distribution through the normalized thickness at Regions A, B and C. II. Prediction of Mechanical Properties A commercial micromechanical material modeling software, Digimat-MF, based on the Mori-Tanaka Mean Field homogenization scheme, was adopted in this work to calculate the mechanical properties of the FRT composites through inputting the fiber properties, whereby the fiber orientation state could be fixed, random or described by a second-order orientation tensor as predicted by injection-molding software, or measured experimentally. Based on the predicted microstructure data of fiber orientation and fiber length found in the last section, we utilized Digimat-MF to obtain the mechanical properties of flow modulus E1 and cross-flow modulus E2. As result, the thickness-averaged E1 and E2 values are listed in Table I, and compared with the related experimental data of Nguyen et al. [7-8]. Therefore, such a predictive modulus also passes through the 15% deviation of experimental data.
SPE ANTEC® Anaheim 2017 / 942
- 5 -
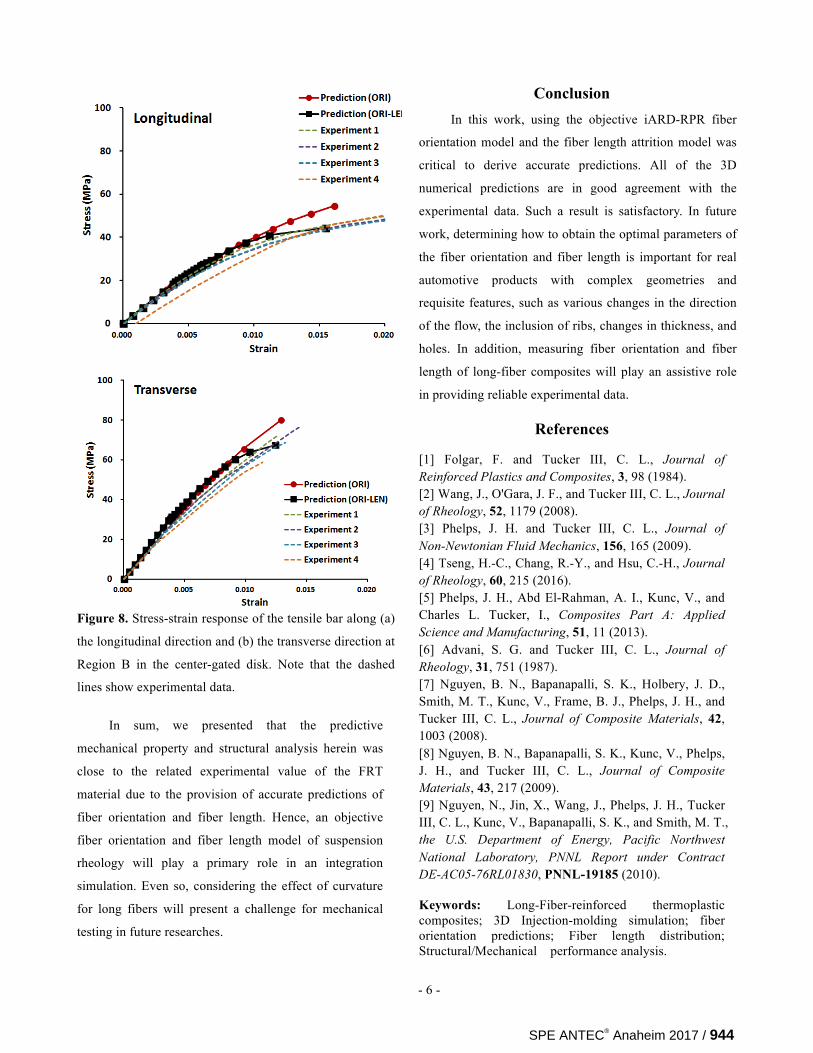
III. Structural Analysis Here we considered a tensile bar to examine the
stress-strain response, as shown in Figure 6(a). At
Region B marked in the center-gated disk, Figure 6(b)
shows that the specimen was cut along the radial (flow)
direction to obtain the specimens for determining the
longitudinal response, while the in-plane transverse
(cross-flow) response was determined. Using the
Digimat's a mapping function, both fiber orientation and
fiber length distributions at the tensile bar are presented
in Figure 7.
Figure 6. (a) Geometry and dimension of tensile bar; (b) Mapping of tensile bar along longitudinal and transverse directions at Region B of the center-gated disk.
Figure 7. (a) the fiber orientation component A11 distribution at the tensile bar; (b) the weight-averaged fiber length distribution at the tensile bar.
According to our predicted data of fiber orientation
and fiber length above, we adopted Digimat to yield the
micro-mechanical properties. The Digimat data were
further provided to commercial structural analysis
software, i.e. ABAQUS. In the present work, the
mechanical testing of the stress-strain response for the
tensile-bar specimens of the 40 wt% LFT/PP composite
was implemented in the ABAQUS finite element code
by means of user subroutines. The predicted stress-strain
responses based on our data on predicted fiber
orientation and fiber length are compared with the
experimental curves. Figure 8 presents the mechanical
response calculations, including the longitudinal and
transverse tensile bars, where the experimental curves for
the 40 wt% LGF/PP composite refer to the study of
Nguyen et al. [7-9]. In particular, we considered two
aspects of the mechanical properties in examining the
stress-strain responses: the predicted distribution of fiber
orientation and the experimental average value of fiber
length Lw = 2.17mm (abbreviation: ORI); the predicted
distributions of fiber orientation and fiber length
(abbreviation: ORI-LEN).
When the strain is smaller than 0.01, the predicted
stress-strain responses in both flow and cross-flow
directions pretty much match the experimental curves.
However, the over-prediction at large strains (> 0.01) are
necessary to model progressive damage. So far, most
studies on the structural analysis of fiber composites
have been limited to investigating the effect of fiber
orientation distributions on mechanical properties. Apart
from a few noteworthy reports, the effect of fiber length
or fiber aspect ratio has not yet been attempted in
theoretical predictions. In this work, considering the two
effects of fiber orientation and fiber length in calculating
the stress-strain response is significant and superior to
considering only one effect of fiber orientation.
Therefore, a more accurate prediction of fiber orientation
and fiber length will lead to more accurate local
mechanical property predictions.
Table I. the predictive flow modulus E1 and cross-flow modulus E2, as compared with the experimental values for the 40wt% LGF/PP composite [8]. Modulus Experiment Prediction Deviation E1 (Ga) 5.99 5.36 2.6% E2 (Ga) 7.77 8.01 8.2%
((a)
(
(b)
((a)
(
(b)
((b)
(
(b)
SPE ANTEC® Anaheim 2017 / 943
- 6 -
Figure 8. Stress-strain response of the tensile bar along (a)
the longitudinal direction and (b) the transverse direction at
Region B in the center-gated disk. Note that the dashed
lines show experimental data.
In sum, we presented that the predictive
mechanical property and structural analysis herein was
close to the related experimental value of the FRT
material due to the provision of accurate predictions of
fiber orientation and fiber length. Hence, an objective
fiber orientation and fiber length model of suspension
rheology will play a primary role in an integration
simulation. Even so, considering the effect of curvature
for long fibers will present a challenge for mechanical
testing in future researches.
Conclusion In this work, using the objective iARD-RPR fiber
orientation model and the fiber length attrition model was
critical to derive accurate predictions. All of the 3D
numerical predictions are in good agreement with the
experimental data. Such a result is satisfactory. In future
work, determining how to obtain the optimal parameters of
the fiber orientation and fiber length is important for real
automotive products with complex geometries and
requisite features, such as various changes in the direction
of the flow, the inclusion of ribs, changes in thickness, and
holes. In addition, measuring fiber orientation and fiber
length of long-fiber composites will play an assistive role
in providing reliable experimental data.
References
[1] Folgar, F. and Tucker III, C. L., Journal of Reinforced Plastics and Composites, 3, 98 (1984). [2] Wang, J., O'Gara, J. F., and Tucker III, C. L., Journal of Rheology, 52, 1179 (2008). [3] Phelps, J. H. and Tucker III, C. L., Journal of Non-Newtonian Fluid Mechanics, 156, 165 (2009). [4] Tseng, H.-C., Chang, R.-Y., and Hsu, C.-H., Journal of Rheology, 60, 215 (2016). [5] Phelps, J. H., Abd El-Rahman, A. I., Kunc, V., and Charles L. Tucker, I., Composites Part A: Applied Science and Manufacturing, 51, 11 (2013). [6] Advani, S. G. and Tucker III, C. L., Journal of Rheology, 31, 751 (1987). [7] Nguyen, B. N., Bapanapalli, S. K., Holbery, J. D., Smith, M. T., Kunc, V., Frame, B. J., Phelps, J. H., and Tucker III, C. L., Journal of Composite Materials, 42, 1003 (2008). [8] Nguyen, B. N., Bapanapalli, S. K., Kunc, V., Phelps, J. H., and Tucker III, C. L., Journal of Composite Materials, 43, 217 (2009). [9] Nguyen, N., Jin, X., Wang, J., Phelps, J. H., Tucker III, C. L., Kunc, V., Bapanapalli, S. K., and Smith, M. T., the U.S. Department of Energy, Pacific Northwest National Laboratory, PNNL Report under Contract DE-AC05-76RL01830, PNNL-19185 (2010). Keywords: Long-Fiber-reinforced thermoplastic composites; 3D Injection-molding simulation; fiber orientation predictions; Fiber length distribution; Structural/Mechanical performance analysis.
SPE ANTEC® Anaheim 2017 / 944