Embed Size (px)
Citation preview
.1 •
DOE/NASA/3163-1 NASA CR-167845 NASA-CR-167845
19830005088
Losses in Chopper-Controlled DC Series Motors
Howard B Hamilton University of Pittsburgh
April 1982
Prepared for
H\' :orON. VIRGINIA
NATIONAL AERONAUTICS AND SPACE ADMINISTRATION Lewis Research Center Under Contract NSG-3163
1111111111111 1111 11111 1111111111111111111 1111 NF02680
for U.S. DEPARTMENT OF ENERGY Conservation and Renewable Energy Office of Vehicle and Engine R&D
https://ntrs.nasa.gov/search.jsp?R=19830005088 2018-06-02T03:32:59+00:00Z
NOTICE
This report was prepared to document work sponsored by the United States GOl/ernment Neither the United States nor ItS agent, the United States Department of Energy nor any Federal employees nor any of their contractors subcontractors or thelf employees, makes any warranty express or Implied, or assumes any legal liability or responsibility for the accuracy, completeness or usefulness of any information, apparatus, product or process disclosed or represents that ItS use would not Infnnge pnvately owned nghts
..
•
•
Losses in Chopper-Controlled DC Series Motors
Howard B. Hamilton University of Pittsburgh Pittsburgh, Pennsylvania 15261
April 1982
Prepared for National Aeronautics and Space Administration Lewis Research Center Cleveland, Ohio 44135 Under Grant NSG-3163
for U.S. DEPARTMENT OF ENERGY Conservation and Renewable Energy Office of Vehicle and Engine R&D Washington, D.C. 20545 Under Interagency Agreement DE-AI01-77CS51 044
DOE/NASAl3163-1 NASA CR-167845
•
..
•
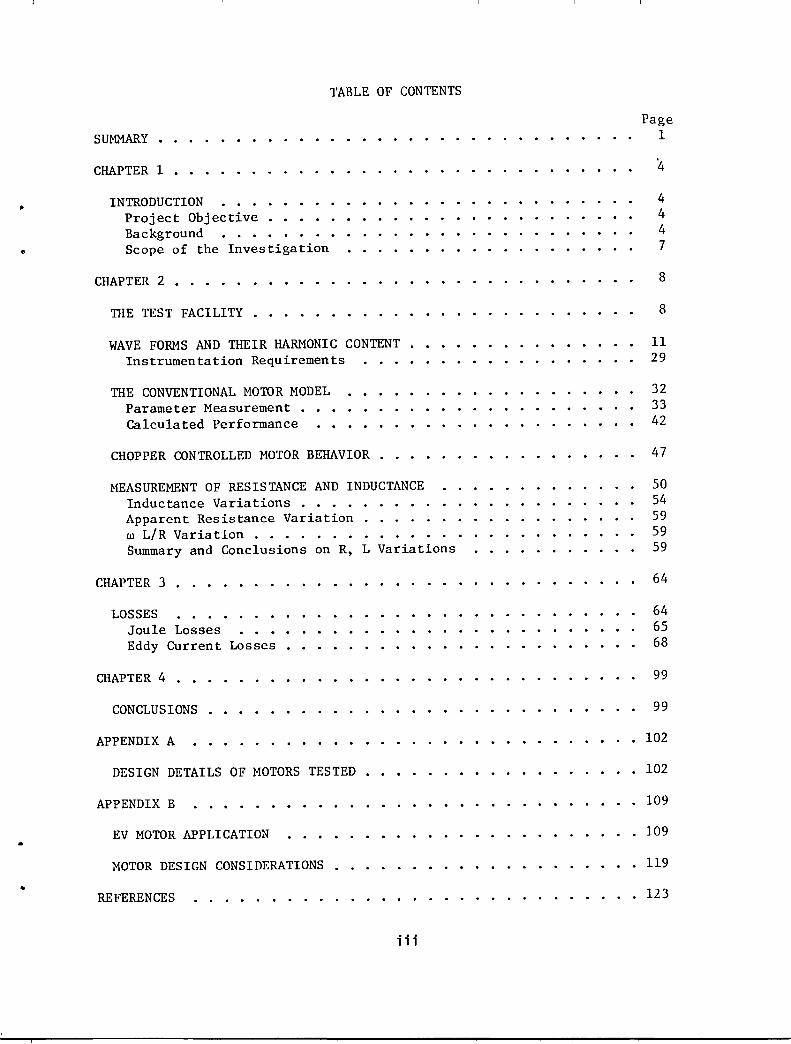
TABLE OF CONTENTS
SUMMARY.
CHAPTER 1 . . . . . . . . INTRODUCTION
Project Objective Background •••. Scope of the Investigation
CHAPTER 2
THE TEST FACILITY •
WAVE FORMS AND THEIR HARMONIC CONTENT .• Instrumentation Requirements
THE CONVENTIONAL MOTOR MODEL Parameter Measurement • Calculated Performance
CHOPPER CONTROLLED MOTOR BEHAVIOR •
MEASUREMENT OF RESISTANCE AND INDUCTANCE Inductance Variations • • • • Apparent Resistance Variation . . . . . w L/R Variation . • • . • . . • . • Summary and Conclusions on R, L Variations
CHAPTER 3
LOSSES Joule Losses Eddy Current Losses
CHAPTER 4 •••
CONCLUSIONS •
APPENDIX A
DESIGN DETAILS OF MOTORS TESTED
APPENDIX B
EV MOTOR APPLICATION
MOTOR DESIGN CONSIDERATIONS .
REFERENCES
iii
Page 1
4 4 4 7
8
8
11 29
32 33 42
47
50 54 59 59 59
64
64 65 68
99
99
• 102
• • 102
• • • 109
• 109
• • 119
· . 123
•
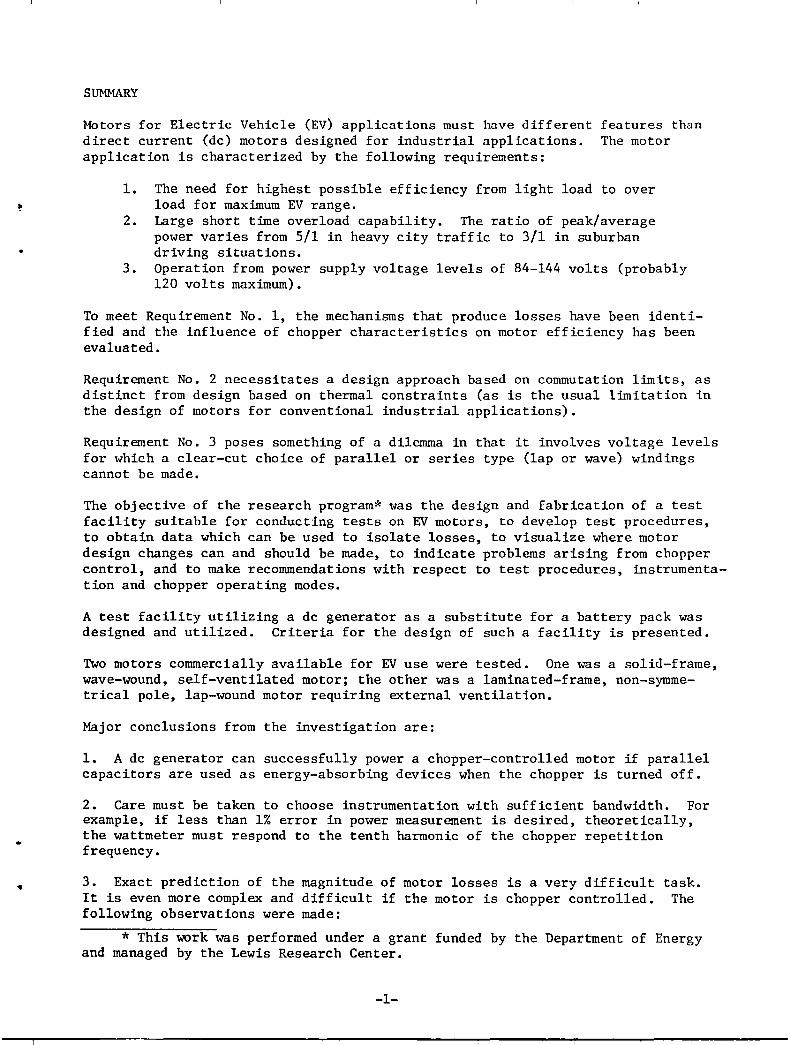
SUMMARY
Motors for Electric Vehicle (EV) applications must Imve different direct current (dc) motors designed for industrial applications. application is characterized by the following requirements:
features than The motor
1. The need for highest possible efficiency from light load to over load for maximum EV range.
2. Large short time overload capability. The ratio of peak/average power varies from 5/1 in heavy city traffic to 3/1 in suburban driving situations •
3. Operation from power supply voltage levels of 84-144 volts (probably 120 volts maximum).
To meet Requirement No.1, the mechanisms that produce losses have been identified and the influence of chopper characteristics on motor efficiency has been evaluated.
Requirement No. 2 necessitates a design approach based on commutation limits, as distinct from design based on thermal constraints (as is the usual limitation in the design of motors for conventional industrial applications).
Requirement No. 3 poses something of a dilemma in that it involves voltage levels for which a clear-cut choice of parallel or series type (lap or wave) windings cannot be made.
The objective of the research program* was the design and fabrication of a test facility suitable for conducting tests on EV motors, to develop test procedures, to obtain data which can be used to isolate losses, to visualize where motor design changes can and should be made, to indicate problems arising from chopper control, and to make recommendations with respect to test procedures, instrumentation and chopper operating modes.
A test facility utilizing a dc generator as a substitute for a battery pack was designed and utilized. Criteria for the design of such a facility is presented.
Two motors commerCially available for EV use were tested. One was a solid-frame, wave-wound, self-ventilated motor; the other was a laminated-frame, non-symmetrical pole, lap-wound motor requiring external ventilation.
Major conclusions from the investigation are:
1. A dc generator can successfully power a chopper-controlled motor if parallel capacitors are used as energy-absorbing devices when the chopper is turned off.
2. Care must be taken to choose instrumentation with sufficient bandwidth. For example, if less than 1% error in power measurement is desired, theoretically, the wattmeter must respond to the tenth harmonic of the chopper repetition frequency.
3. Exact prediction of the magnitude of motor losses is a very difficult task. It is even more complex and difficult if the motor is chopper controlled. The following observations were made:
* This work was performed under a grant funded by the Department of Energy and managed by the Lewis Research Center.
-1-
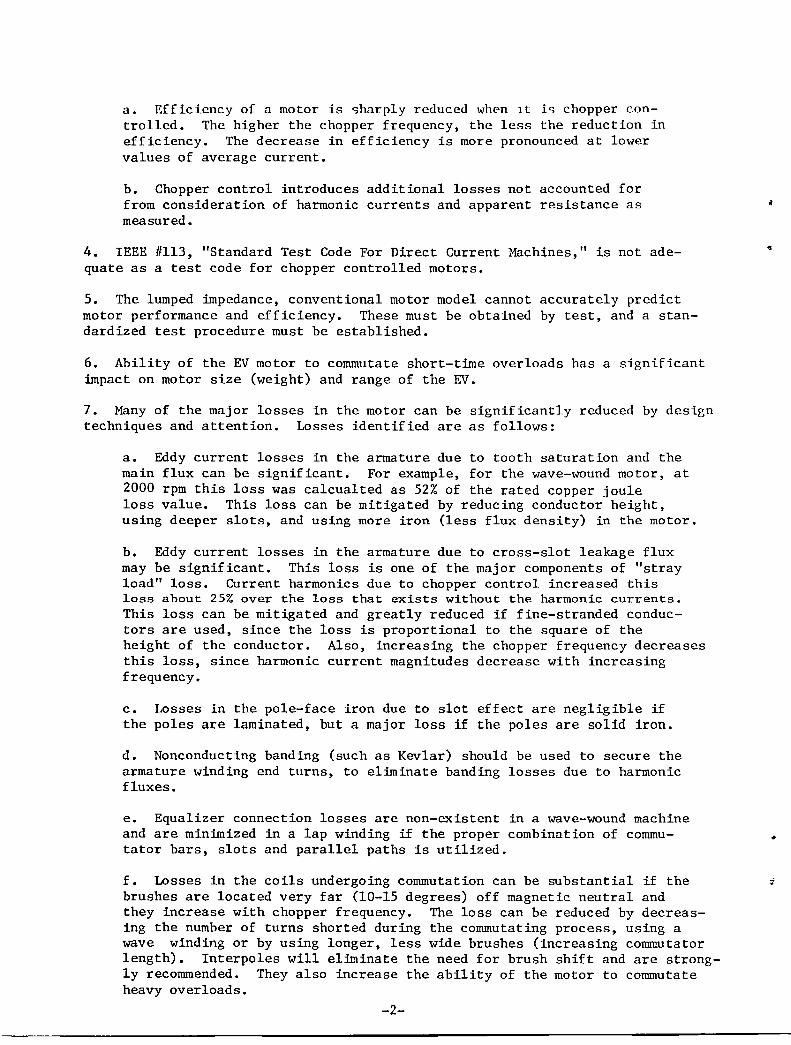
a. Efficiency of a motor is sharply reduced when It is chopper controlled. The higher the chopper frequency, the less the reduction in efficiency. The decrease in efficiency is more pronounced at lower values of average current.
b. Chopper control introduces additional losses not accounted for from consideration of harmonic currents and apparent resistance as measured.
4. IEEE 11113, "Standard Test Code For Direct Current Machines," is not adequate as a test code for chopper controlled motors.
5. The lumped impedance, conventional motor model cannot accurately predict motor performance and efficiency. These must be obtained by test, and a standardized test procedure must be established.
6. Ability of the EV motor to commutate short-time overloads has a significant impact on motor size (weight) and range of the EV.
7. Many of the major losses in the motor can be significantly reduced by design techniques and attention. Losses identified are as follows:
a. Eddy current losses in the armature due to tooth saturation and the main flux can be significant. For example, for the wave-wound motor, at 2000 rpm this loss was calcualted as 52% of the rated copper joule loss value. This loss can be mitigated by reducing conductor height, using deeper slots, and using more iron (less flux density) in the motor.
b. Eddy current losses in the armature due to cross-slot leakage flux may be significant. This loss is one of the major components of "stray load" loss. Current harmonics due to chopper control increased this loss about 25% over the loss that exists without the harmonic currents. This loss can be mitigated and greatly reduced if fine-stranded conductors are used, since the loss is proportional to the square of the height of the conductor. Also, increasing the chopper frequency decreases this loss, since harmonic current magnitudes decrease with increasing frequency.
c. Losses in the pole-face iron due to slot effect are negligible if the poles are laminated, but a major loss if the poles are solid iron.
d. Nonconducting banding (such as Kevlar) should be used to secure the armature winding end turns, to eliminate banding losses due to harmonic fluxes.
e. Equalizer connection losses are non-existent in a wave-wound machine and are minimized in a lap winding if the proper combination of commutator bars, slots and parallel paths is utilized.
f. Losses in the coils undergoing commutation can be substantial if the brushes are located very far (10-15 degrees) off magnetic neutral and they increase with chopper frequency. The loss can be reduced by decreasing the number of turns shorted during the commutating process, using a wave winding or by using longer, less wide brushes (increasing commutator length). Interpoles will eliminate the need for brush shift and are strongly recommended. They also increase the ability of the motor to commutate heavy overloads.
-2-
•
•
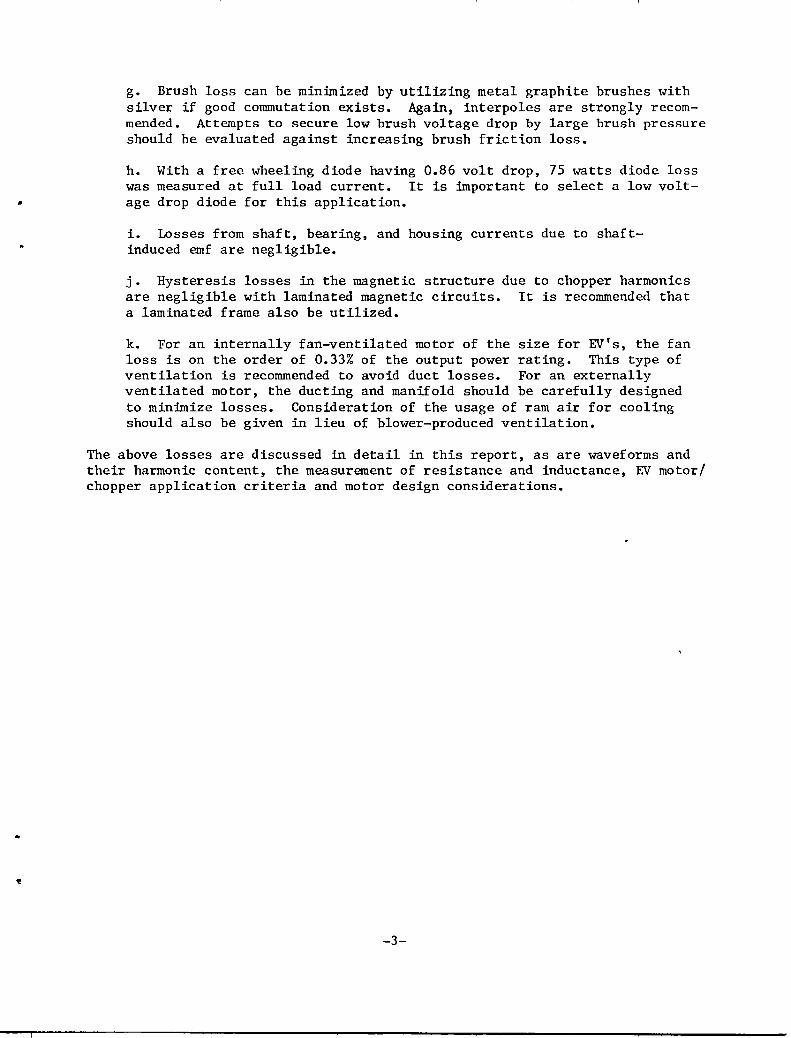
g. Brush loss can be minimized by utilizing metal graphite brushes with silver if good commutation exists. Again, interpoles are strongly recommended. Attempts to secure low brush voltage drop by large brush pressure should be evaluated against increasing brush friction loss.
h. With a free wheeling diode having 0.86 volt drop, 75 watts diode loss was measured at full load current. It is important to select a low voltage drop diode for this application.
i. Losses from shaft, bearing, and housing currents due to shaftinduced emf are negligible.
j. Hysteresis losses in the magnetic structure due to chopper harmonics are negligible with laminated magnetic circuits. It is recommended that a laminated frame also be utilized.
k. For an internally fan-ventilated motor of the size for EV's, the fan loss is on the order of 0.33% of the output power rating. This type of ventilation is recommended to avoid duct losses. For an externally ventilated motor, the ducting and manifold should be carefully designed to minimize losses. Consideration of the usage of ram air for cooling should also be given in lieu of blower-produced ventilation.
The above losses are discussed in detail in this report, as are waveforms and their harmonic content, the measurement of resistance and inductance, EV motor/ chopper application criteria and motor design considerations.
-3-
CIIAPTER 1
INTRODUCTION
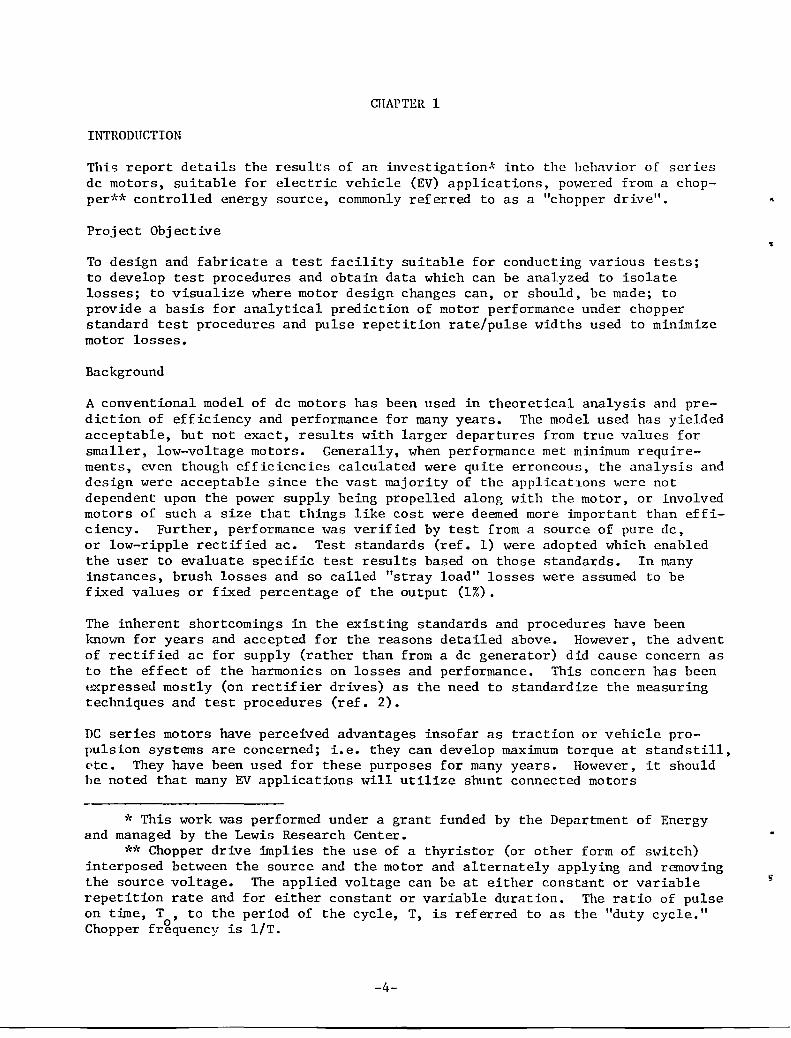
This report details the results of an investigation:' into the hehavior of series dc motors, suitable for electric vehicle (EV) applications, powered from a chopper1~* controlled energy source, commonly ref erred to as a "chopper drive".
Proj ect Obj ective
To design and fabricate a test facility suitable for conducting various tests; to develop test procedures and obtain data which can be analyzed to isolate losses; to visualize where motor design changes can, or should, be made; to provide a basis for analytical prediction of motor performance under chopper standard test procedures and pulse repetition rate/pulse widths used to minimize motor losses.
Background
A conventional model of dc motors has been used in theoretical analysis and prediction of efficiency and performance for many years. The model used has yielded acceptable, but not exact, results with larger departures from true values for smaller, low-voltage motors. Generally, when performance met minimum requirements, even though efficiencies calculated were quite erroneous, the analysis and design were acceptable since the vast majority of the applicatlons were not dependent upon the power supply being propelled along with the motor, or involved motors of such a size that things like cost were deemed more important than efficiency. Further, performance was verified by test from a source of pure dc, or low-ripple rectified ac. Test standards (ref. 1) were adopted which enabled the user to evaluate specific test results based on those standards. In many instances, brush losses and so called "stray load" losses were assumed to be fixed values or fixed percentage of the output (1%).
The inherent shortcomings in the existing standards and procedures have been known for years and accepted for the reasons detailed above. However, the advent of rectified ac for supply (rather than from a dc generator) did cause concern as to the effect of the harmonics on losses and performance. This concern has been (~pressed mostly (on rectifier drives) as the need to standardize the measuring techniques and test procedures (ref. 2).
DC series motors have perceived advantages insofar as traction or vehicle propulsion systems are concerned; i.e. they can develop maximum torque at standstill, ptc. They have been used for these purposes for many years. However, it should he noted that many EV applications will utilize shunt connected motors
* This work was performed under a grant funded by the Department of Energy and managed by the Lewis Research Center.
** Chopper drive implies the use of a thyristor (or other form of switch) interposed between the source and the motor and alternately applying and removing the source voltage. The applied voltage can be at either constant or variable repetition rate and for either constant or variable duration. The ratio of pulse on time, T , to the period of the cycle, T, is referred to as the "duty cycle." Chopper frgquency is lIT.
-4-
»
•
which have the capability of being easily connected for regeneration, i.e., pumping energy from the machine back into the supply system during braking or slowing operation.
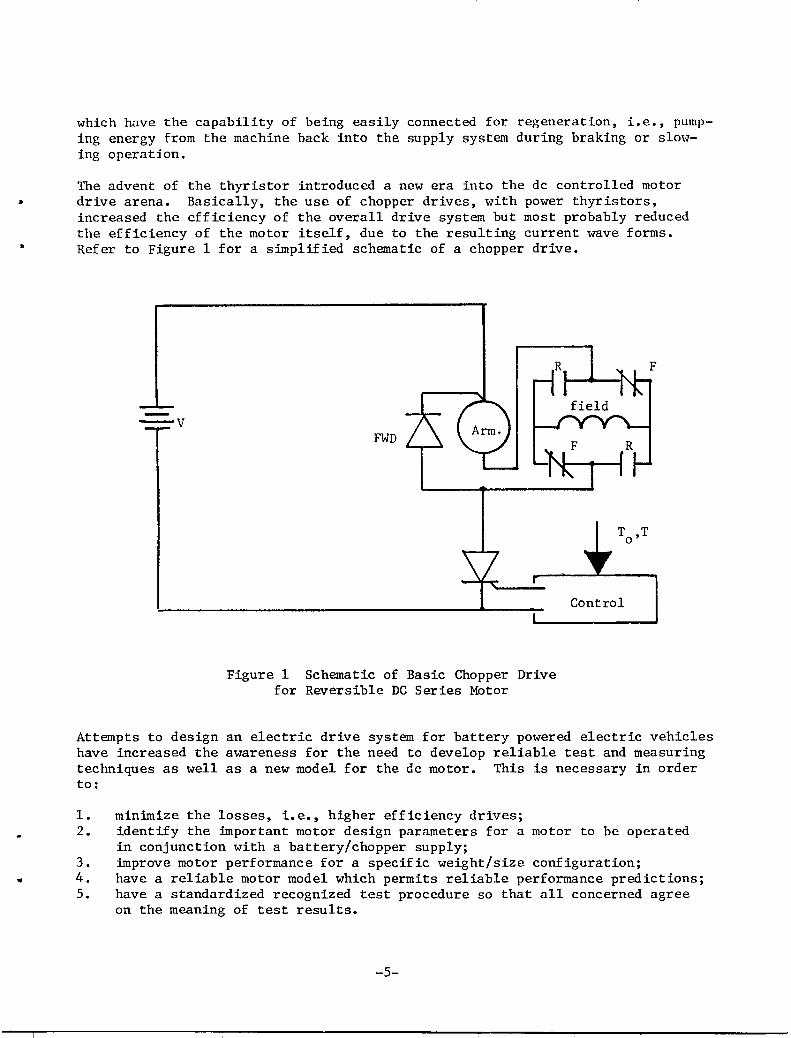
The advent of the thyristor introduced a new era into the dc controlled motor drive arena. Basically, the use of chopper drives, with power thyristors, increased the efficiency of the overall drive system but most probably reduced the efficiency of the motor itself, due to the resulting current wave forms. Refer to Figure I for a simplified schematic of a chopper drive.
-v FWD
Figure I Schematic of Basic Chopper Drive for Reversible DC Series Motor
Control
Attempts to design an electric drive system for battery powered electric vehicles have increased the awareness for the need to develop reliable test and measuring techniques as well as a new model for the dc motor. This is necessary in order to:
1. 2.
3. 4. 5.
minimize the losses, i.e., higher efficiency drives; identify the important motor design parameters for a motor to be operated in conjunction with a battery/chopper supply; improve motor performance for a specific weight/size configuration; have a reliable motor model which permits reliable performance predictions; have a standardized recognized test procedure so that all concerned agree on the meaning of test results.
-5-
With respect to efficiency and weight, a commonly accept('d 'rule of thumb' ~ndicates that with present motor designs and battery technology, 1% change in efficiency changes the available EV range 1.5 km., and 22.5 kg of weight change has the same effect.
Conventionally designed dc motors are usually not designed for high performance at non "design" voltages or for high harmonic content pulsed chopper supplies. In connection with the use of choppers, it should be noted that the vast majority of chopper applications have dealt with shunt wound motors (usually from alter-nat~ng current supplies) and that there is a scarcity of literature on series , motor applications; yet the series motor appears to be an attractive type for EV and traction applications.
There is very little information available on how to match motors and controllers (choppers). Guidelines need to be established for each, so that off-theshelf items can be applied. The chopper designer insists on some minimum inductance, resistance and inductance/resistance ratios in the motor. The motor deslgner must be cognizant of the additional iron losses due to pulsating fluxes; the skin/proximity effects and additional joule losses and the performance degradation due to factors discussed above and the lessened ability of the motor to properly commutate. (Measurements reported in this report indicate a 3.5/1 change in inductance and a 6/1 change in apparent resistance over a frequency range of 30-360 Hz. as measured on a dc series motor.)
The problem areas discussed above point up the need for a better understanding of the behavior of the dc motor powered 'from a chopper supply and the need for a more exact model than that presently used, as well as the need for motor/chopper "interface" guidelines.
There are many facets of motor design that warrant investigation. Some of these stem from the fact that the motor power size, for electric vehicles, is normally designed for a higher supply voltage. For example, many of the motors are rated around 12-23 kw. A low voltage machine of this size, or larger, would normally have a parallel (lap) type winding. A regular industrial machine would normally be wound series (wave)for 250 volts, dc, or higher. The power supply for electric vehicles will most probably be in the range of 84-144 volts, which is between low and high voltages. Of the two motors examined in this investigation, one was wave, the other lap wound. How the motor is wound and the duty cycle it is designed for will have a large impact on the joule losses in the armature circuit. Another problem area for design compromise is in brush material and brush spring tension selection. Electrographic or metallic/graphitic brushes plus high spring tension can be utilized to reduce the voltage drop across the brushes - very important in low voltage motors. Yet, this approach often yields increased brush friction (rotating losses). Should the motors be "copper poor" (lower weight), an internal blower or an external source of cooling air would be required. Heavy conductors, eliminating the need for cooling, face a skin effect/ proximity effect when subjected to the harmonics associated with a chopper supply.
A series motor can be partially compensated for the effects of armature reaction ~
upon commutation by a fixed brush shift position. This brush shift can also actually aid commutation (always a problem with a power source containing harmonics). In conventional applications, brush shift (fixed) in a series motor is a self-compensating effect, 1. e., one position is suitable for all loads for
-6-
•
•
rotation always in the same direction. However, brush shift degrades performance, because of loss of some active inductors. If the brushes are not on the proper location, "rotating core losses", or losses due to joule heating in the coils undergoing commutations, can be excessive. This is an especially cogent consideration during reverse motor operation. The alternative is the use of interpoles, and possibly compensating windings. Yet these additions increase cost, weight and introduce additional joule losses in the motor.
Other aspects of motor design, for electric vehicle applications, that may be different from those in conventional applications are as follows:
1. working flux densities - how much saturation should be tolerated in the interest of light weight but at a sacrifice of performance?
2. the electrical loading - should fan cooling be required? 3. are conventional length/diameter ratios optimum? 4. air gap size and the weight/cost/design life relationships based on field
maintenance and expected life realities; 5. are commutator bar-bar voltages consistent with the harmonics involved in
armature current? 6. use of solid vs. laminated yokes; 7. insulation levels required - is it possible to reduce weight and cost if
not overinsulated? 8. need for maximum efficiency over a wide range of output; 9. need for relatively high values of circuit inductance; 10. the design objective must be based on commutation limit as opposed to thermal
constraint.
These questions can only be addressed after an examination of the various loss mechanisms.
Scope of the Investigation
Two motors (one lap, the other wave wound) were tested. Details on the test facility, the instrumentation used, the tests conducted and observed results are presented in CHAPTER 2. This chapter also discusses the complex wave forms associated with chopper control and the instrumentation required for making measure~ents. Theoretical performance, using the conventional motor model is compared with observed performance when the motor is powered from "ripple free" dc and when controlled by a chopper. Chopper contol does introduce complexities in the analysis of motor performance, especially in accounting for losses. The effects of chopper frequency and duty cycle, brush shift, etc. were determined by test and are presented.
IEEE #113 (ref. 1) does not address determination of the resistance and inductance variations with frequency and saturation level and thus it was necessary to make these determinations as an early part of this investigation. A technique suggested by Saunders (ref. 4) was utilized for these measurements. However, instrumentation techniques had to be developed to accomplish this.
CHAPTER 3 deals with the various loss mechanisms, both analytically and experimentally (where possible) and makes recommendations with respect to motor design. CHAPTER 4 presents the overall conclusions and summary of results. APPENDIX B presents notes on EV motor/chopper application criteria and motor considerations.
-7-
CHAPTER 2
THE TEST FACILITY
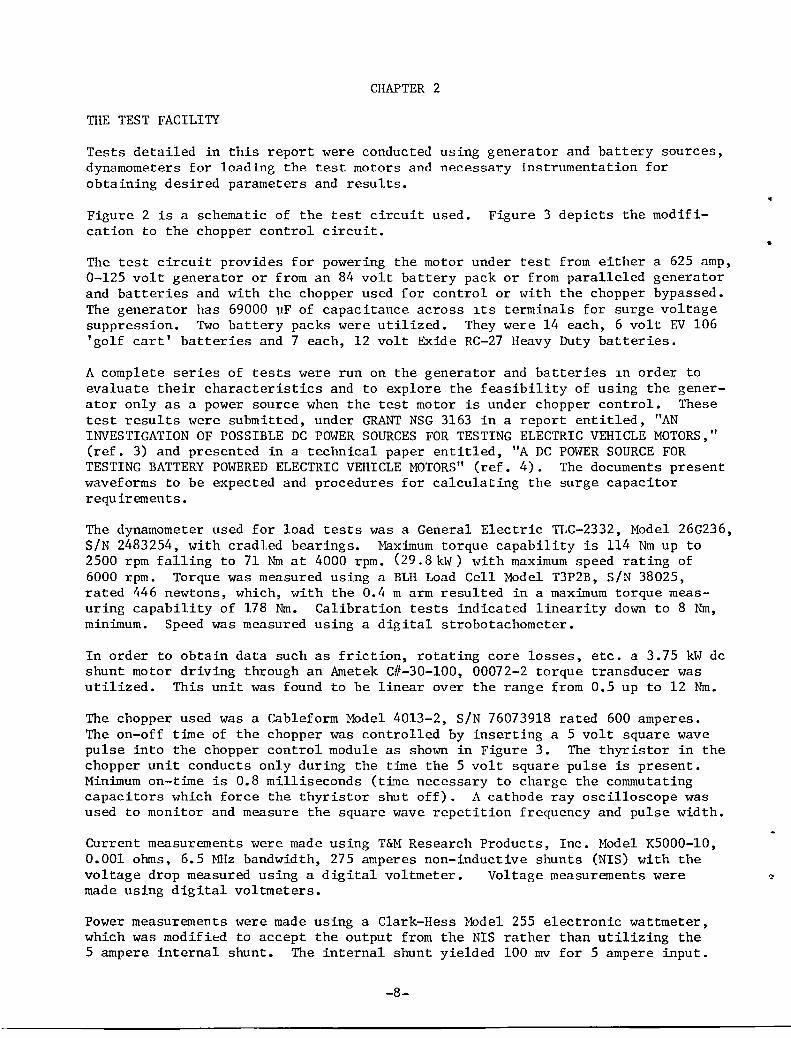
Tests detailed in this report were conducted using generator and battery sources, dynamometers for loading the test motors and necessary instrumentation for obtaining desired parameters and results.
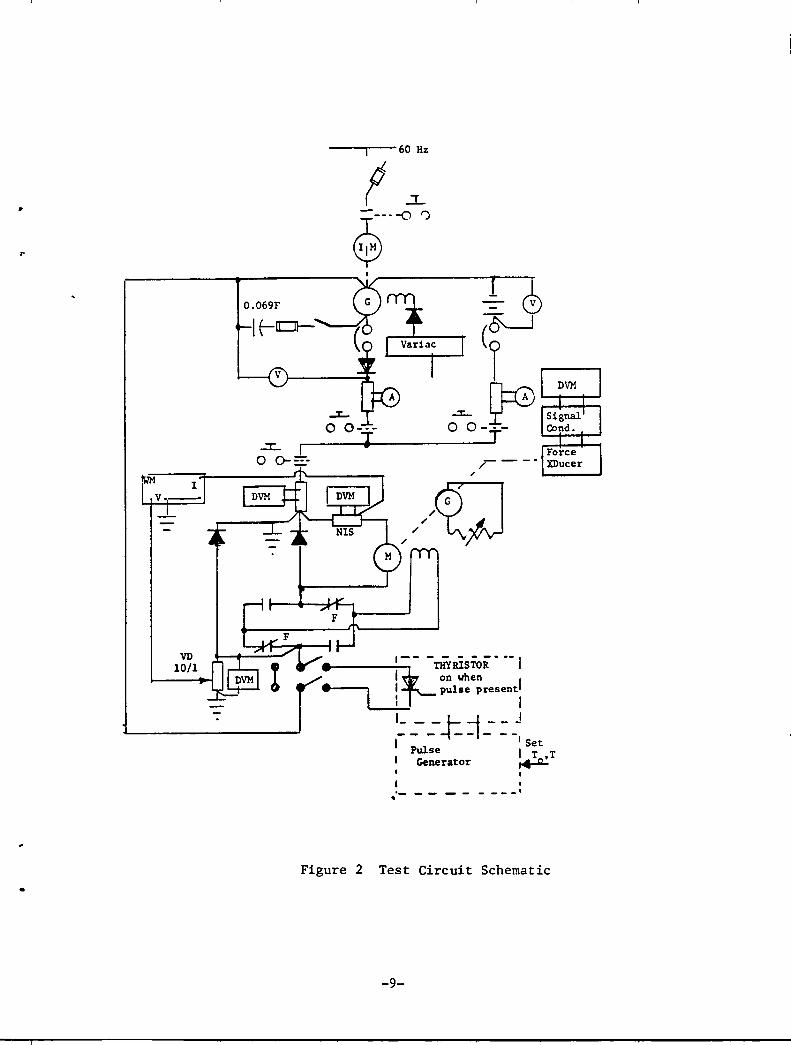
Figure 2 is a schematic of the test circuit used. Figure 3 depicts the modification to the chopper control circuit.
The test circuit provides for powering the motor under test from either a 625 amp, 0-125 volt generator or from an 84 volt battery pack or from paralleled generator and batteries and with the chopper used for control or with the chopper bypassed. The generator has 69000 ~F of capacitance across ltS terminals for surge voltage suppression. Two battery packs were utilized. They were 14 each, 6 volt EV 106 'golf cart' batteries and 7 each, 12 volt Exide RC-27 Heavy Duty batteries.
A complete series of tests were run on the generator and batteries ln order to evaluate their characteristics and to explore the feasibility of using the generator only as a power source when the test motor is under chopper control. These test results were submitted, under GRANT NSG 3163 in a report entitled, "AN INVESTIGATION OF POSSIBLE DC POWER SOURCES FOR TESTING ELECTRIC VEHICLE MOTORS," (ref. 3) and presented in a technical paper entitled, "A DC POWER SOURCE FOR TESTING BATTERY POWERED ELECTRIC VEHICLE MOTORS" (ref. 4). The documents present waveforms to be expected and procedures for calculating the surge capacitor requirements.
The dynamometer used for load tests was a General Electric TLC-2332, Model 26G236, SiN 2483254, with cradled bearings. Maximum torque capability is 114 Nm up to 2500 rpm falling to 71 Nm at 4000 rpm. (29.8kW) with maximum speed rating of 6000 rpm. Torque was measured using a BLH Load Cell Model T3P2B, SiN 38025, rated 446 newtons, which, with the 0.4 m arm resulted in a maximum torque measuring capability of 178 Nm. Calibration tests indicated linearity down to 8 Nm, minimum. Speed was measured using a digital strobotachometer.
In order to obtain data such as friction, rotating core losses, etc. a 3.75 kW dc shunt motor driving through an Ametek cD-30-l00, 00072-2 torque transducer was utilized. This unit was found to be linear over the range from 0.5 up to 12 Nm.
The chopper used was a Cableform Model 4013-2, SiN 76073918 rated 600 amperes. The on-off time of the chopper was controlled by inserting a 5 volt square wave pulse into the chopper control module as shown in Figure 3. The thyristor in the chopper unit conducts only during the time the 5 volt square pulse is present. Minimum on-time is 0.8 milliseconds (time necessary to charge the commutating capacitors which force the thyristor shut off). A cathode ray oscilloscope was used to monitor and measure the square wave repetition frequency and pulse width.
Current measurements were made using T&M Research Products, Inc. Model K5000-10, 0.001 ohms, 6.5 MHz bandwidth, 275 amperes non-inductive shunts (NIS) with the
•
voltage drop measured using a digital voltmeter. Voltage measurements were ~ made using digital voltmeters.
Power measurements were made using a Clark-Hess Model 255 electronic wattmeter, which was modifi~d to accept the output from the NIS rather than utilizing the 5 ampere internal shunt. The internal shunt yielded 100 mv for 5 ampere input.
-8-
..
..
•
VD 10/1
..:I:... I o 0-::::-
( 60 Hz
f -L
~-.~ 0
__ -----:-1-,- - niYRisToR - -- I I~on when I I pulse present : I '----:---L_-~:t __ J - - - 4- - - --I I Set
Pulse I T ,T I Generator ~
I
,.- - - -- __ --'
Figure 2 Test Circuit Schematic
-9-
+84 Vdc B+
--- ---4 I CONTROLLER I 0--(
I I
207
I B- ohms 2 ---
-1- --I--I red yellow I I CABLE FORM I
,- - - - I ~s~~r~i3~OPPER I
1\ oL~ I.".. _~ I eRO ~<-+I-!- --:;;; -1,-- B-
'- - - _1 r I Floating
,- -- - - - --I I Square Wave I
Function Generator
I I _____ 1 ,-Floating
Figure 3 Chopper/Controller Mod1i1cat1on
-10-
..
..
The NIS yields 100 mv for 100 amperes. Thus a multiplying factor of 20 times Watt reading is required.
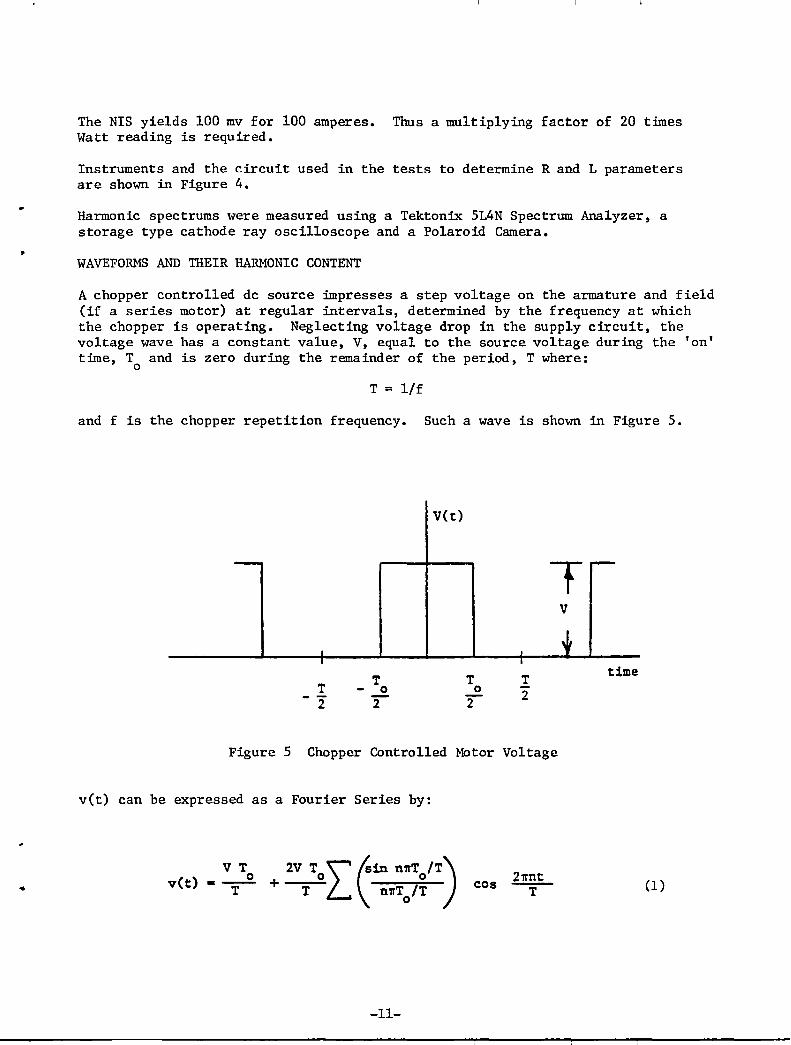
Instruments and the circuit used in the tests to determine Rand L parameters are shown in Figure 4.
Harmonic spectrums were measured using a Tektonix 5L4N Spectrum Analyzer, a storage type cathode ray oscilloscope and a Polaroid Camera •
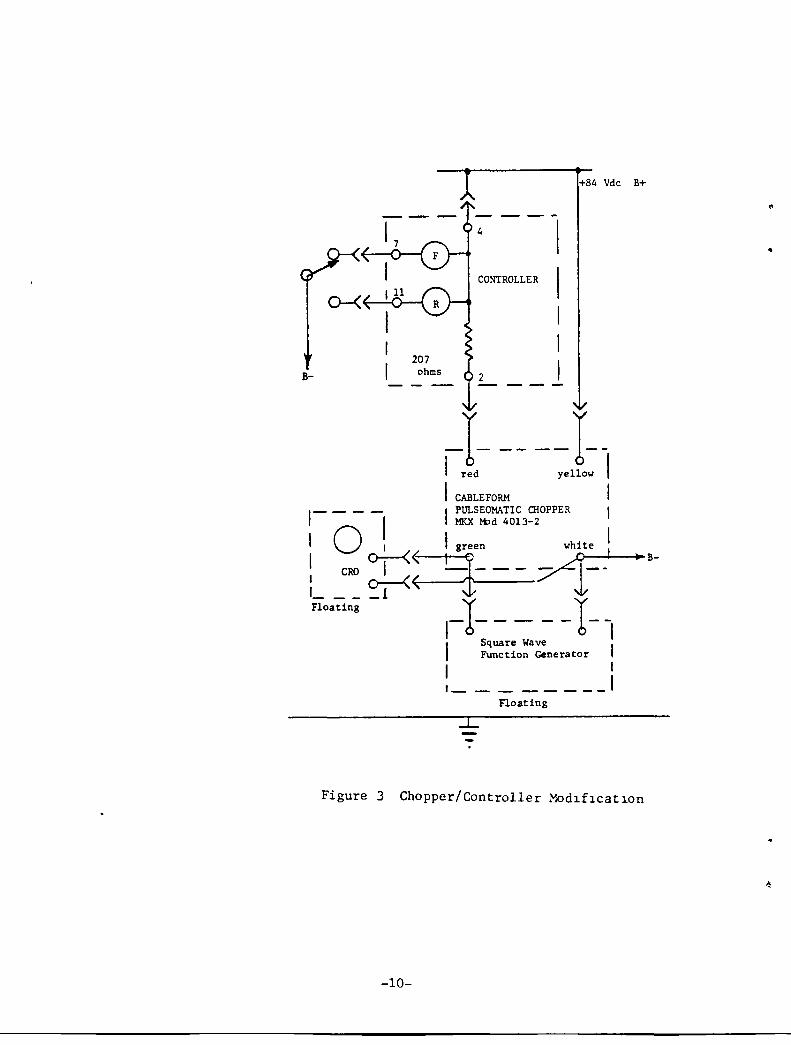
WAVEFORMS AND THEIR HARMONIC CONTENT
A chopper controlled dc source impresses a step voltage on the armature and field (if a series motor) at regular intervals, determined by the frequency at which the chopper is operating. Neglecting voltage drop in the supply circuit, the voltage wave has a constant value, V, equal to the source voltage during the 'on' time, T and is zero during the remainder of the period, T where:
o
T = l/f
and f is the chopper repetition frequency. Such a wave is shown in Figure 5.
-
I I
T o '2
vet)
T o "2
I
T 2
T V
t
Figure 5 Chopper Controlled Motor Voltage
vet) can be expressed as a Fourier Series by:
v(t) V T o .--
T
-11-
cos 21T1lt T
r--
time
(1 )
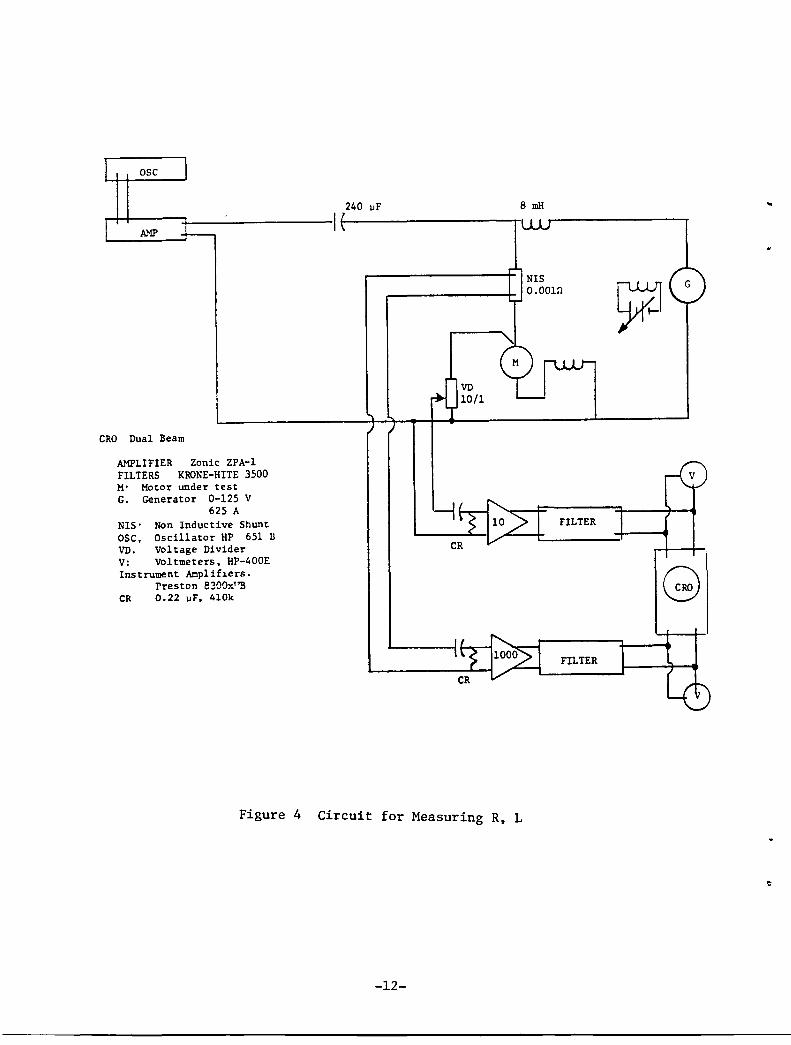
CRO Dual Beam
AMPLIFIER Zonic ZPA-l FILTERS KRONE-HITE 3500 H· Hotor under test G. Generator 0-125 V
625 A NIS· Non Inductive Shunt OSC, Oscillator HP 651 II VD. Voltage Divider V: Voltmeters, HP-400E Instrument Amplif~er6.
Preston e300x''B CR 0.22 uF, 410k
240 uF
VD 10/1
8mH
Figure 4 Circuit for Measuring R, L
-12-
..
FILTER
FILTER
...
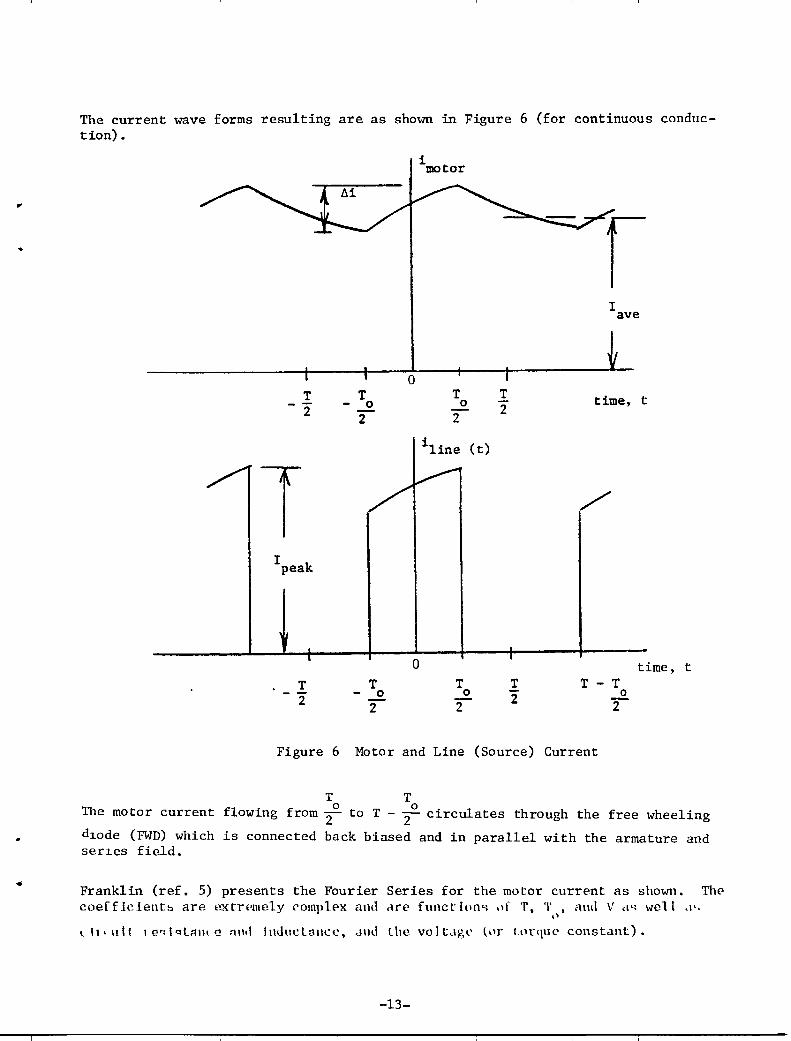
The current wave forms resulting are as shown in Figure 6 (for continuous conduction) •
/
T T -"2
2
T I peak
~
I
T -"2
i motor
0 T
0 0
2
i line
/ ~
0
T T 0 0
2 2
T 2
(t)
I
T 2
I ave
time, t
time, T - T
0
'2
Figure 6 Motor and Line (Source) Current
T T
t
o 0 The motor current flowing from 2: to T - 2 circulates through the free wheeling
dl0de (FWD) which is connected back biased and in parallel with the armature and serles field •
Franklin (ref. 5) presents the Fourier Series for the motor current as shown. The coef fieientb are t'-xtrt'mely complf'x and clre funct ion"! 'If T. T • <Hu1 V cI~ ,,,ell ,I',
" I.. lil ui I I e~ lr.il;1lh ~ nlld IndllclOiILC. ,JIld lhe volt~lgl' ~~Ir tl..lrque constant).
-13-
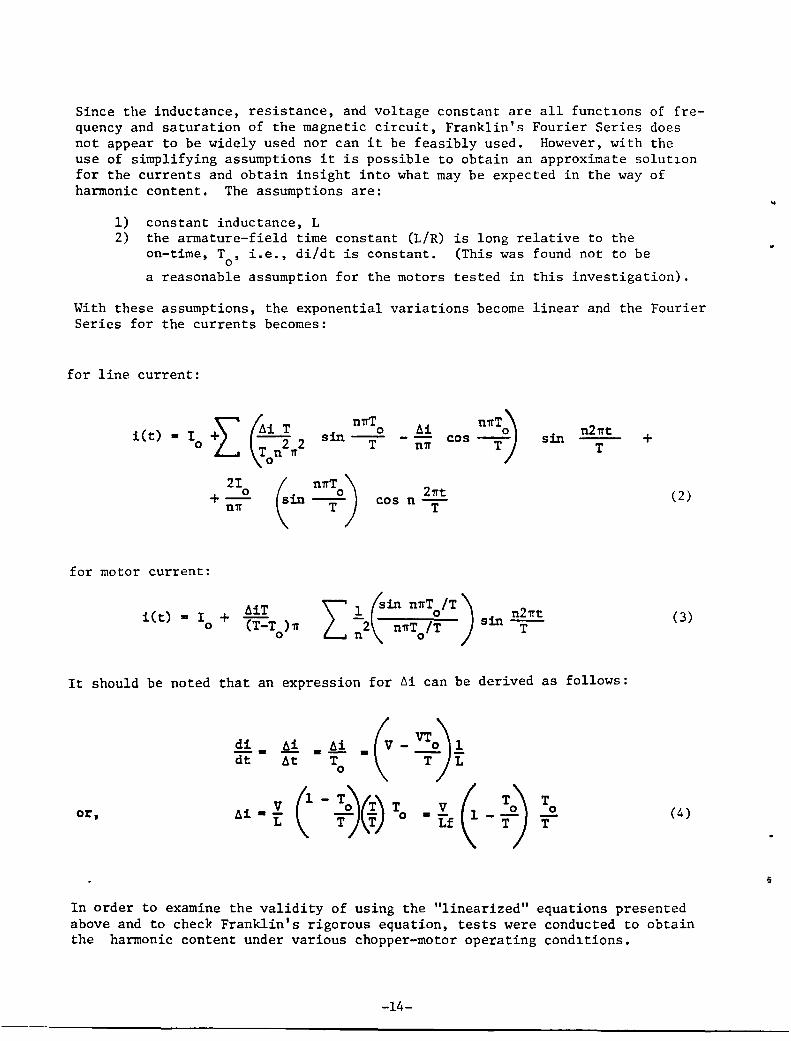
Since the inductance, resistance, and voltage constant are all functlons of frequency and saturation of the magnetic circuit, Franklin's Fourier Series does not appear to be widely used nor can it be feasibly used. However, with the use of simplifying assumptions it is possible to obtain an approximate solutlon for the currents and obtain insight into what may be expected in the way of harmonic content. The assumptions are:
1) constant inductance, L 2) the armature-field time constant (L/R) is long relative to the
on-time, T , i.e., di/dt is constant. (This was found not to be o
a reasonable assumption for the motors tested in this investigation).
With these assumptions, the exponential variations become linear and the Fourier Series for the currents becomes:
for line current:
n'ITT
£~iT iCt) - 1 sin __ 0
0 T 2 2 T n '11' 0
21 ~ nOTo) +~ sin--n'l1' T
for motor current:
iCt) • 1 61T o + (T-T)'I1'
o
cos
61 nttT~ n2'11't cos --t- sin n'l1' T
2'11't n--T
It should be noted that an expression for ~i can be derived as follows:
or, T o T
+
(2)
(3)
(4 )
In order to examine the validity of using the "linearized" equations presented above and to check Franklin's rigorous equation, tests were conducted to obtain the harmonic content under various chopper-motor operating condltions.
-14-
..
•
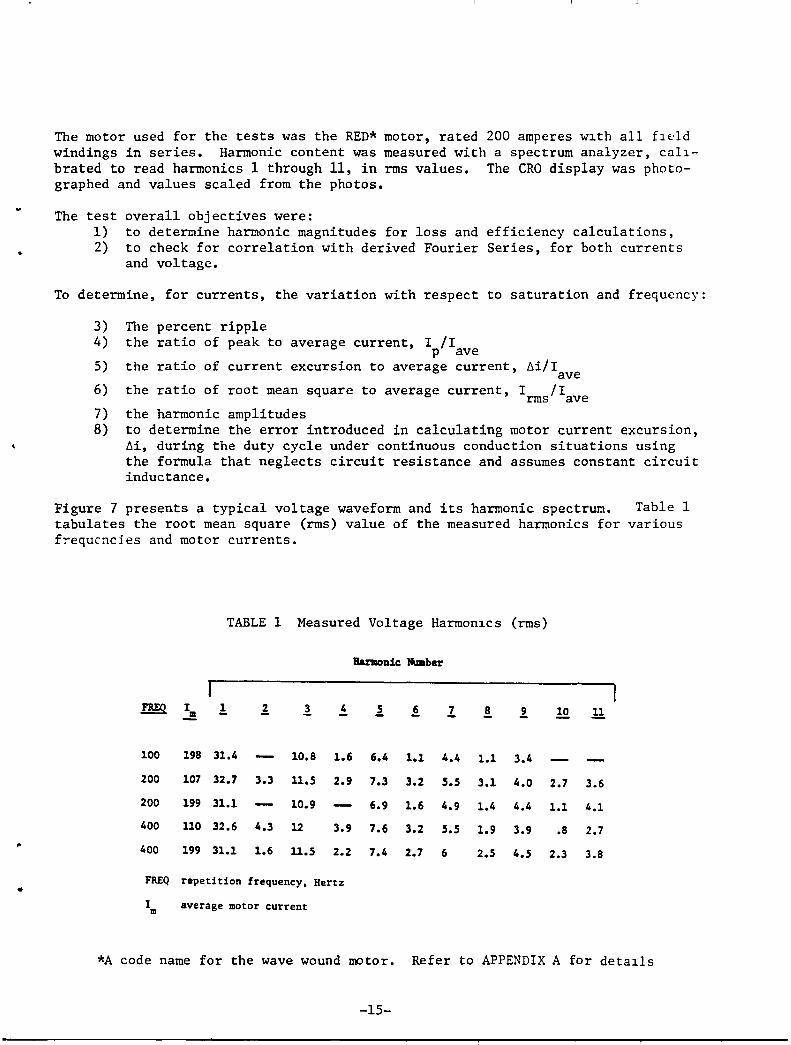
The motor used for the tests was the RED* motor, rated 200 amperes w~th all fl~ld windings in series. Harmonic content was measured with a spectrum analyzer, calIbrated to read harmonics 1 through 11, in rms values. The eRO display was photographed and values scaled from the photos.
The test overall objectives were: 1) to determine harmonic magnitudes for loss and efficiency calculations, 2) to check for correlation with derived Fourier Series, for both currents
and voltage.
To determine, for currents, the variation with respect to saturation and frequency:
3) 4)
5)
6)
7) 8)
The percent ripple the ratio of peak to average current, I II
pave the ratio of current excursion to average current, t:.i/I ave the ratio of root mean square to average current, I /1
rms ave the harmonic amplitudes to determine the error introduced in calculating motor current excursion, ~i, during the duty cycle under continuous conduction situations using the formula that neglects circuit resistance and assumes constant circuit inductance.
Figure 7 presents a typical voltage waveform and its harmonic spectrum. Table 1 tabulates the root mean square (rms) value of the measured harmonics for various f~equc~cjes and motor currents.
TABLE 1 Measured Voltage HarmonICS (rms)
Barmon1c: Number
!!m I ! 1. 1. .! 1 ! 1 ! ! II II ...!!
100 198 31.4 10.8 1.6 6.4 1.1 4.4 1.1 3.4
200 107 32.7 3.3 11.5 2.9 7.3 3.2 5.5 3.1 4.0 2.7 3.6
200 199 31.1 10.9 6.9 1.6 4.9 1.4 4.4 1.1 4.1
400 110 32.6 4.3 12 3.9 7.6 3.2 S.S 1.9 3.9 .8 2.7
400 199 31.1 1.6 11.5 2.2 7.4 2.7 6 2.S 4.S 2.3 3.8
FREQ repetition frequency, Hertz
I average motor current m
*A code name for the wave wound motor. Refer to APPENDIX A for deta~ls
-15-
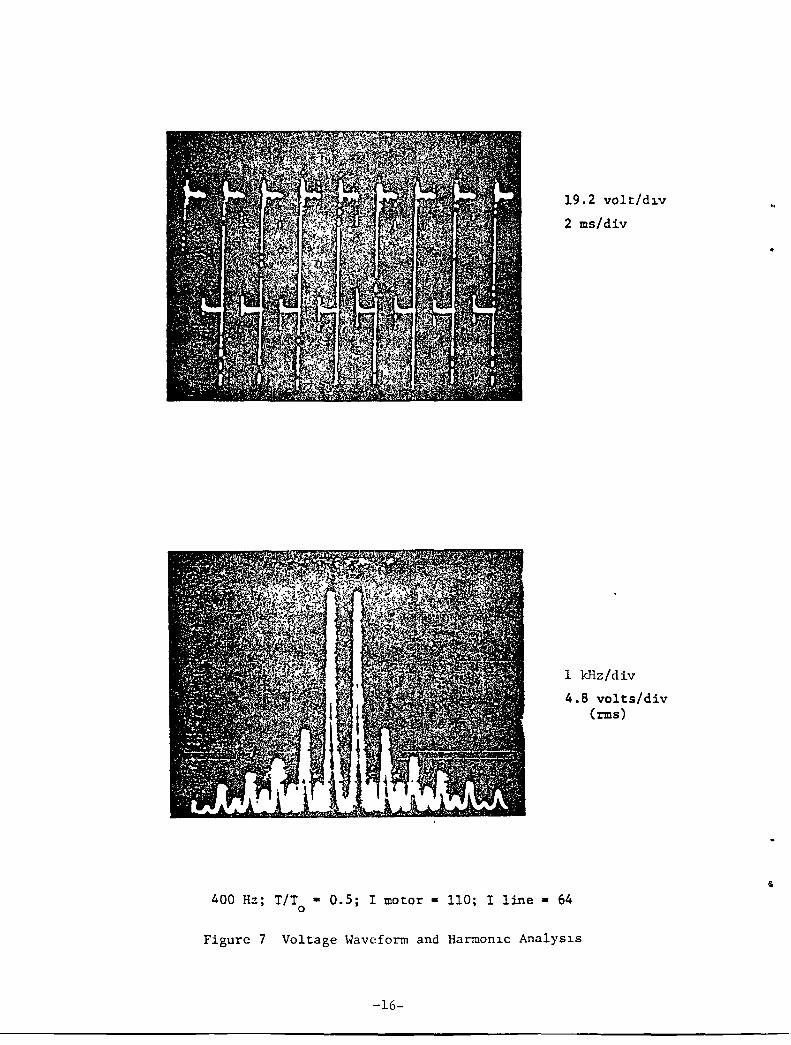
19.2 vo1t/d~v
2 ms/div
1 kHz/div
4.8 vo1ts/div (rms)
400 Hz; TIT • 0.5; I motor • 110; I line - 64 o
Figure 7 Voltage Waveform and Harmon~c Analys~s
-16-
•
•
Although theoretically no even harmonics are generated, they are in fact present. This is explained by the fact that the voltage is a) not a constant during "on tl.me" (due to resistance drop), b) is not zero during "off time", (due to free wheeling diode drop) and c) surges and oscillations are present. Scaling errors are also present.
The rms value of the alternating components of, for example, the test at 400 Hz, I = 110, is 36.9 volts. The average voltage (based on,aO volts open circuit) m, 2 2 was 40 volts. The net rms voltage is V40 + 36.9 = 54 volts •
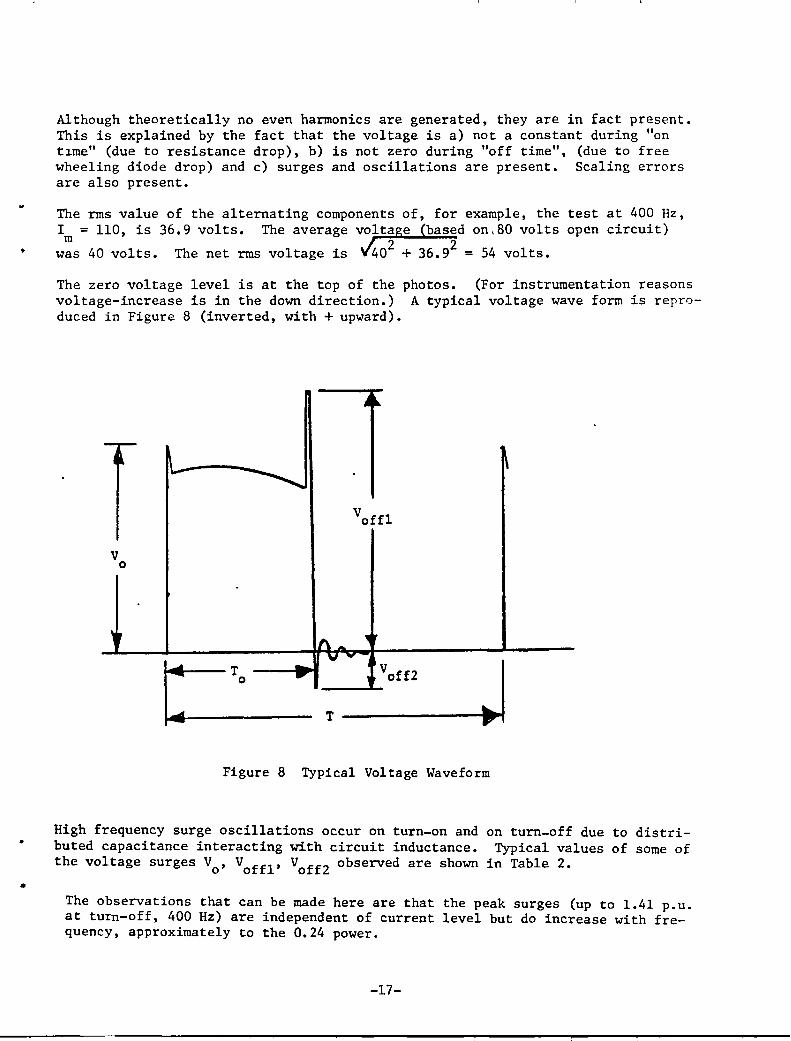
The zero voltage level is at the top of the photos. (For instrumentation reasons voltage-increase is in the down direction.) A typical voltage wave form is reproduced in Figure a (inverted, with + upward).
v o
T
Veffl
.1 Figure a Typical Voltage Waveform
High frequency surge oscillations occur on turn-on and buted capacitance interacting with circuit inductance. the voltage surges Vo ' Voffl ' Voff2 observed are shown
on turn-off due to distriTypical values of some of
in Table 2 •
The observations that can be made here are that the peak surges (up to 1.41 p.u. at turn-off, 400 Hz) are independent of current level but do increase with frequency, approximately to the 0.24 power.
-17-
TABLE 2 Turn-Off Voltage Surges
- Voltage Surges -
I V Voffl Voff2 m 0
100 198 77 90 15
200 107 77 107 23.5
200 199 73 107 30
400 110 80 ll3 15
400 199 80 ll3 28
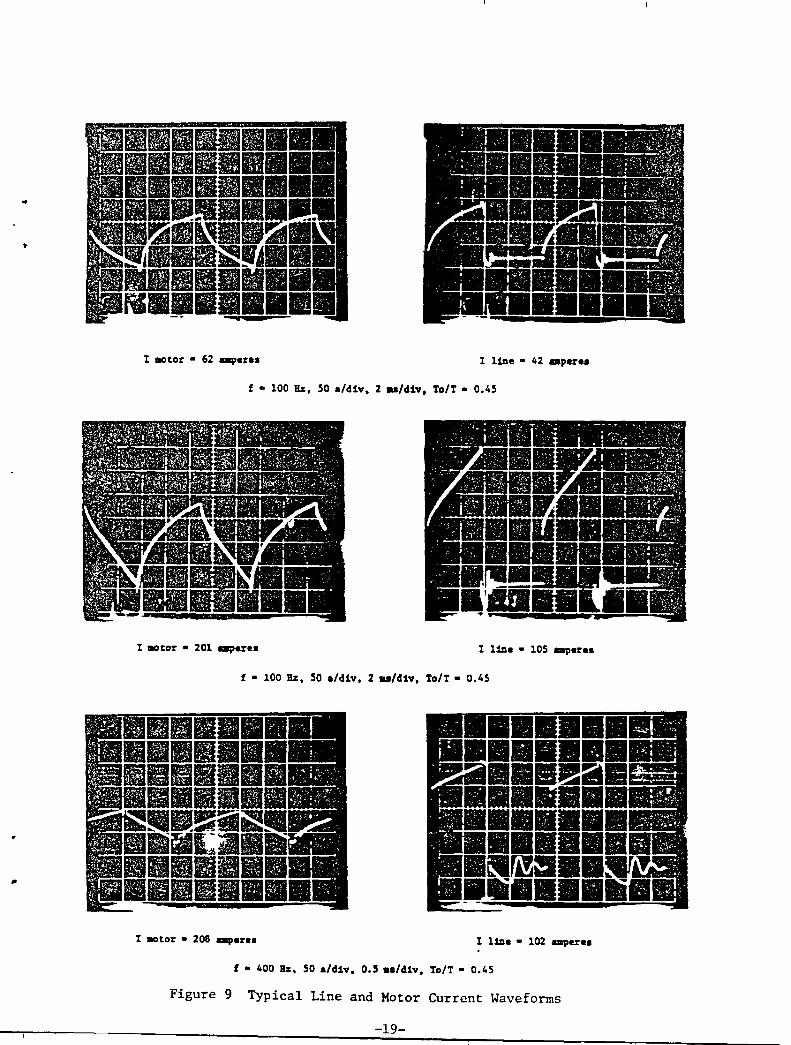
The CRO photos shown in Figure 9 are typical of the current waveforms observed. As average motor current increases, or as frequency increases, the waveforms change rather dramatically. Current excursion, ~i, decreases sharply as frequency is increased from 100 to 400 Hz (as expected from equation 4). Also, the excursions tend to become more 'linear' as both frequency and average current are increased (due to decreasing inductance with increasing current level). However, based on measured values of inductance and apparent resistance as a function of frequency and saturation on this motor, L/R of the motor was found
to be 0.227f-0• 94 •
The tests, for photos shown, were conducted with T /T ratio of on-time to the circuit time constant is: 0
T o
L/R 0.45
f 0.227 '" 2
0.45. Since T f-l , the
(5)
from which it can be seen that "on t1.me" is nearly 2 time constants in duration and approximately independent of frequency, which indicates the assumption made in deriving the linear relationships is not a valid assumption and considerable error will result if used. Also, it contradicts the increasing ~i linearity with increasing frequency.
The observed fact that current increase and decay becomes more linear with increase in saturation and frequency is apparently due to eddy current effects, which retard the change of flux in the iron surrounding the conductors.
Tests were conducted over the frequency range of 67 to 400 Hz, at brush positions from mechanical neutral (00
) to 280 against rotation (magnetic neutral) (_280
). Data obtained from the photos taken (waveform and spectrum analyzer) is the basis for the results plotted in the following figures.
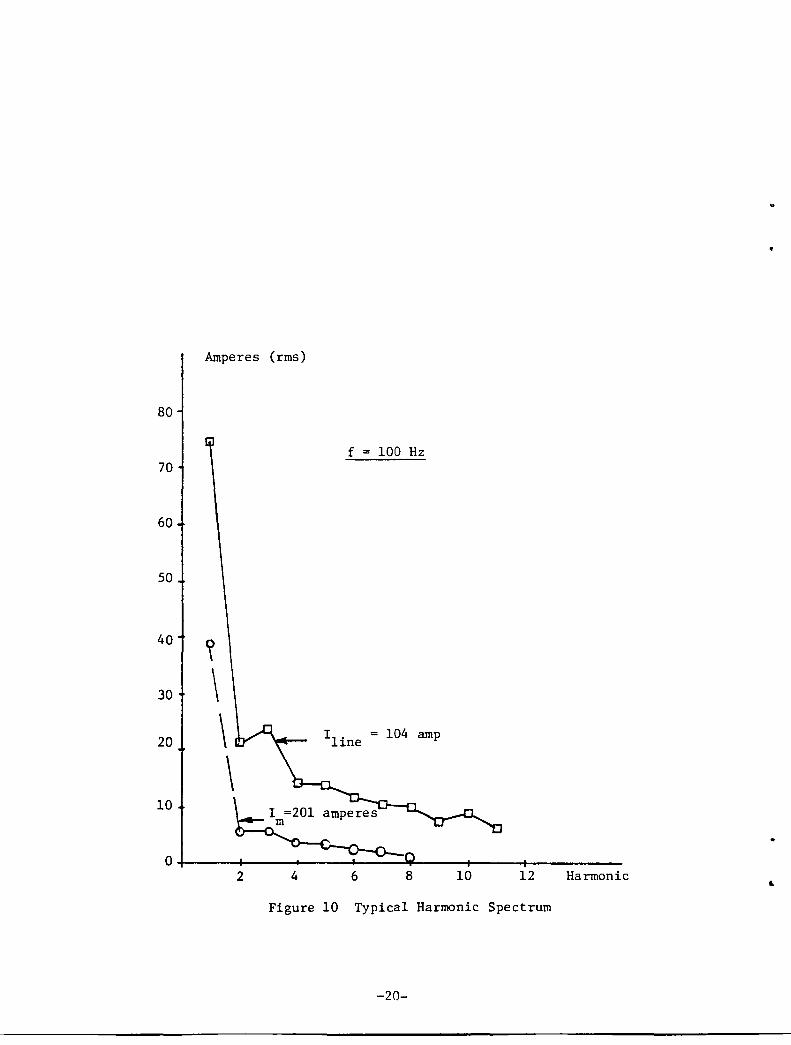
Figure 10 shows typical harmonic spectra for motor and line current. These spectra are for 100 Hz, with the brushes on 00 and on _28 0
• Brush shift has no effect on harmonic magnitude distribution. The average motor current was 200 amperes, the average line current, 104 amperes. Figure 11 is a plot of the
-18-
..
,
•
I .ator • 62 .-per •• I line • 42 _par ••
f • 100 Hz, 50 a/dlv, 2 .. /dlv, TolT • 0.45
I .ator • 201 8Bper •• I line • 105 _par ••
f • 100 Hz, 50 a/dlv, 2 .. /dlv, TolT • 0.45
•
I .ator • 208 .-pere. I line • 102 ampere.
f • 400 Hz, 50 ./dlv, 0.5 •• /dlv, TolT • 0.45
Figure 9 Typical Line and Motor Current Waveforms
-19-
Amperes (rms)
80
f 100 Hz 70
60
50
40 ~
30 \ 20 \ I1ine 104 amp
\ 10
• 0
2 4 6 8 10 12 Harmonic
Figure 10 Typical Harmonic Spectrum
-20-
..
I line Amperes
80 (nIls) _280 Brush shift
1st harmonic only
60 67 Hz
40 100 Hz
~200 Hz
20 I motor • .---. • .- 400 Hz • • • • o +---~~---+----4-----r---~----~------
o
80
60
40
20
40
Amperes (rms)
I nx>tor{
80 120
• •
160
I line
• •
200 240 Average Amperes
00 Brush shift st
1-- harmonic only
100 Hz
200 Hz
• -400 Hz
0+-------~------~---~~----4-------+------~------------
o 40 80 120 160 200
Figure 11 1st Harmonic Variations
-21-
240 Average Amperes
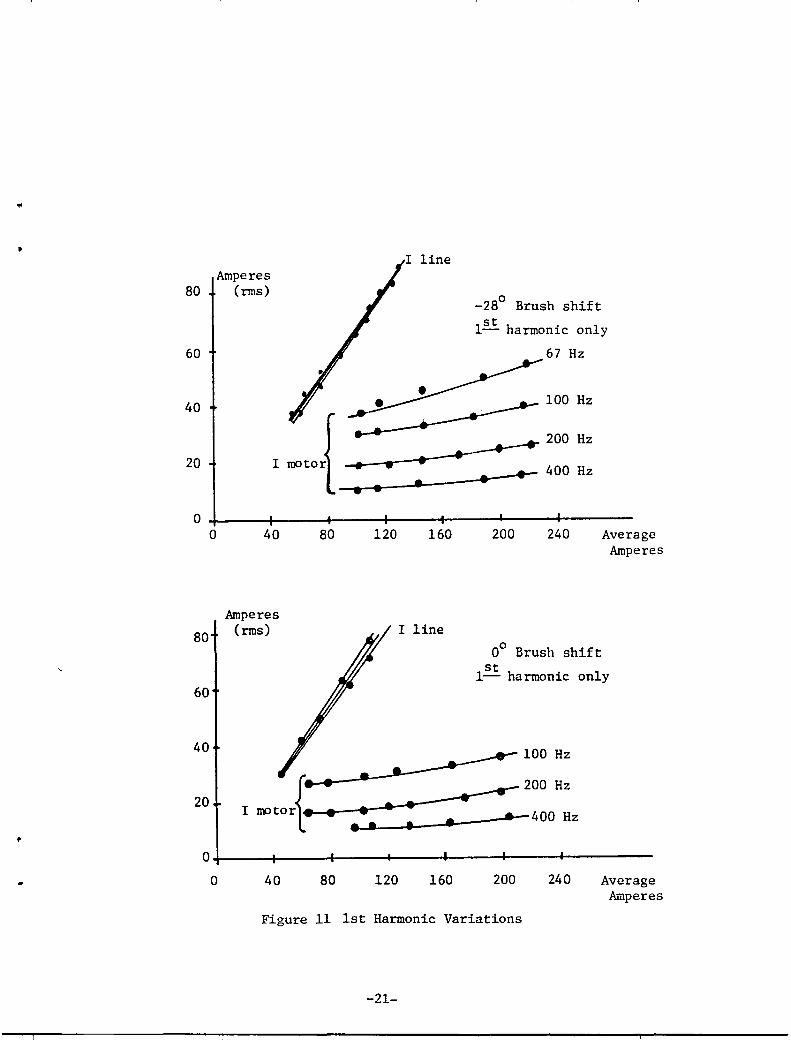
1st harmonic magnitude of motor and line current as a fune t.wn of frequency, average current and brush sh1ft. As can be seen, the 1st harmonic of line current is nearly independent of frequency and is highly dependent upon average current level. The 1st harmonic of motor current, for a given frequency 1S nearly independent of -average current level but highly frequency dependent.
The ratio of root mean square to average value of current was calculated. For all frequencies, the ratio, for llne current, varied from 1.25 to 1.2. The variation, for motor currents, 100 < I < 210, was as shown 1n Table 3.
m
TABLE 3 Ratio of rms/average Motor Current
Frequency
67
100
200
400
1.03 - 1.07
1.02 - 1.05
1.01 - 1.02
1.002 - 1.008
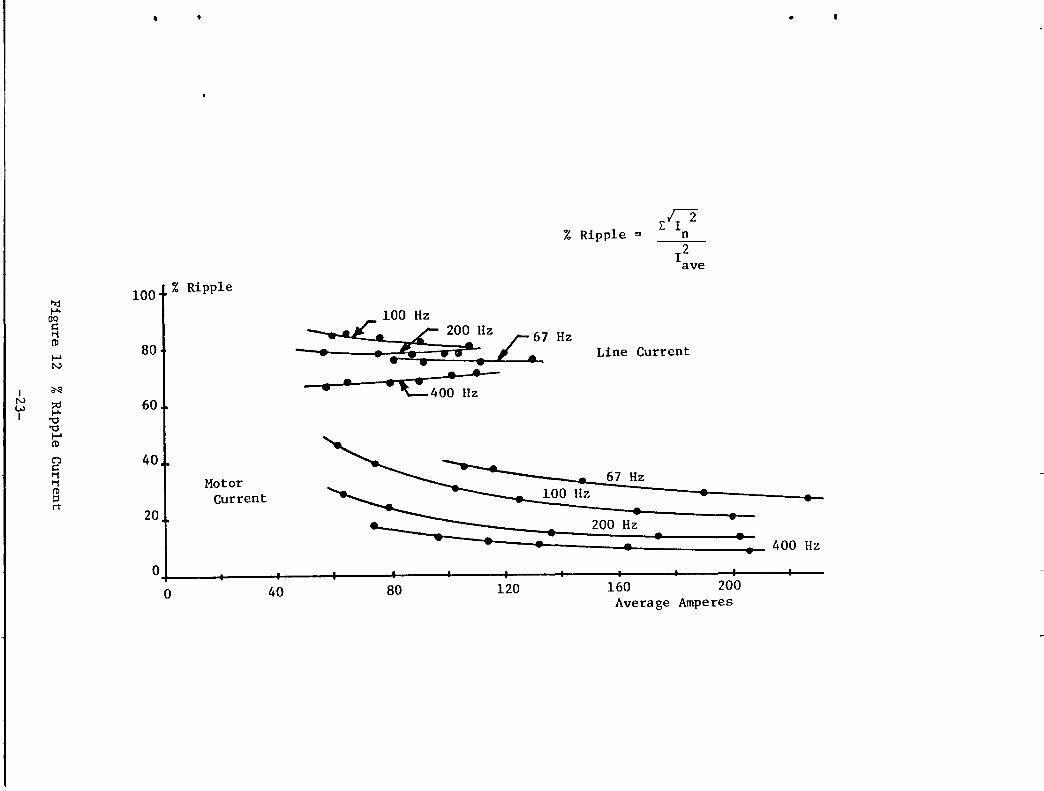
The percentage or ripple current, calcuated as:
% Ripple - ~\ r/ ave
(6)
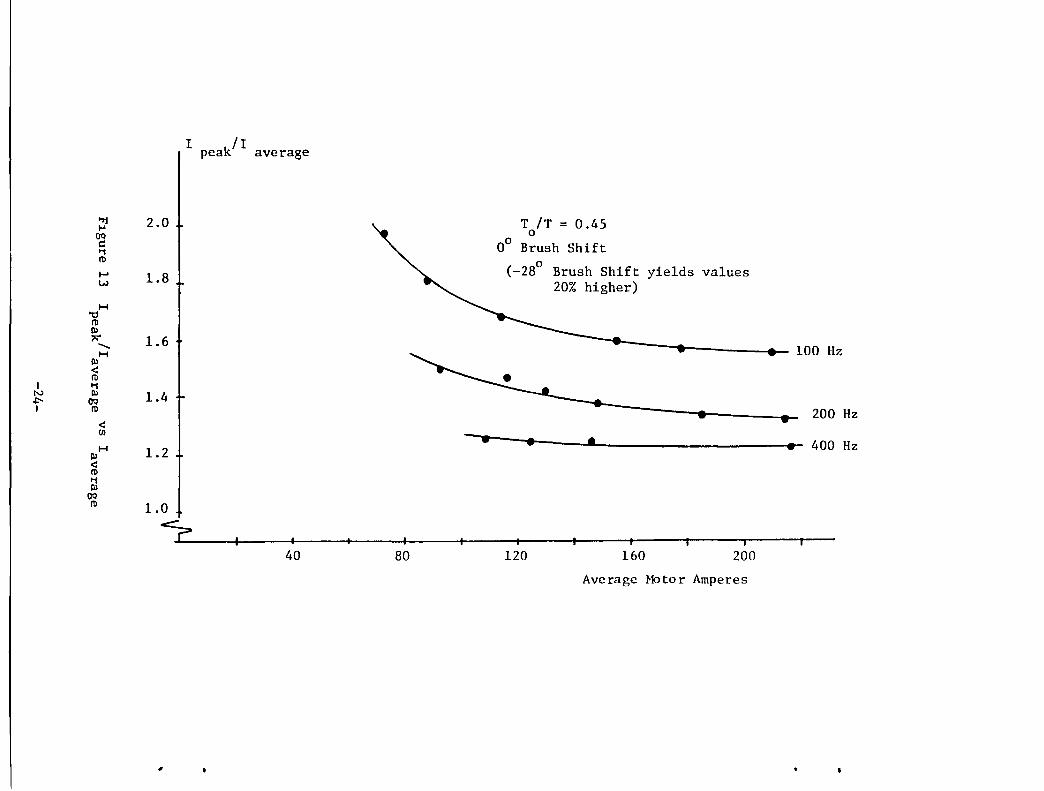
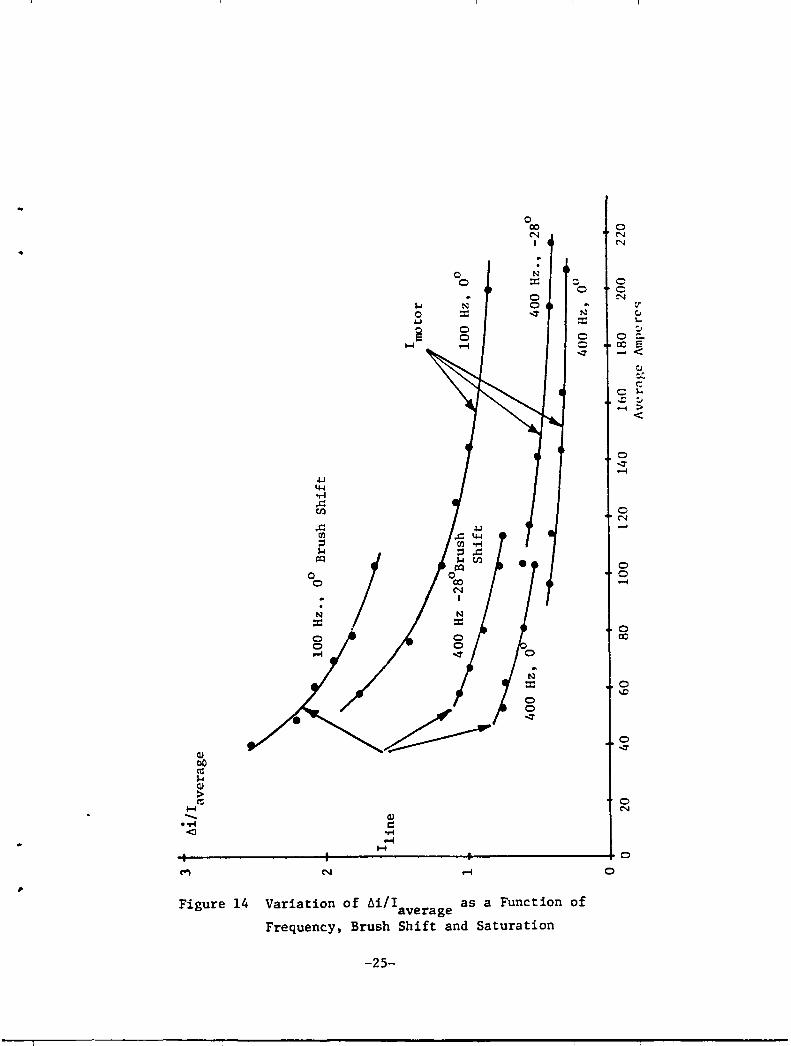
1S shown in Flgure 12 for varl0US frequencie& and average amperes. As can be seen, motor current ripple is nearly inversely proportional to frequency (lower ~i) whereas line current ripple 1S not so heavily frequency dependent. Motor current % ripple decreases considerably (by about 33%) as average current increased from 30-100% of rating. The percent ripple current is independent of brush shift. Figure 13 depicts the variation of the ratio of peak to average motor current; Figure 14 shows the ratio of current excursion (~i), during a duty cycle, to average lipp and motor current. These ratios are nearly inversely proportional to frequency. These latter ratios were found to be brush position sensitive (because L decreases about 20% with a _280 brush shift).
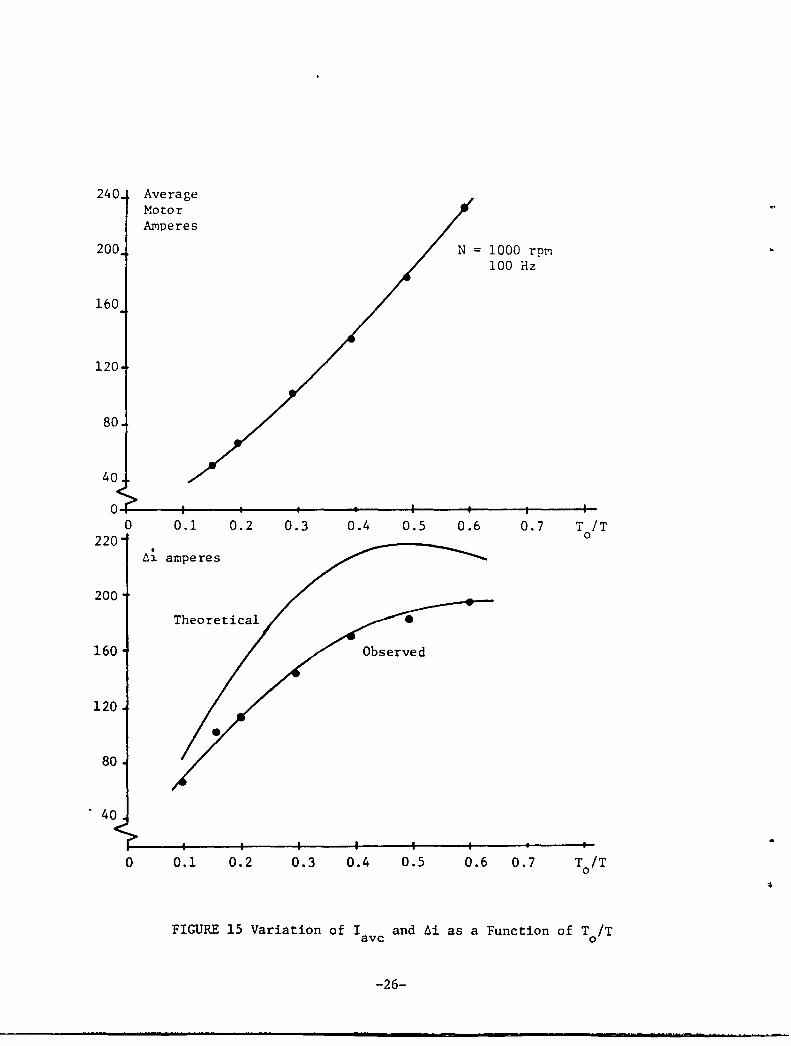
Observed values of ~i as T /T is varied from 0.1 to 0.6 are plotted in Figure 15. o
The values are for T = 0.010 seconds (100 Hz) speed at 1000 rpm. voltage at 86 volts. The variation in average motor current is also shown.
Equation (4), with L = 0.91 mH (value for 100 amperes, 100 Hz, which occurs at T /T = 0.3) and V = 86 volts was used to calculate ~i for various T /T. This
o 0
theoretical, linearized variation is also shown in Figure 15. Considerable error is present. For example, at T /T = 0.3 the calculated value of ~i = 198
o
-22-
..
•
+
..
"xj t-'.
~ (1)
I-' N
I ~
N :;d \.;.) t-'. I '"d '"d I-' (1)
(")
R Ii (1) ::s rt
. ~
100
80
60
40
20
% Ripple
Motor Current
-~ • - '-=--400 Hz
----
% Ripple = [;0
n
12 ave
Line Current
•
400 Hz
O+I __ -+ __ ~ __ ~~ __ +---~--~--__ --~---+--~~~--160 200 o 40 80 120
Average Amperes
>Jj ~
CJQ c: '"1 II)
f-' W
H '1:1 III III ,...
........ H
III <: III
I '"1 N III .j::'- CJQ I III
<: (f)
H III <: III '"1 III
CJQ III
I II peak average
2.0
1.8
1.6
1.4
1.2
T IT = 0.45 o
00 Brush Shift
(_280 Brush Shift yields values 20% higher)
100 Hz
200 Hz
..... • • 400 Hz
1.0 I
~~~~--~~~~~~~~~~ 40 120 160 80 200
Average Motor Amperes
,
0 CO 0 N N I N
0 N 0 ::c c 0
0 0 0 N
'"' N 0 ~ ~
0 ::c ~ N c" .u ::c ~
a 0 ':.I 0 0 0
~ 1-1 .-I - co ..... ~ .....
':.I (;[. r.
0 ~ ,:; ':.I .-I :>
<
0 ~ .-I
.u 4-l 'T"l ,..c:: CJ) 0
N ,..c:: ..... rn ;::l ~
r.:Q 0
0 0 0 .....
N ::c
0 co
0 ..:J
/-- 0
Qj ~
bO III
'"' Qj
> r:l 0
1-1 N - Qj -'1"4 c: <l 'T"l
.-I 1-1
0
M N .-I 0
, Figure 14 Variation of 61/1 as a Function of average
Frequency, Brush Shift and Saturation
-25-
240 Average
200
160
120
80
40
Motor AMperes
N 1000 rpM 100 nz
O~----+-----+-----~--~~--~-----+-----r----~ a
220
200
160
120
80
o
0.1 0.2 0.3 0.4 0.5 0.6 0.7 T IT o .
ll1 amperes
0.1 0.2 0.3 0.4 0.5 0.6 0.7
FIGURE 15 Variation of I and 6i as a Function of T IT ~c 0
-26-
> ... >
amperes is 1.42 t1mes the observed experimental value of 150 amperes.
According to equation (4) the value of ~i at T IT = 0.5 should be the same as o
the value at 0.4. at 0.4. This is lower inductance
The actual value at 0.6 is 1.14 times greater than the value no doubt due to the heavy level of saturation (230 amperes) and than at T IT = 0.4 (140 amperes).
o
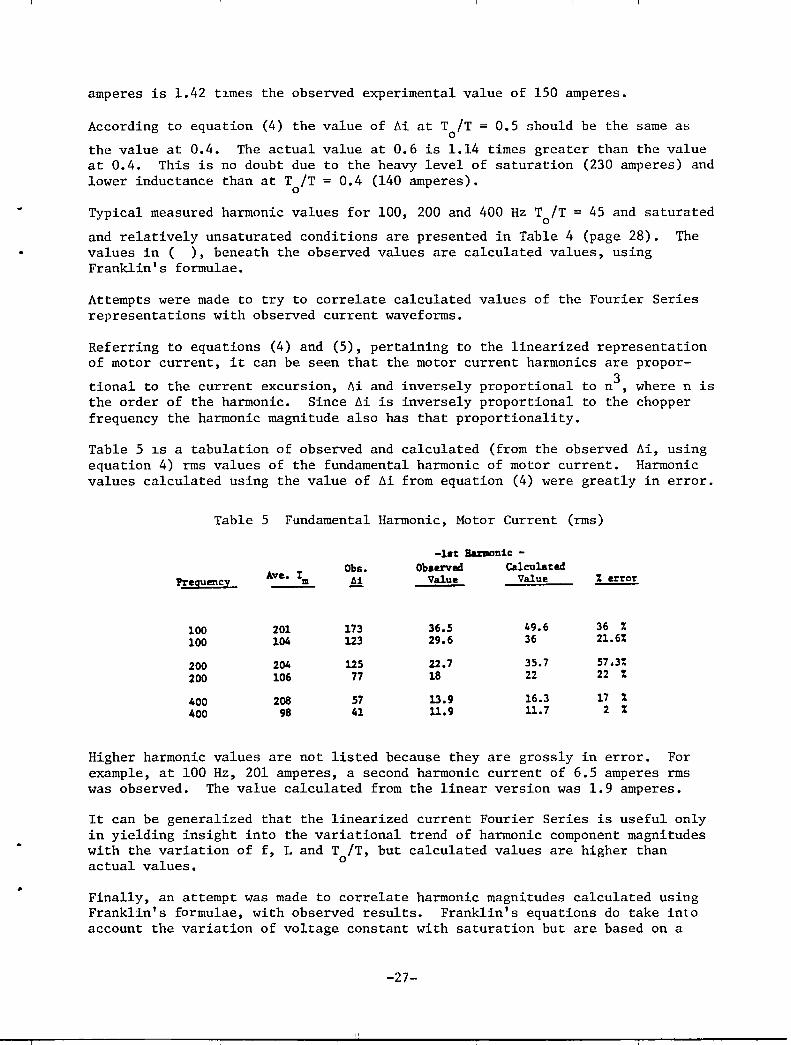
Typical measured harmonic values for 100, 200 and 400 Hz T IT = 45 and saturated o
and relatively unsaturated conditions are presented in Table 4 (page 28). The values in ( ), beneath the observed values are calculated values, using Franklin's formulae.
Attempts were made to try to correlate calculated values of the Fourier Series representations with observed current waveforms.
Referring to equations (4) and (5), pertaining to the linearized representation of motor current, it can be seen that the motor current harmonics are propor-
tional to the order frequency
the current excursion, ~i and inversely proportional to of the harmonic. Since ~i is inversely proportional to the harmonic magnitude also has that proportionality.
n3 , where n is the chopper
Table 5 1S a tabulation of observed and calculated (from the observed ~i, using equation 4) rms values of the fundamental harmonic of motor current. Harmonic values calculated using the value of ~i from equation (4) were greatly in error.
Table 5 Fundamental Harmonic, Motor Current (rms)
-18t BarIIIon1c -Obs. Obaerved Calc:ulated
lregue:nc:y Ave. 1111 A! Value Value % error
100 201 173 36.5 49.6 36 %
100 104 123 29.6 36 21.6%
200 204 125 22.7 35.7 57.3% 200 106 77 18 22 22 %
400 208 57 13.9 16.3 17 %
400 98 41 11.9 11.7 2 %
Higher harmonic values are not listed because they are grossly in error. For example, at 100 Hz, 201 amperes, a second harmonic current of 6.5 amperes rms was observed. The value calculated from the linear version was 1.9 amperes.
It can be generalized that the linearized current Fourier Series is useful only in yielding insight into the variational trend of harmonic component magnitudes with the variation of f, Land T IT, but calculated values are higher than
o actual values.
Finally, an attempt was made to correlate harmonic magnitudes calculated using Franklin's formulae, with observed results. Franklin's equations do take into account the variation of voltage constant with saturation but are based on a
-27-
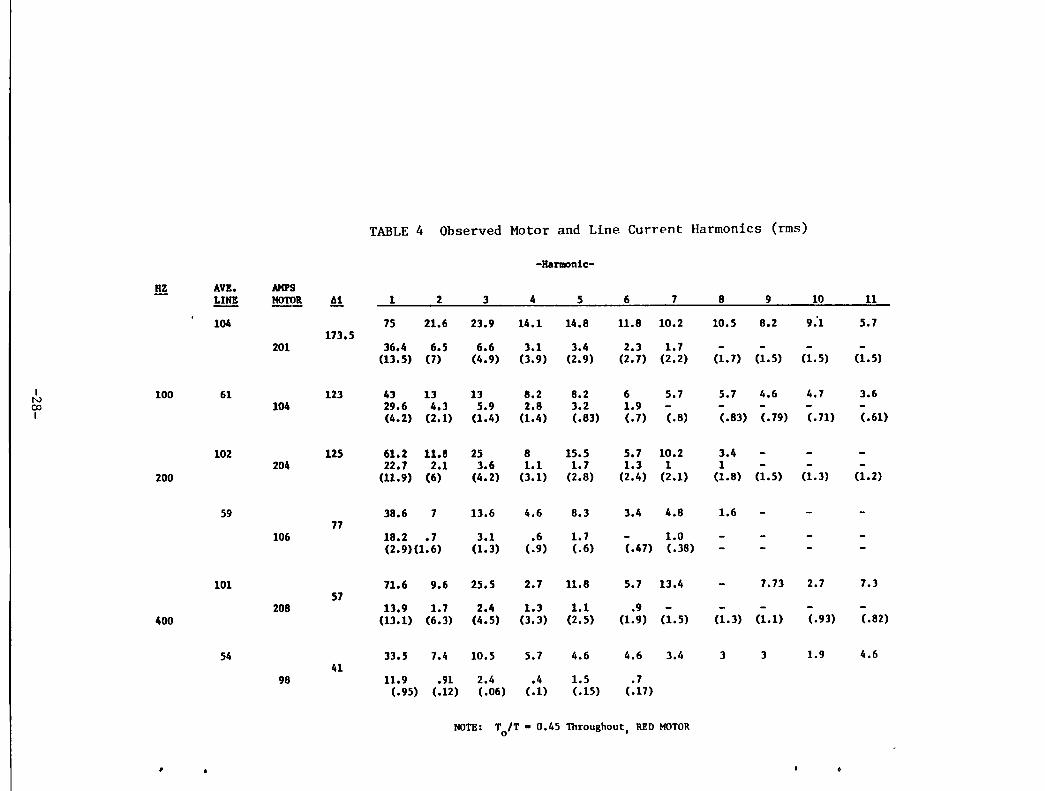
TABLE 4 Observed Motor and Line Current Harmonics (rms)
-Hal1llOnic-
!!! AV!. AMPS LINE MOTOR A1 1 2 3 4 S 6 7 8 9 10 11
104 75 21.6 23.9 14.1 14.8 11.8 10.2 10.5 8.2 9:1 5.7 173.5
201 36.4 6.5 6.6 3.1 3.4 2.3 1.7 (13.5) (7) (4.9) (3.9) (2.9) (2.7) (2.2) (1.7) (1.5) (1.5) (1.5)
I 100 61 123 43 13 13 8.2 8.2 6 S.7 S.7 4.6 4.7 3.6 N 00 104 29.6 4.3 5.9 2.8 3.2 1.9 I (4.2) (2.1) (1.4) (1.4) (.83) (.7) (.8) (.83) (.79) (.71) (.61)
102 125 61.2 11.8 25 8 15.5 5.7 10.2 3.4 204 22.7 2.1 3.6 1.1 1.7 1.3 1 1
200 (11.9) (6) (4.2) (3.1) (2.8) (2.4) (2.1) (1.8) (1.5) (1.3) (1.2)
59 38.6 7 13.6 4.6 8.3 3.4 4.8 1.6 77
106 18.2 .7 3.1 .6 1.7 1.0 (2.9)(1.6) (1.3) (.9) (.6) (.47) (.38)
101 71.6 9.6 25.5 2.7 11.8 5.7 13.4 7.73 2.7 7.3 57
208 13.9 1.7 2.4 1.3 1.1 .9 400 (13.1) (6.3) (4.5) (3.3) (2.5) (1.9) (1.5) (1.3) (1.1) (.93) (.82)
54 33.5 7.4 10.5 5.7 4.6 4.6 3.4 3 3 1.9 4.6 41
98 11.9 .91 2.4 .4 1.5 .7 (.95) (.12) (.06) (.1) (.15) (.17)
NOTE: TolT • 0.45 Throughout, RED MOTOR
,.
constant value of Land R. Use of the dc resistance of 0.0254 ohms and the value of L, at 100 Hz, saturated, of 0.91 mH were chosen as representative values which should yield maximum value of harmonics. The calculated results are shown, for motor current, in ( ), immediately below the observed values in Table 4. As can be seen, the calculated values are grossly in error and predict only a fraction of the magnitude of hamonic observed - especially for the lower harmonics. The magnitude of lower harmonics may have some error due to error in magnitude measurement. The error is much greater than that resulting from calculations using the linearized version of motor current!
The inescapable conclusion of these tests is that accurate analytical prediction of harmonic current magnitude is not possible with either representation and that accurate values can be obtained only by actual measurement.
Instrumentation Requirements
Average values of current and voltage can be measured using noninductive shunts (NIS) and variable sample rate digital voltmeter (DVMs). The NIS shunt used in this test program was 0.001 ohm, 275 amps continuous with a 6.5 MHz bandwidth.
Tests were conducted to compare voltage drop waveforms and average values of the response from the noninductive shunt, a "conventional" off-the-shelf instrument shunt and a conventional shunt modified to attempt to cancel the field established by the shunt itself. The modification was not noticeably effective. A difference of about 2% was noted in the average readings of the conventional shunt and NIS and as much dS 2-to-l difference in observed magnitude of high frequency oscillations after thyristor cut-off. If accuracy of waveforms and current values is required, it is essential to use noninductive shunts.
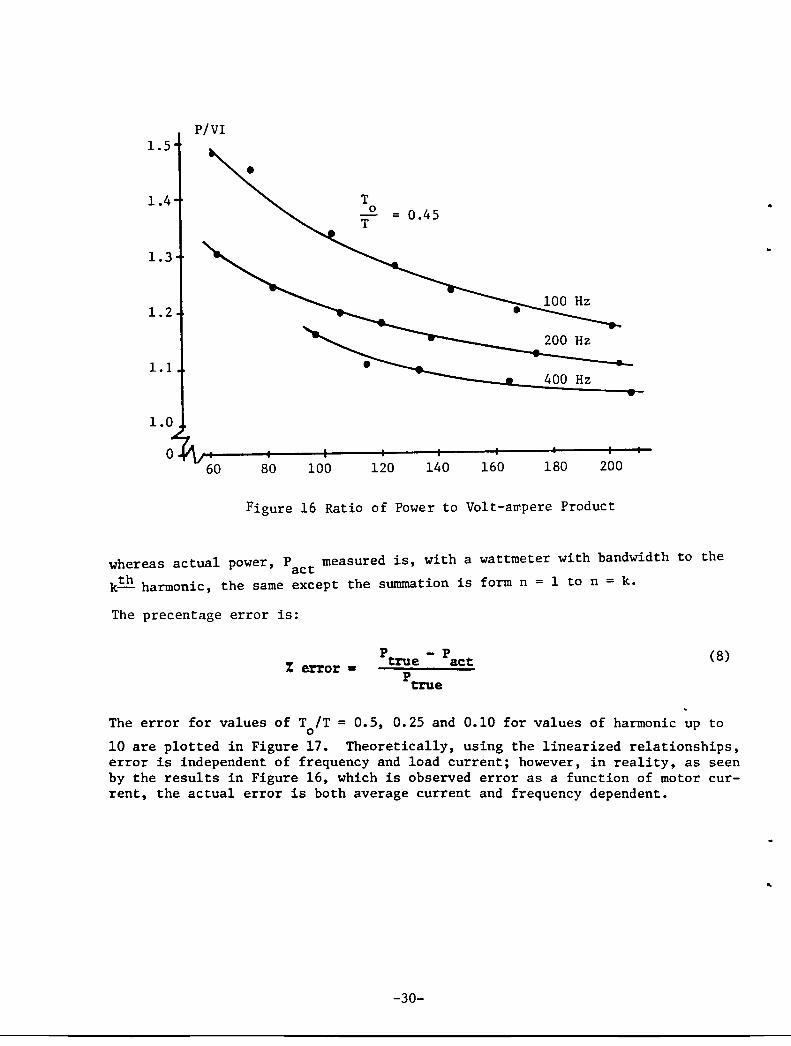
Power measurements also require consideration due to the complex waveforms of voltage and current. The necessity for a wattmeter with a wide bandwidth response is portrayed graphically in Figure 15, which shows the ratio of power indicated by the Clark-Hess electronic wattmeter (with 0.6%fs accuracy over the frequency range dc to 30 kHz) and the product of motor current and voltage as read by the average reading DVMs. Errors shown range from 4% at 400 Hz, with reduced current excursion, ~i, to 33% at 100 Hz (increased i~).
A theoretical insight into wattmeter bandwidth can be obtained by multiplying equations (1) and (2) to obtain the product of instantaneous, linearized, voltage and line current which yields instantaneous power. When this is integrated over a complete period, true power is obtained as:
( TO)2 ( nrrTO/T) 2 T sin nrrT IT
o
(7)
-29-
1.5
1.4
1.3
1.0
o
p/VI
I I
60 80 100 120 140 160 180 200
Figure 16 Ratio of Power to Volt-a~pere Product
whereas actual power, P measured is, with a wattmeter with bandwidth to the act
kth harmonic, the same except the summation is form n = 1 to n = k.
The precentage error is:
% error • p - p true act
p true
(8)
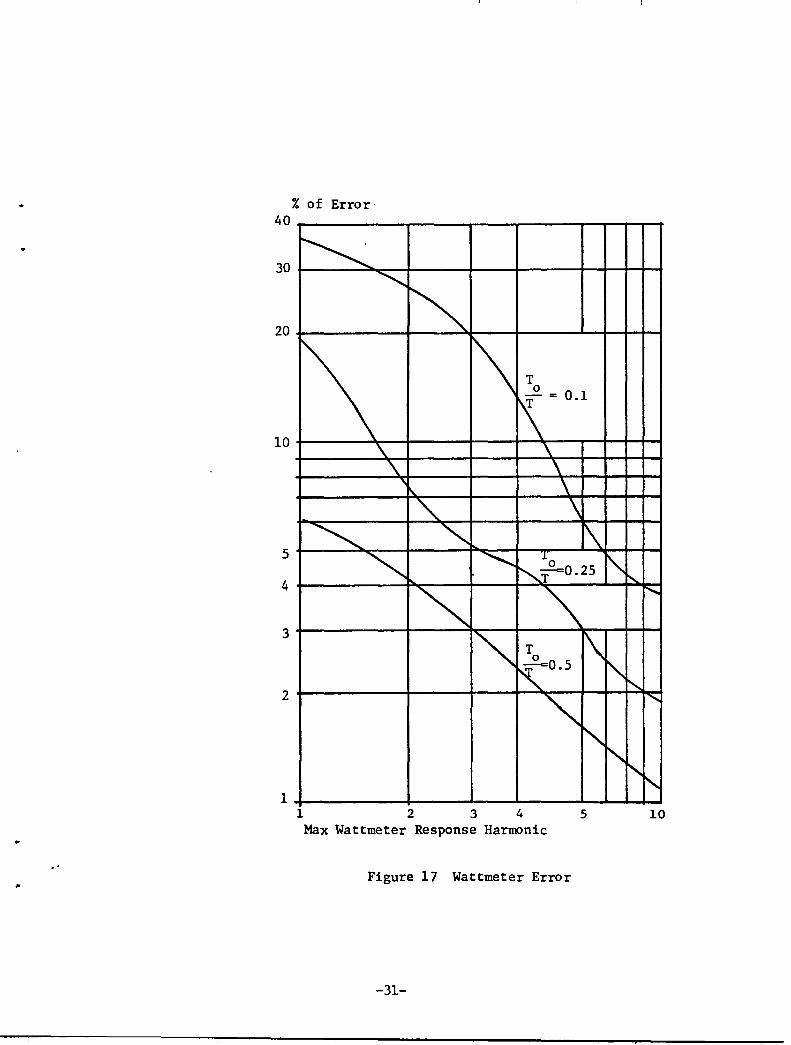
The error for values of T IT = 0.5, 0.25 and 0.10 for values of harmonic up to o
10 are plotted in Figure 17. Theoretically, using the linearized relationships, error is independent of frequency and load current; however, in reality, as seen by the results in Figure 16, which is observed error as a function of motor current, the actual error is both average current and frequency dependent.
-30-
..
% of Error' 40
30 ~ ...........
~ 20
1\ T 0 1\ : 0.1
\. ~ 10
\. ~ \
'" \
~ '" l
'" ............... J.o " ~TOo2S I'-.
~ ~ I ........
I'" T 1\ 0
KOoS " ~ '" ""
5
4
3
2
" '" "" f'. 1 1 2 3 4 5 10
Max Wattmeter Response Harmonic
.. Figure 17 Wattmeter Error
-31-
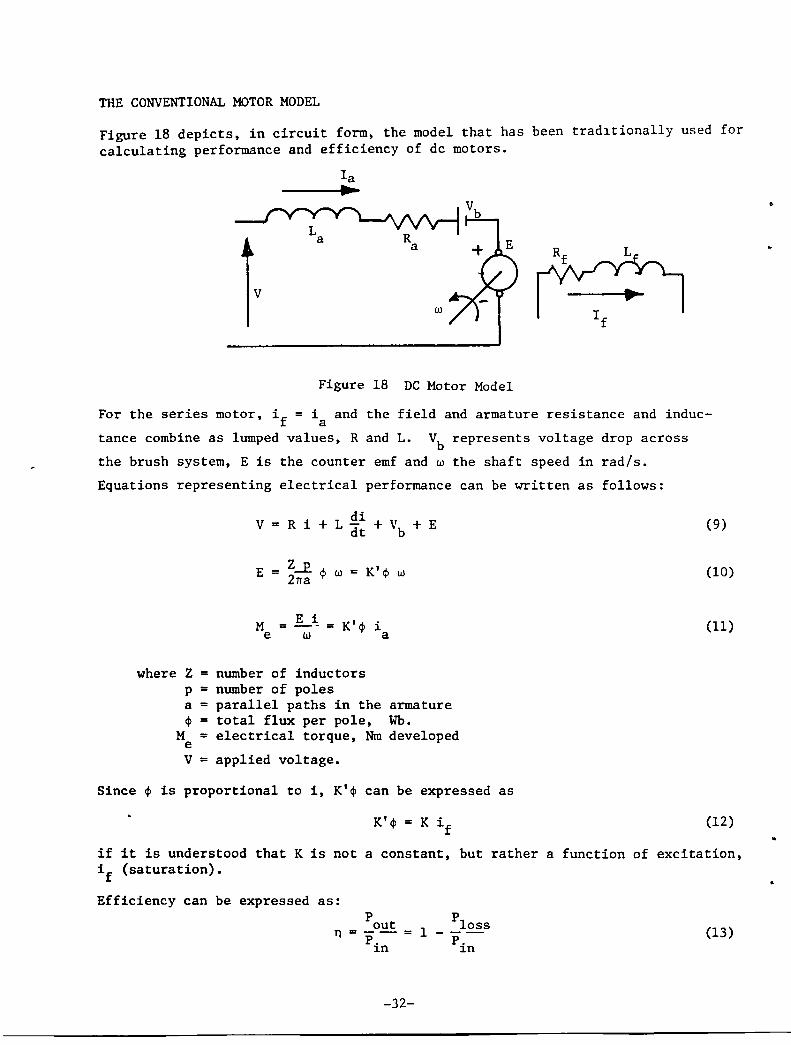
THE CONVENTIONAL MOTOR MODEL
Figure 18 depicts, in circuit form, the model that has been trad1tionally used for calculating performance and efficiency of dc motors.
Ia
•
Figure 18 DC Motor Model
For the series motor, if = ia and the field and armature resistance and induc
tance combine as lumped values, Rand L. Vb represents voltage drop across
the brush system, E is the counter emf and w the shaft speed in rad/s.
Equations representing electrical performance can be written as follows:
V = R i + L ~! + Vb + E
E = Z-E ~ w = K'~ w 211"a 't' 't'
M e E i = -- =
w K'¢> i
a
where Z P
= number of inductors = number of poles
a = <P =
M = e V =
parallel paths in the armature total flux per pole, Wh. electrical torque, Nm developed
applied voltage.
Since <p is proportional to i, K'¢> can be expressed as
(9)
(10)
(11)
(12)
if it is understood that K is not a constant, but rather a function of excitation, if (saturation).
Efficiency can be expressed as: p out 1
n = Pi~ =
-32-
P loss ---P. 1n (13)
..
•
p
where P. is average power input and PI is the sum of the losses involved in 1n oss
the energy conversion process.
IEEE #113 (ref. 1) details procedures for parameter and performance determination based on ripple free dc or, to a limited extent, dc from a rectifier type supply. The losses addressed consist of:
2 Joule (I R) type losses Brush contact loss (VbI)
Rotational Core loss Stray load loss Friction, windage and ventilating loss.
Losses are discussed in detail in CHAPTER 3; however, in this brief overview of the use of the conventional model and in presenting its limitations as applied to the motors investigated in this program, the above listed losses are categorized as follows:
a.
b.
c.
d.
e.
f.
Joule loss is the I2R loss in the armature and series field, based on measured circuit resistance. Brush contact loss is based on measured voltage drop across the brush-commutator, including the non-linear carbon resistance and is considered constant. The brushes are supposedly on magnetic neutral and no rotational core loss is present. Stray load loss cannot be calculated or measured directly and is, in accordance with IEEE #113 (ref. 1), taken as 1% of the output power. The brush and bearing friction and windage are determined experimentally and designated as Pfw.
Ventilating requirements are not considered.
Parameter Measurement
Section 4.2, IEEE #113 specifies various methods of armature and field resistance measurement and Section 5.5.3 provides values for Vb for various brush types. In
the motors tested, brush (material) types were not known with certainty and therefore a "non-standard" test was utilized to determine Vb and total circuit resistance.
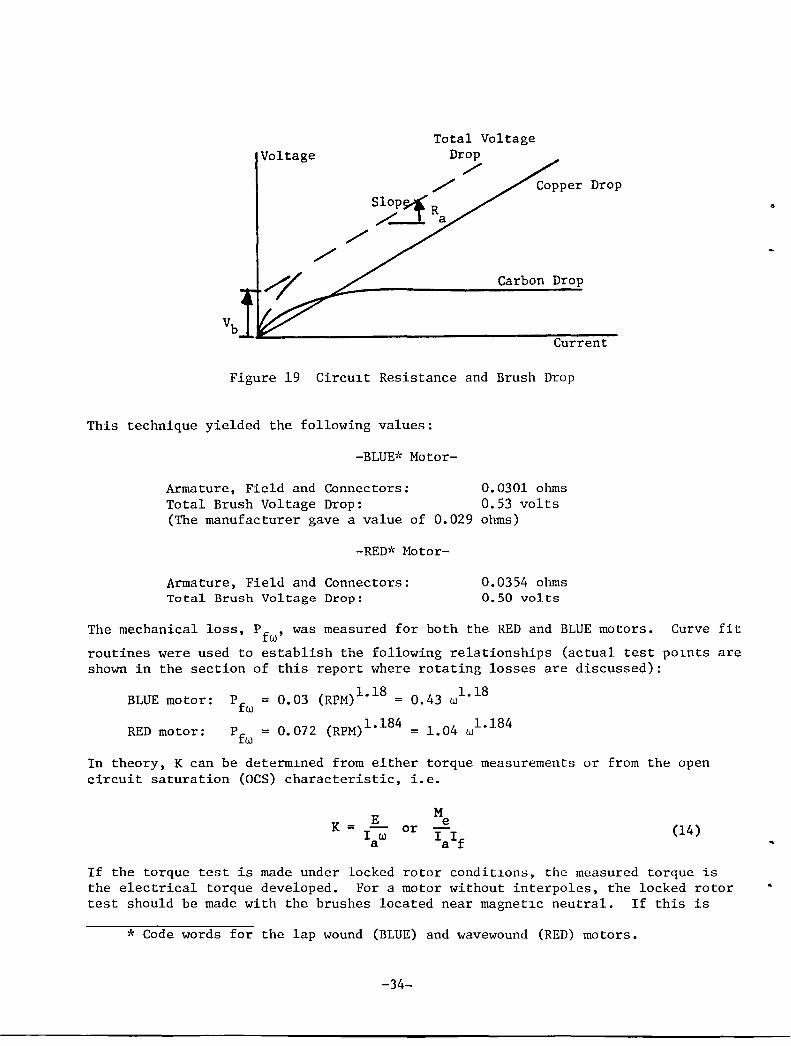
This test is based on the relationship shown in Figure 19.
Armature resistance is, of course, linear (at constant temperature). However, voltage drop across the brushes commences at zero with zero current, rising to a nearly constant value at somewhere between 20 and 40% of rated current in a reasonably designed brush system. The sum of a linear plus constant volt-ampere characteristic is also linear, displaced from the zero-intercept. The linear slope is the copper circuit resistance; the zero current intercept of the extended portion of the total is the brush voltage drop, Vb.
-33-
II
Total Voltage Voltage
,/'"
Drop
,/'" Slop~ R /---I a
./'
Carbon Drop
Vb -L·~~----------------------------------~C-u~r~r~e~n~t-
Figure 19 Circu1t Resistance and Brush Drop
This technique yielded the following values:
-BLUE* Motor-
Armature, Field and Connectors: 0.0301 ohms Total Brush Voltage Drop: 0.53 volts (The manufacturer gave a value of 0.029 ohms)
-RED'" Motor-
Armature, Field and Connectors: Total Brush Voltage Drop:
0.0354 ohms 0.50 volts
The mechanical loss, Pfw
' was measured for both the RED and BLUE motors. Curve fit
routines were used to establish the following relationships (actual test p01nts are shown in the section of this report where rotating losses are discussed):
BLUE motor: Pfw 0.03 (RPM)1.18 = 0.43 wl •18
RED motor: Pfw 0.072 (RPM)1.184 = 1.04 wl •184
In theory, K can be determ1ned from either torque measurements or from the open circuit saturation (OCS) characteristic, i.e.
K = E I w a
or (14)
If the torque test is made under locked rotor condit10ns, the measured torque is the electrical torque developed. For a motor without interpoles, the locked rotor test should be made with the brushes located near magnet1c neutral. If this is
* Code words for the lap wound (BLUE) and wavewound (RED) motors.
-34-
"
..
•
done, the brushes are near, or on, the brush location for proper commutation and are in the normal run location. For a series motor, so locating the brushes accounts for the demagnetizing effect of armature reaction and also for the loss of active conductors due to brush shift, which will exist under running conditions.
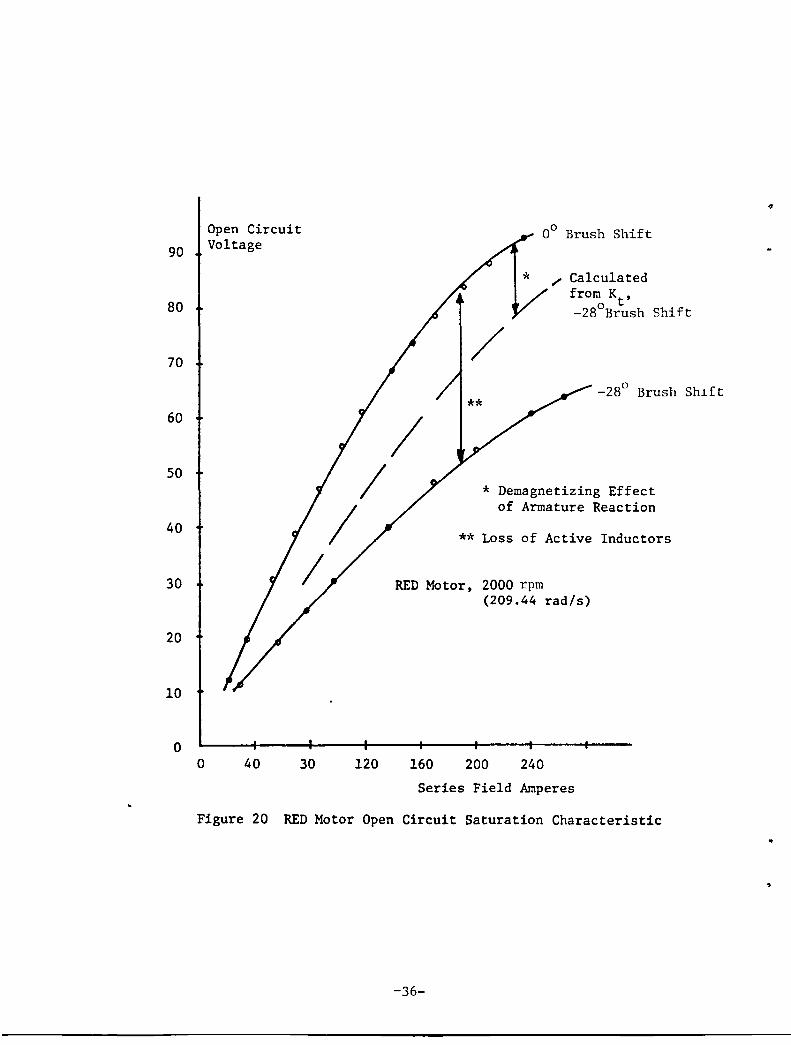
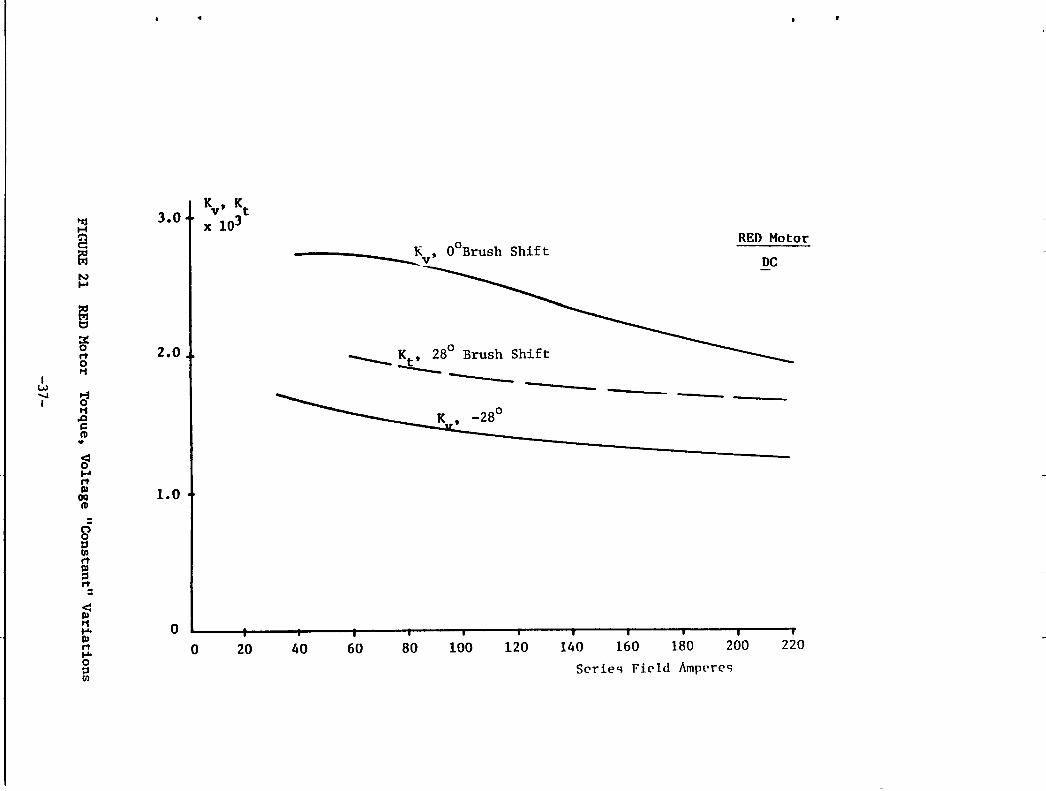
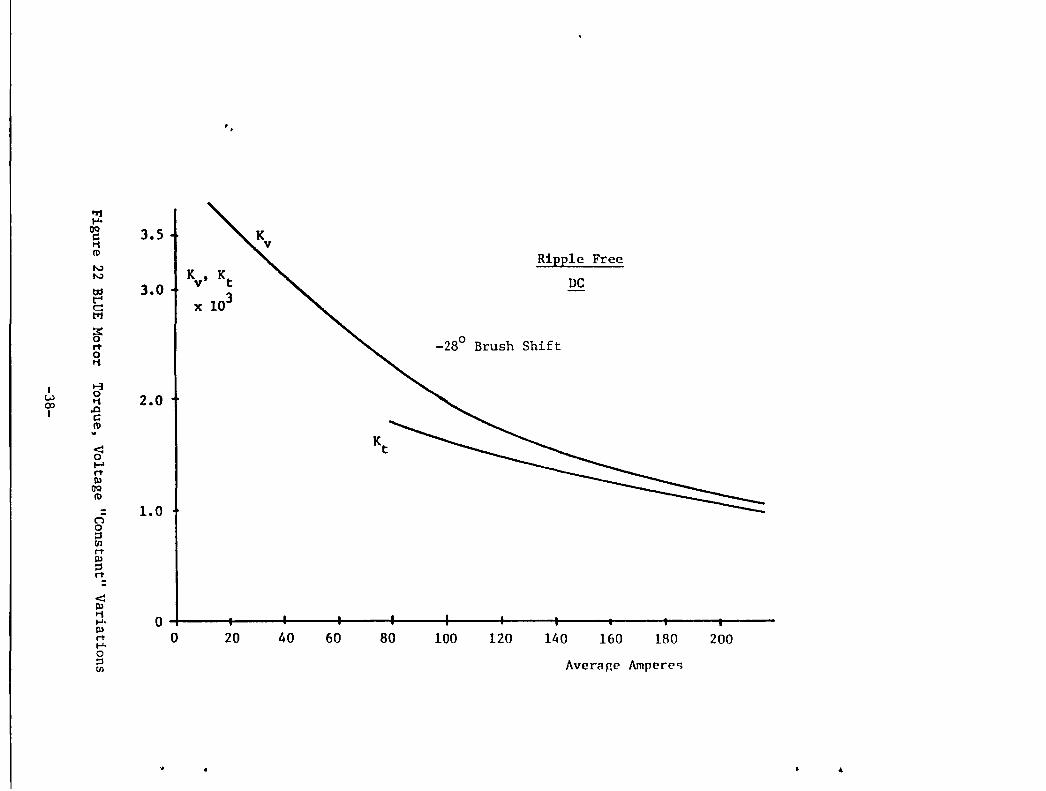
K cannot be determined from the oes curve for a motor to be operated with brushes shifted. Refer to Figures 20, 21 and 22. In Figure 20, two values of K, designated K , are shown as calculated from the 2000 rpm oes curves in Figure 21.
v
One curve, yielding the highest values of E and ~, was taken with the brushes on
mechanical neutral, i.e. 0° shift. The lower curve is data taken at _280
shift and reflects the loss of active inductors, (since on open circuit, no armature reaction is present). If the brushes are shifted an angle S degrees, the inductors in the region 0 - Sand n-(n-S) have opposite induced voltage in them and this voltage subtracts from the total voltage between brushes. If there are Z, inductors between brusheb, the net inductors, fqr S shift from magnetic neutral, are
yielding a ratio of:
K (shifted) v
K (magnetic neutral) v
2B = 1 - 180
(15)
(16)
In theory, for a 280 shift, this ratio would actually observed was between 0.56 and 0.59. to precisely determine exact brush position.
be 0.68. From Figure 21, the ratio The difference is due to inability
If compensating windings, to eliminate and demagnetizing effect of armature reaction, were present, and the brushes were on mechanical neutral, K could be determined from the oes curve, because magnetic neutral and mechanical neutral coincide.
,{hen the brushes are shifted and the motor loaded, if the brushes are truly on magnetic neutral there is no loss of active inductors; there is a demagnetizing effect due to armature reaction, however. This is the reason why k t = K is larger at 280 brush shift, than K .
v
The demagnetizing ampere turns per pole are equal to the inductors in the angle of brush shift times the current per armature path,
AT demag =( ~6~ (z):: (17)
or, the demagnetizing field current is:
I f demag
B Z I a =---360 Nfa
where Nf = series field turns/pole. For the RED motor, Z = 162, S
Nf
= 20 (See APPENDIX A).
-35-
(18)
28, a 2,
90
80
70
60
50
40
30
20
10
o o
Open Circuit Voltage
40 30 120
00 Brush Shift
Calculated from Kt' -28°Brush Shift
_280 Brush Shlft
* Demagnetizing Effect of Armature Reaction
** Loss of Active Inductors
RED Motor, 2000 rpm (209.44 rad/s)
160 200 240
Series Field Amperes
Figure 20 RED Motor Open Circuit Saturation Characteristic
-36-
..
..
4
K , Kt
>rj 3.01 x\oJ 1-1 !;') RED Motor c= K , OOBrush Shift ~ --.v DC ---N ....
~ t:I
if 2.0 t ~ Kt , 28° Brush Shift " 0
11 -----I w ~ ~ I 0
11 .0 r:: nI .. ~ .... " 1\1 1.0 OQ nI
0 0 ::s CII
" ~ ": <: 1\1 11 0 .... 1\1
" 0 20 40 60 80 100 120 140 160 180 200 220 .... 0 ::s Serie~ Field Amp~re~ CII
..
"Ii .... OQ
3.5 c:: t1 (I)
~ .!!!E.E.1e Free
r-,) r-,) ~ Ky' Kt DC ~ 3.0 3 t'"" c: x 10 tr1
~
'" 0 _280 Brush Shift rt 0 t1
I t-i w 0
2.0 00 t1 I .a
c:: (I) .. ~
Kt
t-' rt \U
OQ (I)
1.0 (") 0 ::s (/)
rt \U ::s rt
<: \U t1
0 ..... \U
0 20 40 60 80 100 120 140 160 180 200 rt ..... 0 ::s Average Ampere<; (/)
~ 4
Thus,
(19)
This relationship indicates that, for If = la' Kt = (91-0.33) Kv where Kv is calcu
lated from the oes curve taken with the brushes on mechanical neutral.
From Figure 21, the ratio Kt/Kv varies from 0.73 at 80 amperes to 0.83 at 200
amperes vs. the theoretical value of 0.667.
The oes curve calculated from measured vales of Kt is shown dotted in Figure 21.
As can be seen, use of interpoles to avoid brush shift will yield higher torque per ampere, more power output per ampere (higher efficiency) and satisfactory commutation at all speeds, both forward and reverse.
To examine the implications with respect to power, note that for a given current, lower K will yield a higher speed, but a lower torque. If the per unit increase in speed is less than the per unit decrease in torque, the power output per ampere input will be decreased.
From equation (16), the per unit increase in speed is (approximately) (neglect1ng voltage drops in the circuit):
1 28 (20)
1 - 180
From equation (18) the per unit decrease in torque is:
1 - 8~ (21) 360 Nfa
Therefore, since power equals (torque)(speed); if
II - ~6~ N a)( -L 28 )< 1 (22) ~ f 1 - 180
use of interpoles will yield a higher torque, higher power output per ampere, and a more efficient motor.
For the RED MOTOR, the left hand side of equation (22) is 0.99. For the BLUE MOTOR it is 0.88. Thus, interpoles would improve the performance of these motors.
If interpoles and compensating windings are not used, armature reaction effects can be partially mitigated by increasing the reluctance of the air gap at the pole tips. This was not done in either of the motors tested.
Two other conclusions are readily drawn, i.e. in any event the brushes must be properly located and K can only be determined from tests involving locked rotor torque as a function of current in the field and armature for a machine without interpoles, requiring' brush shift.
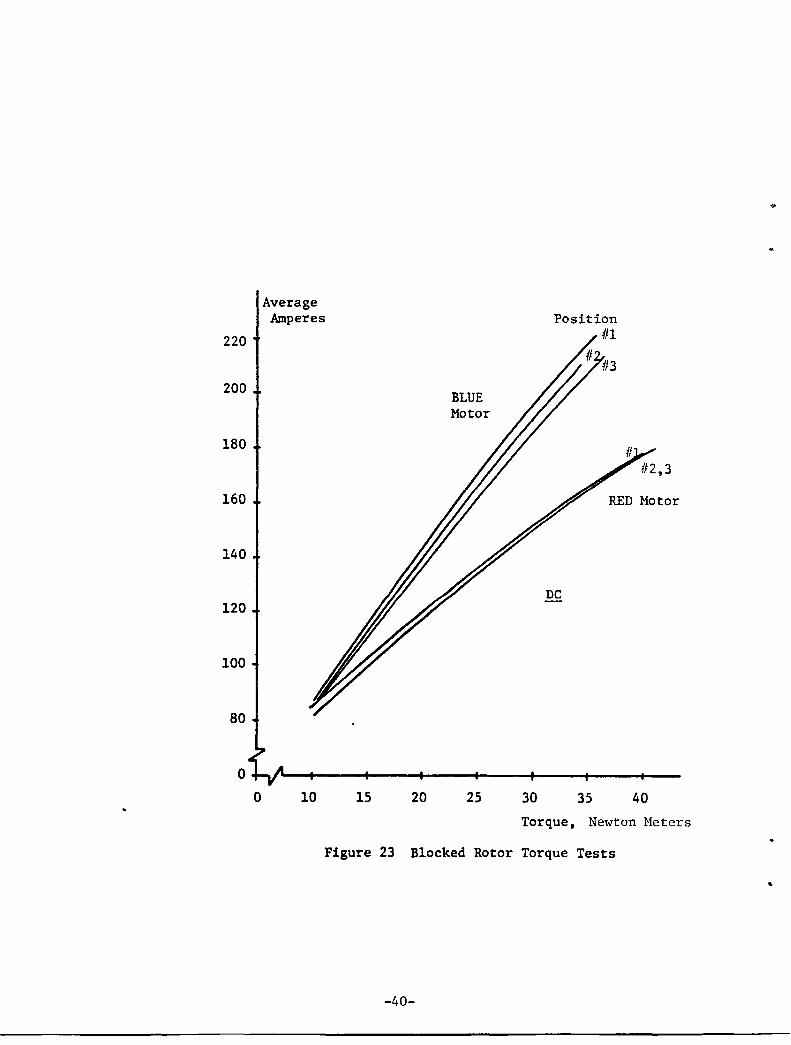
In obtaining the torque vs. ampere characteristic, three tests, shown in Figure 23 were made for each motor, i.e., runs were made at 1200 intervals of the stalled rotor.
-39-
220
200
180
160
140
120
100
80
o o
Average Amperes
10 15 20
BLUE Motor
25
Position #1
RED Motor
DC
30 35 40
Torque, Newton Meters
Figure 23 Blocked Rotor Torque Tests
-40-
90
80
70
60
50
40
30
20
10
o
Torque Newton Meters
Note: data points for 100, 200 and 400 Hz operation (T /T-0.4S) fell within
o ± 2 or 3% of dc values plotted.
60 80 100 120 140 160 180
Average Amperes
200
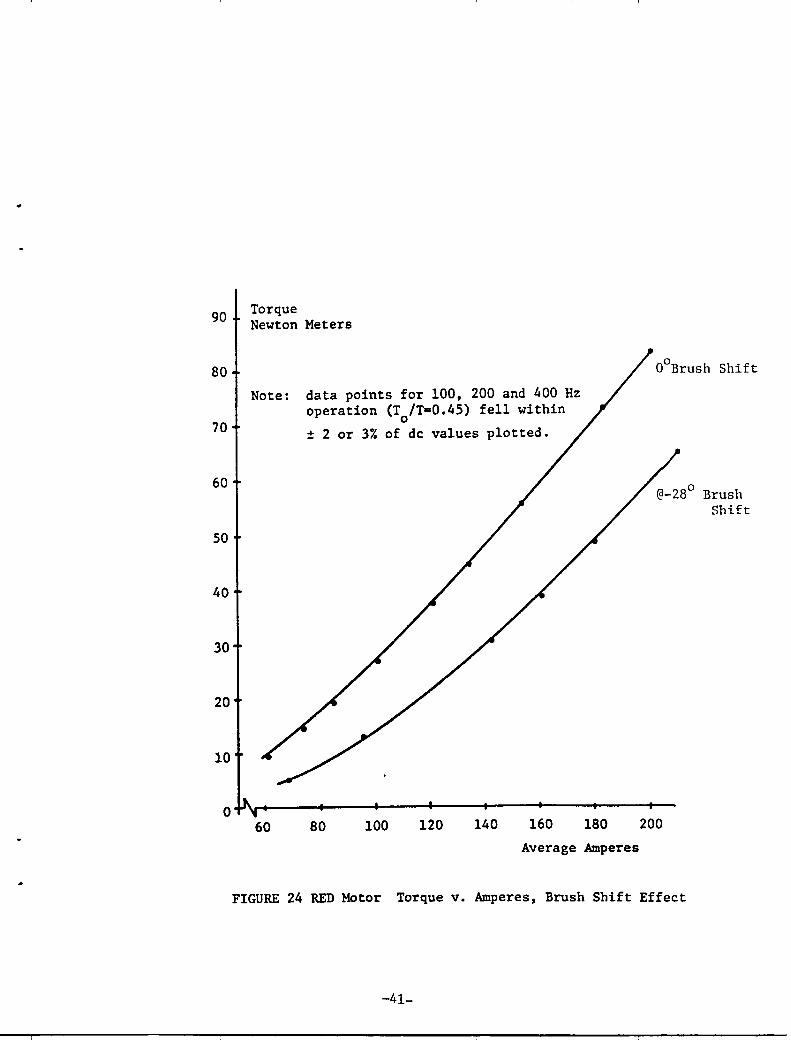
FIGURE 24 RED Motor Torque v. Amperes, Brush Shift Effect
-41-
Brush Shift
Approximately 10% variation in torque/ampere squared was noted for the 3 positions of the BLUE motor rotor; approximately 3% variation for the RED motor. The readings were averaged to calculate K
t used in this sectlon.
Observed values of torque as a function of current and brush shift during load tests (running) are shown in Figure 24. In this test, the torque with brushes shifted is about 25-30% less than with the brushes on mechanical neutral.
Calculated Performance
Based on measured values of R, Vb' Pfw ' and K, steady state torque, speed, power
output and efficiency as functions of current, for ripple free dc supply, can be calculated as follows:
% n
also,
(K = K = v t K)
Speed
60w N = Tn
V - V -b k If
I R t3~) rpm a
M = M e
P = Mw o
~fficien'£y'
= ( 1 _ P 10~ ) 100 = (1 _ (I2
R + P fw + Pin VI
%n=(~) 100
0.01 P o
(23)
(24)
(25)
(26)
(27)
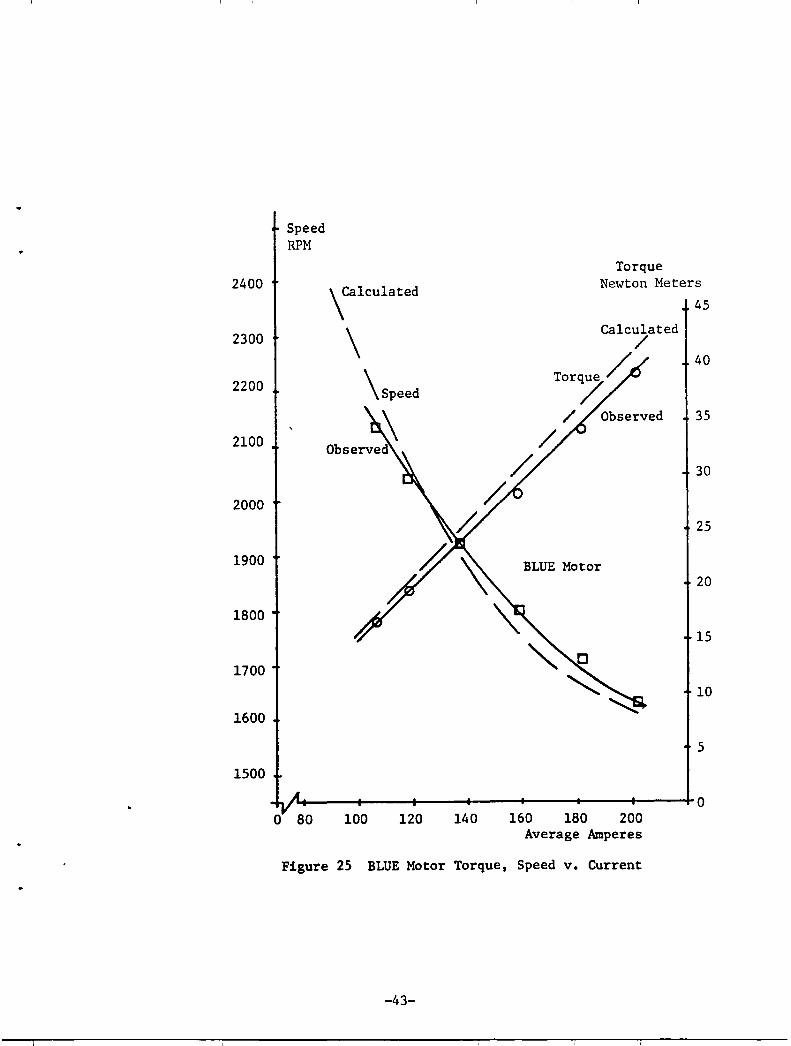
Actual load tests were conducted on the RED and the BLUE motors in order to evaluate the accuracy of calculated performance equations. Laboratory quality instrumentation, including a digital strobotachometer, were used in the determination of the experimental data. Since data is used in later comparisons, the tests were run at nominal 42 volts, corresponding to many of the chopper supplied • tests.
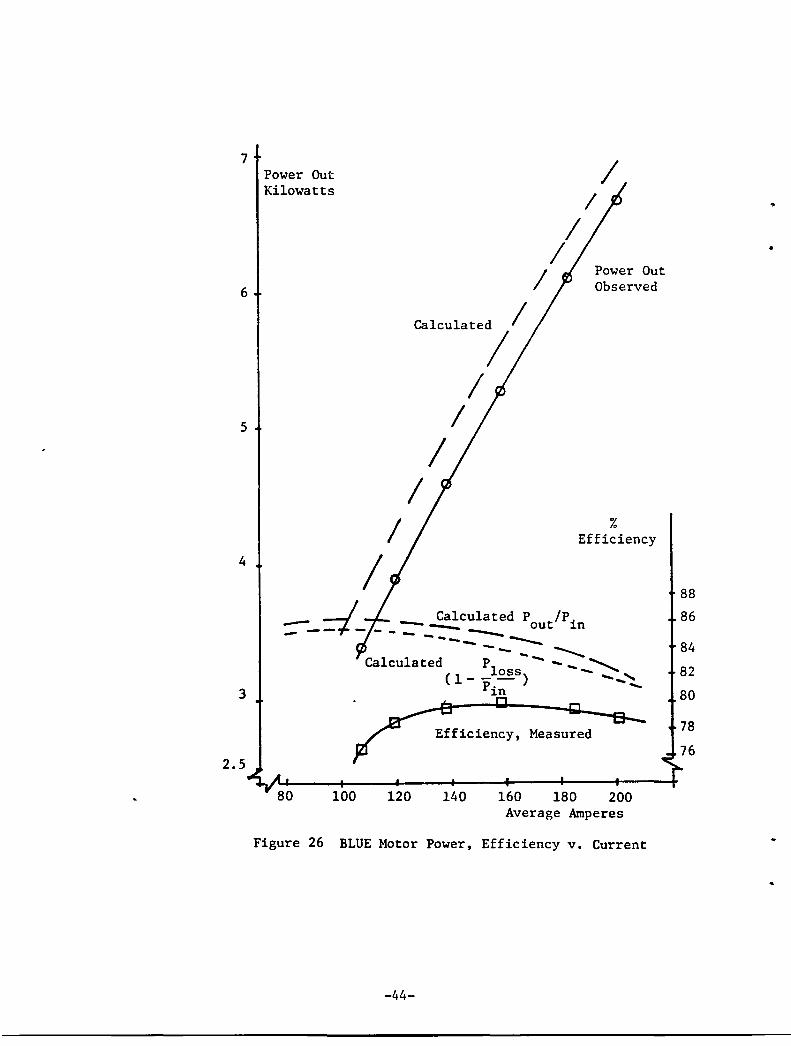
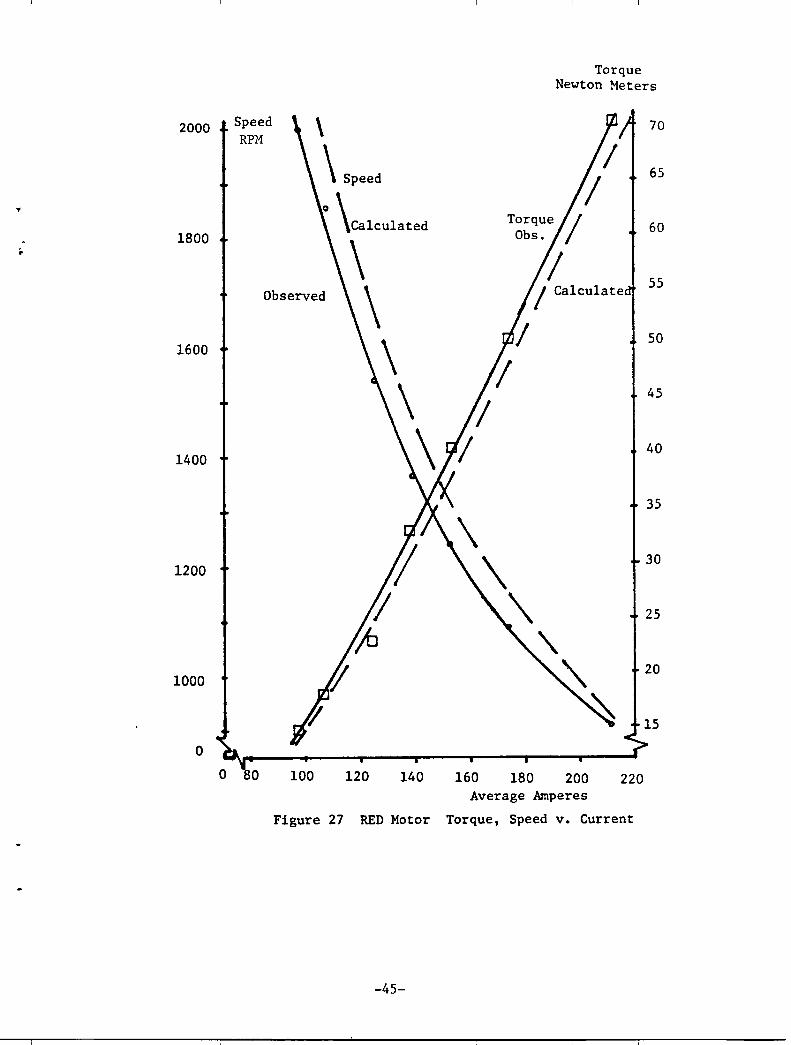
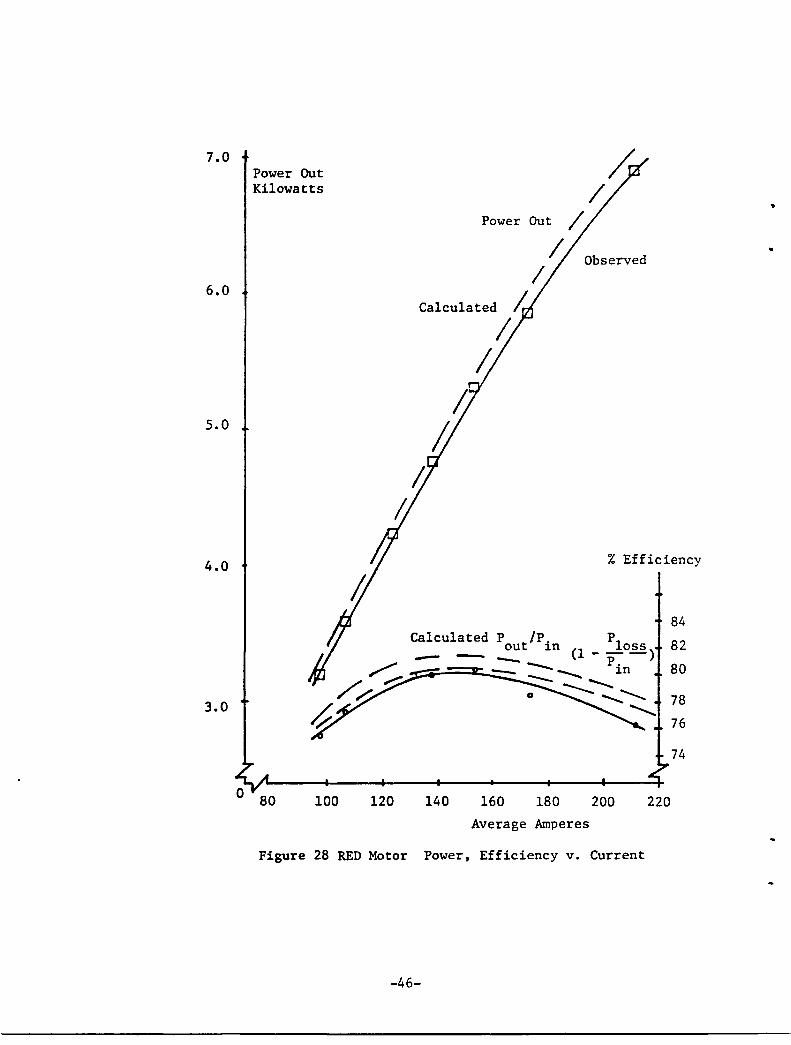
Figures 25, 26, 27, and 28 present the results observed experimentally and as calculated using equations (23) through (27).
-42-
Speed RPM
Torque 2400
\CalCulated Newton Meters
45
2300 \ 40
2200 \ Speed
35
2100
30
2000 25
1900 BLUE Motor 20
1800 15
0 1700
10
1600
5
1500
0 0 80 100 120 140 160 180 200
Average Amperes
Figure 25 BLUE Motor Torque, Speed v. Current
-43-
7
6
5
4
3
2.5
Power Out Kilowatts
/ /
Calculated /
/ /
/ /
/
/ /
/ /
Power Out Observed
% Efficiency
d Calculated P tIP. - -__ ou ~n .... --... - - - -- ---..... - ... --..... ............... -- ---- ~ Ca1cu1a ted PI - _ ~ oss - ~ (1---) -_ ......
p. -~n
Efficiency, Measured
100 120 140 160 180 200 Average Amperes
Figure 26 BLUE Motor Power, Efficiency v. Current
-44-
88
86
84
82
80
•
2000
•
1800 ;.
1600
1400
1200
1000
o
Torque Newton Meters
Speed \ RPM
o \Calculated
Observed
o 80 100 120 140 160 180 200 220 Average Amperes
Figure 27 RED Motor Torque, Speed v. Current
-45-
70
65
60
55
50
45
40
35
30
25
20
15
7.0
6.0
5.0
4.0
3.0
Power Out Kilowatts
Power Out
Calculated
Observed
% Efficiency
100 120
Calculated pIp. out 1n
-
140 160 180
Average Amperes
200
Figure 28 RED Motor Power, Efficiency v. Current
-46-
220
84
82
80
78
76
74
..
•
As can be seen, except for efficiency, there is very good correlation between observed and calculated results. In general, calculated results are within 5% of observed experimental results. Because of the hysteresis effects in the magnetic circuit and due to the fact that the value of K is the average of 3 rotor position measurements, 5% error is considered acceptable, since the value of torque for a given current on stalled rotor varied over a 3-10% range.
For both motors, calculated efficiency was higher than actual efficiency. It is believed that this is due to neglect of "rotating core loss," which results from joule loss in the conductors undergoing commutation if the conductors are not in a position of zero flux density during the process. This is a substantial loss if the brushes are not precisely located or if an excessive number of coils are shorted during the commutation process. The RED motor efficiency calculated was quite close to the observed value; the BLUE motor value was much more in error. This can be attributed to the fact that more coils are shorted during commutation in the BLUE motor and to the fact that the BLUE motor (because it is lap wound) has an equalizer connection which apparen~ly results in a finite joule loss not reckoned with in equation (26).
As will be shown in the following sections there are additional losses introduced if the current and voltage are other than ripple free dc and it should be noted that the conventional model does not account for these effects, which are introduced by virtue of the chopper action.
CHOPPER CONTROLLED MOTOR BEHAVIOR
When the motor is chopper controlled, the performance of the motor is quite different, in some respects, from the performance observed under "ripple free" dc power.
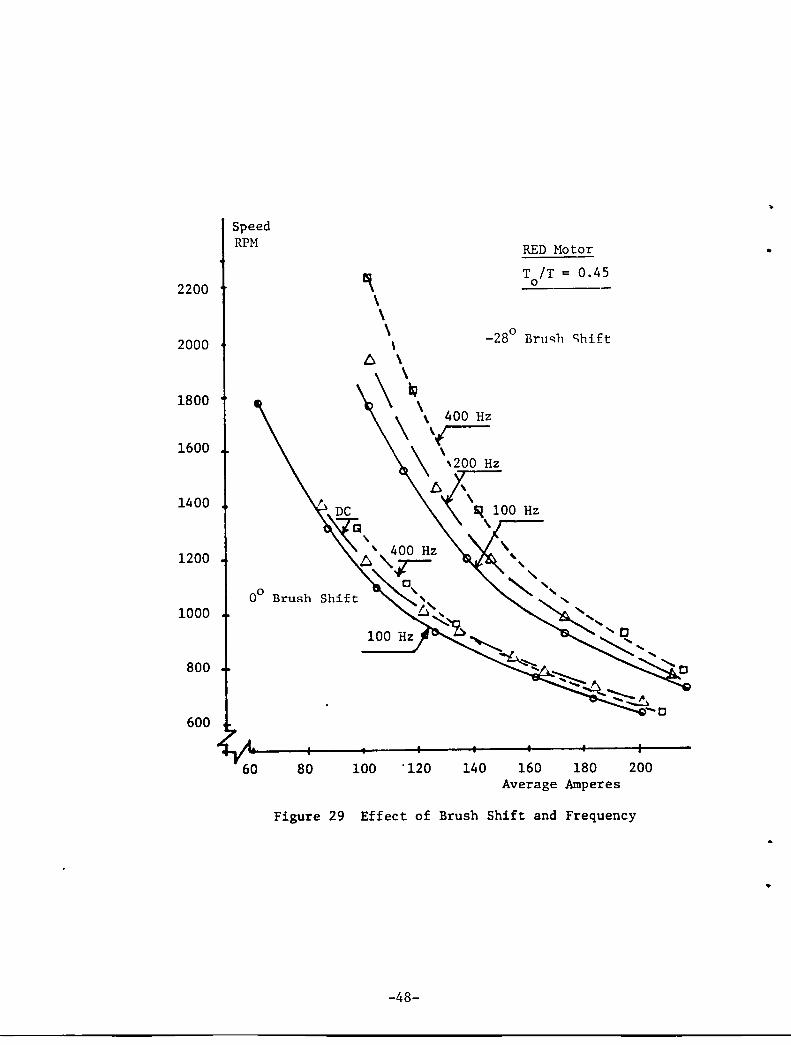
When the motor is chopper controlled, the speed-ampere characteristic is altered and the alteration is both frequency of chopper action and brush position dependent. If the brushes are shifted for proper commutation, the speed, at a given current is increased significantly over the speed, at the same current, with the brushes on neutral, i.e. 00
• The reason for this is the decrease in the number of active inductors in the armature. With the brushes on 00
, there is relatively little effect on speed due to frequency. This is shown in Figure 28, indicating approximately a 10% band covering dc, 100, and 400 Hz. However, when the brushes are shifted, the effect of frequency on the characteristic is quite pronounced. For example, at 150 amperes, brushes on _28 0
, reference to Figure 21 indicates that the value of K changes by 11% when the brushes are shifted, when supplied
v from ripple free dc. However, from Figure 29, if the motor is chopper controlled, at 400 Hz repetition rate, the speed changes by 48% in shifting brushes from 00
to - 28°, and the spread in speed between 100 Hz and 400 Hz is about 18%, with higher Hpeed with higher frequency at a specific current.
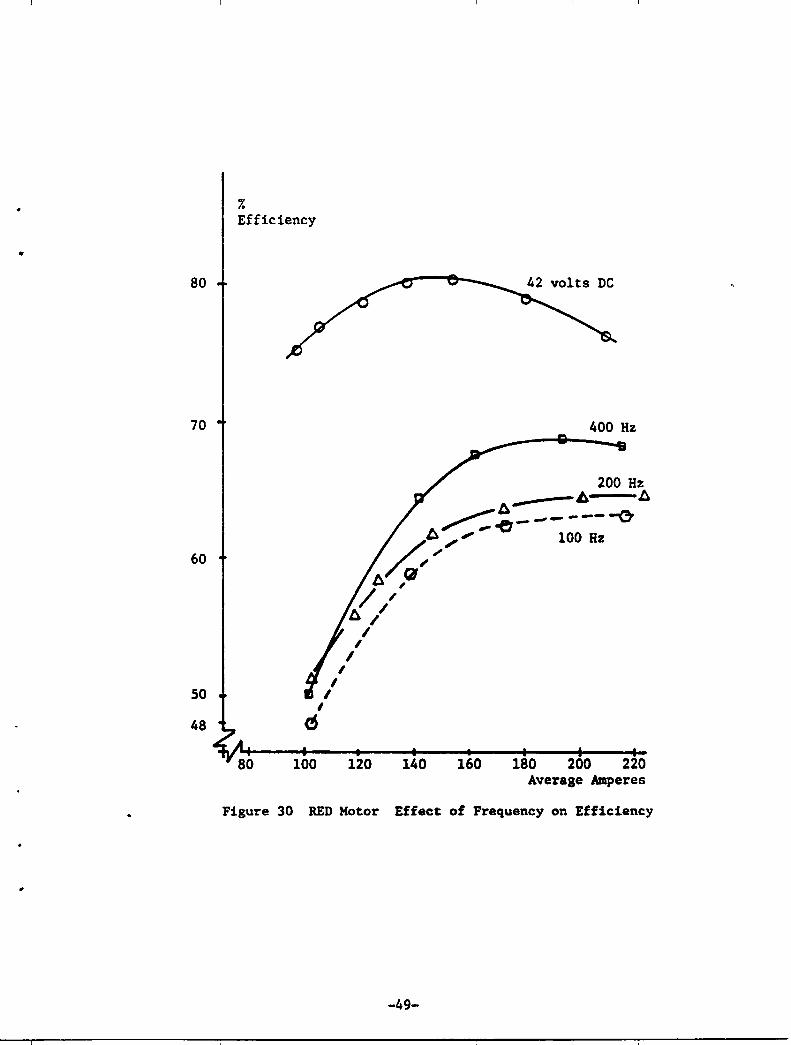
The most drastic change in the motor characteristic with chopper control is the efficiency as calculated from observed electrica1-power-in/mechanica1-power-out values. Power in was measured using the wide bandwidth electronic wattmeter. Note that the efficiency degradation increases with decreasing frequency and decreasing load. Referring to Figure 12, it is noted that % ripple decreases with increasing load and frequency. The iron losses resulting from the harmonic currents would tend to increase with frequency. Another factor associated with harmonics is "skin effect," which increases the apparent resistance of the wind-
-47-
2200
2000
1800
1600
1400
1200
1000
800
600
Speed RPM
00 Brush
80
~ \ \ \
100 '120 140
RED Motor
T IT = 0.45 o
160 180 200 Average Amperes
Figure 29 Effect of Brush Shift and Frequency
-48-
•
•
•
80
70
60
50
48
% Efficiency
I
e 100
I I
400 Hz
200 Hz A------ I;) A
~_e-------G' , ~~,." 100 Hz
A/0~ / /'
A II
I , I ,
120 140 160 180 200 220 Average Amperes
Figure 30 RED Motor Effect of Frequency on Efficiency
-49-
harmonics is "skin effect," which increases the apparent resistance of the windings. The inductance will also change with frequency. The effects were invest1-gated and are detailed in the following section.
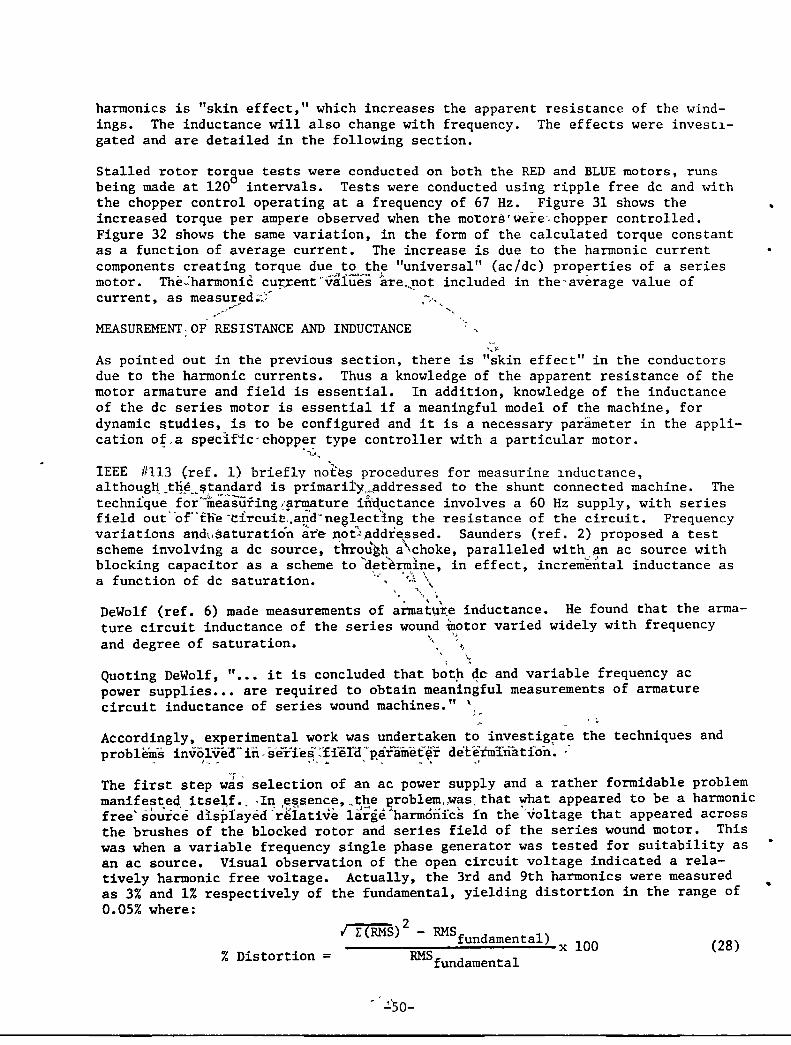
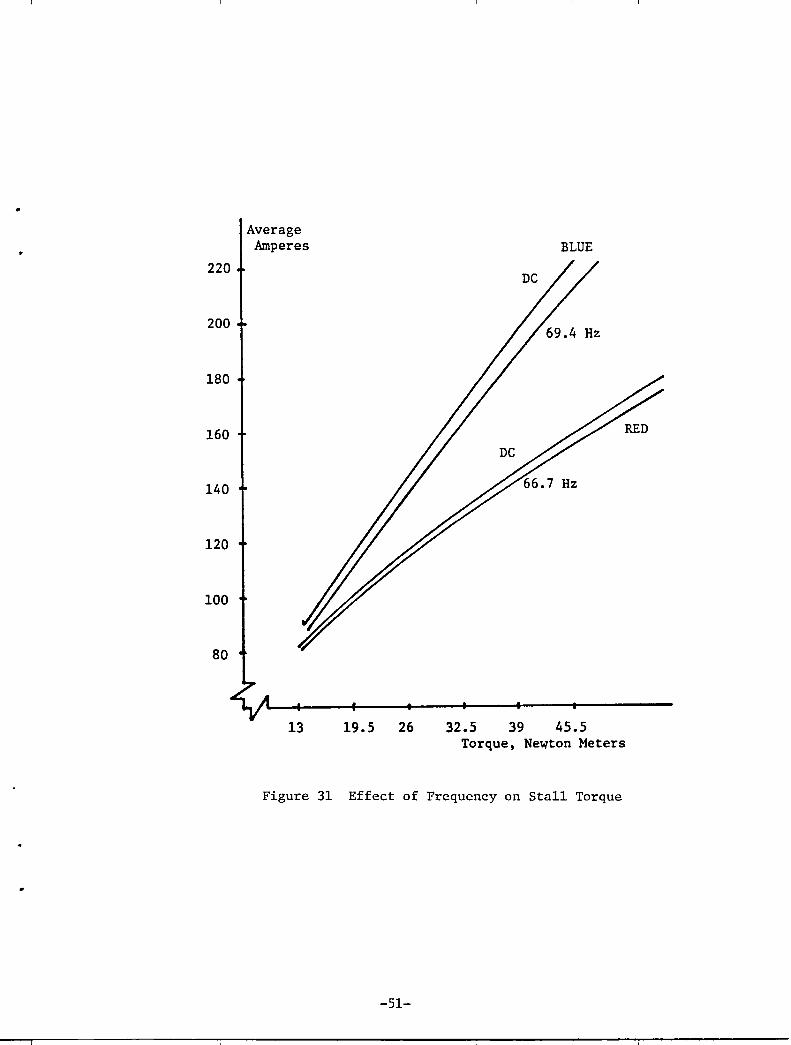
Stalled rotor tor3ue tests were conducted on both the RED and BLUE motors, runs being made at 120 intervals. Tests were conducted using ripple free dc and with the chopper control operating at a frequency of 67 Hz. Figure 31 shows the increased torque per ampere observed when the mo~ors'~ere~chopper controlled. Figure 32 shows the same variation, in the form of the calculated torque constant as a function of average current. The increase is due to the harmonic current components creating torque due to the "universal" (ac/dc) properties of a series motor. The;harmonic cu~~ent~vafues iTe.~~ot included in the'average value of current, as measured;:':;' "
..,--/"r- ........
~ "
MEASUREMENT.OF RESISTANCE AND INDUCTANCE '. ,
As pointed out in the previous section, there is "skin effect" in the conductors due to the harmonic currents. Thus a knowledge of the apparent resistance of the motor armature and field is essential. In addition, knowledge of the inductance of the dc series motor is essential if a meaningful model of the machine, for dynamic ~tudies, is to be configured and it is a necessary parameter in the application of.a specific-chopper type controller with a particular motor •
.. ... ):~ ...
IEEE #113 (ref. 1) briefly notes procedures for measurinQ 1nductance, althougH. _tlj~t"!?~andard is primari1y,_pddressed to the shunt connected machine. The technique for'-measuring /armature irrductance involves a 60 Hz supply, with series field out'"of"tlie -eircuit!~.a~d-neg1<ect)ng the resistance of the circuit. Frequency variations andusaturation ar'e ~ot~,addie,.ssed. Saunders (ref. 2) proposed a test scheme involving a dc source, through a\choke, paralleled with an ac source with
~. " ... ,--" J blocking capacitor as a scheme to determ1ne, in effect, incremental inductance as a function of dc saturation. '.<' 't:i \
~~" !jO. . " DeWolf (ref. 6) made measurements of armatu~e inductance. He found that the arma-ture circuit inductance of the series wound ~otor varied widely with frequency
{~ 't and degree of saturation. "- , ~1
Quoting DeWolf, " ••• it is concluded that botp 4c and variable frequency ac power supplies ••• are required to obtain meaningful measurements of armature circuit inductance of series wound machines." \.,
Accordingly, experimental work was undertaken to investig~te the techniques and Problems involveC!- in- s-erles-~-fierd·vp'arametei de'termitiation • .-
~ ;.... .. '\ I.. .. ." _ ... "~ .. J
The first step w~s selection of an ac power supply and a rather formidable problem manifest.ed, itse],£.. ,I~ ,e§sence, _tJ:!e Eroblem"was, that ~hat appeared to be a harmonic free'source displayed'r~lative 1arge~harmonfcs in the "voltage that appeared across the brushes of the blocked rotor and series field of the series wound motor. This was when a variable frequency single phase generator was tested for suitability as an ac source. Visual observation of the open circuit voltage indicated a relatively harmonic free voltage. Actually, the 3rd and 9th harmonics were measured as 3% and 1% respectively of the fundamental, yielding distortion in the range of 0.05% where:
% Distortion = I r(RMS)2 - RMSfundamental) ----=='~--...;~---........ x 100
RMSfundamenta1
- " l' -50-
(28)
..
..
..
220
200
180
160
140
120
100
80
Average Amperes
13 19.5 26
BLUE
32.5 39 45.5 Torque, Newton Meters
Figure 31 Effect of Frequency on Stall Torque
-51-
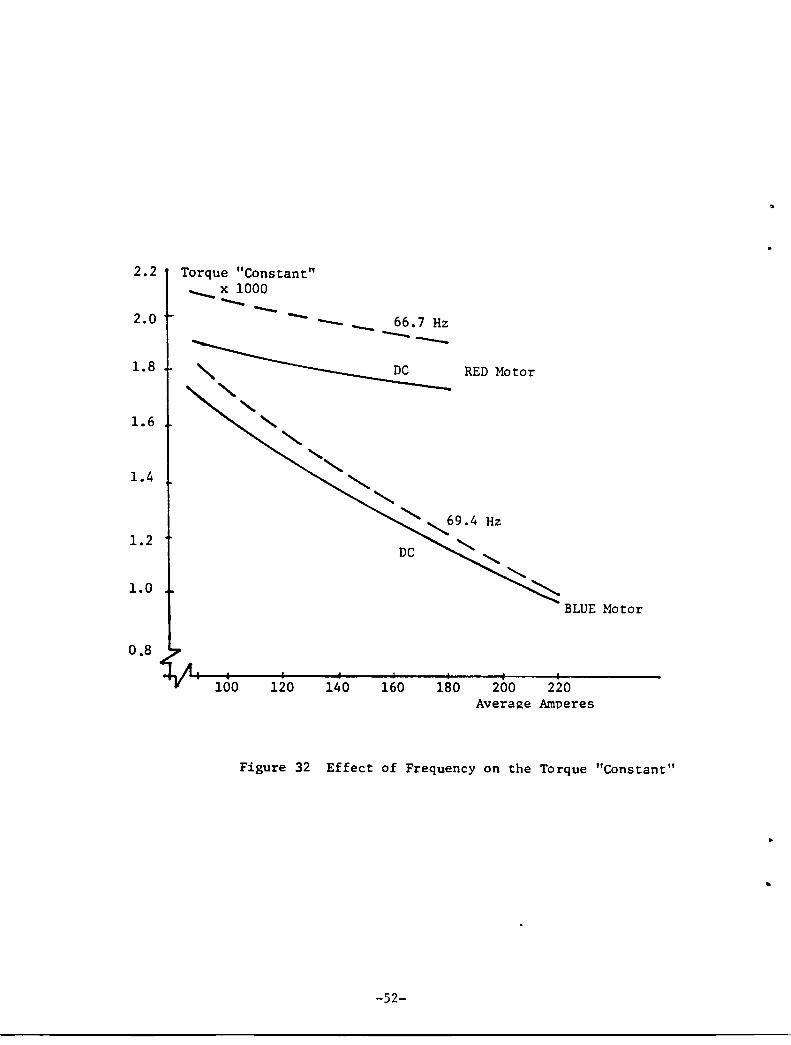
2.2 Torque "Constant" ___ x 1000 -- --2.0 - ____ 66.7 Hz ----
1.8 " RED Motor
"-" 1.6 "-
"-"
1.4 "'-
".........
,69.4 Hz
1.2 "
" ........... 1.0 ~
BLUE Motor
0.8
100 120 140 160 180 200 220 Average Amperes
Figure 32 Effect of Frequency on the Torque "Constant"
-52-
..
..
The generator was connected across the armature and field of the RED motor through a 200 ~F capacitor bank. Because the capacitor impedance decreases with increasing frequency and the choke (inductance) in series with the dc source (and shunting the motor under test) increases with increasing frequency, harmonic currents are magnified in the test motor circuit.
To determine R, L at various frequencies and saturation levels, it is necessary to accurately measure voltage, current and the angle between them. The harmonic distortion resulting from the straightforward use of a rotating machine as an ac source was found to be intolerable and was discarded.
The scheme that was developed and from which meaningful data was obtained is depicted in Figure 4. The blocking capacitor was sized to keep the voltage across the capacitance to relatively low values, especially at lower frequencies. The voltage divider is required because of input voltage limitations in the instrumentation amplifiers used. To reject the dc component of current and voltage in the signals, capacitor input filters were utilized. Since the ratio of voltage to current and their phase angle is desired, the slight attenuation and phase shift introduced does not affect results if both signals are equally affected.
After filtering, the voltage and the current signals were amplified using floating differential amplifiers with gains of 10 (for the voltage signal) and 1000 (for the current signal) yielding amplifier outputs, in volts, proportional to the actual current and voltage levels.
In order to isolate the frequency desired for the measurement, band pass filters were placed between the amplifier outputs and the voltmeters and the oscillograph. These filters have dial settings for low and high frequency cutoff, ft' and f H•
Some attenuation and phase shift (lead through the low pass; lag through the high pass sections) does occur. From the attenuation characteristic, for these filters, if f/fH and fL/f are set at 0.4 for 0 db attenuation, i.e.,
fH = 2.5 f; fL = 0.4 f
where f is the pass frequency, the phase shift through the low pass section is +600
; the phase shift through the high pass section is _600, yielding zero net
phase shift and zero attenuation. Because of the error inherent in dial settings, the final adjustment of the dial settings is made by utilizing a common input signal and trimming for identical band pass filter outputs.
After filter Setting adjustments were made, the common input signal was removed and the differential amplifiers with gain setting noted above were connected between the NIS and the voltage divider outputs and the filter inputs. The voltmeters used were wide frequency response, high accuracy, true RMS reading voltmeters.
Tests for Rand L were conducted using a 1.5 - 2 ampere ac current derived from the oscillator-amplifier source, at various frequencies from 30-1500 Hz and at various levels of dc current.
Readings of voltage and current were made and the phase shift was measured on the eRO. From the data, Rand L can be calculated as:
-53-
v V R = I cos ~; L = 2~fi sin ~ (29)
Inherent errors are introduced in making the length measurements. The magnltude of the errors can be visualized from:
~R = (V sin ~) ~~ (30) I
the % error, in determining R is:
%R = (~R) 100 = 100 tan ~ (~¢) R
where ~R is the calculated error based on a measured angle error of ~¢.
Similarly, % error in determining Lis:
%L = 100 cot ¢ (~¢).
Actual ~ is in the range 55-65 degrees.
Assuming ¢ = 60;
%R = 173 ~¢ %L = 58 ~¢
(31)
(32)
(33)
For a cycle length of 60 mm on the eRO, and an error ln measurement of 0.5 mm (trace width), about 10% error in the calculation of R and a 3.5% error in the calculation of L can result.
The carbon brushes were replaced with radiused copper blocks in order to eliminate the non-linear resistance effect of carbon. The rotor was blocked to prevent rotation.
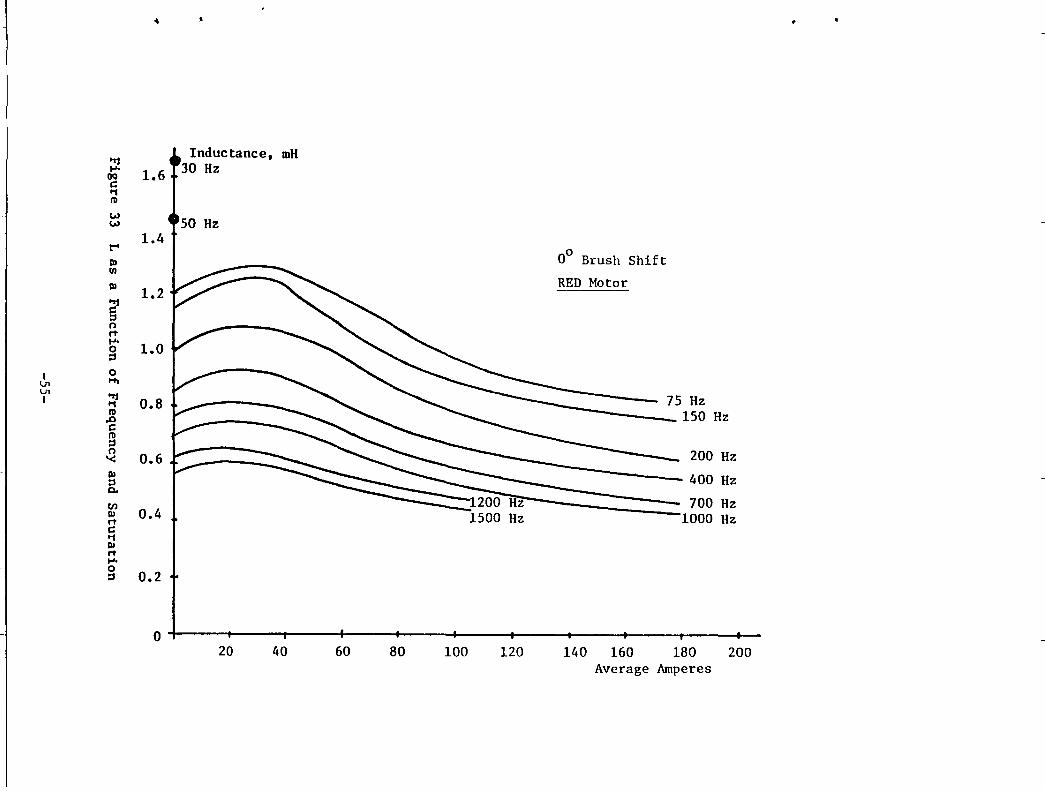
The current level of the ac current injected was 2 amperes or less; thus the inductance calculated is incremental inductance. Test results are described in detail in reference 7. Both the RED and BLUE motors were tested and the nature of the variations of R,L were found to be identical, although the actual values were, of course, different. The initial series of tests were conducted over the frequency range from 30 to 1500 Hz to gain an overview of the variations. After the frequency trends were established from these tests, tests were run at 400 Hz to isolate other phenomena.
Inductance Variations
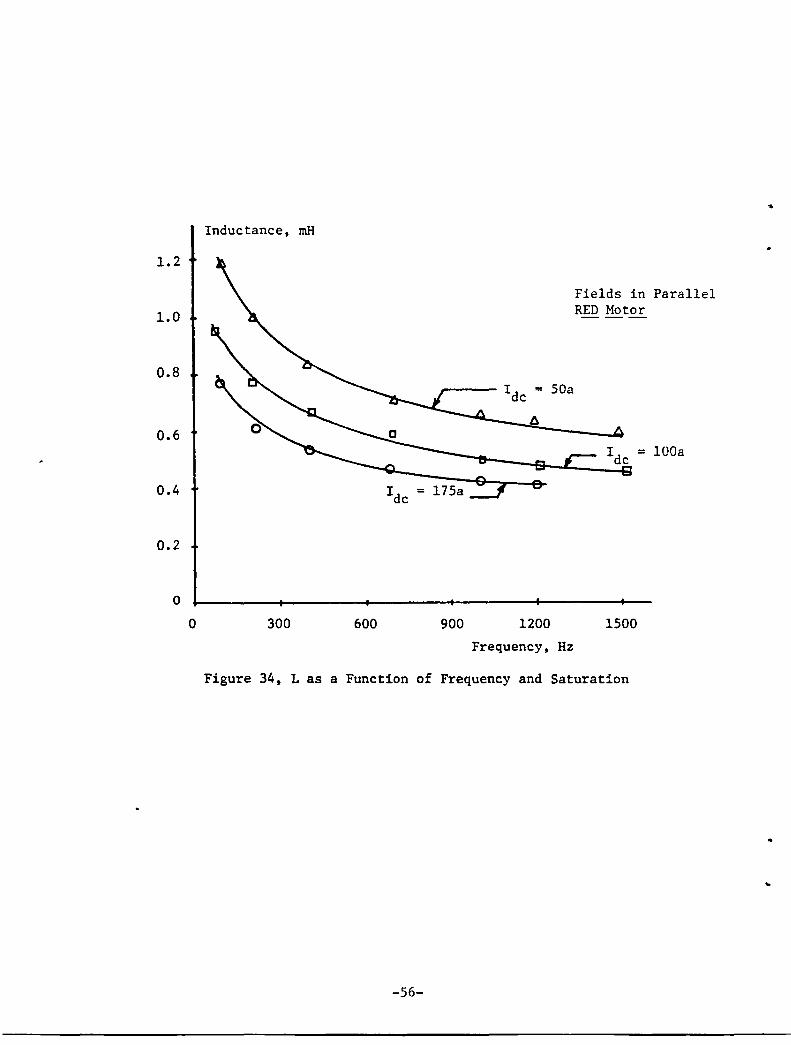
Figure 33 shows the variation in inductance measured, for the RED motor over the frequency range from 30 to 1500 Hz from the unsaturated to full saturation condition. Figure 34 presents the variation of inductance of the RED motor as frequency is varied and current is held constant at values of 50, 100 and 175 amperes. Figu~e
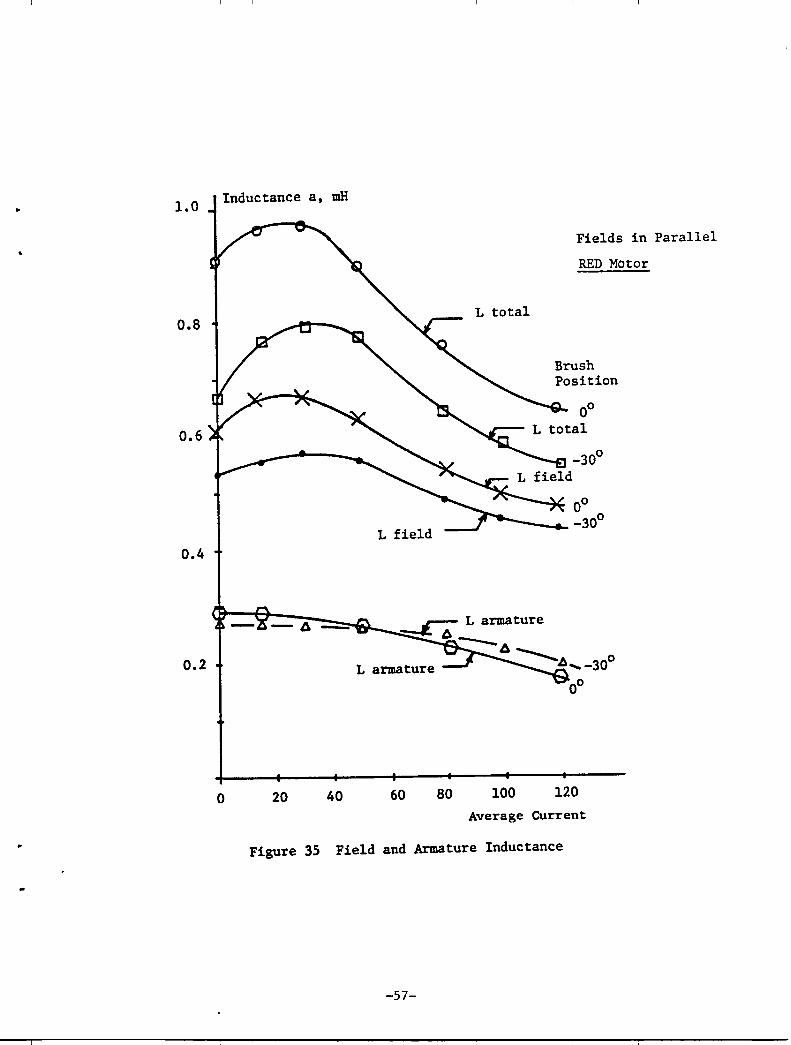
35 depicts the effect of brush shift and shows the division of inductance between the armature and field in the RED motor. As can be seen, brush shift does not affect the armature to any extent but it does have a noticeable effect, over all. ~
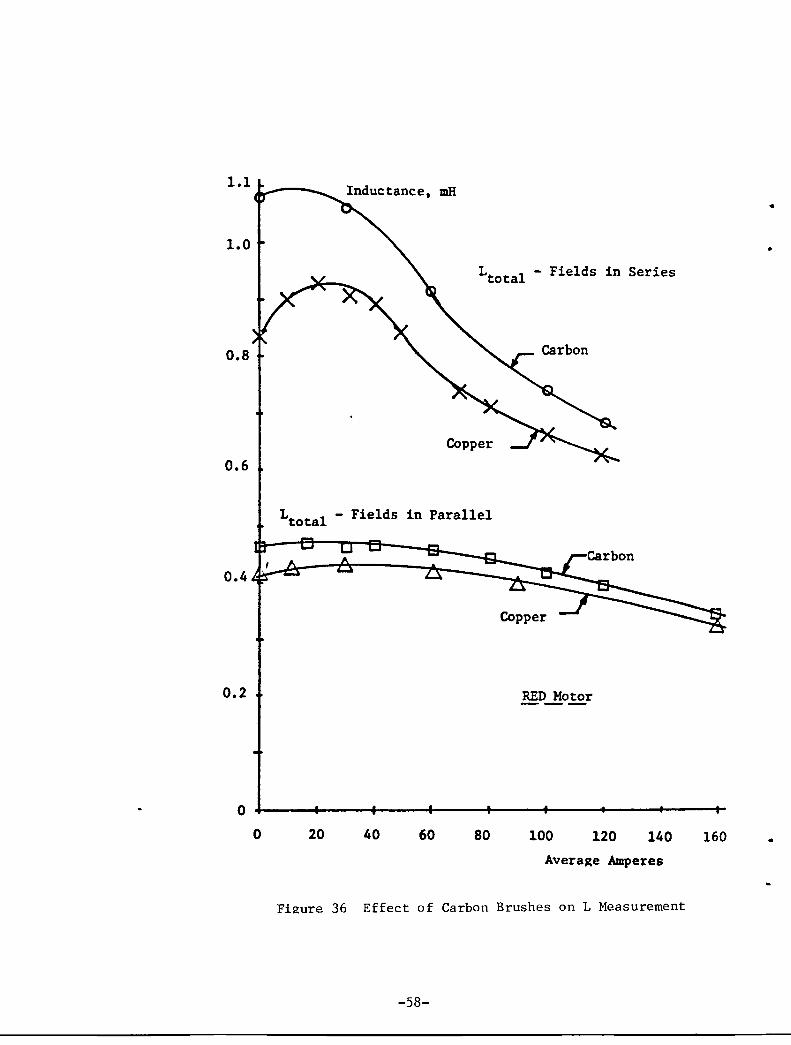
This result was obtained at 400 Hz, and two field windings series connected. The difference between measurements made with carbon brushes and copper blocks is shown for the RED motor, in Figure 36.
-54-
"
"r:I -------_____ • mH
..... 1.6 OQ
c:: 11 II)
W w
1.4 t""
00 Brush Shif t I\)
(/I
I\) RED Motor 1.2 -----
~ ::t n rt ....
1.0 0 ::t
I 0 VI ...... VI
~
0.8~~ ~ -------I 11 75 Hz II) 150 Hz .c c:: II) ::t n
0.6 Hz '< I\) ::t - 400 Hz 0.
til - 700 Hz I\) 0.4 1500 Hz 1000 Hz rt c:: 11 I\) rt .... 0
0.2 ::t
0~,----4-----~---+----~----~--~----~----+_--~----~-20 40 60 80 100 120 140 160 180 200
Average Amperes
Inductance, mH
1.2
Fields in Parallel
1.0 RED Motor
0.8 r--- Idc = SOa
0.6
~""'!t--_..g.-JC:..~I~d~C = lOOa
0.4 Idc = 175a
0.2
o o 300 600 900 1200 1500
Frequency, Hz
Figure 34, L as a Function of Frequency and Saturation
..
-56-
.. 1.0
•
0.8
0.6
0.4
0.2
Inductance a, mH
L field
L armature
o 20 40 60 80
L total
100
Fields in Parallel
RED Motor
Brush Position
120
Average Current
Figure 35 Field and Armature Inductance
-57-
1.1
1.0 •
Ltota1 - Fields in Series
0.8
Copper
0.6
Ltota1 - Fields in Parallel
0.4
Copper
0.2
o o 20 40 60 80 100 120 140 160 •
Average Amperes
Figure 36 Effect of Carbon Brushes on L Measurement
-58-
Apparent Resistance Variations
The apparent resistance, as seen by the current fundamental and harmonics, changes with both frequency and saturation (since the variations are due to eddy current, skin and proximity effects).
Figure 37 presents apparent resistance variation for the RED motor wlth frequency and level of saturation changes, and Figure 38 depicts the same type of information in a different fashion. The effect of brush shift and the divi-sion between series fields and armature for the RED motor at 400 Hz are shown in Figure 39. As can be seen, since the vast majority of the apparent resistance is in the field windings, use of fine stranded wires (rather than solid conductors) appear to hold promise of reducing the apparent resistance (and the harmonic current joule losses) appreciably.
wL/R Variation
A curve fit routine, applied to the experimental data indicates that Rand L, as functions of frequency and identical fashion, although the actual values for the (One had a solid frame, the other a laminated frame). R were found to be, for the RED motor:
L 3.8 f-0.24 I O• 063mH
obtained for both motors saturation, varied in an two motors were different. Total variations in Land
R 0.0167 f O. 7 1-0 . 07 ohms
from which:
L ~ X (2TIf) R = -a = R ~ constant (34)
Summary and Conclusions on R,L Variations (ref. 7).
Inductance Variations:
The armature inductance is independent of brush position and armature-only excitation. It accounts for about 1/3 of the total armature circuit inductance. The armature circuit, lncluding the series field, is about 30% less under saturation conditions than unsaturated, decreasing approximately as the -0.06 power of the dc current level. Also, it decreases proportional to the -0.24 power of frequency (over the frequency range tested, i.e. to 1500 Hz). The armature circuit inductance is dependent upon brush position, decreasing in proportion to the angle of the shift against rotation. For the motor tested, with the brushes located for proper commutation, it decreased by 15%. It should be noted that, in a constant inductance circuit, higher frequency current harmonics are suppressed in magnitude; but in the motors tested, with decreasing inductance with increasing frequency the suppression (or decreasing trend) is not as pronounced.
Resistance Variations
For the motor with results detailed here, the dc resistance of the armature and fields was measured as 0.0189 and 0.0165 ohms respectively for a total of 0.0254 ohms. The ratio of armature to field dc resistance is 1.15. From Flgure 39, at 400 Hz, thlS resistance ratio is only 0.15; thus about 90% of the resistance to ac harmonic current is associated with the series field winding. This indi-
-59-
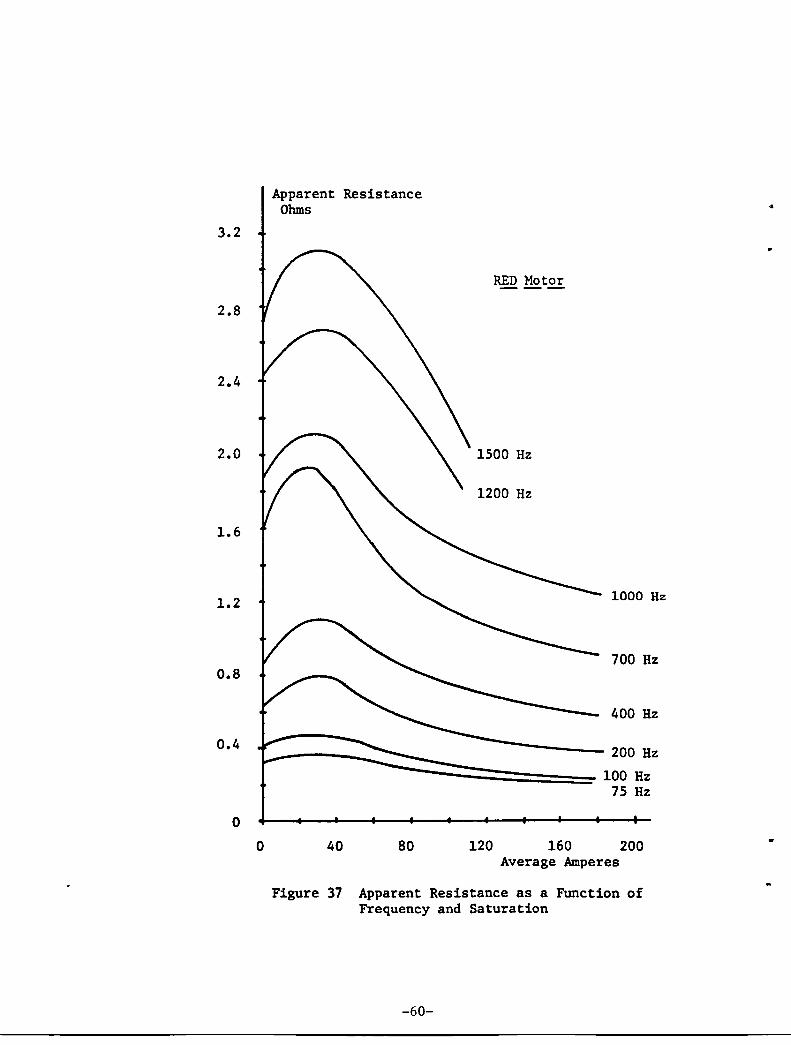
3.2
2.8
2.4
2.0
1.6
1.2
0.8
0.4
o o
Apparent Resistance Ohms
RED Motor
1500 Hz
1200 Hz
1000 Hz
700 Hz
400 Hz
-------- 200 Hz
---..;::::::=:::::==== 100 Hz 75 Hz
40 80 120 160 200 Average Amperes
Figure 37 Apparent Resistance as a Function of Frequency and Saturation
-60-
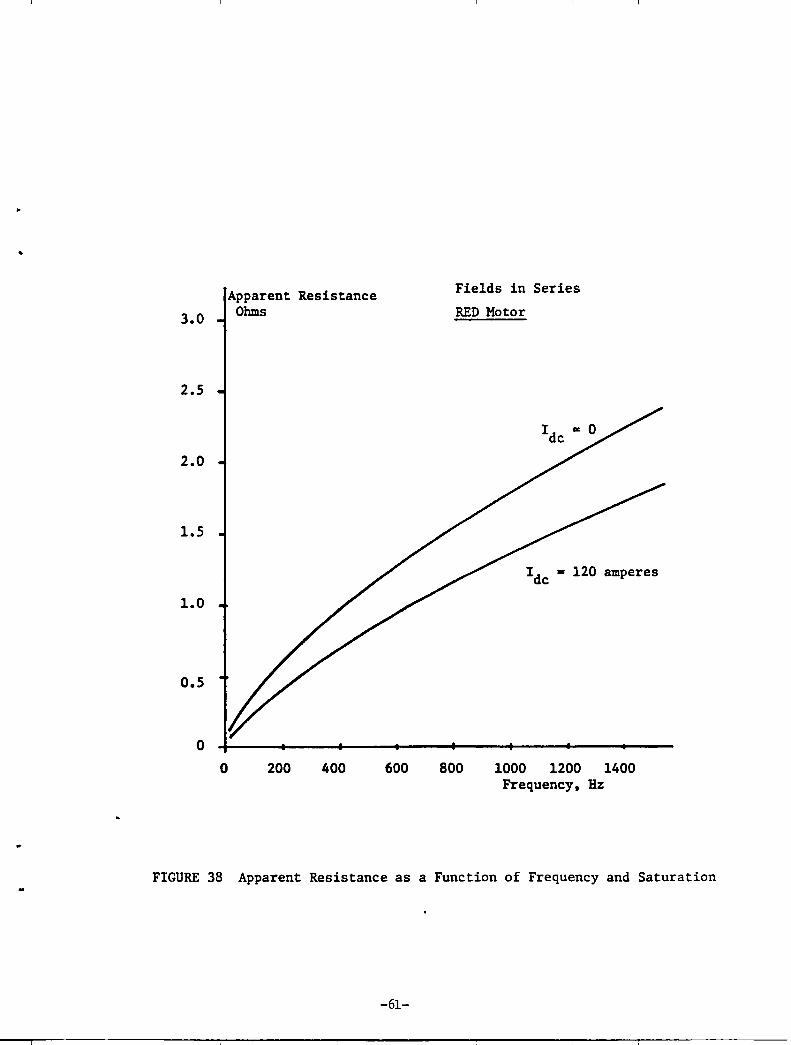
3.0
2.5
2.0
1.5
1.0
0.5
o o
Apparent Resistance Ohms
200 400 600
Fields in Series
RED Motor
800
Idc - 120 amperes
1000 1200 1400 Frequency. Hz
FIGURE 38 Apparent Resistance as a Function of Frequency and Saturation
-61-
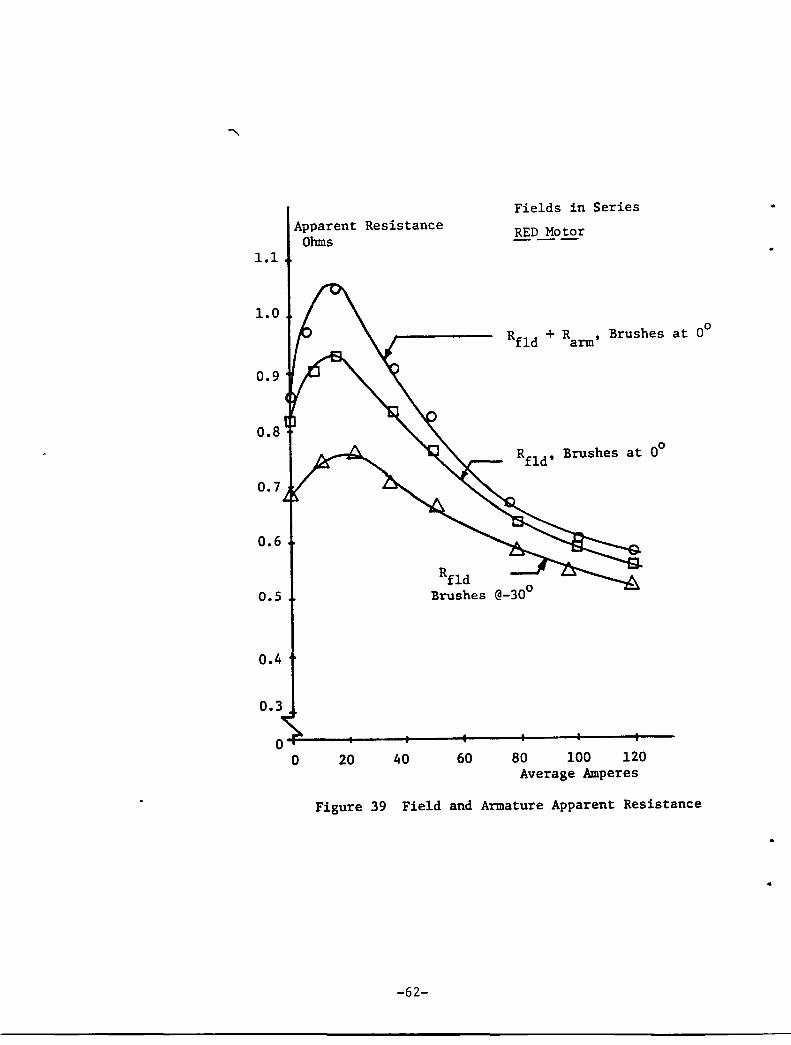
1.1
1.0
0.9
0.8
0.7
0.6
0.5
0.4
0.3
o
Apparent Resistance Ohms
o 20 40
Rfld Brushes
60
Fields in Series
RED...!!otor
o Rfld + Rarm' Brushes at 0
o Rfld
, Brushes at 0
80 100 120 Average Amperes
Figure 39 Field and Armature Apparent Resistance
-62-
cates that this loss could be decreased by using multiple insulated small Wlres in parallel rather than fewer heavy strands for the series field winding. Apparent resistance decreased about 15% with brush shift. The values observed under saturated conditions were 20-30% less than the unsaturated values (depending upon frequency). For a given degree of saturation, the apparent resistance increased with the +0.7 power of frequency. For a specific frequency, the resistance decreased approximately as the -0.07 power of the average current level.
Carbon Brush vs Copper Block Values:
(1) The value of inductance measured using copper blocks was found to be about 6% less than values from measurements with carbon brushes.
(2) Measurement of apparent resistance with carbon brushes in place yielded a value of approximately 75% greater than found using copper blocks.
Magnitude of Losses:
The combination of relatively high harmonic currents and the apparent resistance (reflecting hysteresis and eddy current skin and proximity effect losses) yields a loss component which should be included in any efficiency determination.
Motor/Chopper Interfac~ Influence:
Since the chopper is sensitive to the amount of inductance in the clrcuit, care should be taken to use the saturated value of inductance, obtained at the maximum operating frequency, when evaluating the interface details.
On Measurement Techniques:
The circuit used in this test does yield accurate values of Rand L. Because of the harmonic effects, special care must be used in the selection and application of the variable frequency power supply and instrumentation to be used. Copper blocks should be substituted for the carbon brushes.
It was noted that, for the motors tested, the ratio of reactance to apparent resistance is nearly independent of frequency and level of saturation.
Conclusion
The dependence of circuit parameters on frequency and saturation indicate the need for inclusion of these factors in a model of the motor from which performance is to be calculated.
-63-
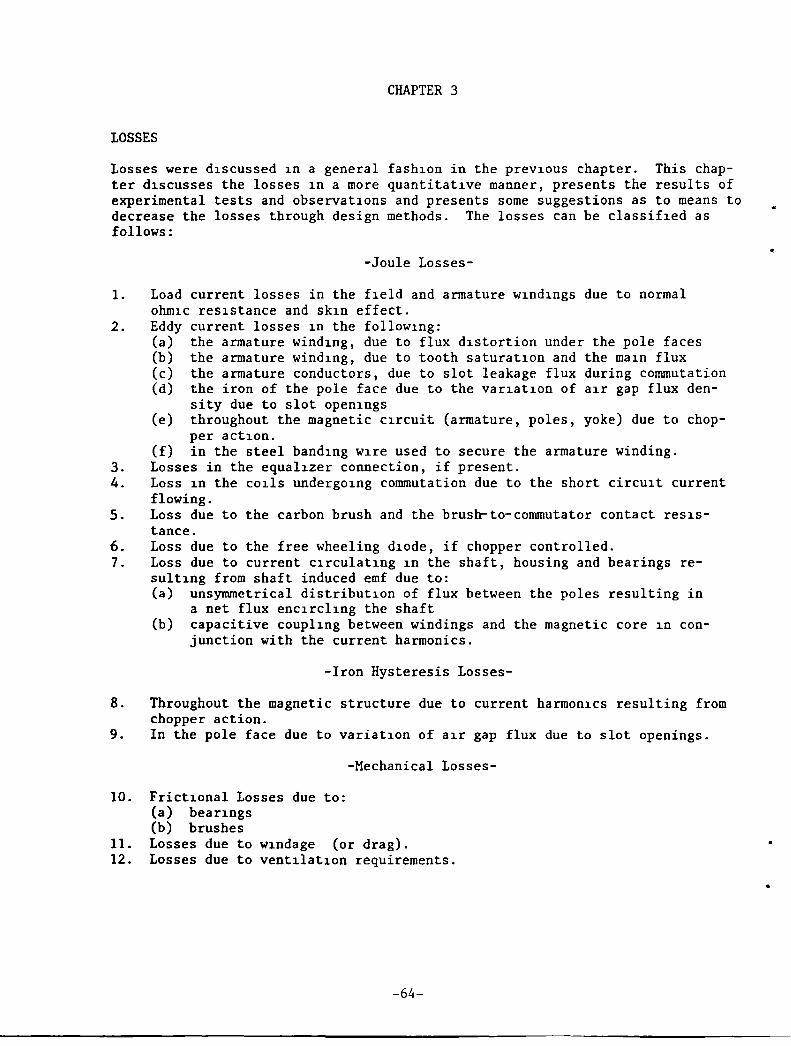
CHAPTER 3
LOSSES
Losses were d1scussed 1n a general fash10n in the prev10us chapter. This chapter d1scusses the losses 1n a more quantitat1ve manner, presents the results of experimental tests and observat10ns and presents some suggestions as to means to decrease the losses through design methods. The losses can be classif1ed as follows:
-Joule Losses-
1. Load current losses in the f1eld and armature w1nd1ngs due to normal Ohm1C res1stance and sk1n effect.
2. Eddy current losses 1n the follow1ng: (a) the armature wind1ng, due to flux d1stortion under the pole faces (b) the armature wind1ng, due to tooth saturat10n and the ma1n flux (c) the armature conductors, due to slot leakage flux during commutation (d) the iron of the pole face due to the var1at10n of a1r gap flux den-
sity due to slot open1ngs (e) throughout the magnetic c1rcuit (armature, poles, yoke) due to chop
per act10n. (f) in the steel band1ng W1re used to secure the armature winding.
3. Losses in the equal1zer connection, if present. 4. Loss 1n the c01ls underg01ng commutation due to the short circu1t current
flowing. 5. Loss due to the carbon brush and the brush-to-commutator contact reS1S
tance. 6. Loss due to the free wheeling d1ode, if chopper controlled. 7. Loss due to current c1rculat1ng 1n the shaft, housing and bearings re
sult1ng from shaft induced emf due to: (a) unsymmetrical distribut10n of flux between the poles resulting in
a net flux enc1rcl1ng the shaft (b) capacitive coupl1ng between windings and the magnetic core 1n con
junction with the current harmonics.
-Iron Hysteresis Losses-
8. Throughout the magnetic structure due to current harmon1cs resulting from chopper action.
9. In the pole face due to variat10n of a1r gap flux due to slot openings.
10. Frict10nal Losses due to: (a) bear1ngs (b) brushes
-Mechanical Losses-
11. Losses due to w1ndage (or drag). 12. Losses due to vent1lat10n requirements.
-64-
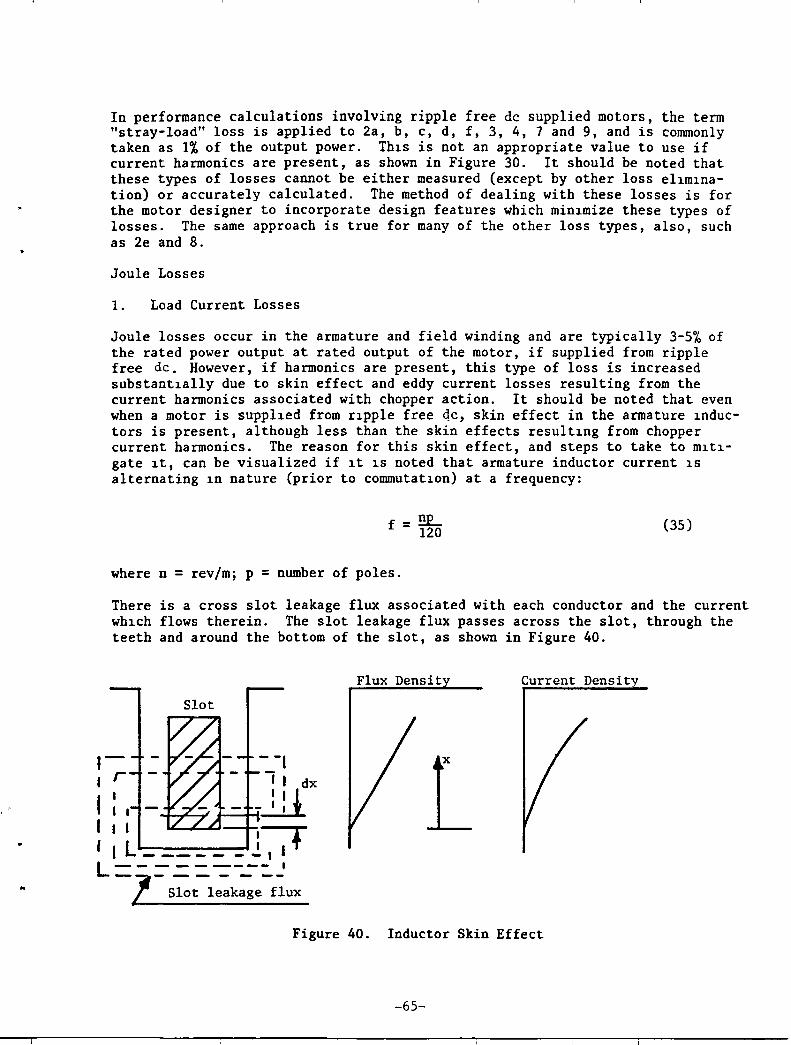
..
In performance calculations involving ripple free de supplied motors, the term "stray-load" loss is applied to 2a, b, c, d, f, 3, 4, 7 and 9, and is commonly taken as 1% of the output power. Th1s is not an appropriate value to use if current harmonics are present, as shown in Figure 30. It should be noted that these types of losses cannot be either measured (except by other loss el1m1nation) or accurately calculated. The method of dealing with these losses is for the motor designer to incorporate design features which min1mize these types of losses. The same approach is true for many of the other loss types, also, such as 2e and 8.
Joule Losses
1. Load Current Losses
Joule losses occur in the armature and field winding and are typically 3-5% of the rated power output at rated output of the motor, if supplied from ripple free de. However, if harmonics are present, this type of loss is increased substant1ally due to skin effect and eddy current losses resulting from the current harmonics associated with chopper action. It should be noted that even when a motor is suppl1ed from r1pple free qe, skin effect in the armature 1nductors is present, although less than the skin effects result1ng from chopper current harmonics. The reason for this skin effect, and steps to take to m1t1-gate 1t, can be visualized if 1t 1S noted that armature inductor current 1S alternating 1n nature (prior to commutat1on) at a frequency:
f = !!E...-120
where n = rev/m; p = number of poles.
(35)
There is a cross slot leakage flux associated with each conductor and the current wh1ch flows therein. The slot leakage flux passes across the slot, through the teeth and around the bottom of the slot, as shown in Figure 40.
Flux Densit Current Density
Figure 40. Inductor Skin Effect
-65-
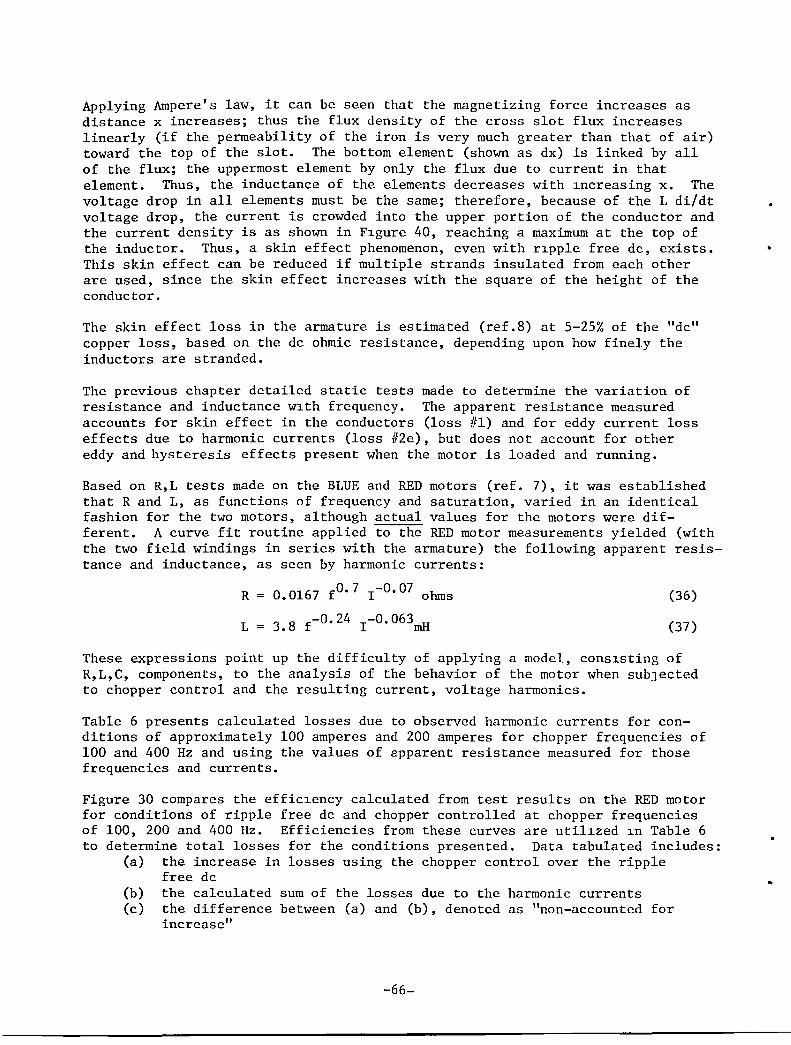
Applying Ampere's law, it can be seen that the magnetizing force increases as distance x increases; thus the flux density of the cross slot flux increases linearly (if the permeability of the iron is very much greater than that of air) toward the top of the slot. The bottom element (shown as dx) is linked by all of the flux; the uppermost element by only the flux due to current in that element. Thus, the inductance of the elements decreases with lncreasing x. The voltage drop in all elements must be the same; therefore, because of the L di/dt voltage drop, the current is crowded into the upper portion of the conductor and the current density is as shown in Flgure 40, reaching a maximum at the top of the inductor. Thus, a skin effect phenomenon, even with rlpple free dc, exists. This skin effect can be reduced if multiple strands insulated from each other are used, since the skin effect increases with the square of the height of the conductor.
The skin effect loss in the armature is estimated (ref.8) at 5-25% of the "dc" copper loss, based on the dc ohmic resistance, depending upon how finely the inductors are stranded.
The previous chapter detailed static tests made to determine the variation of resistance and inductance wlth frequency. The apparent resistance measured accounts for skin effect in the conductors (loss #1) and for eddy current loss effects due to harmonic currents (loss #2e), but does not account for other eddy and hysteresis effects present when the motor is loaded and running.
Based on R,L tests made on the BLUE and RED motors (ref. 7), it was established that Rand L, as functions of frequency and saturation, varied in an identical fashion for the two motors, although actual values for the motors were different. A curve fit routine applied to the RED motor measurements yielded (with the two field windings in series with the armature) the following apparent resistance and inductance, as seen by harmonic currents:
R
L
0.0167 f O• 7 1-0• 07 ohms
3.8 f- 0• 24 I-0• 063rnH
(36)
(37)
These expressions point up the difficulty of applying a model, conslsting of R,L,C, components, to the analysis of the behavior of the motor when subjected to chopper control and the resulting current, voltage harmonics.
Table 6 presents calculated losses due to observed harmonic currents for conditions of approximately 100 amperes and 200 amperes for chopper frequencies of 100 and 400 Hz and using the values of apparent resistance measured for those frequencies and currents.
Figure 30 compares the efficlency calculated from test results on the RED motor for conditions of ripple free dc and chopper controlled at chopper frequencies of 100, 200 and 400 Hz. Efficiencies from these curves are utillzed ln Table 6 to determine total losses for the conditions presented. Data tabulated includes:
(a) the increase in losses using the chopper control over the ripple free dc
(b) the calculated sum of the losses due to the harmonic currents (c) the difference between (a) and (b), denoted as "non-accounted for
increase"
-66-
..
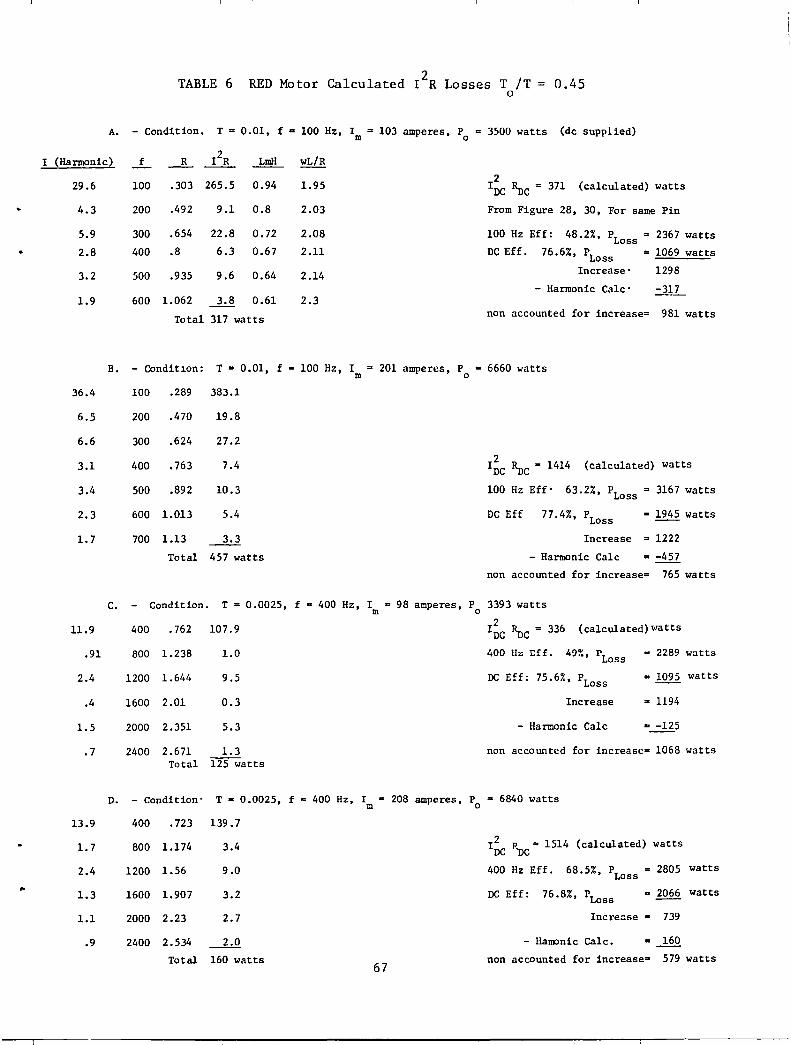
..
..
..
TABLE 6 RED Motor Calculated 12R Losses T /T o
0.45
A. - Condition. T = 0.01. f .. 100 Hz. 1m = 103 amperes. Po = 3500 watts (dc supplied)
I (Harmonic) f _R_ ~ LmH wL/R
29.6
4.3
5.9
2.8
3.2
1.9
36.4
6.5
6.6
3.1
3.4
2.3
1.7
11.9
.91
2.4
.4
1.5
.7
13.9
1.7
2.4
1.3
1.1
.9
100
200
300
400
500
.303 265.5 0.94
.492 9.1 0.8
.654 22.8 0.72
.8 6.3 0.67
.935 9.6 0.64
600 1.062 ~ 0.61
Total 317 watts
1.95
2.03
2.08
2.11
2.14
2.3
2 IDC Ruc = 371 (calculated) watts
From Figure 28. 30. For same Pin
100 Hz Eff: 48.2%. PLoss = 2367 watts
DC Eff. 76.6%. PLoss = 1069 watts
Increase'
- Harmonic Calc'
1298
-317
non accounted for increase= 981 watts
B. - Condit10n: T = 0.01. f 100 Hz. 1m = 201 amperes. Po = 6660 watts
100
200
300
400
500
.289 383.1
.470 19.8
.624 27.2
.763
.892
7.4
10.3
600 1.013 5.4
700 1.13
Total 457 watts
2 I DC Ruc = 1414 (calculated) watts
100 Hz Eff' 63.2%. PLoss = 3167 watts
DC Eff 77.4%. PLOSS = 1945 watts
Increase = 1222
- Harmonic Calc
non accounted for increase= 765 watts
C. - Condition. T = 0.0025, f a 400 Hz, 1m = 98 amperes, Po 3393 watts
400 .762 107.9 2 I DC Ruc = 336 (calculated) watts
800 1.238 1.0 400 lIz Lff. 49%, PLoss - 2289 watts
1200 1.644 9.5 DC Eff: 75.6%, PLoss = 1095 watts
1600 2.01 0.3 Increase = 1194
2000 2.351 5.3 - Harmonic Calc
2400 2.671 1.3 non accounted for increase= 1068 watts Total 125 watts
D. - Condition' T - 0.0025, f = 400 Hz. 1m - 208 amperes. Po = 6840 watts
400 .723 139.7
800 1.174 3.4
1200 1.56 9.0
1600 1.907 3.2
2000 2.23 2.7
2400 2.534 ~
Total 160 watts 67
12 R = 1514 (calculated) watts DC i)C
400 Hz Eff. 68.5%. PLOSS = 2805 watts
DC Eff: 76.8%, PLoss .. 2066 watts
Inc re:.se - 739
- Haoonic Calc.
non accounted for increaseD 579 watts
(d) the joule loss due to a r1pple free de current and the measured de resistance.
(e) in cond1t10n (a), the values of Land wL/R were calculated to ver1fy the near constant rat10 discussed in Chapter 2.
For each condit1on, the observed power output, P is shown. Using the de efficiency, power 1nput 1S calculated and the lossgs under chopper operation are calculated from this same 1nput power and the eff1c1ency from F1gure 30.
The follow1ng observations can be made: (a) Efficiency of a conventional motor is sharply reduced when chopper
controlled. The h1gher the chopper frequency, the less the reduction in eff1ciency.
(b) The decrease 1n efficiency is more pronounced at lower values of average current, because the ripple (and magnitude of the harmon1cs) is a h1gher percentage of the average current, I. For example, refer to Figures 14 and 15 wh1ch show an increase of ~i/I m as I decreases and as frequency decreases. average average
(c) Chopper control introduces additional losses not accounted for by consideration of harmonic currents and apparent resistance, as measured.
2. Eddy Current Losses
2.(a) In the Armature Due to D1storted Pole Face Flux
Eddy current losses occur 1n the armature inductors as they pass under the pole face if the flux density is not un1form. Non-uniform1ty results from the cross f1eld component of armature reaction. The armature mmf 1S triangular in shape, with zero crossing m1dway between the brushes. If the brushes are on mechan1cal neutral, the flux dens1ty resulting from the armature mmf can be decreased by increas1ng the reluctance of the air gap under the pole t1pS. This is accomp-11shed by design1ng the arc of the pole face with a radius much larger than the radius of the armature (chamfered pole shape), causing armature and pole face to be non-concentric, with air gap length at the pole tips larger than at mid pole. Another approach if lam1nated poles are used is to have the laminations w1th only one tip at each pole and stack the laminations such that the tip is 1n the opposite d1rect10ns for adjoining laminat10ns. The effect here is to decrease the permeab1lity by decreas1ng the area of pole tip 1ron.
The above approaches merely mod1fy (decrease) the magn1tude of the loss. The armature reaction effect can be (theoretically) completely suppressed by the use of compensating w1ndings embedded in the pole face.
The magnitude of this loss cannot be ascertained by measurement nor accurately calculated. In a motor operated on ripple free de f it is estimated (ref. 8) to be O~05-0.06% of the power output in a non-compensated motor and to be negligible if compensating windings are present. If the motor 1S supplied from a chopper source, the losses will most certainly be considerably higher because of the pulsations of the armature current due to the chopper action and resulting harmonics.
-68-
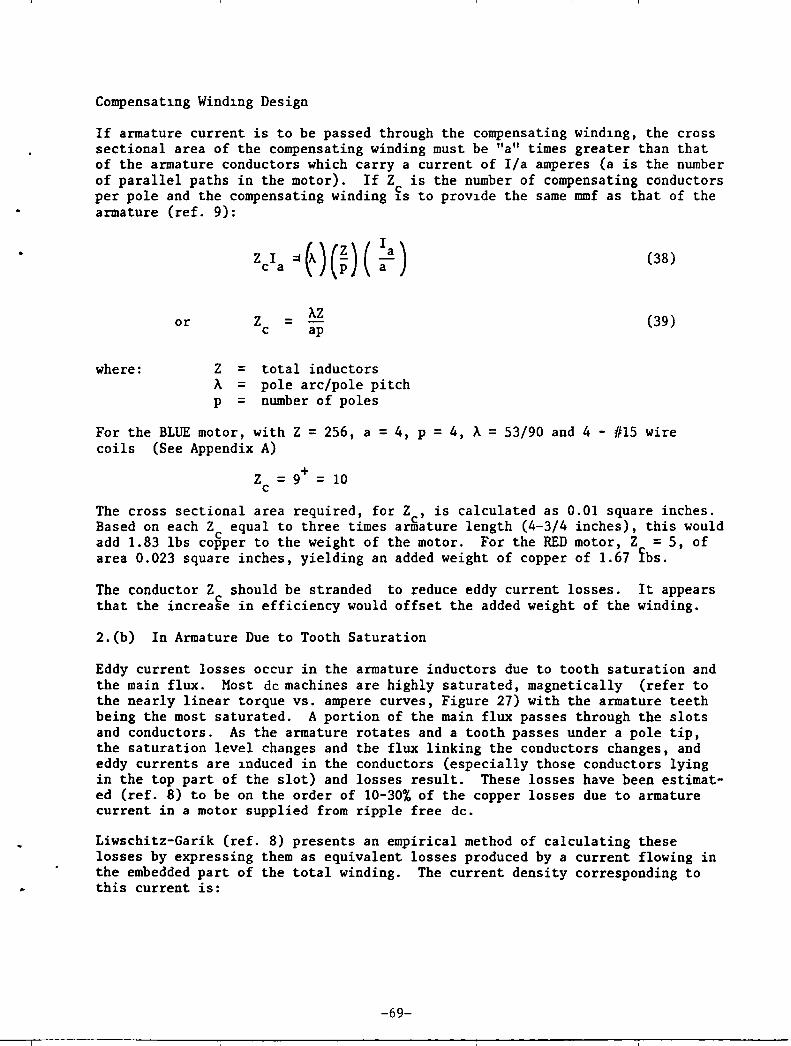
..
Compensat1ng Wind1ng Design
If armature current is to be passed through the compensating wind1ng, the cross sectional area of the compensating winding must be "a" times greater than that of the armature conductors which carry a current of I/a amperes (a is the number of parallel paths in the motor). If Z is the number of compensating conductors per pole and the compensating winding is to prov1de the same mmf as that of the armature (ref. 9):
Z I ,,~)(~)( ~a) c a (38)
Z AZ or = c ap (39)
where: Z = total inductors A = pole arc/pole pitch p = number of poles
For the BLUE motor, with Z = 256, a = 4, p = 4, A = 53/90 and 4 - #15 wire coils (See Appendix A)
Zc = 9+ = 10
The cross sectional area required, for Z , is calculated as 0.01 square inches. Based on each Z equal to three times arffiature length (4-3/4 inches), this would add 1.83 lbs co~per to the weight of the motor. For the RED motor, Z = 5, of area 0.023 square inches, yielding an added weight of copper of 1.67 ~bs.
The conductor Z should be stranded to reduce eddy current losses. It appears that the increa~e in efficiency would offset the added weight of the winding.
2.(b) In Armature Due to Tooth Saturation
Eddy current losses occur in the armature inductors due to tooth saturation and the main flux. Most de machines are highly saturated, magnetically (refer to the nearly linear torque vs. ampere curves, Figure 27) with the armature teeth being the most saturated. A portion of the main flux passes through the slots and conductors. As the armature rotates and a tooth passes under a pole tip, the saturation level changes and the flux linking the conductors changes, and eddy currents are 1nduced in the conductors (especially those conductors lying in the top part of the slot) and losses result. These losses have been estimated (ref. 8) to be on the order of 10-30% of the copper losses due to armature current in a motor supplied from ripple free de.
Liwschitz-Garik (ref. 8) presents an empirical method of calculating these losses by expressing them as equivalent losses produced by a current flowing in the embedded part of the total winding. The current density corresponding to this current is:
-69-
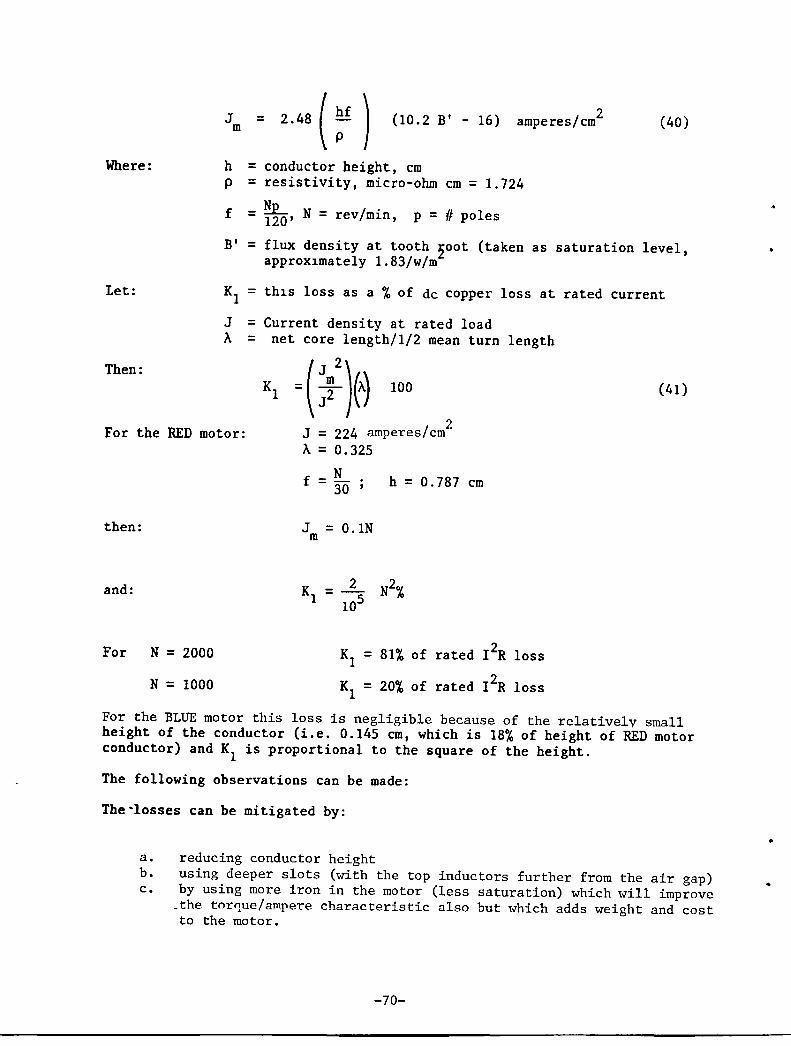
Jm = 2.48 ( :£ ) (10.2 B' - 16) 2 amperes/em (40)
Where: h = conductor height, cm
Let:
p = resistivity, micro-ohm em = 1.724
f
B'
K1
J A
~ N / . Jt 1 = 120' = rev m~n, p = " po es
= flux density at tooth 200t (taken as saturation level, approx~mately 1.83/w/m
= th~s loss as a % of dc copper loss at rated current
= Current density at rated load = net core length/1/2 mean turn length
Then:
Kl =( Y)N 100
For the RED motor:
then:
and:
For N = 2000
N = 1000
/ 2
J = 224 amperes cm A = 0.325
N f = 30 h = 0.787 em
J = O.lN m
K} _ 2
- 105
K1 = Kl =
N2%
81% of rated 12R
20% of rated 12R
(41)
loss
loss
For the BLUE motor this loss is negligible because of the relatively small height of the conductor (i.e. 0.145 em, which is 18% of height of RED motor conductor) and K1 is proportional to the square of the height.
The following observations can be made:
The"losses can be mitigated by:
a. reducing conductor height b. using deeper slots (with the top inductors further from the air gap) c. by using more iron in the motor (less saturation) which will improve
_the tor~ue/ampere characteristic also but which adds weight and cost to the motor.
-70-
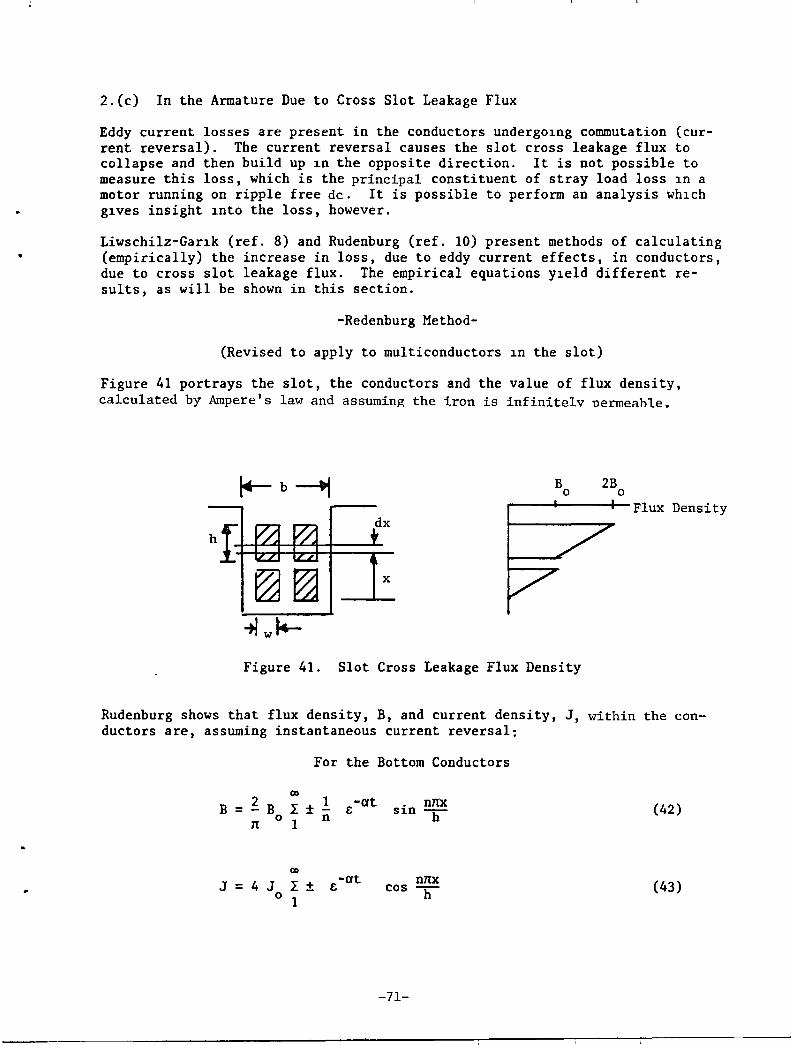
•
2.(c) In the Armature Due to Cross Slot Leakage Flux
Eddy current losses are present in the conductors underg01ng commutation (current reversal). The current reversal causes the slot cross leakage flux to collapse and then build up 1n the opposite direction. It is not possible to measure this loss, which is the principal constituent of stray load loss 1n a motor running on ripple free dc. It is possible to perform an analysis wh1ch g1ves insight 1nto the loss, however.
Liwschilz-Gar1k (ref. 8) and Rudenburg (ref. 10) present methods of calculating (empirically) the increase in loss, due to eddy current effects, in conductors, due to cross slot leakage flux. The empirical equations Y1eld different results, as will be shown in this section.
-Redenburg Method-
(Revised to apply to multiconductors 1n the slot)
Figure 41 portrays the slot, the conductors and the value of flux density, calculated by Ampere's law and assuming the iron is infinitelY nerrneahle.
B o 2B o
~----~-----r--Flux Density
Figure 41. Slot Cross Leakage Flux Density
Rudenburg shows that flux density, B, and current density, J, within the conductors are, assuming instantaneous current reversal:
For the Bottom Conductors
~ B co
B I ± 1 -at sin nnx = e 11 0 1
n n (42)
co
J 4 J I ± -at nnx = e cos h 0 1
(43)
-71-
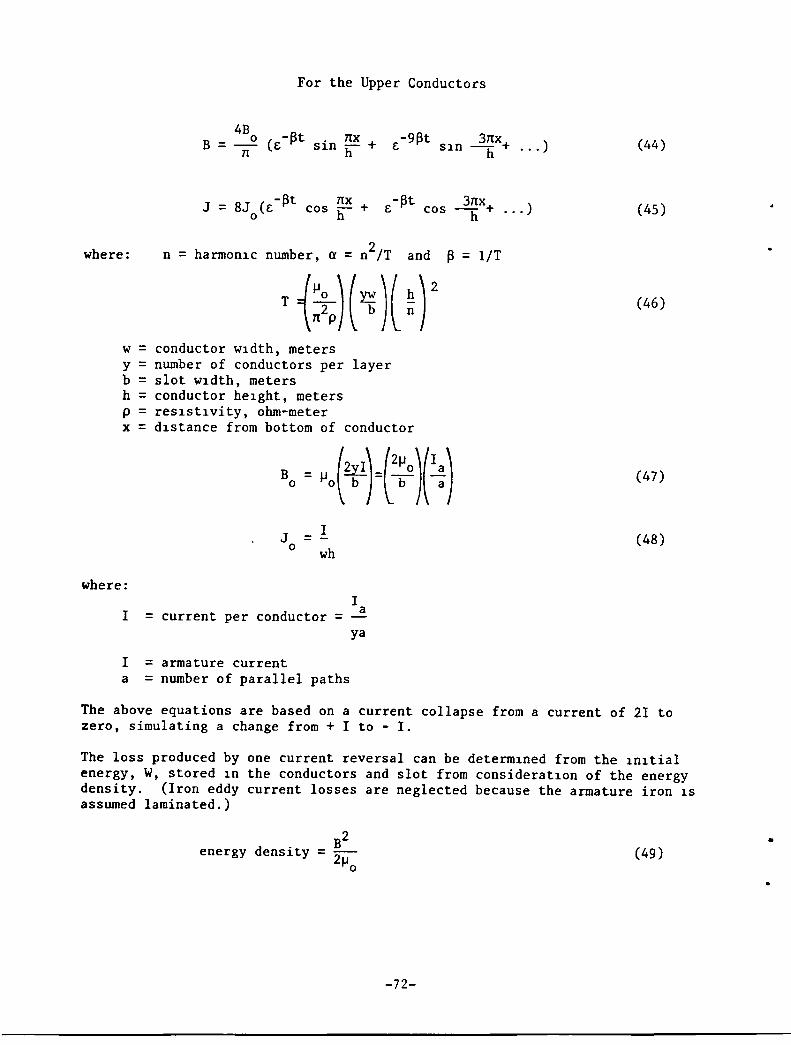
where:
w y b h P x
where:
I
= = = = = =
For the Upper Conductors
B = 4B
o n
~-9~t S1n 3nx+ ) ... h'"
J - 8J (~-~t c nx + ~-~t cos 3nh
x+ ... ) - 0'" os 11" ...
n = harmon1c number, a = n2/T and ~ = lIT
conductor w1dth, meters number of conductors per layer slot w1dth, meters conductor he1ght, meters res1st1vity, ohm-meter d1stance from bottom of conductor
J = o I
wh
= current per conductor = I
a
ya
I = armature current a = number of parallel paths
(44)
(45)
(46)
(47)
(48)
The above equations are based on a current collapse from a current of 21 to zero, simulating a change from + I to - I.
The loss produced by one current reversal can be determ1ned from the 1n1tial energy, W, stored 1n the conductors and slot from considerat10n of the energy density. (Iron eddy current losses are neglected because the armature iron 1S assumed laminated.)
B2 energy density = 2~
o
-72-
(49) •
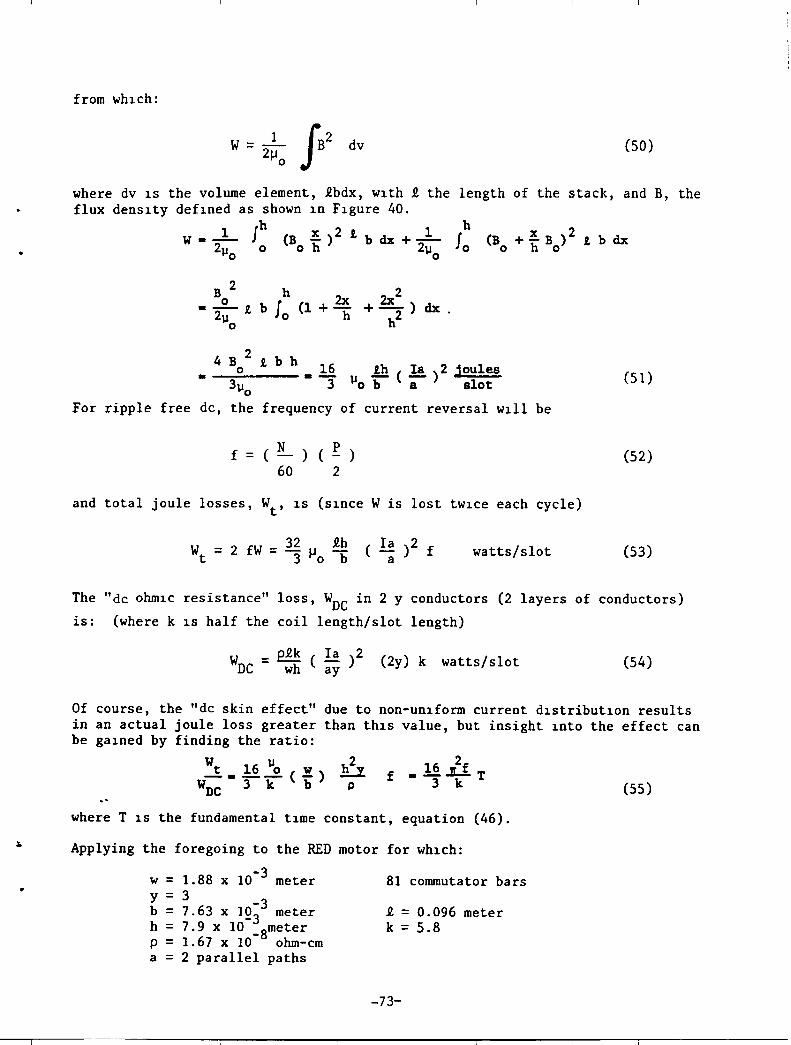
•
from Wh1Ch:
(50)
where dv 1S the volume element, 1bdx, w1th 1 the length of the stack, and B, the flux dens1ty def1ned as shown 1n F1gure 40.
Jh W -...!....
211 0
h (B ~) 2 I. b dx +...!.... J (B + ~ B ) 2 I. b dx
o h 211 0 0 h 0 o o
B 2 h 2
- 2~ 2. b J 0 (1 + ~ + 2x 2 ) dx . ~o h
_4....,B,..;;O;...2_2._b_h _ 16 I.h ( 1a )2 joules • 311o 3 lIo b a slot (51)
For ripple free de, the frequency of current reversal w111 be
f = (N ) ( p ) (52) 60 2
and total joule losses, Wt , 1S (slnce W is lost tW1ce each cycle)
W = 2 fW = 32 J..I 1bh t 3 0
watts/slot (53)
The "de ohnllc resistance" loss, WDC in 2 y conductors (2 layers of conductors)
is: (where k 1S half the coil length/slot length)
W = p£k ( 1a)2 (2y) k watts/slot DC wh ay (54)
Of course, the "de skin effect" due to non-un1form current d1stribut10n results in an actual joule loss greater than th1S value, but insight 1nto the effect can be ga1ned by finding the ratio:
Wt 16 llo ( w) h2
y f _ 16 h T Wne • '3 k b p 3 k (55)
where T 1S the fundamental t1me constant, equation (46).
Applying the foregoing to the RED motor for Wh1Ch:
w = 1.88 x 10⁻³ meter y = 3 = -3 b 7.63 x 123 meter h = 7.9 x 10 _8meter p = 1.67 x 10 ohm-em a = 2 parallel paths
81 commutator bars
£ = 0.096 meter k = 5.8
-73-
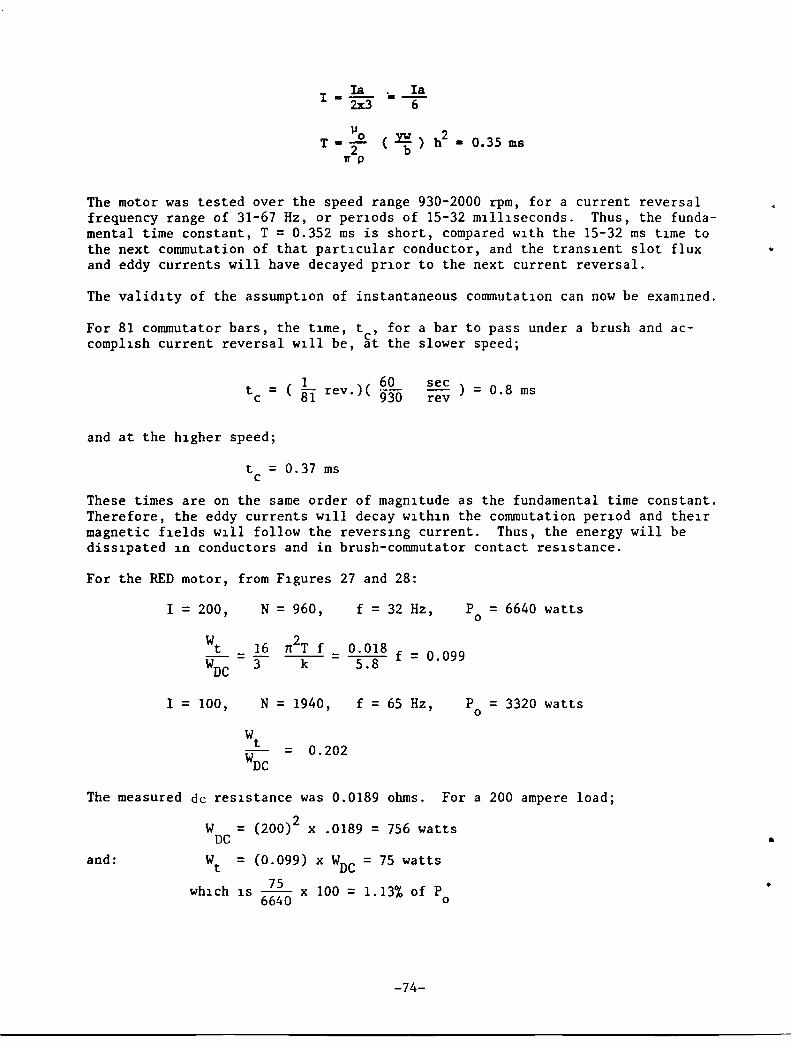
I Ia . 1a - 2x3 - -6-
llO T --2
1T P
( .I!!) b2 _ 0.35 ms b
The motor was tested over the speed range 930-2000 rpm, for a current reversal frequency range of 31-67 Hz, or per~ods of 15-32 m~ll~seconds. Thus, the fundamental time constant, T = 0.352 ms is short, compared w~th the 15-32 ms t~me to the next commutation of that part~cular conductor, and the trans~ent slot flux • and eddy currents will have decayed pr~or to the next current reversal.
The valid~ty of the assumpt~on of instantaneous commutat~on can now be exam~ned.
For 81 commutator bars, the t~me, t , for a bar to pass under a brush and acc
compl~sh current reversal w~ll be, at the slower speed;
1 60 tc = ( 81 rev.)( 930 sec ) =
rev 0.8 ms
and at the h~gher speed;
t = 0.37 ms c
These times are on the same order of magn~tude as the fundamental time constant. Therefore, the eddy currents w~ll decay w~th~n the commutation per~od and the~r magnetic f~elds w~ll follow the revers~ng current. Thus, the energy will be diss~pated ~n conductors and in brush-commutator contact res~stance.
For the REO
I
I
The measured
and:
motor, from F~gures 27 and 28:
=
=
200, N = 960, f = 32 Hz,
Wt 16 n2T f 0.018 f 0.099 = = = Woe 3 k 5.8
100, N = 1940, f = 65 Hz,
Wt 0.202 = Woe
de res~stance was 0.0189 ohms. For
W = (200)2 x .0189 = 756 watts De Wt = (0.099) x Woe = 75 watts
75 wh~ch ~s -- x 100 = 1. 13% of P
6640 0
-74-
P = 6640 watts 0
P = 3320 watts 0
a 200 ampere load;
•
•
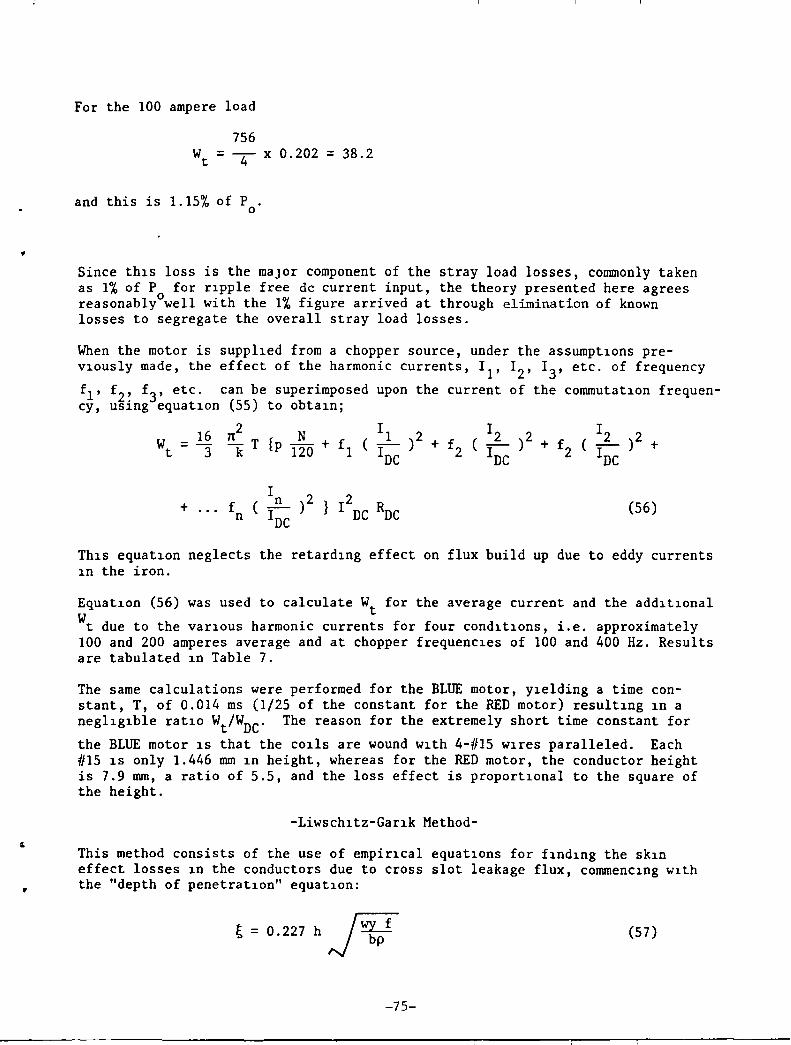
•
For the 100 ampere load
756 W
t = ~ x 0.202 = 38.2
and this is 1.15% of P . o
Since thlS loss is the major component of the stray load losses, commonly taken as 1% of P for rlpple free de current input, the theory presented here agrees reasonablyOwell with the 1% figure arrived at through elimination of known losses to segregate the overall stray load losses.
When the motor is supplled from a chopper source, under the assumptlons prevlously made, the effect of the harmonic currents, II' 12 , 1
3, etc. of frequency
f l , f 2 , f3' etc. can be superimposed upon the current of the commutatlon frequency, using equatlon (55) to obtalnj
16 Tt2 N II I I
)2 + Wt = 3 -T {p 120 + fl ( IDC )2 + f (~ )2 + f (~
k 2 IDC 2 IDC
I )2 } 2 f ( n RDC (56) + ... IDC
I DC n
ThlS equatlon neglects the retardlng effect on flux build up due to eddy currents ln the iron.
Equatlon (56) was used to calculate Wt for the average current and the addltlonal
Wt due to the varlOUS harmonic currents for four condltlons, i.e. approximately 100 and 200 amperes average and at chopper frequencles of 100 and 400 Hz. Results are tabulated ln Table 7.
The same calculations were performed for the BLUE motor, Ylelding a time constant, T, of 0.014 ms (1/25 of the constant for the RED motor) resultlng ln a negllglble ratlo Wt/WDC ' The reason for the extremely short time constant for
the BLUE motor lS that the cOlIs are wound wlth 4-#15 Wlres paralleled. Each #15 lS only 1.446 mm ln height, whereas for the RED motor, the conductor height is 7.9 mm, a ratio of 5.5, and the loss effect is proportlonal to the square of the height.
-Liwschltz-Garlk Method-
This method consists of the use of empirlcal equatlons for flndlng the skln effect losses ln the conductors due to cross slot leakage flux, commenclng wlth the "depth of penetratlon" equatlon:
t = 0.227 h ~~pf (57)
-75-
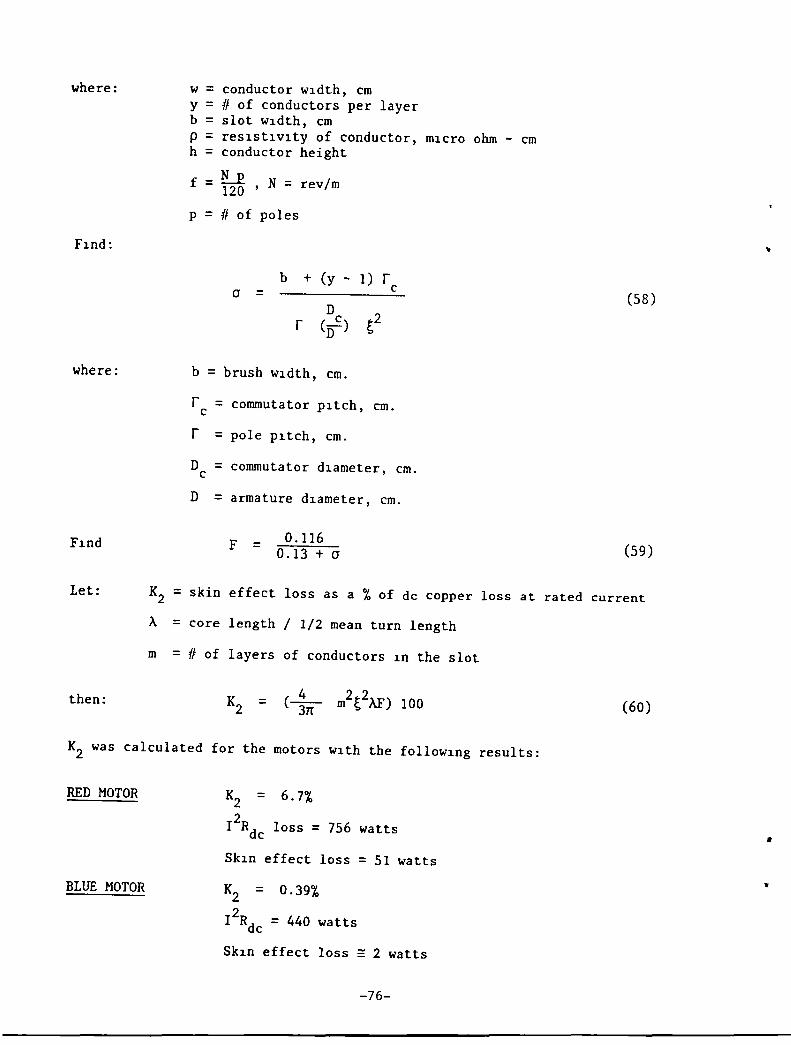
where:
where:
W = conductor w1dth, cm y = # of conductors per layer b = slot w1dth, cm p = res1st1v1ty of conductor, m1cro ohm - cm h = conductor height
f = ~2b ' N = rev/m
p = # of poles
b a =
r
+ (y - 1) r c
b = brush w1dth, cm.
r = c
r = D = c
D =
commutator p1tch, cm.
pole p1tch, cm.
commutator d1ameter, cm.
armature d1ameter,
F = 0.116 0.13 + a
cm.
(58)
(59)
Let: K2 = skin effect loss as a % of de copper loss at rated current
A = core length / 1/2 mean turn length
m = # of layers of conductors 1n the slot
then: =
K2 was calculated for the motors w1th the follow1ng results:
RED MOTOR
BLUE MOTOR
K2 = 6.7%
r2Rdc loss = 756 watts
Sk1n effect loss = 51 watts
K2 = 0.39%
r2R = 440 watts dc
Sk1n effect loss = 2 watts
-76-
(60)
..
•
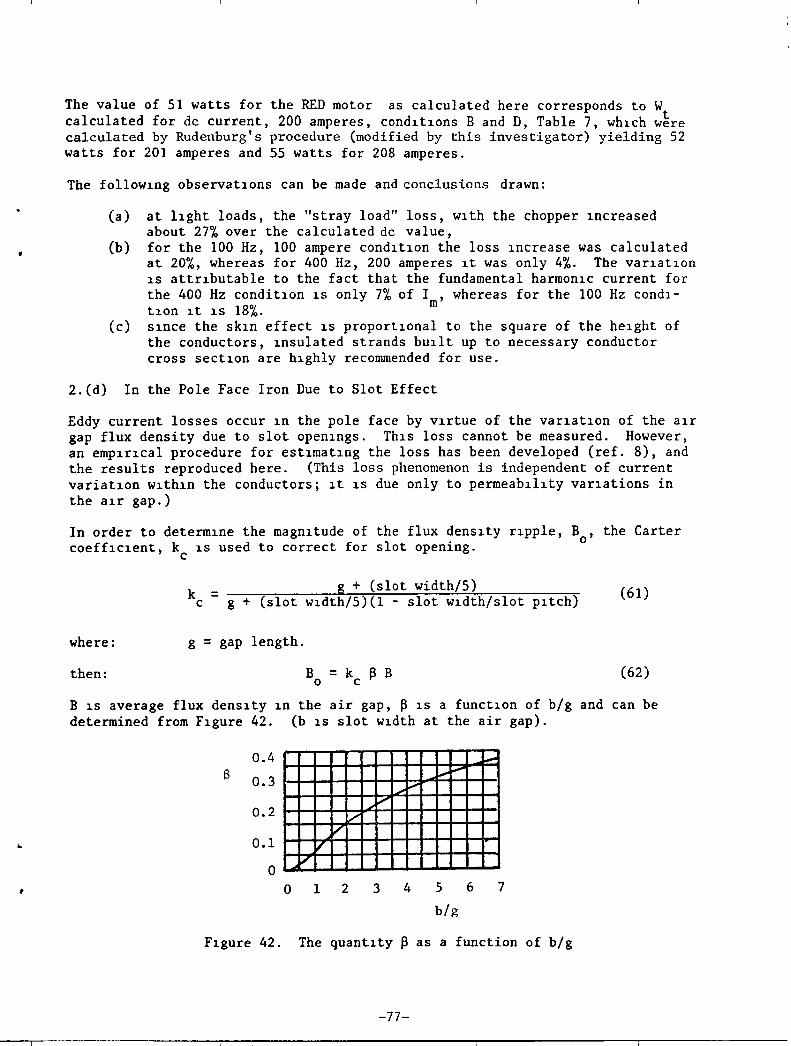
•
The value of 51 watts for the RED motor as calculated here corresponds to W calculated for dc current, 200 amperes, cond1t10ns Band D, Table 7, Wh1Ch w~re calculated by Rudenburg's procedure (modified by this investigator) yielding 52 watts for 201 amperes and 55 watts for 208 amperes.
The follow1ng observat10ns can be made and conclusions drawn:
(a) at l1ght loads, the "stray load" loss, w1th the chopper 1ncreased about 27% over the calculated dc value,
(b) for the 100 Hz, 100 ampere cond1t10n the loss 1ncrease was calculated at 20%, whereas for 400 Hz, 200 amperes 1t was only 4%. The var1at1on 1S attr1butable to the fact that the fundamental harmon1c current for the 400 Hz condit10n 1S only 7% of I , whereas for the 100 Hz condl-t10n 1t 1S 18%. m
(c) S1nce the sk1n effect 1S proport10nal to the square of the he1ght of the conductors, 1nsulated strands bU11t up to necessary conductor cross sect10n are h1ghly recommended for use.
2.(d) In the Pole Face Iron Due to Slot Effect
Eddy current losses occur 1n the pole face by v1rtue of the var1at1on of the a1r gap flux density due to slot open1ngs. Th1s loss cannot be measured. However, an emp1r1cal procedure for est1mat1ng the loss has been developed (ref. 8), and the results reproduced here. (This loss phenomenon is independent of current variat10n w1th1n the conductors; 1t 1S due only to permeab1l1ty var1ations in the au gap.)
In order to determ1ne the magn1tude of the flux dens1ty r1pple, B , the Carter coeff1c1ent, k 1S used to correct for slot opening. 0
c
k c
= g + (slot width/5) g + (slot w1dth/5)(1 - slot w1dth/slot p1tch)
(61)
where: g = gap length.
then: B = k ~ B o c (62)
B 1S average flux dens1ty 1n the air gap, ~ 1S a funct10n of big and can be determined from F1gure 42. (b 1S slot w1dth at the air gap).
B 0.4
0.3
0.2
0.1
o
v 1/
V II'
V
o 1 2 3
-' ~
4
~ I-"""
5 6
big
1,..000
7
F1gure 42. The quant1ty ~ as a function of big
-77-
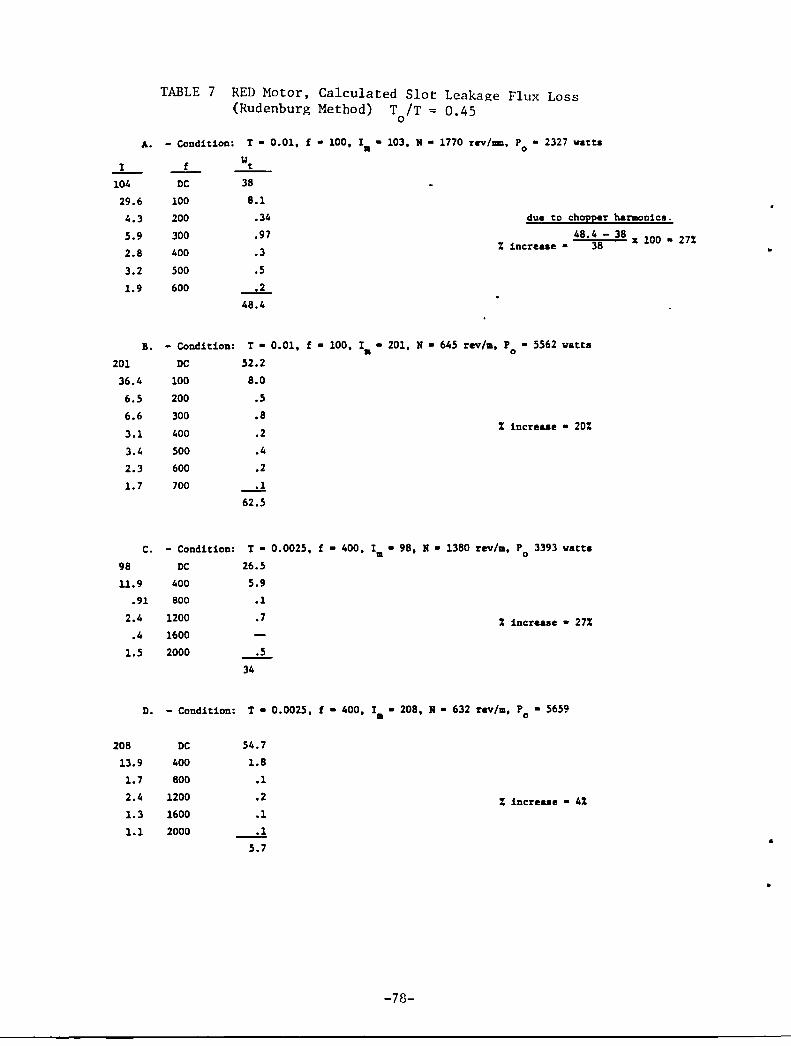
TABLE 7 RED Motor, Calculated Slot Leakage Flux Loss (Rudenburg Method) T /T = 0.45
o
A. - Condition: T - 0.01, f - 100, 1. - 103, M - 1770 rev/mm. Po - 2327 vatta
..L.. _f_ ~ 104 DC 38
29.6 100 8.1
4.3 200 .34 due to chopper harmonics.
5.9 300 .97 48'j8- 38 x 100 • 27% 2.8 400 .3 % increase·
3.2 500 .5
1.9 600 _._2_
48.4
B. - Condition: T • 0.01, f • 100. 1 •• 201, N • 645 rev/m, p - 5562 watta 0
201 DC 52.2
36.4 100 8.0
6.5 200 .5
6.6 300 .8
3.1 400 .2 % increaae - 20%
3.4 500 .4
2.3 600 .2
1.7 700 ---d 62.5
C. - Condition: T - 0.0025, f - 400, 1m • 98, N • 1380 rev/m, p 3393 watts 0
98 DC 26.5
11.9 400 5.9
.91 800 .1
2.4 1200 .7 % increase - 27% .4 1600
1.5 2000 _.5_
34
D. - Condition: T - 0.0025, f • 400, 1m • 208, N • 632 rev/m, Po - 5659
208 DC 54.7
13.9 400 1.8
1.7 800 .1
2.4 1200 .2 % increaae - 4% 1.3 1600 .1
1.1 2000 __ ._1
5.7
-78-
•
•
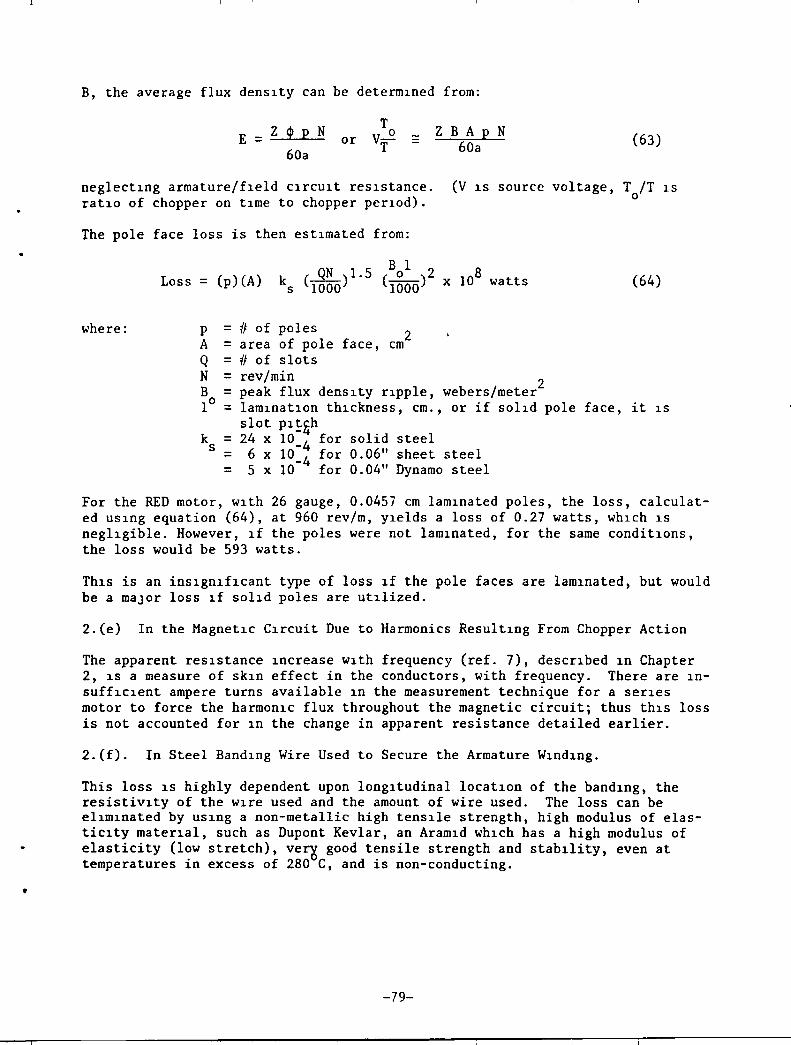
•
B, the average flux dens1ty can be determ1ned from:
or T V~
T Z B A p N
60a (63)
neglect1ng armature/f1eld C1rcu1t res1stance. rat10 of chopper on tIme to chopper perIod).
(V 1S source voltage, T /T 1S o
The pole face loss is then est1mated from:
where: p = # of poles 2 A = area of pole face, cm Q = # of slots N = rev/min 2
(64)
B = peak flux dens1ty r1pple, webers/meter 10 = lamlnat10n th1ckness, cm., or if so11d pole face, it 1S
slot p1~~h ks = 24 x 10_4 for
6 x 10_4 for 5 x 10 for
= =
solid steel 0.06" sheet steel 0.04" Dynamo steel
For the RED motor, w1th 26 gauge, 0.0457 cm lamInated poles, the loss, calculated uS1ng equation (64), at 960 rev/m, Y1elds a loss of 0.27 watts, whIch IS neg11gible. However, 1f the poles were not lam1nated, for the same condit10ns, the loss would be 593 watts.
Th1s is an ins1gnlf1cant type of loss If the pole faces are lamInated, but would be a maJor loss 1f so11d poles are ut11ized.
2.(e) In the Magnet1c C1rcuit Due to Harmonics Result1ng From Chopper Action
The apparent res1stance 1ncrease w1th frequency (ref. 7), descrIbed In Chapter 2, 1S a measure of skIn effect in the conductors, with frequency. There are Insuff1c1ent ampere turns available 1n the measurement technique for a ser1es motor to force the harmon1c flux throughout the magnetic circuit; thus th1s loss is not accounted for 1n the change in apparent resistance detailed earlier.
2.(f). In Steel BandIng Wire Used to Secure the Armature W1nd1ng.
This loss 1S highly dependent upon 10ng1tudinal locatIon of the band1ng, the resistiv1ty of the W1re used and the amount of wire used. The loss can be e11mlnated by USIng a non-metallic high tensIle strength, high modulus of elastic1ty mater1al, such as Dupont Kevlar, an Aram1d wh1ch has a high modulus of elasticity (low stretch), verz good tensile strength and stab11ity, even at temperatures in excess of 280 C, and is non-conducting .
-79-
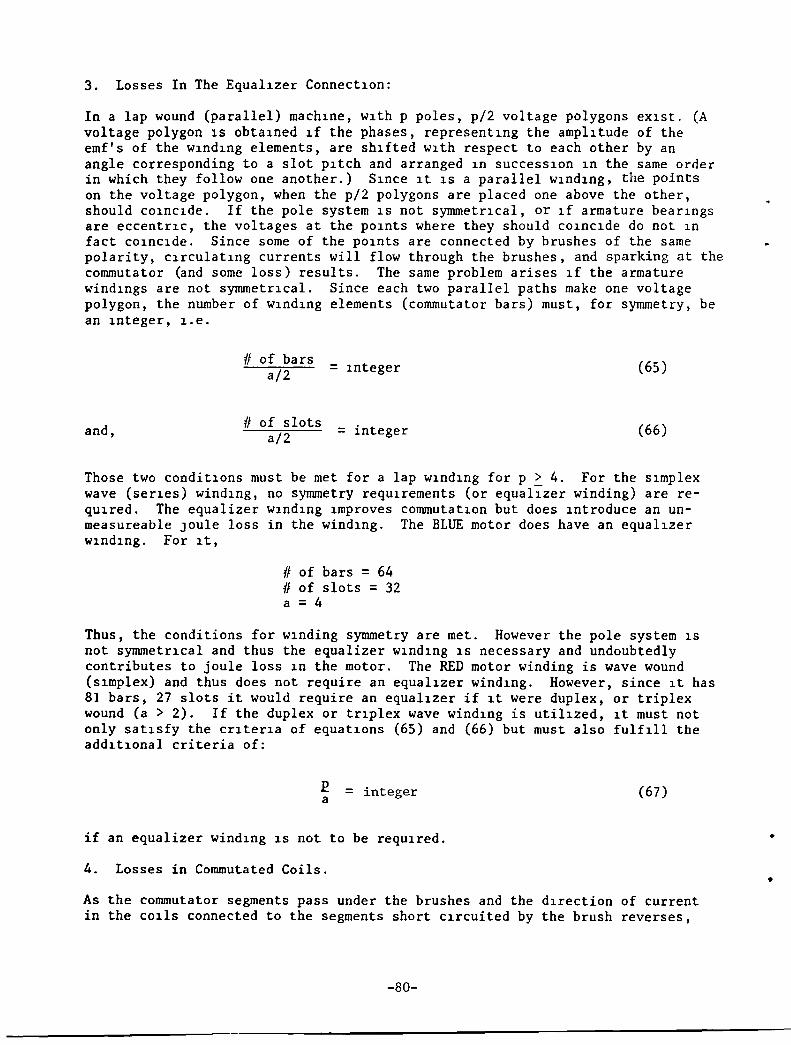
3. Losses In The EqualIzer ConnectIon:
In a lap wound (parallel) machIne, wIth p poles, p/2 voltage polygons eXIst. (A voltage polygon IS obtaIned If the phases, representIng the amplItude of the emf's of the wIndIng elements, are shIfted wIth respect to each other by an angle corresponding to a slot pItch and arranged In succeSSIon In the same order in which they follow one another.) SInce It IS a parallel wIndIng, the points on the voltage polygon, when the p/2 polygons are placed one above the other, should COInCIde. If the pole system IS not symmetrIcal, or If armature bearIngs are eccentrIC, the voltages at the pOInts where they should COInCIde do not In fact COInCIde. Since some of the pOInts are connected by brushes of the same polarity, CIrculatIng currents will flow through the brushes, and sparking at the commutator (and some loss) results. The same problem arises If the armature windIngs are not symmetrIcal. Since each two parallel paths make one voltage polygon, the number of wIndIng elements (commutator bars) must, for symmetry, be an Integer, I.e.
n of bars a/2 = Integer (65)
and, n of slots integer a/2 = (66)
Those two conditIons must be met for a lap WIndIng for p > 4. For the SImplex wave (serIes) windIng, no symmetry reqUIrements (or equalizer winding) are reqUIred. The equalizer WIndIng Improves commutatIon but does Introduce an unmeasureable Joule loss in the windIng. The BLUE motor does have an equalIzer WIndIng. For It,
n of bars = 64 n of slots = 32 a = 4
Thus, the conditions for WInding symmetry are met. However the pole system IS not symmetrIcal and thus the equalizer WIndIng IS necessary and undoubtedly contributes to joule loss In the motor. The RED motor winding is wave wound (SImplex) and thus does not require an equalIzer windIng. However, since It has 81 bars, 27 slots it would reqUire an equalIzer if It were duplex, or triplex wound (a > 2). If the duplex or trIplex wave windIng is utilIzed, It must not only satIsfy the crIterIa of equatIons (65) and (66) but must also fulfIll the addItIonal criteria of:
£ a = integer (67)
if an equalizer windIng IS not to be reqUIred.
4. Losses in Commutated Coils.
As the commutator segments pass under the brushes and the dIrection of current in the Calls connected to the segments short CIrcuited by the brush reverses,
-80-
•
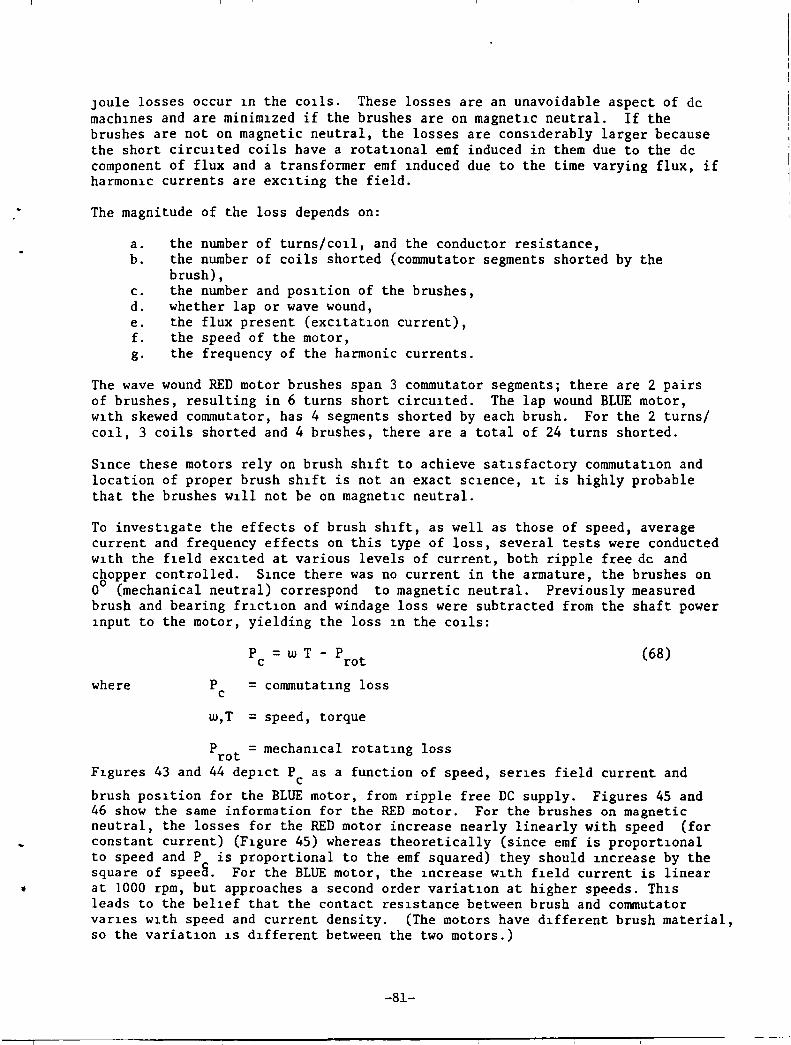
,
Joule losses occur 1n the cOlIs. These losses are an unavoidable aspect of de mach1nes and are minimIzed if the brushes are on magnetIc neutral. If the brushes are not on magnetic neutral, the losses are cons1derably larger because the short circu1ted coils have a rotat10nal emf induced in them due to the de component of flux and a transformer emf Induced due to the time varying flux, if harmon1C currents are exc1ting the field.
The magnitude of the loss depends on:
a. the number of turns/colI, and the conductor resistance, b. the number of coils shorted (commutator segments shorted by the
brush), c. the number and pos1tion of the brushes, d. whether lap or wave wound, e. the flux present (exc1tat10n current), f. the speed of the motor, g. the frequency of the harmonic currents.
The wave wound RED motor brushes span 3 commutator segments; there are 2 pairs of brushes, resulting in 6 turns short circu1ted. The lap wound BLUE motor, w1th skewed commutator, has 4 segments shorted by each brush. For the 2 turns/ cOlI, 3 coils shorted and 4 brushes, there are a total of 24 turns shorted.
SInce these motors rely on brush Shlft to achieve satlsfactory commutatlon and location of proper brush shlft is not an exact sClence, It is highly probable that the brushes wlil not be on magnet1c neutral.
To invest1gate the effects of brush Sh1ft, as well as those of speed, average current and frequency effects on this type of loss, several tests were conducted w1th the fleld exclted at various levels of current, both ripple free de and chopper controlled. Slnce there was no current in the armature, the brushes on 0
0 (mechanical neutral) correspond to magnetic neutral. Previously measured brush and bearing frlctlon and windage loss were subtracted from the shaft power 1nput to the motor, yielding the loss 1n the cOlIs:
where P c
P = w T - P c rot
= commutatlng loss
w,T = speed, torque
P rot = mechan1cal rotat1ng loss
(68)
F1gures 43 and 44 dep1ct P as a function of speed, ser1es field current and c brush pos1tion for the BLUE motor, from ripple free DC supply. Figures 45 and 46 show the same information for the RED motor. For the brushes on magnetic neutral, the losses for the RED motor increase nearly linearly with speed (for constant current) (F1gure 45) whereas theoretically (since emf is proportlonal to speed and P is proportional to the emf squared) they should Increase by the square of speea. For the BLUE motor, the 1ncrease w1th f1eld current is linear at 1000 rpm, but approaches a second order variatlon at higher speeds. ThIS leads to the bel1ef that the contact res1stance between brush and commutator var1es w1th speed and current density. (The motors have dlfferent brush material, so the variatlon 1S d1fferent between the two motors.)
-81-
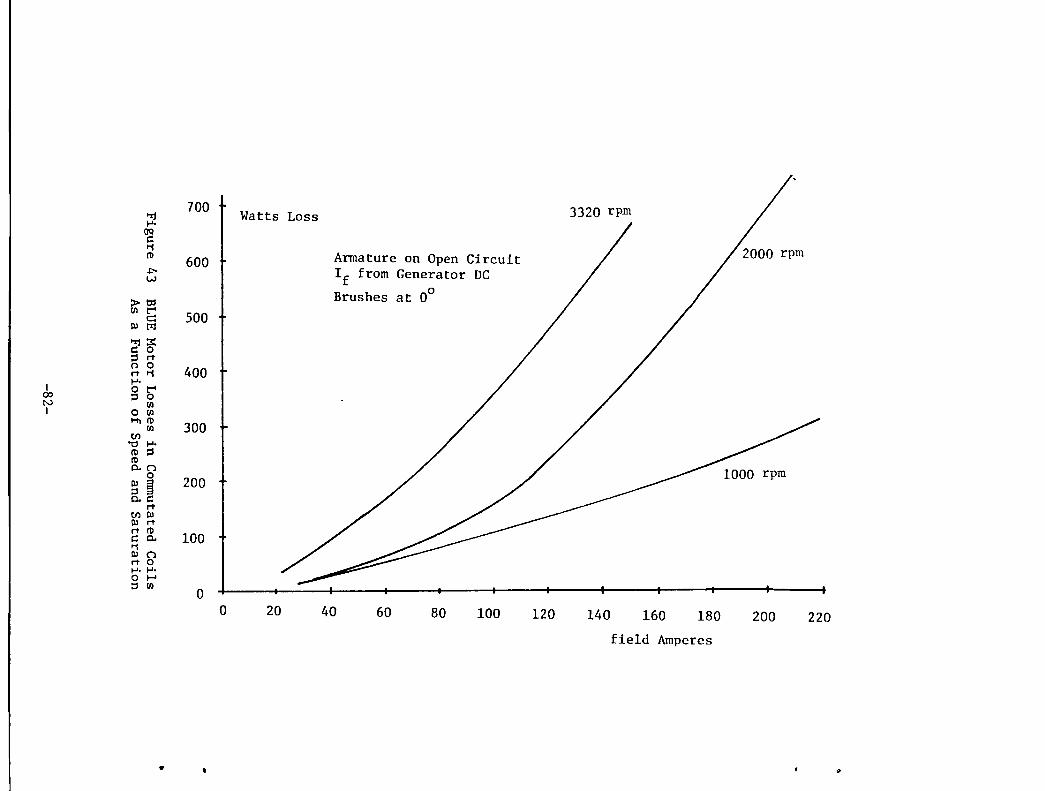
700 T Watts Loss 3320 rpm ~ ..... CJQ ~ t1
Armature on Open Circuit ro 600 t ""'" If from Generator DC w
>~ Brushes at 00
til t"" 500 c:
III tI:I
~3: ~ 0 =' rt n 0
400 rtt1 ..... I o t""
CXl ::l 0 N til I o til
!-tiro 300 til
til "'d ..... ro =' ro o.n
0 200 ~ §
o.~ rt
til III III rt rt ro
100 ~ 0. t1 III n rt 0 .......... o I-' =' til 0
0 20 40 60 80 100 120 140 160 180 200 220
field Amperes
• "
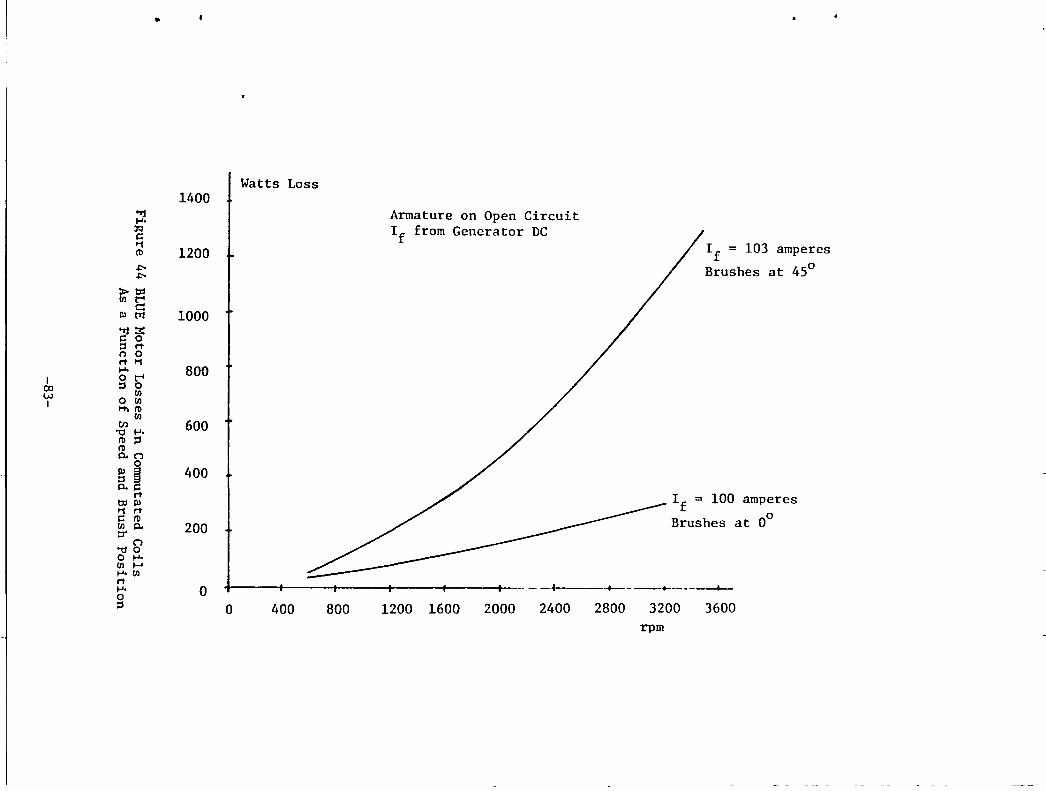
•
Watts Loss 1400
"Ij
~ Armature on Open Circuit I-'-
JQ If from Generator DC ~ P1 ~ If = 103 ampe:es In 1200 ~ ~ Brushes at 45
>b:l en t-< c:: Pol tr1 1000 "Ij:S:: ~ 0 =' rt n 0 rt P1 ~. 800
I o t-< 00 =' 0 VJ en I o en
Hlln en
en 600 "C1 ~.
In =' In 0.(')
0
§ ~ 400 p.~
rt
/ ____________ If = 100 amp~res tdPol P1 rt ~ In en 0. 200 Brushes at 0 ::r
(') "dO o ~. en I-' ~. en rt ~. 0 -+-----~------+--0 =' 0 400 800 1200 1600 2000 2400 2800 3200 3600
rpm
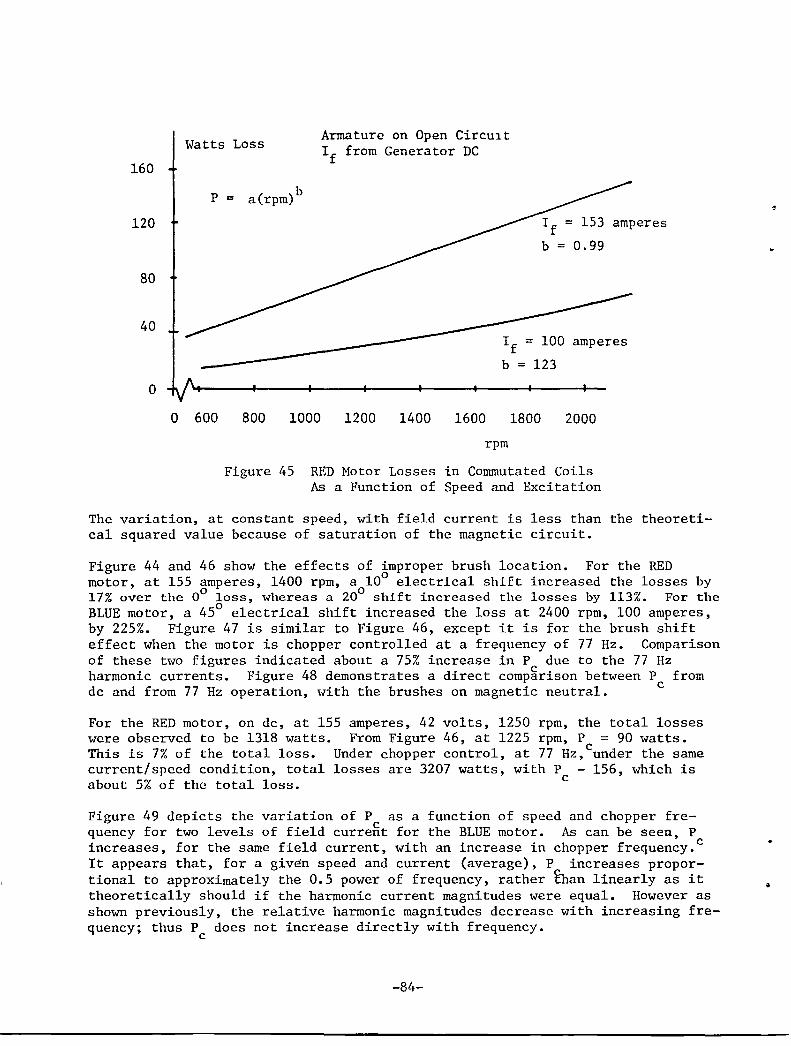
160
120
80
40
o
Watts Loss
p =
o 600
b a(rpm)
800 1000
Armature on Open Circu1t If from Generator DC
If = 153 amperes
b = 0.99
If = 100 amperes
b = 123
1200 1400 1600 1800 2000
rpm
Figure 45 RED Motor Losses in Commutated Coils As a Function of Speed and Excitation
The variation, at constant speed, with field current is less than the theoretical squared value because of saturation of the magnetic circuit.
Figure 44 and 46 show the effects of improper brush location. For the RED motor, at 155 amperes, 1400 rpm, a 100 electrical shift increased the losses by 17% over the 00 loss, whereas a 200 shift increased the losses by 113%. For the BLUE motor, a 450 electrical shift increased the loss at 2400 rpm, 100 amperes, by 225%. Figure 47 is similar to Figure 46, except it is for the brush shift effect when the motor is chopper controlled at a frequency of 77 Hz. Comparison of these two figures indicated about a 75% increase in P due to the 77 Hz harmonic currents. Figure 48 demonstrates a direct comp~rison between P from
c dc and from 77 Hz operation, with the brushes on magnetic neutral.
For the RED motor, on dc, at 155 amperes, 42 volts, 1250 rpm, the total losses were observed to be 1318 watts. From Figure 46, at 1225 rpm, P = 90 watts. This is 7% of the total loss. Under chopper control, at 77 Hz,cunder the same current/speed condition, total losses are 3207 watts, with P - 156, which is about 5% of the total loss. c
Figure 49 depicts the variation of P as a function of speed and chopper frequency for two levels of field curregt for the BLUE motor. As can be seen, P increases, for the same field current, with an increase in chopper frequency.c It appears that, for a given speed and current (average), P increases proportional to approximately the 0.5 power of frequency, rather ~han linearly as it theoretically should if the harmonic current magnitudes were equal. However as shown previously, the relative harmonic magnitudes decrease with increasing frequency; thus P does not increase directly with frequency.
c
-84-
•
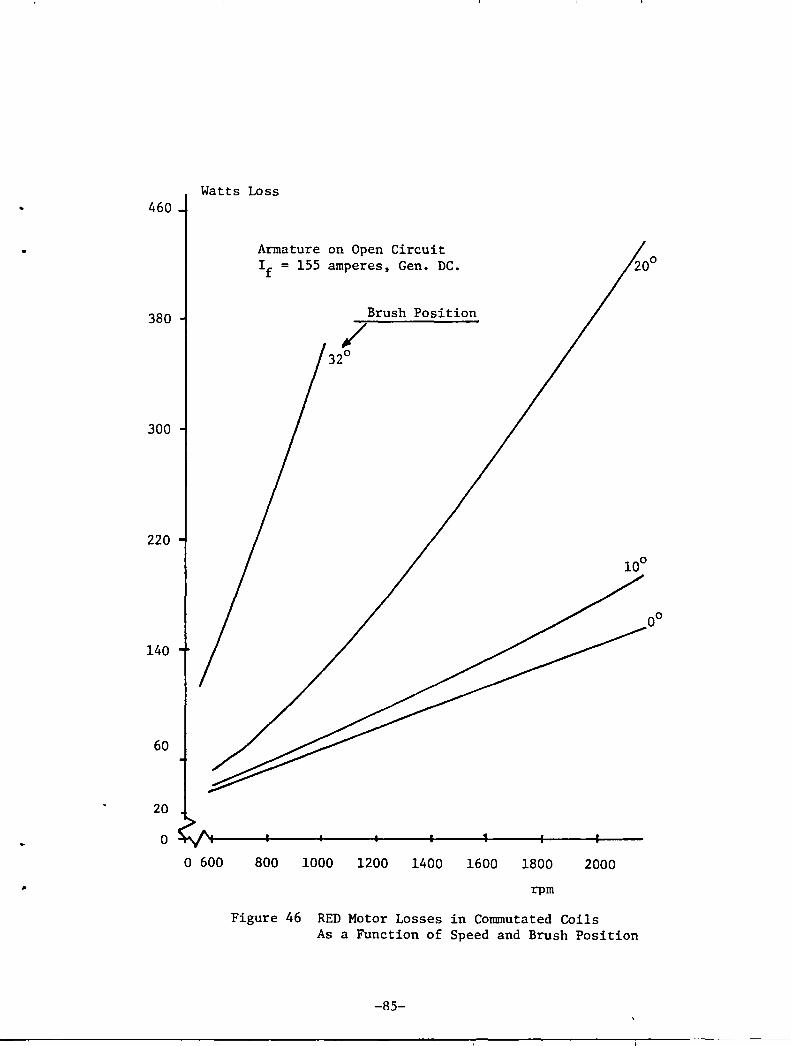
460
380
300
220
140
60
20
o
Watts Loss
o 600
Armature on Open Circuit If = 155 amperes, Gen. DC.
Brush Position
800 1000 1200 1400 1600 1800 2000
rpm
Figure 46 RED Motor Losses in Cornmutated Coils As a Function of Speed and Brush Position
-85-
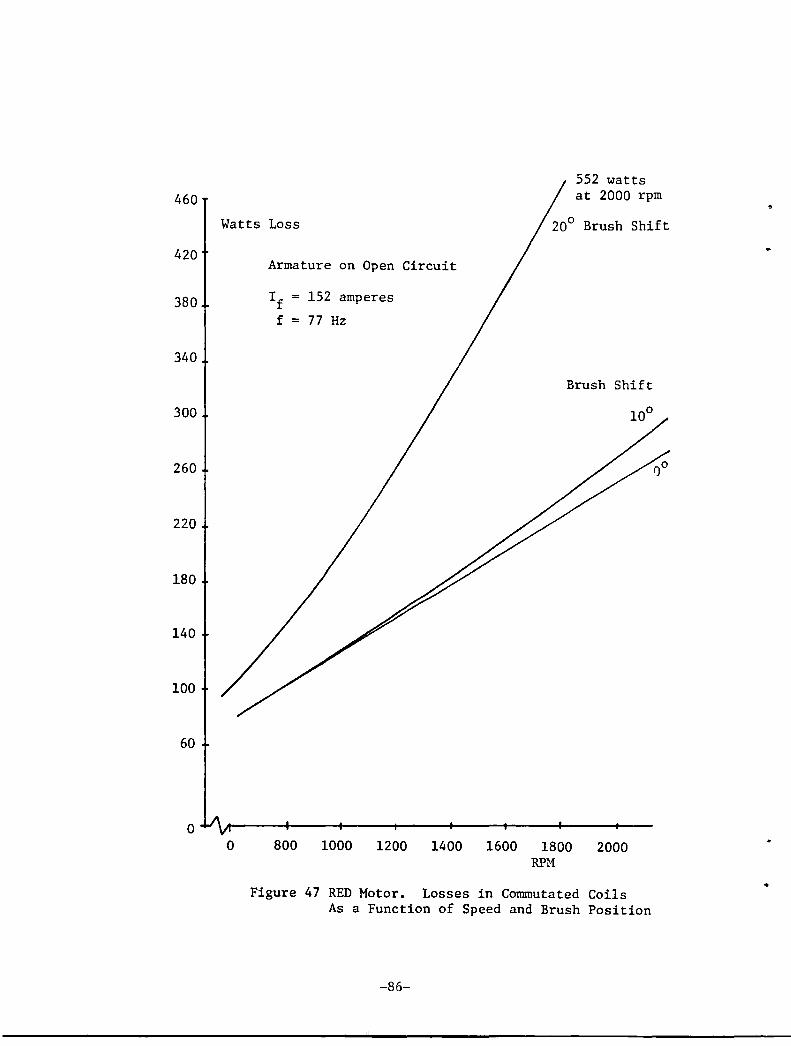
460
420
380
340
300
260
220
180
140
100
60
o
552 watts at 2000 rpm
Watts Loss 200 Brush Shift
o
Armature on Open Circuit
If 152 amperes
f = 77 Hz
800 1000 1200 1400
Brush Shift
1600 1800 RPM
2000
Figure 47 RED Motor. Losses in Commutated Coils As a Function of Speed and Brush Position
-86-
•
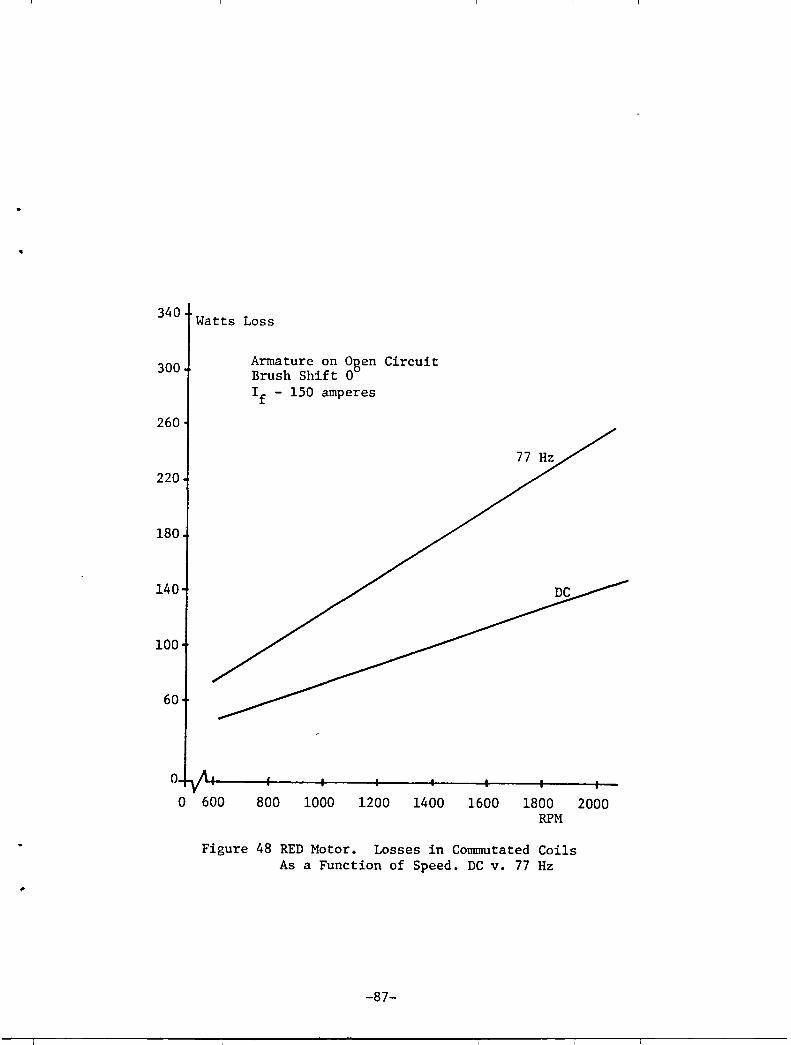
340 Watts Loss
300
260
220
180
140
100
60
o
Armature on Ogen Circuit Brush Shift 0 If - 150 amperes
o 600 800 1000 1200 1400 1600 1800 2000 RPM
Figure 48 RED Motor. Losses in Commutated Coils As a Function of Speed. DC v. 77 Hz
-87-
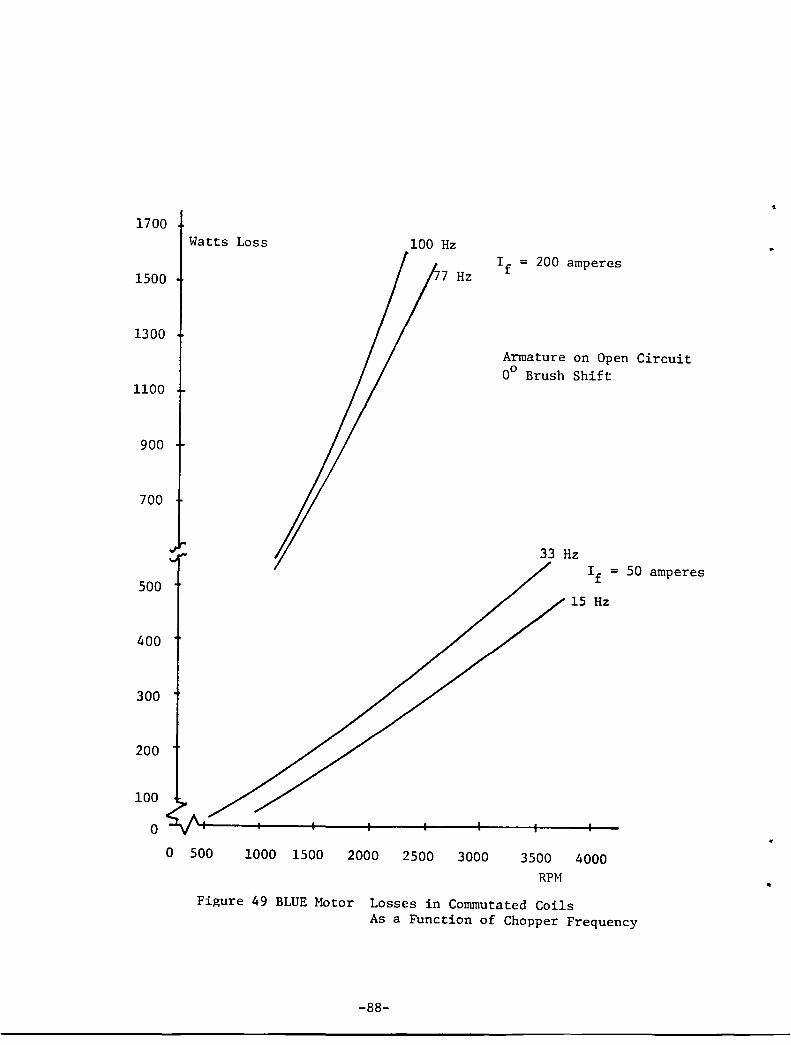
1700
1500
1300
1100
900
700
500
400
300
200
100
o
Watts Loss 100 Hz If = 200 amperes
Armature on Open Circuit 0
0 Brush Shift
33 Hz If = 50 amperes
15 Hz
o 500 1000 1500 2000 2500 3000 3500 4000 RPM
Figure 49 BLUE Motor Losses in Commutated Coils As a Function of Chopper Frequency
-88-
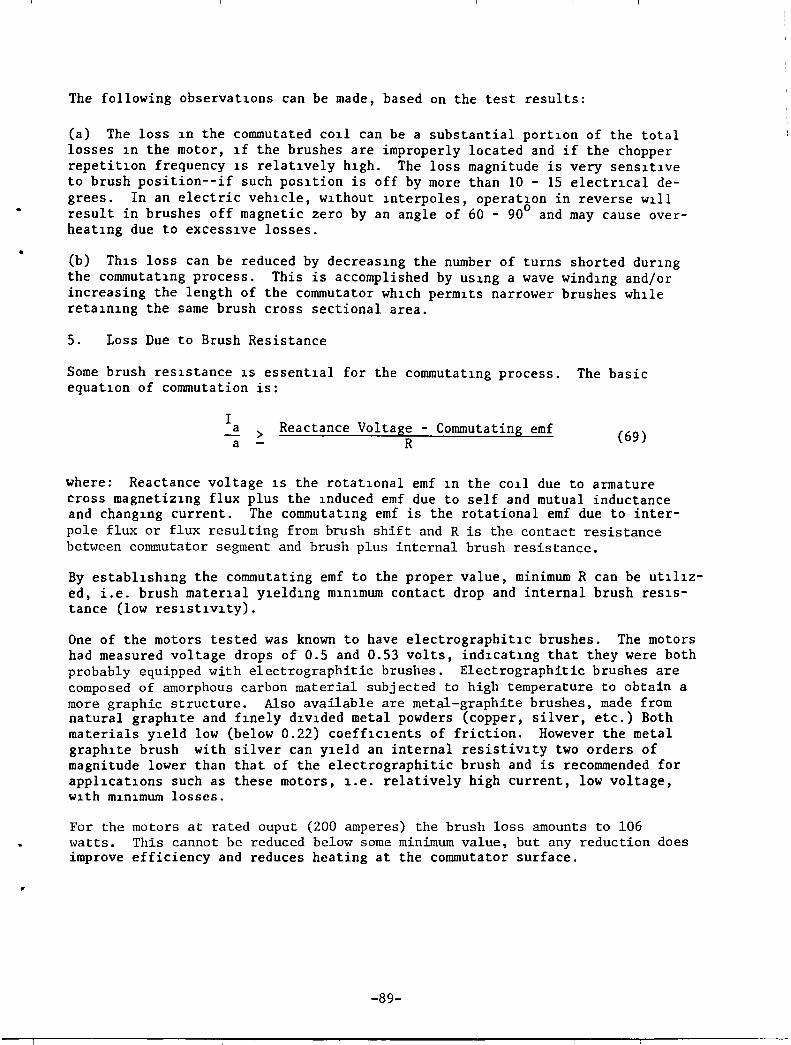
•
,
The following observatlons can be made, based on the test results:
(a) The loss In the commutated cOlI can be a substantial portlon of the total losses In the motor, If the brushes are improperly located and if the chopper repetitlon frequency IS relatlvely hlgh. The loss magnitude is very sensltlve to brush position--if such posltion is off by more than 10 - 15 electrlcal degrees. In an electric vehlcle, wlthout Interpoles, operatlon in reverse wll1 result in brushes off magnetic zero by an angle of 60 - 900 and may cause overheatlng due to exceSSlve losses .
(b) Thls loss can be reduced by decreaslng the number of turns shorted durlng the commutatlng process. This is accomplished by uSlng a wave windIng and/or increasing the length of the commutator whlch permlts narrower brushes whlle retalnlng the same brush cross sectional area.
5. Loss Due to Brush Resistance
Some brush reslstance IS essentlal for the commutatlng process. The basic equatlon of commutation is:
I a a > Reactance Voltage - Commutating emf
R (69)
where: Reactance voltage IS the rotatlonal emf In the cOlI due to armature cross magnetizlng flux plus the Induced emf due to self and mutual inductance and changlng current. The commutatlng emf is the rotational emf due to interpole flux or flux resulting from bnlsh shift and R is the contact resistance between commutator segment and brush plus internal brush resistance.
By establlshlng the commutating emf to the proper value, minimum R can be utl11Zed, i.e. brush materIal Yleldlng mInImum contact drop and internal brush reSIStance (low reslstlvlty).
One of the motors tested was known to have electrographitlc brushes. The motors had measured voltage drops of 0.5 and 0.53 volts, indlcatlng that they were both probably equipped with electrographitic brushes. Electrographitic brushes are composed of amorphous carbon material subjected to high temperature to obtain a more graphic structure. Also available are metal-graphite brushes, made from natural graphlte and fInely dlvlded metal powders (copper, silver, etc.) Both materials Yleld low (below 0.22) coefflclents of friction. However the metal graphlte brush with silver can Yleld an internal resistivlty two orders of magnitUde lower than that of the electrographitic brush and is recommended for appllcatlons such as these motors, I.e. relatively high current, low voltage, WIth mInImum losses.
For the motors at rated ouput (200 amperes) the brush loss amounts to 106 watts. This cannot be reduced below some minimum value, but any reduction does improve efficiency and reduces heating at the commutator surface.
-89-
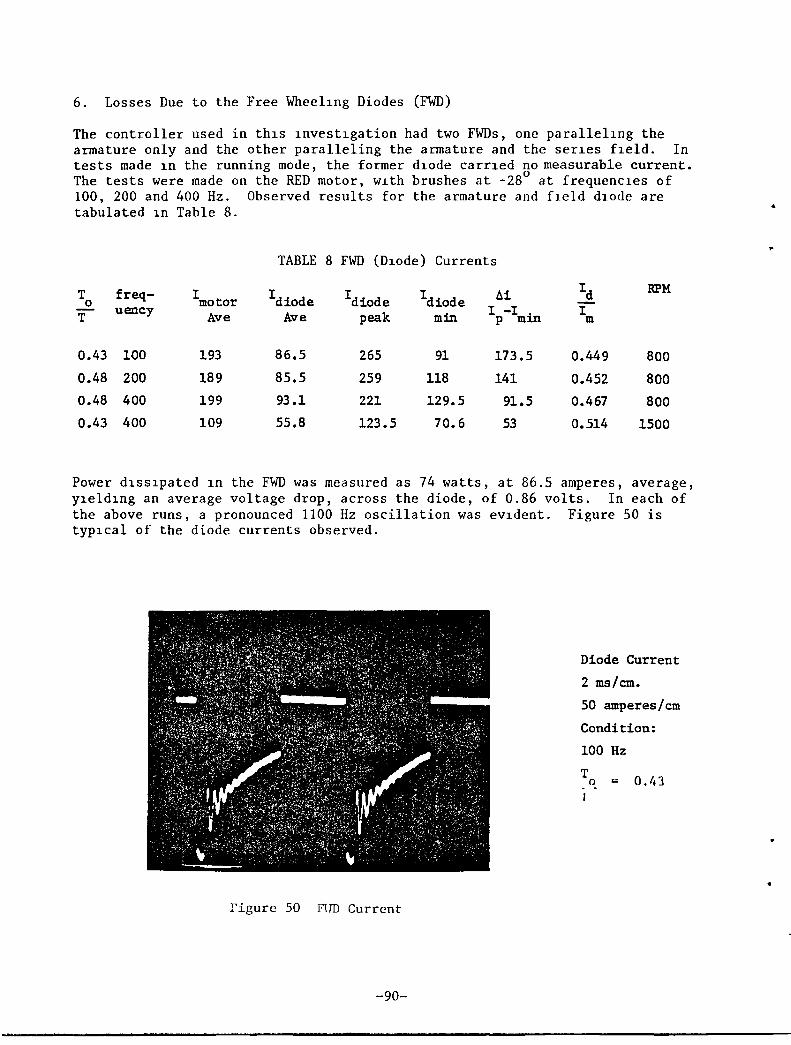
6. Losses Due to the Free Whee11ng Diodes (FWD)
The controller used in th1s 1nvest1gation had two FWDs, one parallehng the armature only and the other paralleling the armature and the serIes f1eld. In tests made 1n the running mode, the former d10de carr1ed no measurable current.
o The tests were made on the RED motor, w1th brushes at -28 at frequenc1es of 100, 200 and 400 Hz. Observed results for the armature and fIeld d100e are tabulated 1n Table 8.
TABLE 8 FWD (D10de) Currents
T freq- I I I Idiode b.i Id RPM 0 motor diode diode
T ueney Ave Ave peak min I -I I
P min m
0.43 100 193 86.5 265 91 173.5 0.449 800
0.48 200 189 85.5 259 118 141 0.452 800
0.48 400 199 93.1 221 129.5 91.5 0.467 800
0.43 400 109 55.8 123.5 70.6 53 0.514 1500
Power d1ss1pated 1n the FWD was measured as 74 watts, at 86.5 amperes, average, Y1eld1ng an average voltage drop, across the diode, of 0.86 volts. In each of the above runs, a pronounced 1100 Hz oscillation was eV1dent. Figure 50 is tYP1cal of the diode currents observed.
rigure 50 8m Current
-90-
Diode Current
2 ms/em.
50 amperes/em
Condition:
100 Hz
T o .. 0.1.3
•
The only use of the armature-only FWD is in the event power plugging is to be Used for braking or in the event the car started rolling backward when connected for forward operation.
7. Losses Due to Shaft, Bearing, Housing Current From Shaft Induced Emf.
An emf can be induced in the motor shaft because of an unsymmetrical distribution of flux between the poles, which results in a net flux encircling the shaft and/or capacitive coupling between windings and the magnetic core in conjunction
• with current harmonics. Large machines with pedestal type bearings usually have one pedestal insulated from the machine base to preclude the damaging effects to the bearing surface that result if such currents exist. Small machines generally do not experience this problem. However, in the course of this investigation it was felt that it would be desirable to quantitatively examine the magnitude of the parameters to determine if a significant loss was present due to the phenomena.
The BLUE motor, with non-symmetrical pole geometry, was the motor tested. This motor has a laminated magnetic frame clamped between aluminum end bells. The bearing at the end opposite the commutator was replaced by a thinner, smaller diameter bearl.ng surrounded by an insulating material, thereby "opening" the closed conducting path formed by armature, shaft, bearings and frame (housing). An electrical connection was then made between the frame and shaft (via a slip ring) across the insulated spaces between bearing and housing. A Kelvin Bridge measurement indicated 0.760 ohms resistance existing between the two points. (The contact resistance between laminations probably accounts for this relatively high value of ohmic resistance).
The motor, with armature circuit open and no excitation, was then driven over the speed range from 500 to 1650 rpm with no field excitation. The dc voltage measured (with a high input impedance electronic digital voltmeter) ranged from 1.0 mv to 2.3 mv. A true rms voltmeter indicated from 215 mv at 500 rpm up to 650 mv at 1650 rpm. Background noise, i.e., at zero speed, was measured at 0.05 and 7.5 mv, respectively.
At 1650 rpm, with ripple free dc current applied to the series field (over the range 52 amperes up to 187 amperes), the dc volts fluctuated from 1-5 mv, the true rms voltage from 700 to 820 mv. The test was then repeated using a 100 Hz repetition rate chopper current for field excitation. No apparent difference in induced voltage magnitude between chopper current and ripple free dc voltage was noted. It was concluded that even in a motor with unsymmetric pole structure this type of loss is negligible and should not be of concern from an efficiency standpoint.
Iron Hysteresis Losses
8. In the Magnetic Structure Due to Chopper Harmonics
The series field current contains harmonics due to chopper control. The harmonics do provide excitation resulting in harmonic flux which does result in core loss (hysteresis and eddy current). This loss cannot be calculated with any degree of accuracy but overall magnitude can be estimated.
-91-
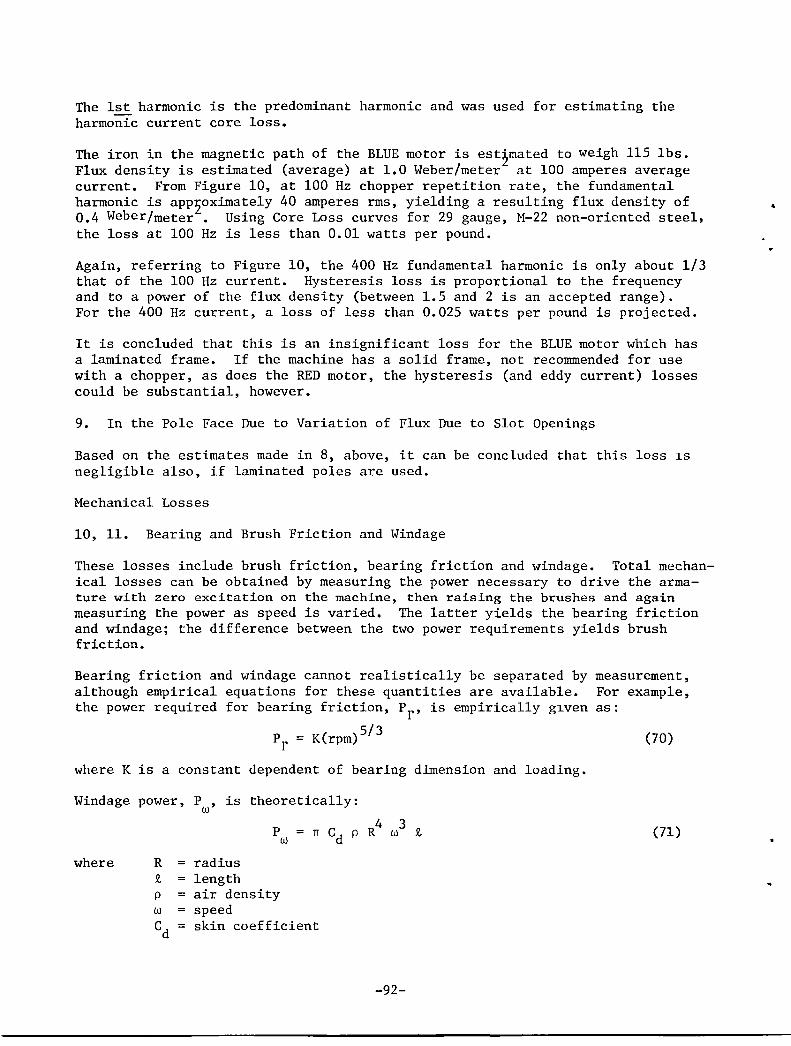
The 1st harmonic is the predominant harmonic and was used for estimating the harmonic current core loss.
The iron in the magnetic path of the BLUE motor is est~mated to weigh 115 lbs. Flux density is estimated (average) at 1.0 Weber/meter at 100 amperes average current. From Figure 10, at 100 Hz chopper repetition rate, the fundamental harmonic is appzoximately 40 amperes rms, yielding a resulting flux density of 0.4 Weber/meter. Using Core Loss curves for 29 gauge, M-22 non-oriented steel, the loss at 100 Hz is less than 0.01 watts per pound.
Again, referring to Figure 10, the 400 Hz fundamental harmonic is only about 1/3 that of the 100 Hz current. Hysteresis loss is proportional to the frequency and to a power of the flux density (between 1.5 and 2 is an accepted range). For the 400 Hz current, a loss of less than 0.025 watts per pound is projected.
It is concluded that this is an insignificant loss for the BLUE motor which has a laminated frame. If the machine has a solid frame, not recommended for use with a chopper, as does the RED motor, the hysteresis (and eddy current) losses could be substantial, however.
9. In the Pole Face Due to Variation of Flux Due to Slot Openings
Based on the estimates made in 8, above, it can be concluded that this loss 1S
negligible also, if laminated poles are used.
Mechanical Losses
10, 11. Bearing and Brush Friction and Windage
These losses include brush friction, bearing friction and windage. Total mechanical losses can be obtained by measuring the power necessary to drive the armature with zero excitation on the machine, then raising the brushes and again measuring the power as speed is varied. The latter yields the bearing friction and windage; the difference between the two power requirements yields brush friction.
Bearing friction and windage cannot realistically be separated by although empirical equations for these quantities are available. the power required for bearing friction, Pr , is empirically glven
5/3 Pr = K(rpm)
where K is a constant dependent of bearing dimension and loading.
Windage power, P , is theoretically: w
P C R4 w3 0 w = n d P N
where R radius !l. length p air density w = speed
Cd skin coefficient
-92-
measurement, For example, as:
(70)
(71)
•
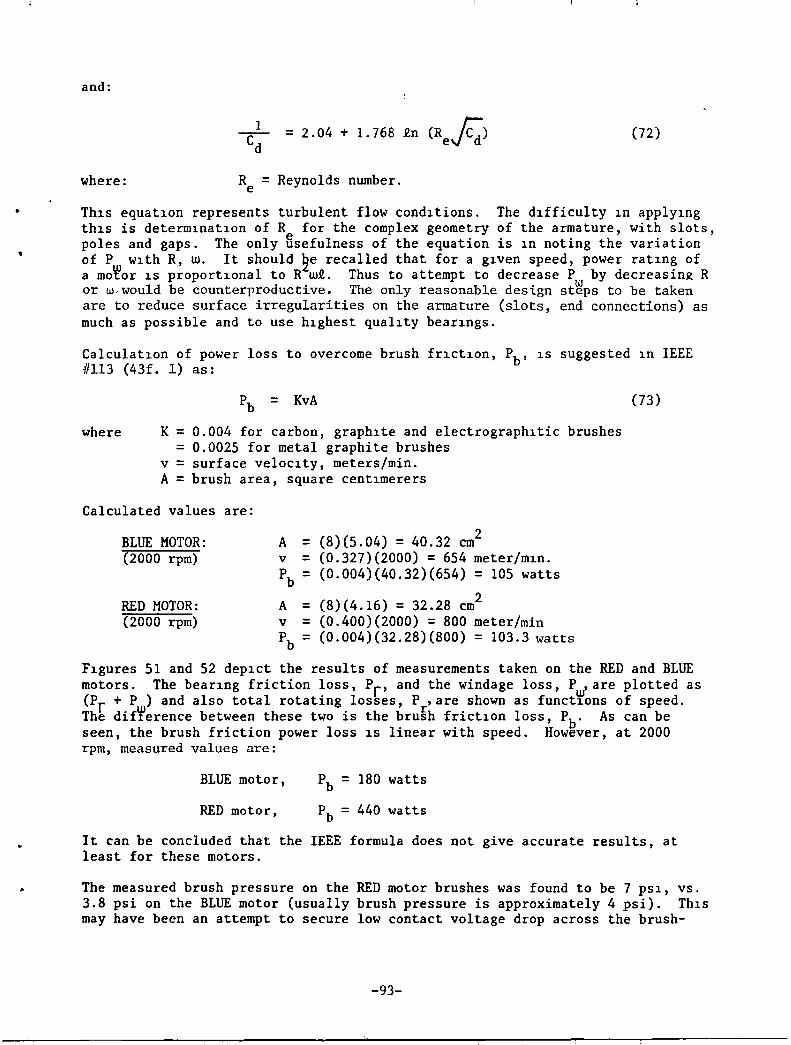
•
and:
where:
1
~ = 2.04 + 1.768 in (Re~)
R = Reynolds number. e
(72)
Thls equatlon represents turbulent flow condltions. The dlfficulty ln applYlng thlS is determlnatlon of R for the complex geometry of the armature, with slots, poles and gaps. The only Usefulness of the equation is 1n noting the variation of P wlth R, w. It should 2e recalled that for a glven speed, power ratlng of a mo~or 1S proport10nal to R wi. Thus to attempt to decrease P by decreasinR R or w,wou1d be counterproductive. The only reasonable design st~ps to be taken are to reduce surface irregularities on the armature (slots, end connections) as much as possible and to use h1ghest qual1ty bear1ngs.
Calculat10n of power loss to overcome brush fr1ct1on, Pb , 1S suggested 1n IEEE #113 (43f. 1) as:
where K = =
v = A =
Pb = KvA
0.004 for carbon, graph1te and electrograph1tic brushes 0.0025 for metal graphite brushes surface veloc1ty, meters/min. brush area, square cent1merers
Calculated values are:
BLUE MOTOR: A (8)(5.04) = 40.32 cm 2 = (2000 rpm) v = (0.327)(2000) = 654 meter/m1n.
Pb = (0.004)(40.32)(654) = 105 watts
RED MOTOR: A (8)(4.16) = 32.28 cm 2 = (2000 rpm) v = (0.400)(2000) = 800 meter/min
Pb = (0.004)(32.28)(800) = 103.3 watts
(73)
Flgures 51 and 52 dep1ct the results of measurements taken on the RED and BLUE motors. The bear1ng friction loss, Pr , and the windage loss, P~are plotted as (Pr + P ) and also total rotating losses, P ,are shown as funct10ns of speed. The dif~erence between these two is the bru§h frict10n loss, Pb . As can be seen, the brush friction power loss 1S linear with speed. However, at 2000 rpm, measured values are:
BLUE motor,
RED motor,
Pb = 180 watts
Pb = 440 watts
It can be concluded that the IEEE formula does not give accurate results, at least for these motors.
The measured brush pressure on the RED motor brushes was found to be 7 PS1, vs. 3.8 psi on the BLUE motor (usually brush pressure is approximately 4 psi). Th1s may have been an attempt to secure low contact voltage drop across the brush-
-93-
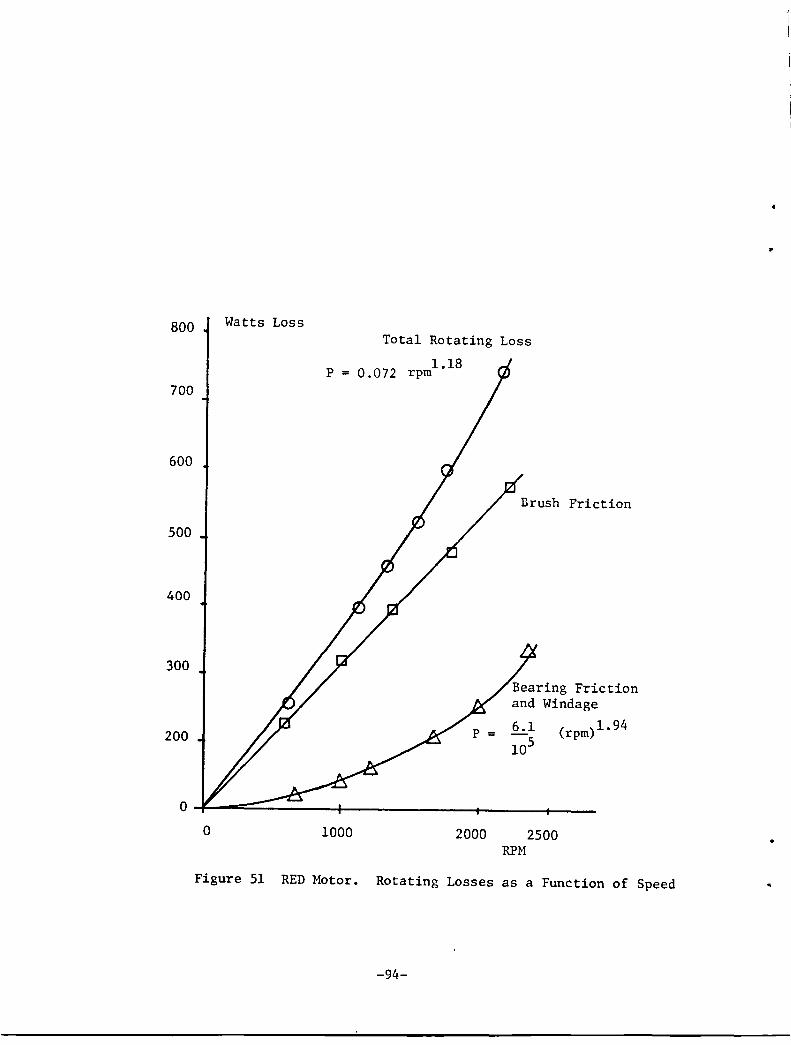
800
700
600
500
400
300
200
Watts Loss Total Rotating Loss
1.18 p = a .072 rpm
Brush Friction
Bearing Friction and Windage
6.1 ( )1. 94 - rpm 105
o ~---=~-------4--------------~ ______ ~ __ __ o 1000 2000 2500
RPM
Figure 51 RED Motor. Rotating Losses as a Function of Speed
-94-
•
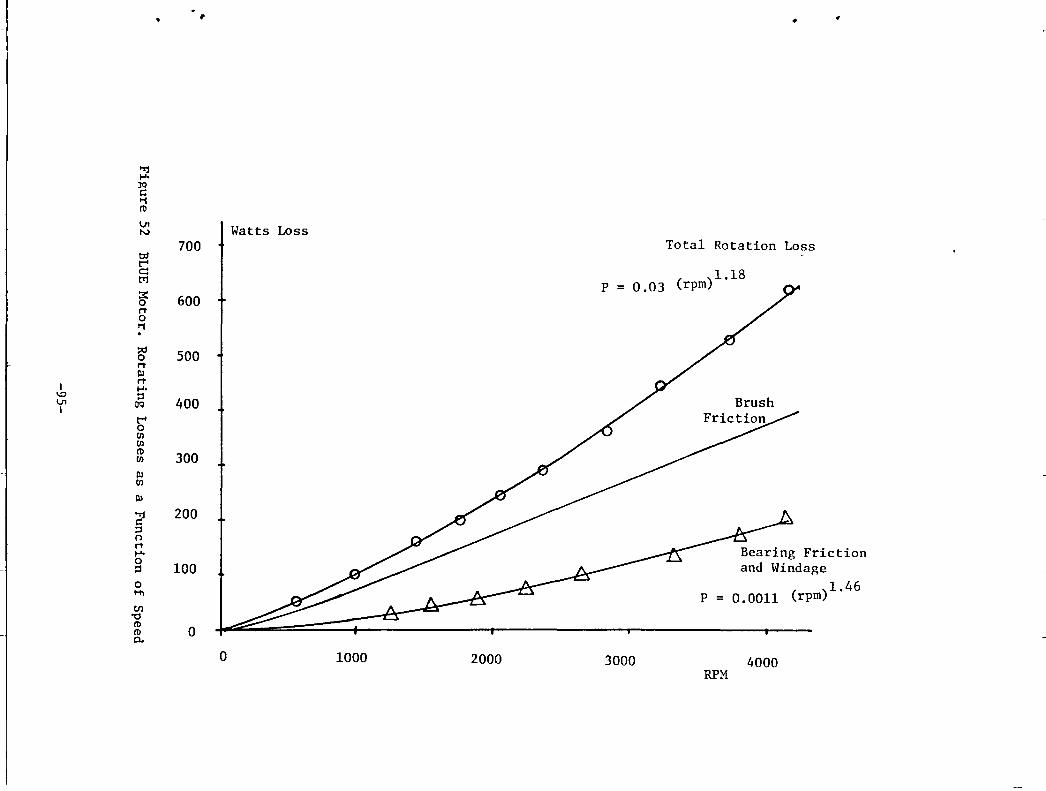
r •
"!j 1-" )Q c:: t1 ro Vt ! Watts Loss N
700 Total Rotation Loss b;I t""'
( )1.18 c: trl P = 0.03 rpm :3: 600 0 M' 0 t1 . ::d 500 0 M' III
I M' 1-"
\.0 =' Vt OQ 400 I t""' 0 en en ro 300 en III en III
~ 200 =' n M'
t Bearing Friction 1-"
0 100 and Windage ='
0 ( )1.46 Hl P = 0.0011 rpm en "0 ro
0 ro 0..
0 1000 2000 3000 4000 RPM
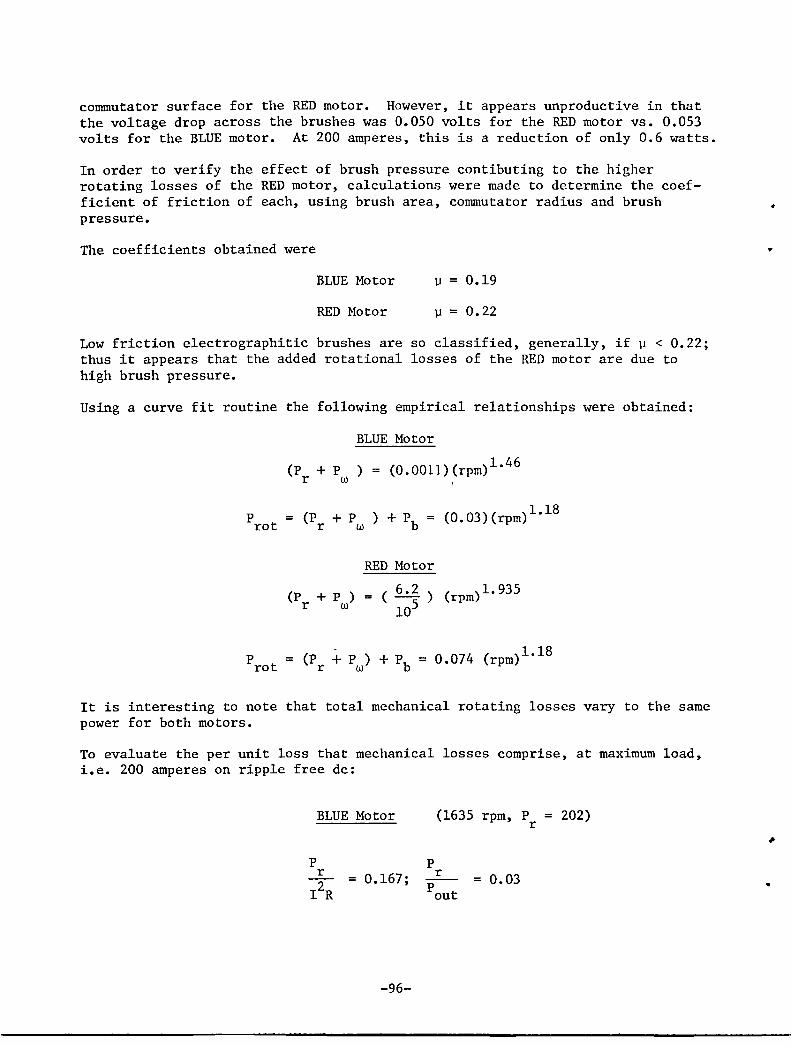
commutator surface for the RED motor. However, it appears unproductive in that the voltage drop across the brushes was 0.050 volts for the RED motor vs. 0.053 volts for the BLUE motor. At 200 amperes, this is a reduction of only 0.6 watts.
In order to verify the effect of brush pressure contibuting to the higher rotating losses of the RED motor, calculations were made to determine the coefficient of friction of each, using brush area, commutator radius and brush pressure.
The coefficients obtained were
BLUE Motor 0.19
RED Motor ~ = 0.22
Low friction e1ectrographitic brushes are so classified, generally, if ~ < 0.22; thus it appears that the added rotational losses of the RED motor are due to high brush pressure.
Using a curve fit routine the following empirical relationships were obtained:
BLUE Motor
(P + P ) = (0.0011)(rpm)1.46 r w
P = (p + P ) + Pb
= (0.03)(rpm)1.18 rot r w
(P + P ) r w
RED Motor
( 6.2 ) (rpm)1.935 105
It is interesting to note that total mechanical rotating losses vary to the same power for both motors.
To evaluate the per unit loss that mechanical losses comprise, at maximum load, i.e. 200 amperes on ripple free dc:
BLUE Motor
P r --- = 0.167;
I2R
-96-
(1635 rpm, P = 202) r
P r
P out 0.03
•
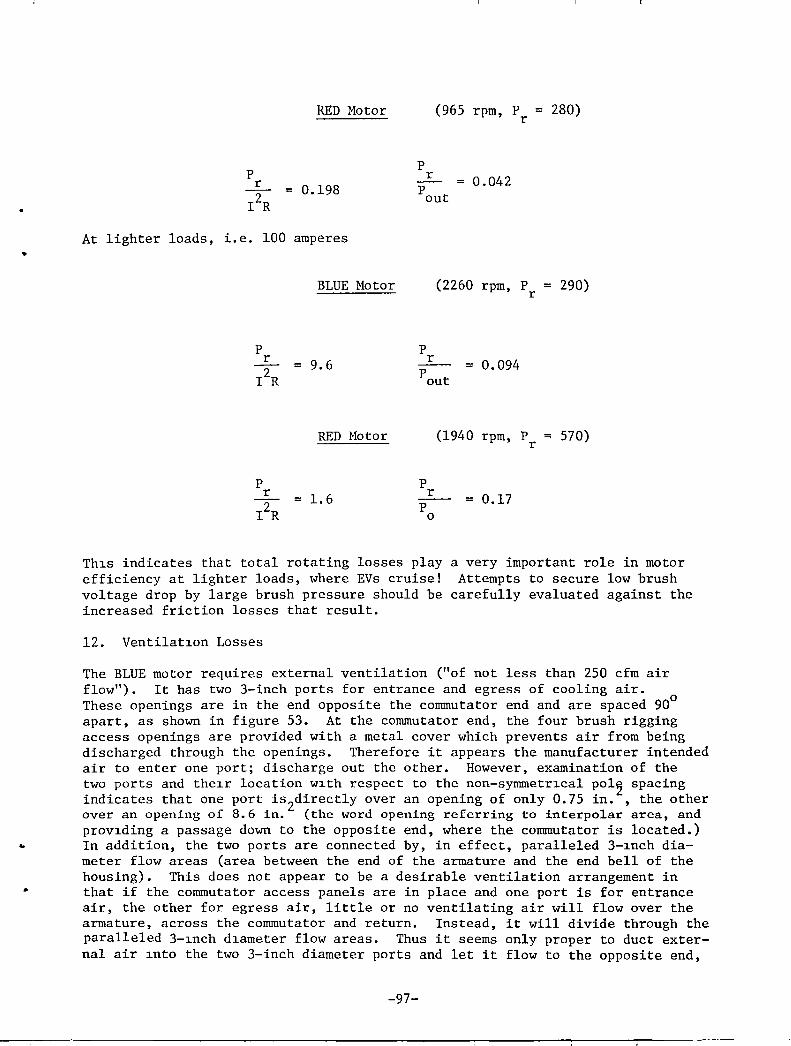
RED Motor
p r 0.198
I2R
At lighter loads, i.e. 100 amperes
BLUE Motor
9.6
RED Motor
1.6
(965 rpm, p
p r 0.042 p out
(2260 rpm,
p r
p out
0.094
r
p r
(1940 rpm, P r
P r
P o
0.17
280)
= 290)
570)
ThlS indicates that total rotating losses play efficiency at lighter loads, where EVs cruise! voltage drop by large brush pressure should be increased friction losses that result.
a very important role in motor Attempts to secure low brush
carefully evaluated against the
12. Ventilatlon Losses
The BLUE motor requires external ventilation ("of not less than 250 cfm air flow"). It has two 3-inch ports for entrance and egress of cooling air. These openings are in the end opposite the commutator end and are spaced 900
apart, as shown in figure 53. At the commutator end, the four brush rigging access openings are provided with a metal cover which prevents air from being discharged through the openings. Therefore it appears the manufacturer intended air to enter one port; discharge out the other. However, examination of the two ports and thelr location wlth respect to the non-symmetrlcal polZ spacing indicates that one port is2directly over an opening of only 0.75 in. , the other over an opening of 8.6 in. (the word opening referring to interpolar area, and provlding a passage down to the opposite end, where the commutator is located.)
~ In addition, the two ports are connected by, in effect, paralleled 3-lnch diameter flow areas (area between the end of the armature and the end bell of the housing). This does not appear to be a desirable ventilation arrangement in that if the commutator access panels are in place and one port is for entrance air, the other for egress air, little or no ventilating air will flow over the armature, across the commutator and return. Instead, it will divide through the paralleled 3-lnch dlameter flow areas. Thus it seems only proper to duct external air lnto the two 3-inch diameter ports and let it flow to the opposite end,
-97-
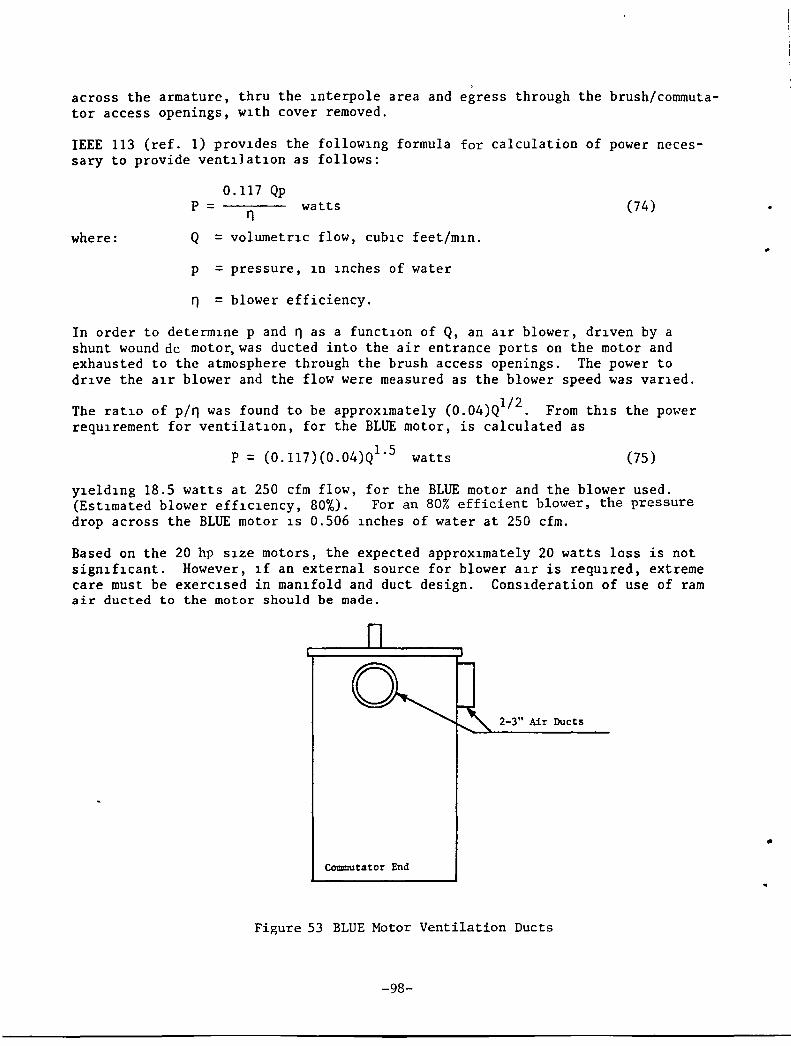
across the armature, thru the 1nterpole area and egress through the brush/commutator access openings, w1th cover removed.
IEEE 113 (ref. 1) prov1des the follow1ng formula for calculation of power necessary to provide vent1Jat10n as follows:
0.117 Qp p = fl
watts (74)
where: Q = volurnetr1c flow, cub1c feet/m1n.
p = pressure, 1n 1nches of water
11 = blower efficiency.
In order to determ1ne p and fl as a funct10n of Q, an a1r blower, dr1ven by a shunt wound dc moto~was ducted into the air entrance ports on the motor and exhausted to the atmosphere through the brush access openings. The power to dr1ve the a1r blower and the flow were measured as the blower speed was var1ed.
The rat10 of P/fl was found to be approx1mately (0.04)Q1/2. From th1s the power requ1rement for ventilat10n, for the BLUE motor, is calculated as
P = (O.117)(O.04)Ql.5 watts (75)
Y1eld1ng 18.5 watts at 250 cfm flow, for the BLUE motor and the blower used. (Est1mated blower eff1c1ency, 80%). For an 80% efficient blower, the pressure drop across the BLUE motor 1S 0.506 1nches of water at 250 cfm.
Based on the 20 hp S1ze motors, the expected approx1mately 20 watts loss is not sign1f1cant. However, 1f an external source for blower a1r is requ1red, extreme care must be exerc1sed in man1fold and duct design. Cons1deration of use of ram air ducted to the motor should be made.
2-3" Air Ducts
Commutator End
Figure 53 BLUE Motor Ventilation Ducts
-98-
•
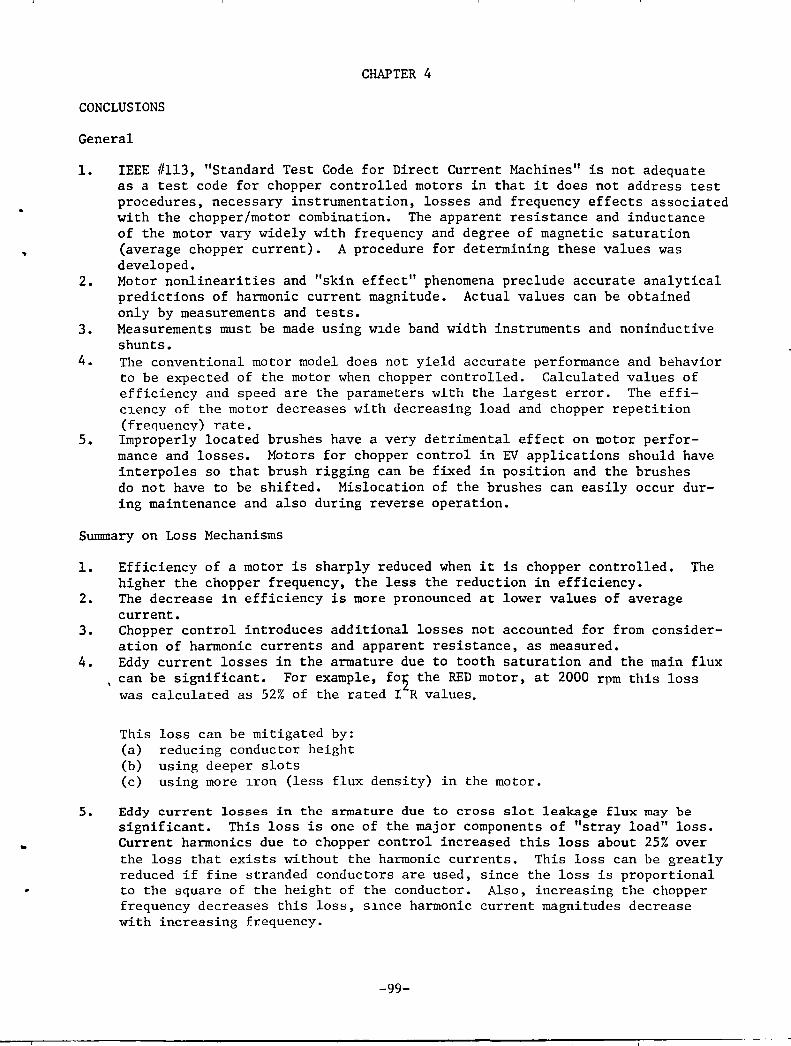
-
CHAPTER 4
CONCLUSIONS
General
1.
2.
3.
IEEE #113, "Standard Test Code for Direct Current Machines" is not adequate as a test code for chopper controlled motors in that it does not address test procedures, necessary instrumentation, losses and frequency effects associated with the chopper/motor combination. The apparent resistance and inductance of the motor vary widely with frequency and degree of magnetic saturation (average chopper current). A procedure for determining these values was developed. Motor nonlinearities and "skin effect" phenomena preclude accurate analytical predictions of harmonic current magnitude. Actual values can be obtained only by measurements and tests. Measurements must be made using wlde band width instruments and noninductive shunts.
4. The conventional motor model does not yield accurate performance and behavior to be expected of the motor when chopper controlled. Calculated values of efficiency and speed are the parameters with the largest error. The efficlency of the motor decreases with decreasing load and chopper repetition (fre~uencv) rate.
S. Improperly located brushes have a very detrimental effect on motor performance and losses. Motors for chopper control in EV applications should have interpoles so that brush rigging can be fixed in position and the brushes do not have to be shifted. Mislocation of the brushes can easily occur dur-ing maintenance and also during reverse operation.
Summary on Loss Mechanisms
1. Efficiency of a motor is sharply reduced when it is chopper controlled. The higher the chopper frequency, the less the reduction in efficiency.
2. The decrease in efficiency is more pronounced at lower values of average current.
3. Chopper control introduces additional losses not accounted for from consideration of harmonic currents and apparent resistance, as measured.
4. Eddy current losses in the armature due to tooth saturation and the main flux , can be significant. For example, f02 the RED motor, at 2000 rpm this loss
was calculated as 52% of the rated I R values.
5.
This (a) (b) (c)
loss can be mitigated by: reducing conductor height using deeper slots using more lron (less flux density) in the motor.
Eddy current losses in the armature due to cross slot leakage flux may be significant. This loss is one of the major components of "stray load" loss. Current harmonics due to chopper control increased this loss about 25% over the loss that exists without the harmonic currents. This loss can be greatly reduced if fine stranded conductors are used, since the loss is proportional to the square of the height of the conductor. Also, increasing the chopper frequency decreases this loss, Slnce harmonic current magnitudes decrease with increasing frequency.
-99-
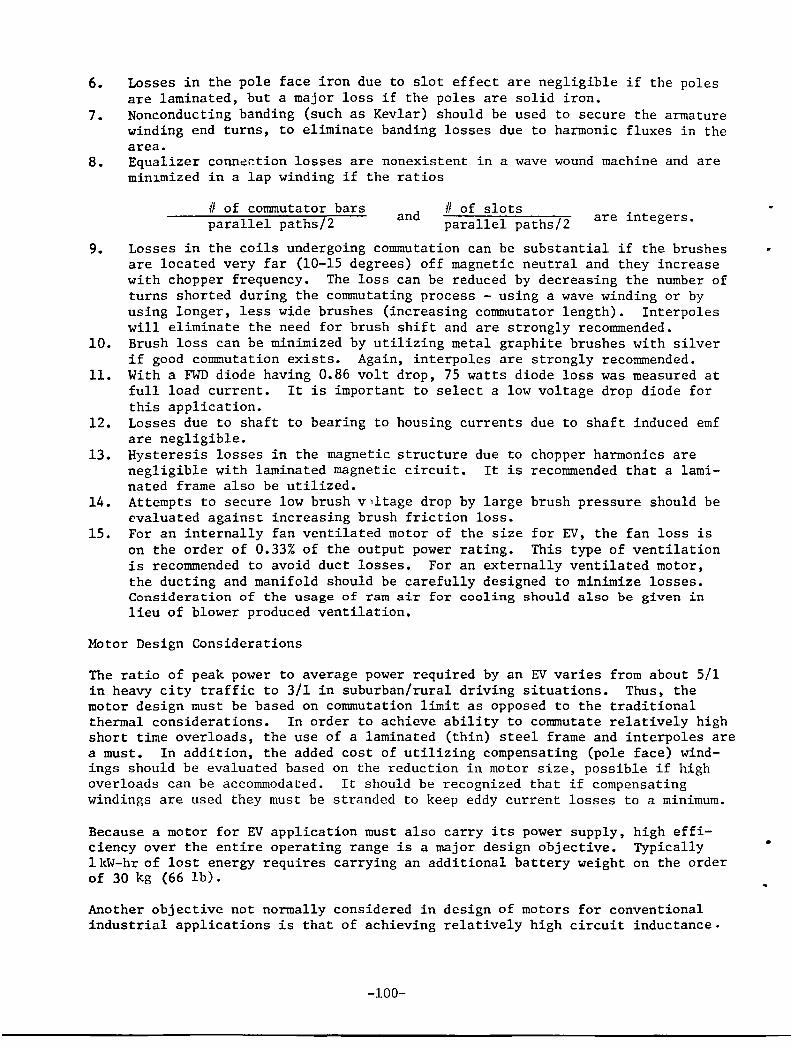
6. Losses in the pole face iron due to slot effect are negligible if the poles are laminated, but a major loss if the poles are solid iron.
7. Nonconducting banding (such as Kev1ar) should be used to secure the armature winding end turns, to eliminate banding losses due to harmonic fluxes in the area.
8. Equalizer conn~ction losses are nonexistent in a wave wound machine and are min~mized in a lap winding if the ratios
# of commutator bars and # of slots are integers. parallel paths/2 parallel paths/2
9. Losses in the coils undergoing commutation can be substantial if the brushes are located very far (10-15 degrees) off magnetic neutral and they increase with chopper frequency. The loss can be reduced by decreasing the number of turns shorted during the commutating process - using a wave winding or by using longer, less wide brushes (increasing commutator length). Interpoles will eliminate the need for brush shift and are strongly recommended.
10. Brush loss can be minimized by utilizing metal graphite brushes with silver if good commutation exists. Again, interpo1es are strongly recommended.
11. With a FWD diode having 0.86 volt drop, 75 watts diode loss was measured at full load current. It is important to select a low voltage drop diode for this application.
12. Losses due to shaft to bearing to housing currents due to shaft induced emf are negligible.
13. Hysteresis losses in the magnetic structure due to chopper harmonics are negligible with laminated magnetic circuit. It is recommended that a laminated frame also be utilized.
14. Attempts to secure low brush v1ltage drop by large brush pressure should be ~va1uated against increasing brush friction loss.
15. For an internally fan ventilated motor of the size for EV, the fan loss is on the order of 0.33% of the output power rating. This type of ventilation is recommended to avoid duct losses. For an externally ventilated motor, the ducting and manifold should be carefully designed to minimize losses. Consideration of the usage of ram air for cooling should also be given in lieu of blower produced ventilation.
Motor Design Considerations
The ratio of peak power to average power required by an EV varies from about 5/1 in heavy city traffic to 3/1 in suburban/rural driving situations. Thus, the motor design must be based on commutation limit as opposed to the traditional thermal considerations. In order to achieve ability to commutate relatively high short time overloads, the use of a laminated (thin) steel frame and interpoles are a must. In addition, the added cost of utilizing compensating (pole face) windings should be evaluated based on the reduction in motor size, possible if high overloads can be accommodated. It should be recognized that if compensating windings are used they must be stranded to keep eddy current losses to a minimum.
Because a motor for EV application must also carry its power supply, ciency over the entire operating range is a major design objective. 1kW-hr of lost energy requires carrying an additional battery weight of 30 kg (66lb).
high effiTypically on the order
Another objective not normally considered in design of motors for conventional industrial applications is that of achieving relatively high circuit inductance.
-100-
•
Increasing inductance tends to suppress harmonic current magnitudes, thus increasing the efficiency. In addition, it tends to minimize chopper-motor interface problems in that it decreases the rate of rise of chopper current each cycle. The high inductance should be concentrated in the field circuit to minimize reactance voltage during commutation.
Because of the unavoidable electrical leakage paths that will develop in an EV environment, the electrical system voltage levels will probably be established at between 96 and 120 volts, which means a rather heavy current requirement for motors in the 15-30 kw power range. In general, system voltage level does not appreciably affect the weight of the motor. However, this voltage range does not indicate a clear choice of the use of a lap or wave winding. Yet a wave winding appears to offer advantages in that it does not need an equalizer winding.
-101-
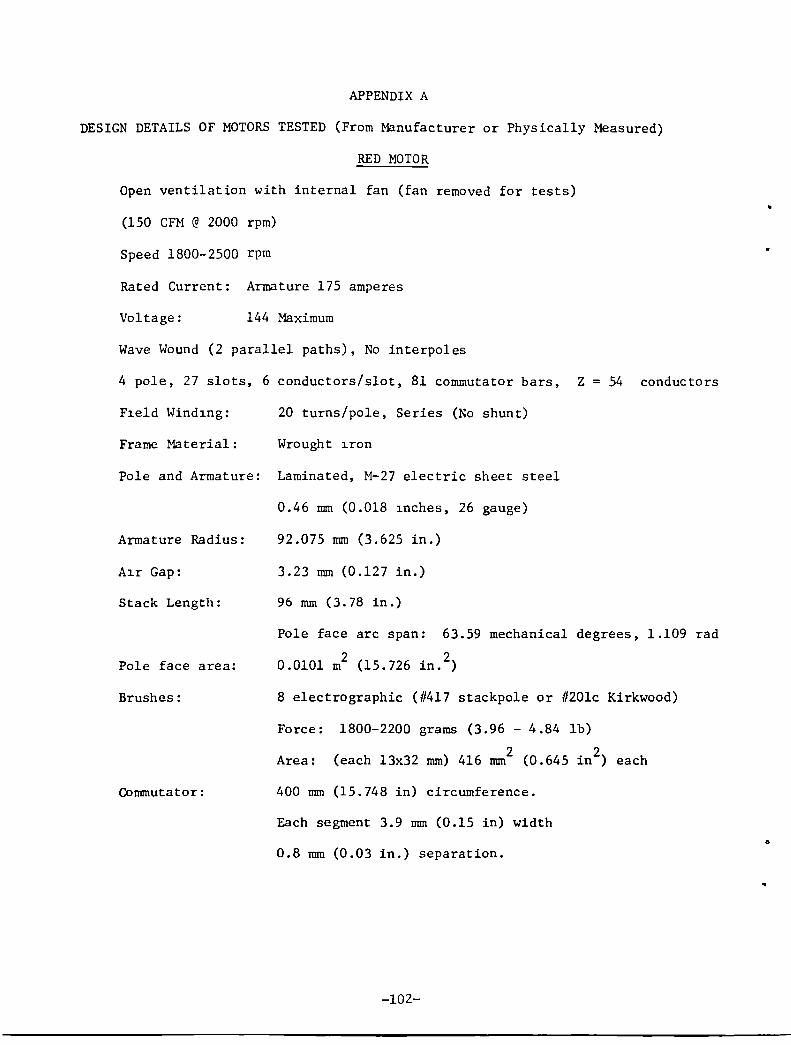
APPENDIX A
DESIGN DETAILS OF MOTORS TESTED (From Manufacturer or Physically Measured)
RED MOTOR
Open ventilation with internal fan (fan removed for tests)
(150 CFM @ 2000 rpm)
Speed 1800-2500 rpm
Rated Current: Armature 175 amperes
Voltage: 144 Maximum
Wave Wound (2 parallel paths), No interpoles
4 pole, 27 slots, 6 conductors/slot, 81 commutator bars, Z = 54 conductors
F1eld Wind1ng: 20 turns/pole, Series (No shunt)
Frame Material: Wrought 1ron
Pole and Armature: Laminated, M-27 electric sheet steel
Armature Radius:
A1r Gap:
Stack Length:
Pole face area:
Brushes:
Commutator:
0.46 mm (0.018 1nches, 26 gauge)
92.075 rom (3.625 in.)
3.23 rom (0.127 in.)
96 mm (3.78 in.)
Pole face arc span: 63.59 mechanical degrees, 1.109 rad
0.0101 m2 (15.726 in. 2)
8 electro graphic (#417 stackpole or #20lc Kirkwood)
Force: 1800-2200 grams (3.96 - 4.84 lb)
Area: (each l3x32 rom) 416 rom2 (0.645 in2) each
400 rom (15.748 in) circumference.
Each segment 3.9 rom (0.15 in) width
0.8 rom (0.03 in.) separation.
-102-
6
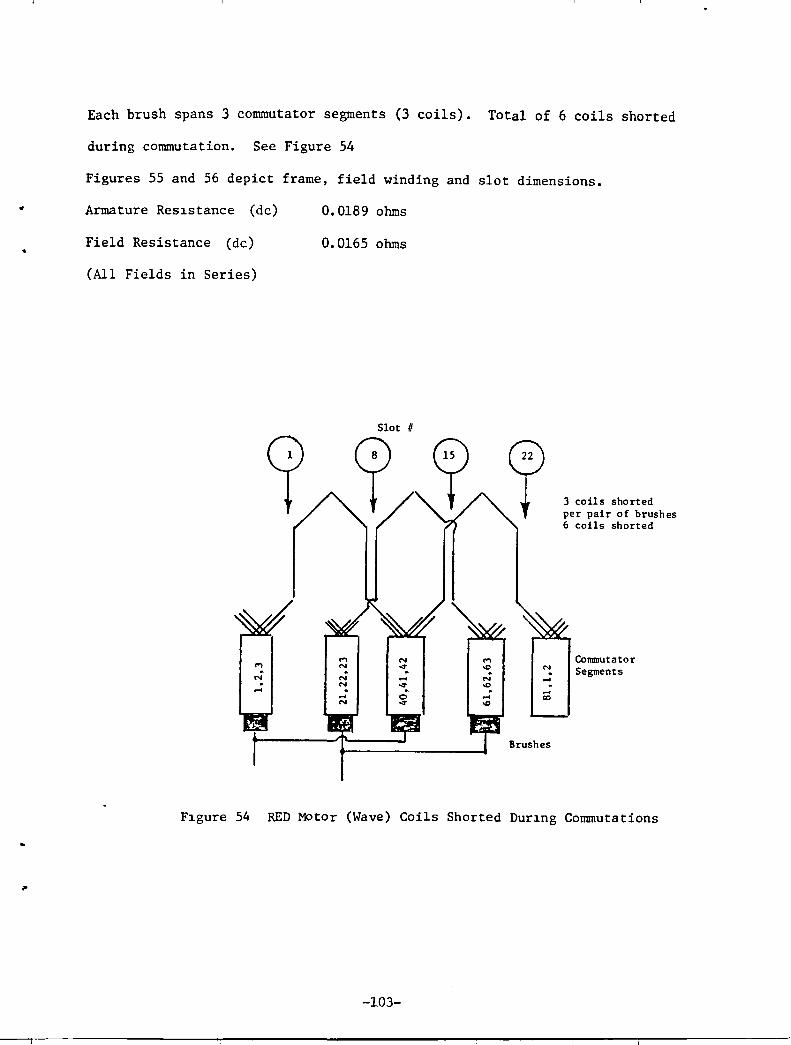
•
,.
Each brush spans 3 commutator segments (3 coils). Total of 6 coils shorted
during commutation. See Figure 54
Figures 55 and 56 depict frame, field winding and slot dimensions.
Armature Res1stance (dc) 0.0189 ohms
Field Resistance (de) 0.0165 ohms
(All Fields in Series)
M N M N ~. ..; ..; ... . N ~ . ... ...: 0
N ~
M \0 "!. . N "'"! \0
...: ... co
\0
Brushes
3 coils shorted per pair of brushes 6 coils shorted
Commutator Segments
F1gure 54 RED Motor (Wave) Coils Shorted Dur1ng Commutations
-103-
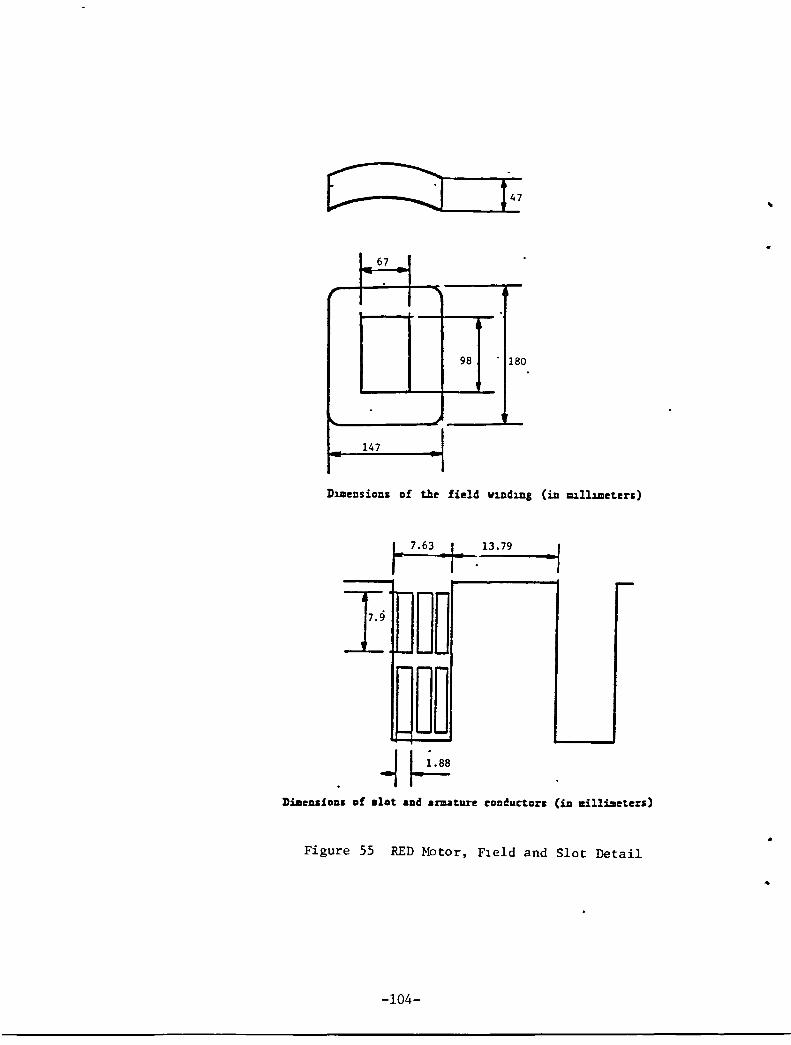
..
67
.
98 18 o
147
DlJIIensions of the field v1nd1ng (in IUlllJlleters)
13.79 ·1 r--
I ~D~ ~~~
Dimensions of .lot and a~ture eOIl~uctors (in Eill~eters)
• Figure 55 RED Motor, F1eld and Slot Detail
-104-
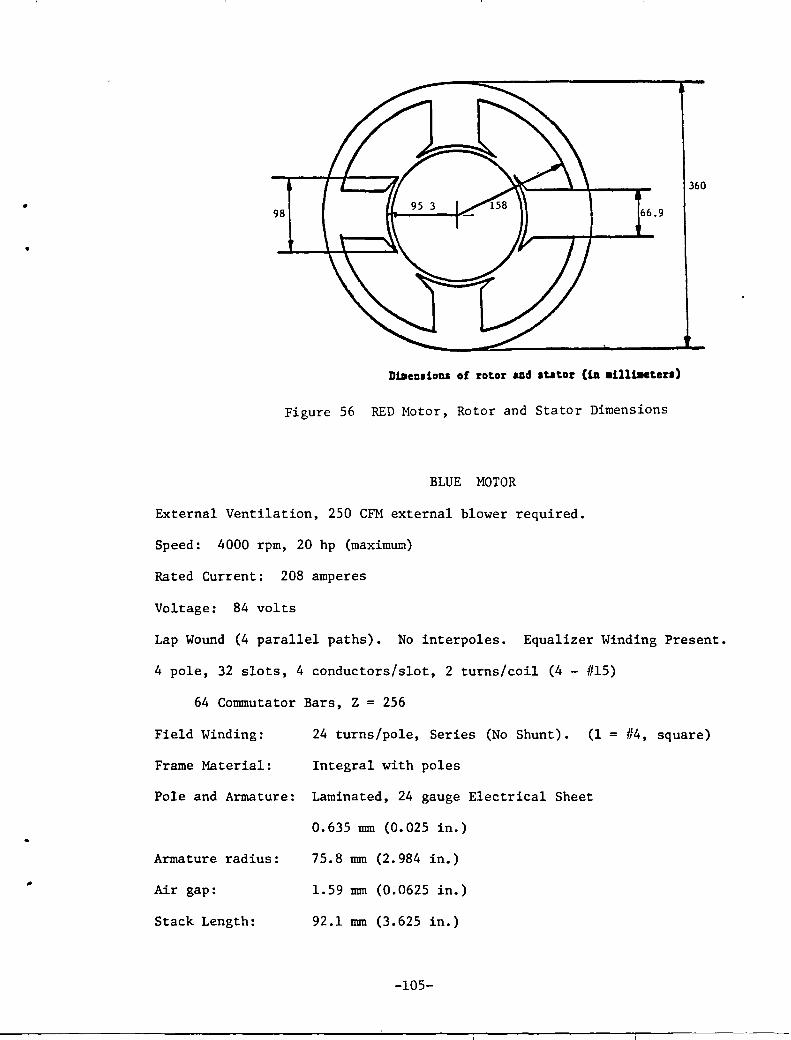
•
•
98 66.9
Dlaealiona of rotor aDd .tator (iA aillt.eterl)
Figure 56 RED Motor, Rotor and Stator Dimensions
BLUE MOTOR
External Ventilation, 250 CFM external blower required.
Speed: 4000 rpm, 20 hp (maximum)
Rated Current: 208 amperes
Voltage: 84 volts
360
Lap Wound (4 parallel paths). No interpo1es. Equalizer Winding Present.
4 pole, 32 slots, 4 conductors/slot, 2 turns/coil (4 - #15)
64 Commutator Bars, Z = 256
Field Winding: 24 turns/pole, Series (No Shunt). (1 = #4, square)
Frame Material: Integral with poles
Pole and Armature: Laminated, 24 gauge Electrical Sheet
0.635 mm (0.025 in.)
Armature radius:
Air gap:
Stack Length:
75.8 mm (2.984 in.)
1.59 mm (0.0625 in.)
92.1 mm (3.625 in.)
-105-
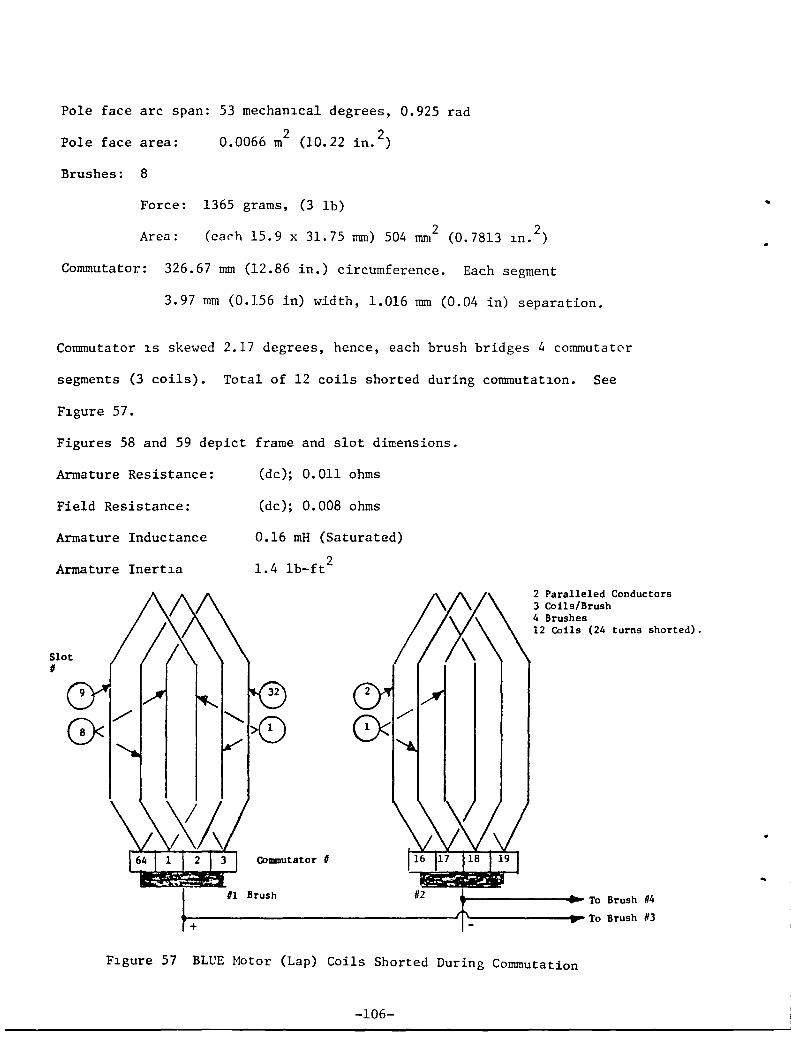
Pole face arc span: 53 mechan1cal degrees, 0.925 rad
Pole face area: 0.0066 m2
(10.22 in. 2)
Brushes: 8
Force: 1365 grams, (3 lb)
Area: 2 2 (ea~h 15.9 x 31.75 mm) 504 mm (0.7813 1n. )
Commutator: 326.67 mm (12.86 in.) circumference. Each segment
3.97 mm (0.156 in) width, 1.016 mm (0.04 in) separation.
Commutator 1S skewed 2.17 degrees, hence, each brush bridges 4 commutator
segments (3 coils). Total of 12 coils shorted during commutat10n. See
F1gure 57.
Figures 58 and 59 depict frame and slot dimensions.
Armature Resistance:
Field Resistance:
Armature Inductance
Armature Inert1a
Slot #
I.
(dc); 0.011 ohms
(dc); 0.008 ohms
0.16 mH (Saturated)
1.4 1b-ft2
CoDDllutator ,
III Brush
2 Paralleled Conductors 3 Coils/Brush 4 Brushes 12 Coils (24 turns shorted).
::
To Brush 1/4
'--------1-,. To Brush 113
F1gure 57 BLUE Motor (Lap) Coils Shorted During Commutation
-106-
..
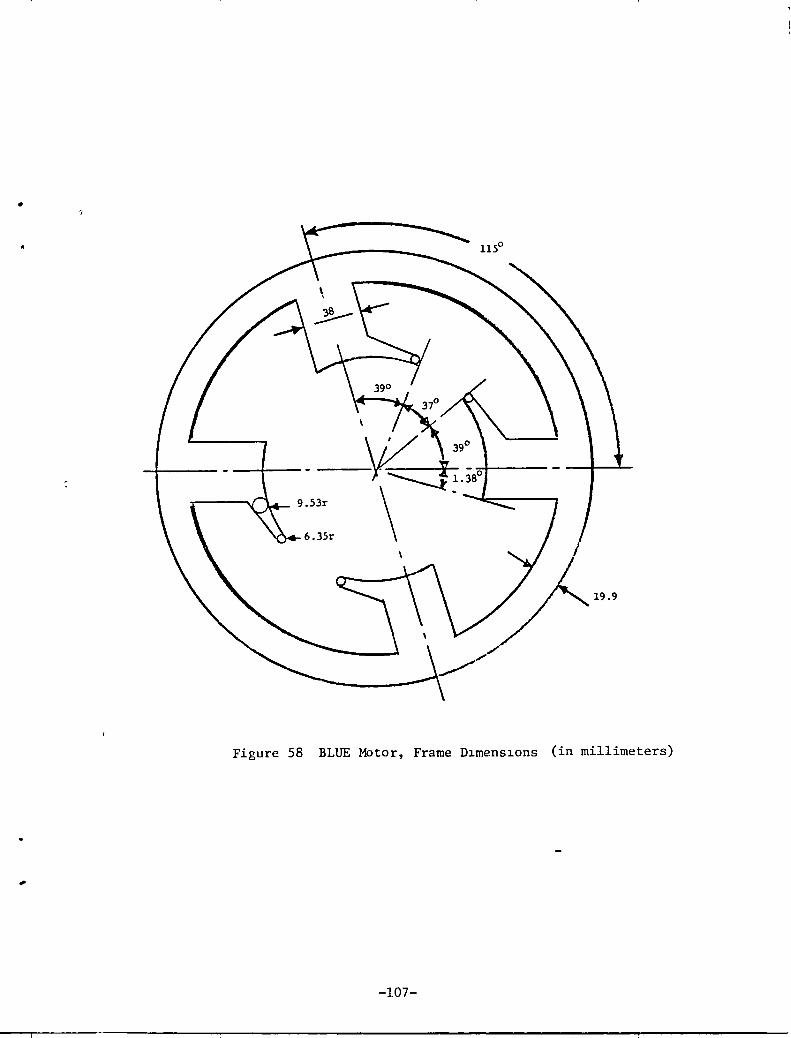
19.9
Figure 58 BLUE Motor, Frame D~mens~ons (in millimeters)
-107-

Contains 4 coils 2 turns/coil 4-015 wue per inductor
\
3.57
~ 4.78 .. I
I
/ I
23.5
dlmensions in millimeters
Figure 59 BLUE Motor, Slot Deta11
-108-
..
..
...
APPENDIX B
EV MOTOR APPLICATION
An excellent exposition on aspects of EV design and performance, includ~ng information on laboratory and field test, EV components, motors, etc. is contained in
• "STATE-OF-THE-ART ASSESSMENT OF ELECTRIC AND HYBRID VEHICLES" prepared by NASA-Lewis Research Center CONS/1011-1, UC-96)(Ref. 11). In this appendix a brief discussion will be presented in order to acquaint motor designers with the application aspects of motors for EV applications.
A number of factors enter into the determination of the motor and control scheme for the drive train in electric vehicles. Basic decisions to be made are: (not necessarily in order):
1) Type of motor, i.e. series or shunt?
2) If shunt wound,
a) constant field excitation or controlled variable excitation?
b) How will armature voltage be controlled - by chopper or switched in finite, discrete steps?
c) transmission gear ratios?
d) is regeneration to be utilized?
3) tire size
4) system voltage
5) vehicle performance, based on frontal area and weight, to include the following:
a) maximum acceleration
b) maximum speed on a specified maximum grade for a minimum time period
c) cruise speed
d) top speed
e) regeneration, if utilized
Since these require varying speed/torque and speed/power combinations and result in an intermittent load on the motor, a standardized duty cycle must be resorted to in order to establish a rating, based on thermal and commutation considerations, for the motor. The speed requirements will fix the drive train gear ratio/motor speed-torque relationships.
The Society of Automotive Engineers has established various driving cycle schedules which can be used as standardized requirements for evaluation purposes. Figure 60 depicts the driving cycle for SAE J 227 B, C and D schedules.
-109-
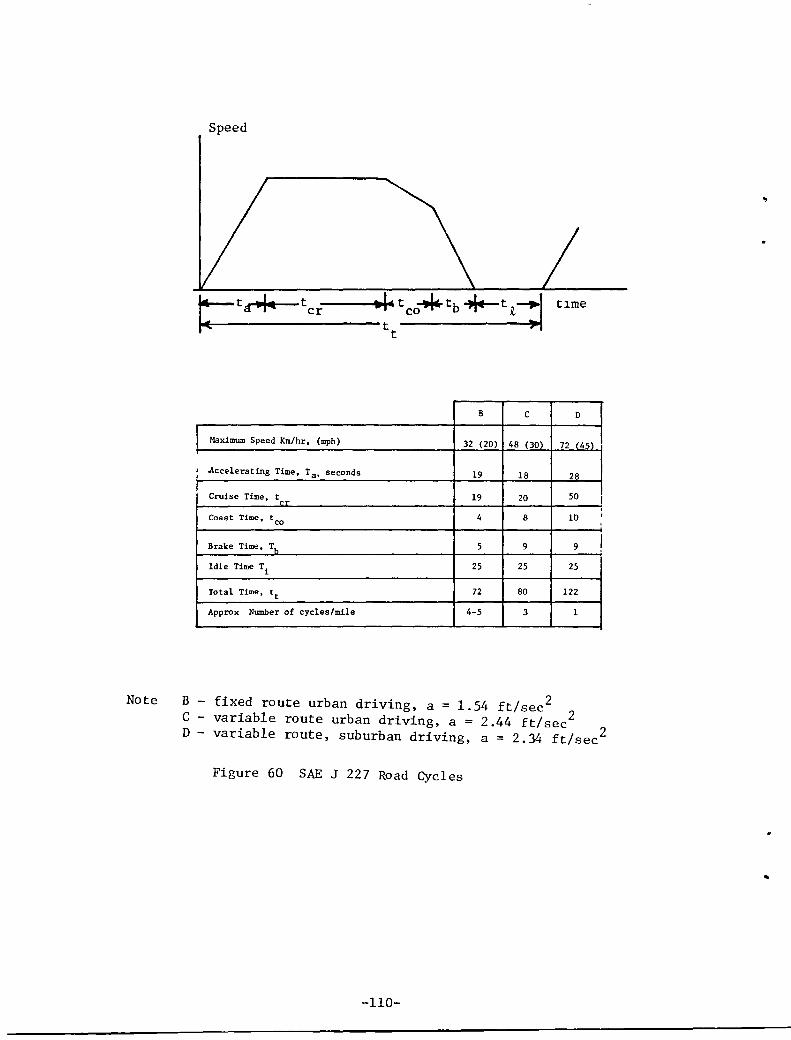
Note B C D
, , !
Speed
..
B C D
Maximum Speed Km/hr, (mph) 32 (20) 48 (30) 72 (45)
Accelerating Time, Ta. seconds 19 18 28
Cruise Time, trr 19 20 50 I . Coast Time. tco 4 8 10
,
Brake Time, Th 5 9 9 I Idle Time Ti 25 25 25
Total Time, tt 72 80 122
Approx Number of cycles/mile 4-5 3 1
fixed route urban driving, a : 1.54 ft/sec 2 2 variable route urban driving, a : 2.44 ft/sec 2 variable route, suburban driving, a : 2.34 ft/sec
Figure 60 SAE J 227 Road Cycles
..
-110-
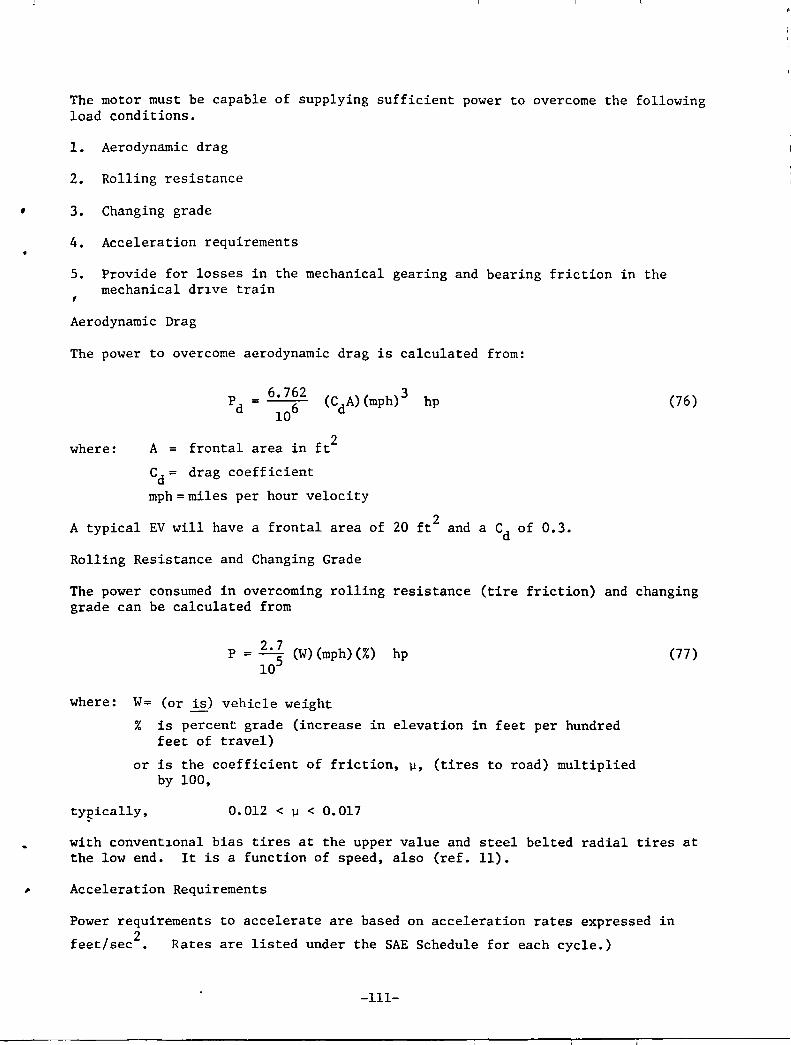
The motor must be capable of supplying sufficient power to overcome the following load conditions.
1. Aerodynamic drag
2. Rolling resistance
, 3. Changing grade
4. Acceleration requirements
5. Provide for losses in the mechanical gearing and bearing friction in the mechanical dr1ve train ,
Aerodynamic Drag
The power to overcome aerodynamic drag is calculated from:
where:
6.762
106
A = frontal area in ft2
Cd = drag coefficient
mph = miles per hour velocity
hp
2 A typical EV will have a frontal area of 20 ft and a Cd of 0.3.
Rolling Resistance and Changing Grade
(76)
The power consumed in overcoming rolling resistance (tire friction) and changing grade can be calculated from
P - 2.7 (W)(mph)(%) hp - 105
where: W= (or is) vehicle weight
% is percent grade (increase in elevation in feet per hundred feet of travel)
or is the coefficient of friction, ~, (tires to road) multiplied by 100,
ty!?ically, 0.012 < ~ < 0.017
(77)
with convent10nal bias tires at the upper value and steel belted radial tires at the low end. It is a function of speed, also (ref. 11).
, Acceleration Requirements
Power requirements to accelerate are based on acceleration rates expressed in
feet/sec 2• Rates are listed under the SAE Schedule for each cycle.)
-111-
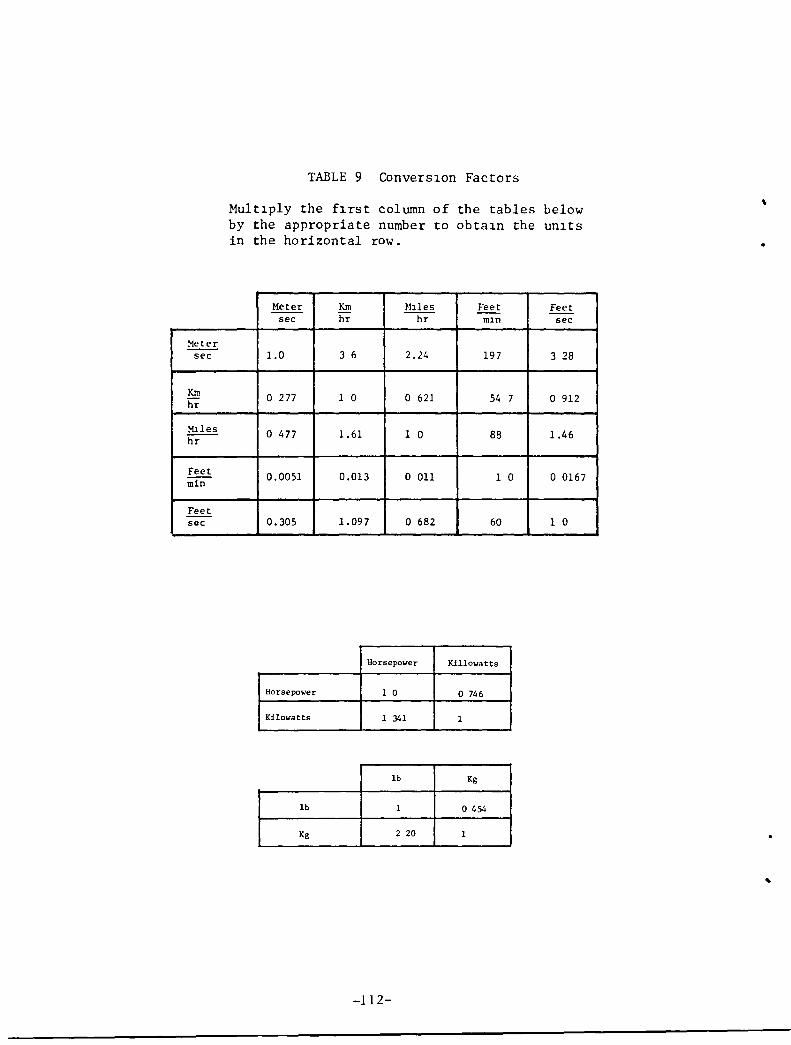
Meter sec
Km hr
MIles ~
Feet min
Feet sec
TABLE 9 Convers10n Factors
Mult1ply the f1rst column of the tables below by the appropriate number to obta1n the un1ts in the horizontal row.
Meter Km ~1l1es Feet Feet sec hr ~ mIn sec
1.0 3 6 2.24 197 3 28
0277 1 0 o 621 54 7 o 912
o 477 1.61 1 0 88 1.46
0.0051 0.013 o 011 1 0 o 0167
0.305 1.097 o 682 60 1 0
Horsepower Kil10watts
Horsepower 1 0 o 746
Kilowatts 1 341 1
Ib Kg
Ib 1 o 454
Kg 2 20 1
-112-
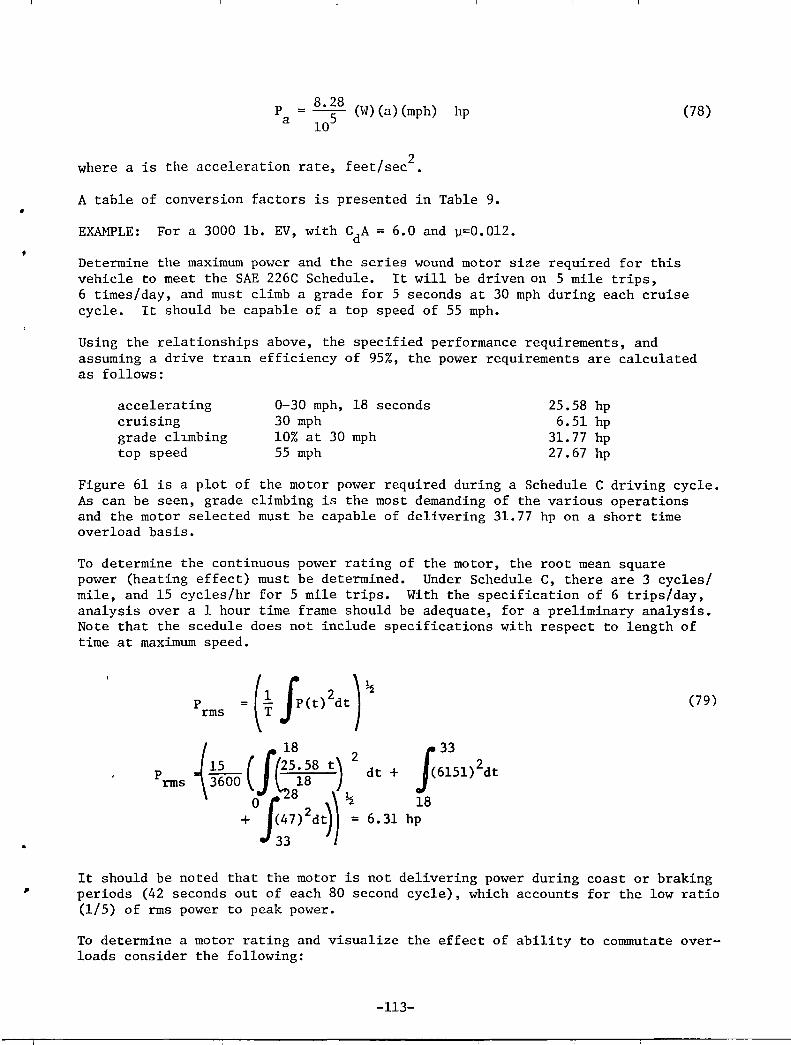
•
•
p = 8.528 (W)(a)(mph) hp
a 10 (78)
2 where a is the acceleration rate, feet/sec •
A table of conversion factors is presented in Table 9 .
EXAMPLE: For a 3000 lb. EV, with CdA = 6.0 and ~=0.012.
Determine the maximum power and the series wound motor size required for this vehicle to meet the SAE 226C Schedule. It will be driven on 5 mile trips, 6 times/day, and must climb a grade for 5 seconds at 30 mph during each cruise cycle. It should be capable of a top speed of 55 mph.
Using the relationships above, the specified performance requirements, and assuming a drive traln efficiency of 95%, the power requirements are calculated as follows:
accelerating cruising grade cllmbing top speed
0-30 mph, 18 seconds 30 mph 10% at 30 mph 55 mph
25.58 hp 6.51 hp
31. 77 hp 27.67 hp
Figure 61 is a plot of the motor power required during a Schedule C driving cycle. As can be seen, grade climbing is the most demanding of the various operations and the motor selected must be capable of delivering 31.77 hp on a short time overload basis.
To determine the continuous power rating of the motor, the root mean square power (heating effect) must be determined. Under Schedule C, there are 3 cycles/ mile, and 15 cycles/hr for 5 mile trips. With the specification of 6 trips/day, analysis over a 1 hour time frame should be adequate, for a preliminary analysis. Note that the scedule does not include specifications with respect to length of time at maximum speed.
p rms
dt + f::S1)2dt 18
6.31 hp
(79)
It should be noted that the motor is not delivering power during coast or braking periods (42 seconds out of each 80 second cycle), which accounts for the low ratio (1/5) of rms power to peak power.
To determine a motor rating and visualize the effect of ability to commutate overloads consider the following:
-113-
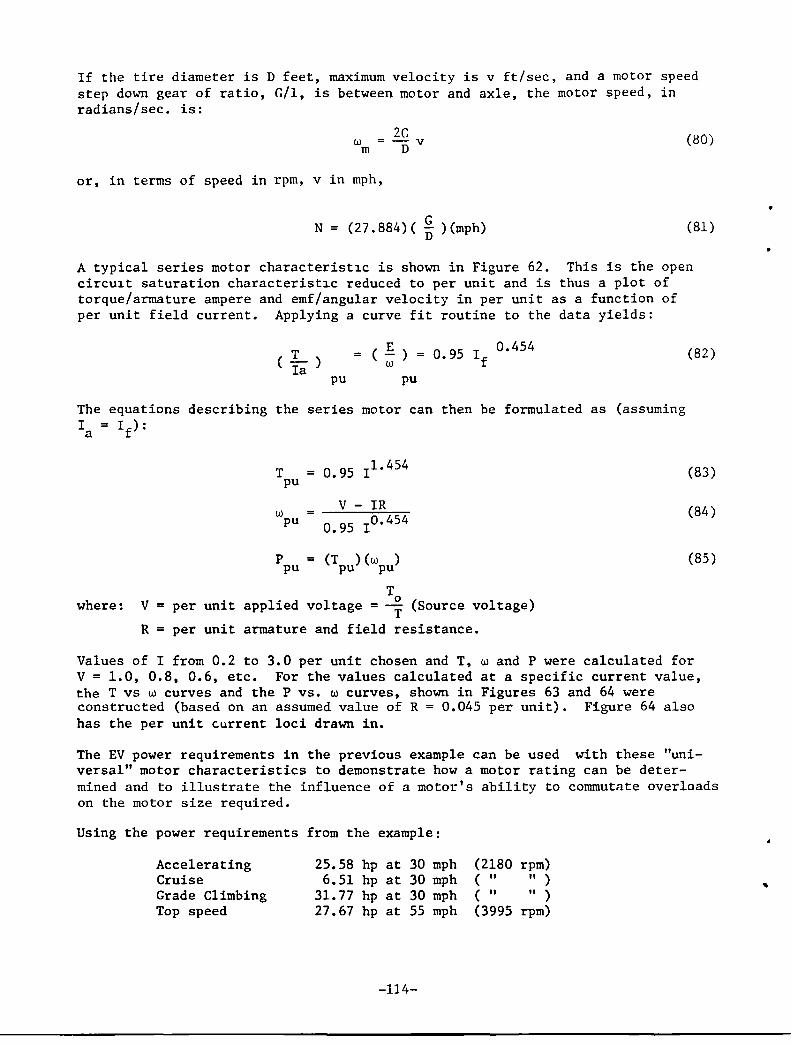
If the tire diameter is D feet, maximum velocity is v ft/sec, and a motor speed step down gear of ratio, G/l, is between motor and axle, the motor speed, in radians/sec. is:
w m
or, in terms of speed in rpm, v in mph,
2G 15 v
G N = (27.884)( D ) (mph)
(80)
(81)
A typical series motor characterist1c is shown in Figure 62. This is the open circu1t saturation characterist1c reduced to per unit and is thus a plot of torque/armature ampere and emf/angular velocity in per unit as a function of per unit field current. Applying a curve fit routine to the data yields:
(T ) Ia
= ( ~ ) = 0 95 I 0.454 w • f
pu pu
The equations describing the series motor can then be formulated as (assuming Ia = If):
T = 0.95 11. 454 pu
V - IR w 0.95 10•454 pu
p = (Tp) (wpu) pu
T where: V unit applied voltage = 0 (Source voltage) = per
T R = per unit armature and field resistance.
(82)
(83)
(84 )
(85)
Values of I from 0.2 to 3.0 per unit chosen and T, wand P were calculated for V = 1.0, 0.8, 0.6, etc. For the values calculated at a specific current value, the T vs w curves and the P vs. w curves, shown in Figures 63 and 64 were constructed (based on an assumed value of R = 0.045 per unit). Figure 64 also has the per unit current loci drawn in.
The EV power requirements in the previous example can be used with these "universal" motor characteristics to demonstrate how a motor rating can be determined and to illustrate the influence of a motor's ability to commutate overloads on the motor size required.
Using the power requirements from the example:
Accelerating Cruise Grade Climbing Top speed
25.58 hp at 30 mph 6.51 hp at 30 mph
31.77 hp at 30 mph 27.67 hp at 55 mph
-114-
(2180 rpm) (" ") (" ") (3995 rpm)
•
•
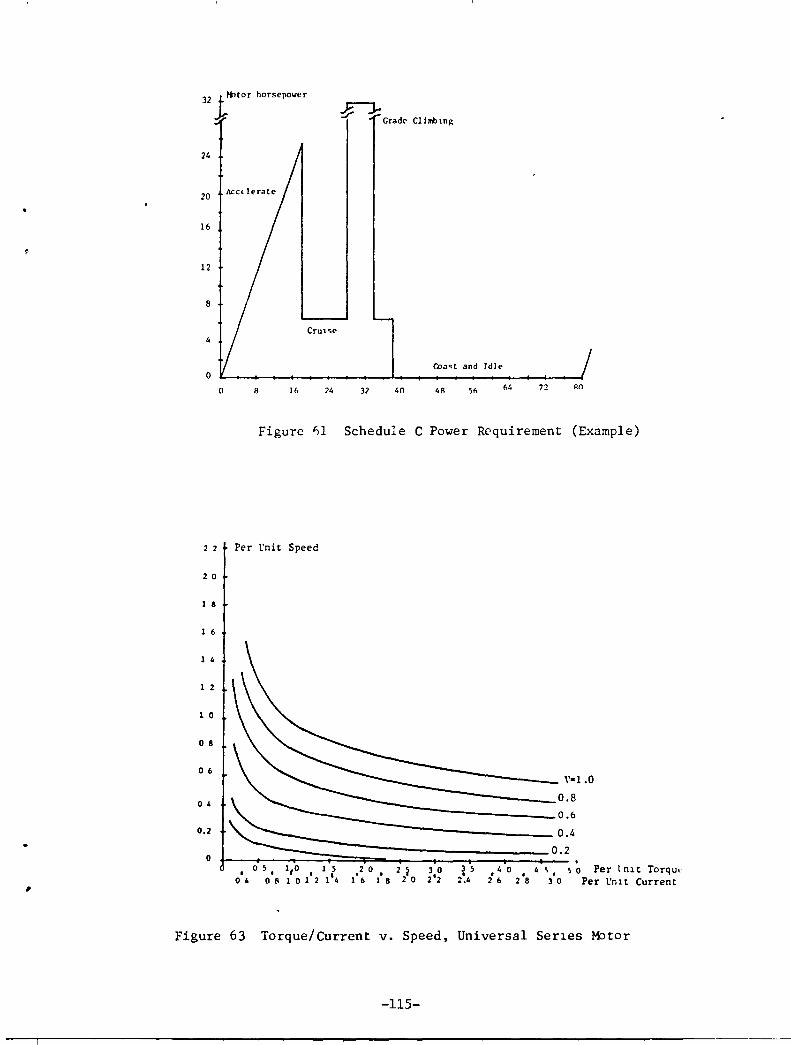
3211tltor horsepower
~ Grad(' Climb Ing
24
20
16
12
8
CrUI~e
r.o"~t and Jdl" o
o 8 16 24 32 40 41\ 72 RO
Figure f,l Schedule C Power R~quirement (Example)
2 2 Per l'nit Speed
2 0
1 8
1 6
1 4
1 2
1 0
o 8
06
04
0.2
o
~----_ "-1.0 -------__ 0.8
~------__ O.6
-------__ 0.4
0.2
• 0 ~. 1,0 J ~ .2 0, 2 ~ 3 0 J ~ .4 0 • 4 ~. ~ 0 Per I n~ t Torqut-04 08 101'2 1'4 1 6 1 8 20 2'2 •• 4 26 28 J 0 Per l'nlt Current
Figure 63 Torque/Current v. Speed, Universal Ser1es Motor
-115-
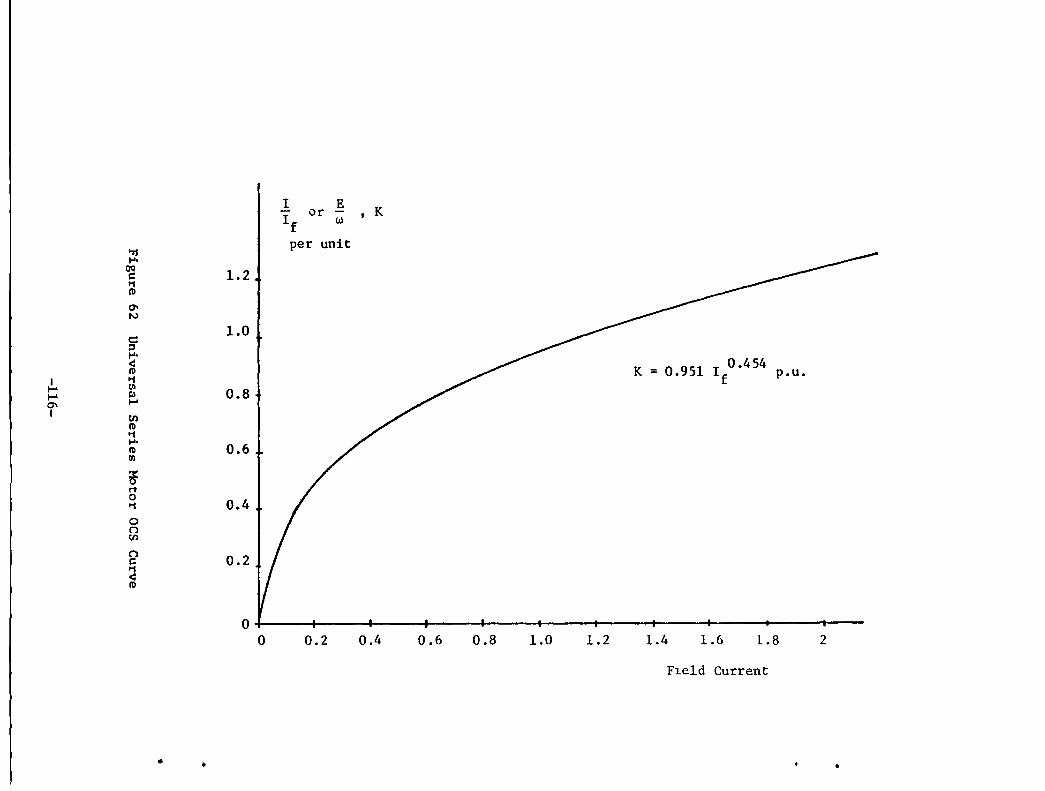
I E , K - or If w
..., per unit
.... OIl 1.2 c:: t1 (1)
a-N
c: 1.0 ::s ....
~ 0.454 < It) K = 0.951 If p.u. I t1 I-' fJI
0.8 I-' CII 0- ...... I tn
It) t1 ....
0.6 It) fJI
~ rt 0
0.4 t1
0 n tn
n 0.2 c:: t1 < It)
0 0 0.2 0.4 0.6 0.8 1.0 1.2 1.4 1.6 1.8 2
F1e1d Current
.. •
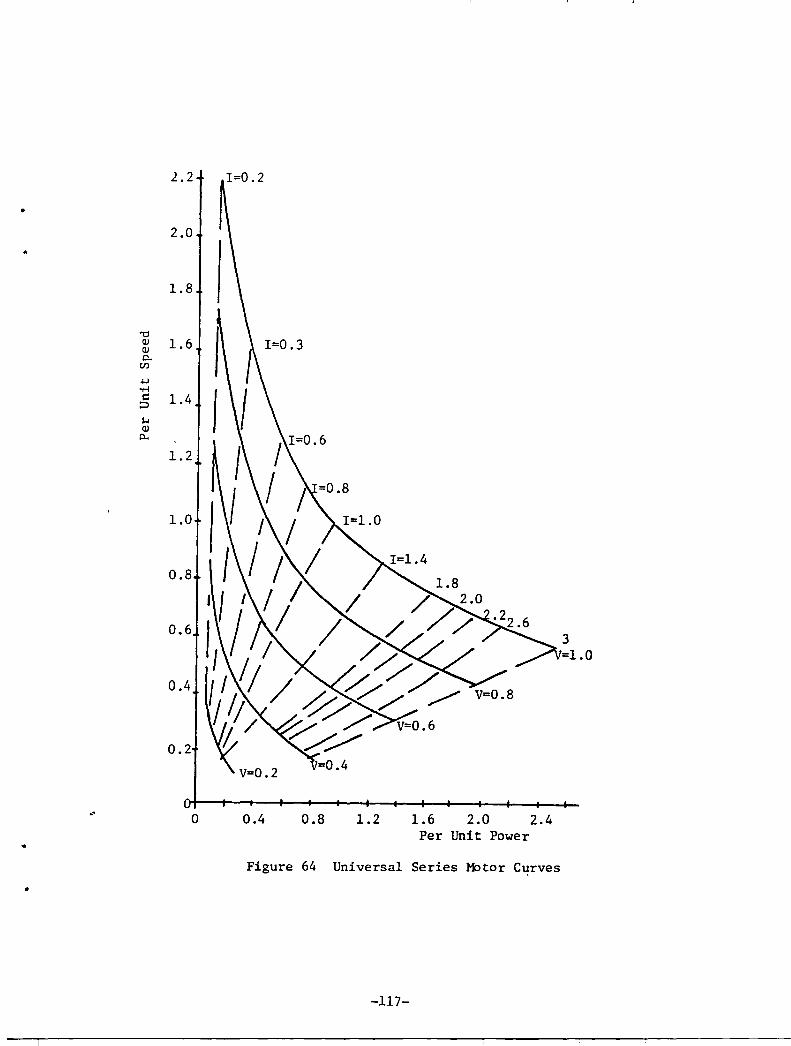
•
..
"0 Q) Q) 0.
tr.I
4-J 'r-! t:
:::>
'"' Q) p..
.'
•
2.2
2.0
1.8
1.6
1.4
1.2
1.0
0.8
0.6
0.4
0.2
o
1=0.2
0.4 0.8 1.2 1.6 2.0 2.4 Per Unit Power
Figure 64 Universal Series MOtor Curves
-117-
3 =1.0
Assume that top speed is chosen as 0.8 per unit. With V = 1.0 the per unit power is 1.45. If the efficiency is assumed to be 74.6%, the motor rating for the top speed requirement is:
p = 27.67 1.45
'U 19.08 '\, 20 kw
From Figure 64:
I = 1.5 pu N = 0.8 pu
Grade climbing will require a per unit power of:
p = 31. 77 20 = 1. 59
30 at a speed of ( 55 ) (0.8) = 0.44
From Figure 64, for this power and speed,
'\,
I = 2.5, V '\, 0.75
For cruise: N = 0.44, and
For the maximum power
p = 62~1 = 0.325
I = 0.8, V = 0.4
dur1ng acceleration,
p 25.58 = 1.28 = 20
I = 2.1, V = 0.7
at N = 0.44
If top speed had been chosen as 1.0 per unit the operating conditions would be as follows: V = 1.0 and the per unit power is 0.96. The motor rating is:
p = 2~9~7 = 28.8 ~ 30 kw
G d 1i b o ° ° f p -- 3130
.77 -- 1.06 ra e c m 1ng requ1res a per un1t power 0 :
at a speed of (30/55)(1.0) = 0.55 yielding I = 1.6 and V = 0.73
For cruise: N = 0.55
p 6.51 0.22 =--= 30
I = 0.5 V = 0.4
p 25.58 = 0.85 at N 0.55 = = 30 For acceleration:
I = 1.4 V = 0.68
If the EV is to use a 5.21/1 d1fferential and 2 foot diameter tires, top speed of 55 mph results in a motor speed of:
N = (27.884) (g) (mph) = 4000 rpm. D
-118-
•
•
For the 20 kw motor, this is a per unit speed of 0.8. Therefore, the motor would be rated 20 kw, 4000/0.8 = 5000 rpm and must be capable of commutating 2.5 per unit current on grade cl1mbing.
For the 30·kw motor, its rated speed would be 4000 rpm, but it need only have the capability of commutating 1.6 per unit current maximum •
In general, armature physical size is inversely proportional to speed. In the example above, the ability to commutate 3.5 per unit current permits selection of a 20 kw motor, 5000 rpm which would be a smaller, lighter motor than would be requ1red if commutation ability were limited to 1.6 per unit current requiring a 30 kw, 4000 rpm selection. Another advantage in using the smaller motor 1S that at cruise the motor power output is a higher percentage of its rated power than 1S the situation for the larger motor. Since the efficiency decreases at light loads on a motor, the use of the smaller motor results in increased effic1ency during the cruise condition.
Motor example used for preliminary selection of an EV motor power and speed rating dramatically points up the need for the EV motor to have the ability to commutate h1gh, short time overloads. The ratio of peak power to average power required by an EV varies from about 5/1 in heavy city traffic to 3/1 in suburban/rural driving situations. Thus, the motor design must be based on commutation limit as opposed to the traditional thermal constraint approach.
Because a motor for EV app1icat10n must also carry its power supply, high efficiency over the entire operating range is a major design objective. Typically 1 kW-hr of lost energy requires carrying an additional battery weight on the order of 30 kg (66 lb).
Another objective not normally considered in design of motors for conventional, industrial app1icat10ns is that of achieving relatvely high circuit inductance. Increas1ng inductance tends to suppress harmonic current magnitudes, thus increasing the efficiency. In addition, it tends to minimize chopper-motor interface problems in that it decreases the rate of rise of chopper current each cycle.
Because of the unavoidable electrical leakage paths that will develop in an EV environment, the electrical system voltage levels will probably be established at between 96 and 120 volts, which means a rather heavy current requirement for motors in the 15-30 kW power range. In general, system voltage level does not appreciably affect the weight of the motor. However, this voltage range for the power rating range does not indicate a clear choice of the use of a lap or wave winding. Yet a wave winding appears to offer advantages in that it does not need an equalizer wind1ng.
In order to achieve ability to commutate relatively high short time overloads, the use of a laminated (thin) steel frame and interpo1es are a must. In addition, the added cost of utilizing compensating (pole face) windings should be evaluated based on the reduction in motor size possible if high overloads can be accommodated •
It should be recogn1zed that if compensating windings are used, they must be stranded to keep eddy current losses to a minimum.
-119-
The electromagnetic power developed in a dc motor armature is given by:
where:
P = EI = (~) I 60a
Z number of armature inductors ¢ = flux/pole, webers P = number of poles N = rpm I = armature current, amperes a = parallel paths 1n the armature
(86)
Defin1ng the specific electrical loading, q, and the spec1f1c magnetic load1ng, B, as:
q = IZ a1Td
B = .E.L 1TD~
ampere 1nductors/meter
where: ~ = armature core length, D = armature diameter
Then: P = 1T2D2~NqB 60
(87)
(88)
(89)
It is important to note that, 1n EV app11cations, where the ratio of average to peak power is low, specific electrical loading can be quite high, relative to industrial type motor design and is realistically limited only by commutation capability and not thermal considerations.
High q permits a lower specific magnetic loading which in turn results in lower losses and higher efficiency. However, lower specific flux density should be obtained by larger diameter, rather than larger core length. Longer core length increases the cooling problem as well as introducing mechanical problems such as shaft deflection and increases the overturning moment, for horizontal mounting.
Studies (ref 12) have shown that high specific electrical loading, obtained with a wave winding, can result in substantial weight reductions for the motor. Figure 65, reproduced from that reference, shows the influence of specific loading and armature diameter on the weight of a 40 kw shunt motor.
The main considerations in ability to commutate are the reactance emf in the coils being commutated and the presence of armature reaction. Interpoles can nullify the reactance emf. The actual reactance voltage is dependent upon slot permeance, conductor current, speed, and armature length. On the basis that the EV application stresses high speed and high specific electrical loading, this armature reactance voltage can be decreased by a larger air gap and larger diameter (shorter length) armature. The larger air gap means more turns/pole for the field, which increases the total circuit inductance, which is desirable. Only a compensating winding can eliminate armature reaction.
In order to increase the ability to commutate, one tends to design the motor using the greatest number of commutator bars; yet using the lowest number of turns per coil (which yields the maximum slot space factor) which tends to
-120-
•
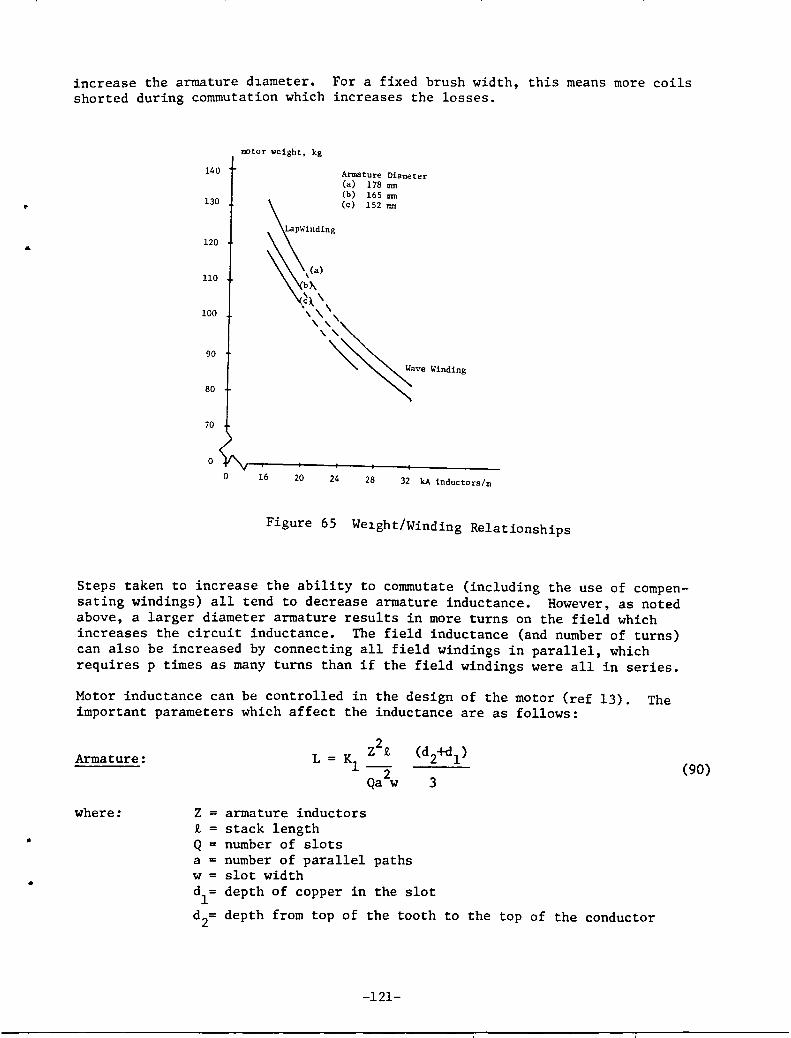
..
•
•
•
increase the armature d1ameter. For a fixed brush width, this means more coils shorted during commutation which increases the losses.
140
130
120
110
100
90
80
70
0
0
motor weight, kg
Armature Diameter (a) 178 mm (b) 165 mm
\LaPW (c) 152 mm
\ \'~'"' ~~~) ~~),\
" \. \
", .. """"' 16 20 24 28 32 kA inductors/m
Figure 65 We1ght/Winding Relationships
Steps taken to increase the ability to commutate (including the use of compensating windings) all tend to decrease armature inductance. However, as noted above, a larger diameter armature results in more turns on the field which increases the circuit inductance. The field inductance (and number of turns) can also be increased by connecting all field windings in parallel, which requires p times as many turns than if the field windings were all in series.
Motor inductance can be controlled in the design of the motor (ref 13). The important parameters which affect the inductance are as follows:
Armature:
where: Z = armature inductors t = stack length Q = number of slots a = number of parallel paths w slot width d
l= depth of copper in the slot
d2= depth from top of the tooth to the top of the conductor
-121-
(90)
Poles
where: h n = p = g = .Q. = a =
pole height number of turns number of poles air gap length of pole
2 L = K2 hn .Q.p
2 ga
number of parallel paths in
CHOPPER CONSIDERATIONS
pole windings
The chopper thyristors must, of course, have a voltage and current capab1l1ty exceeding the system voltage and maximum current which will be required.
(91)
In the above example, note that grade climbing (31.77 hp) occurs at V = 0.7 p.u. If a 15 hp motor was chosen, I ,for grade climbing would be:
pu
I pu P 31. 77
= V =(15)(0.7) = 3.0 p.u. (92)
If a 120 volt system were used, and a 15 hp motor with, say, 75% efficiency was chosen, per unit current would be 125 amperes and the chopper thyristor current rating must be 375 amperes or greater. The chopper should have a current l1mit control feature, also.
For "soft" starts, it is desirable to start with a very low voltage, Le. 0.03 -0.05 per unit, requiring a ratio T IT of the same magnitude. In choppers which
o utilize the on time, T ,
o for charging the commutating capacitor, minimum T
o is fixed. If, for example, minimum on time is voltage is 0.03 per unit, the maximum starting
0.001 seconds, and minimum desired chopper frequency is
1 0.030 f = T = 0.001 = 30 Hz. As shown in CHAPTER 2, the efficiency is quite dependent
upon chopper frequency, increasing with frequency. Thus, the chopper control should have the ability to increase the frequency at which the chopper is operating to an upper limit as qUickly as possible, subject of course to the minimum "on time" constraint imposed by the commutating capacitor charging scheme.
Motor circuit inductance is an important factor in the selection and application of a chopper controller because the thyristors have a maximum dI/dt rating. Since maximum rate of rise of current is determined by system voltage and circuit inductance, these parameters must be controlled to yield a specified maximum value. Chopper designs tend to be conservative with respect to operating conditions relative to thyristor allowable maximum ratings. Informal discussions with chopper designers indicate they prefer dIldt to be less than 500 or 600 amperes per millisecond.
As shown in CHAPTER 2, inductance decreases with frequency and care should be taken to evaluate dIldt at the highest frequency the chopper will operate at.
Reference 14 provides background information on motors and choppers. Reference 15 presents an excellent discussion of the various chopper types and their advantages and disadvantages.
-122-
~ -
<>
"
•
REFERENCES
1) IEEE Standard 11113 "IEEE Standard Test Code for Direct Current Machines," 1973 IEEE, Inc., 345 E. 47th Street, New York; NY 10017
2) Saunders, R.M., "Measurement of DC Machine Parameters," American Institute of Electrical Engineers, Vol. 70, 1951.
3) Hamilton, H.B., "An Investigation of Possl.ble DC Power Sources for Testl.ng Electric Vehicle Motors," submitted to NASA-Lewis/OOE under Grant IINSG 3136, 1978. (Report)
4) Hamilton, H.B., McBrien, E.F., Strangas, E., "A DC Power Source for Testl.ng Battery Powered Electric Vehicle Motors," presented at the 1979 IEEE, lAS Society Meeting, Cleveland, OH, Oct. 1979, and in the Conference Proceedl.ngs, pp. 989-994.
5) Franklin, P.W., "Theory of the DC Motor Controlled by Power Pulses,"Parts I and II. Presented at the 5th Annual Meeting of IEEE, lAS Gp. Chicago, Ill., Oct. 1970.
6) DeWolf, F.T., "Measurement of Inductance of DC Machl.nes," IEEE Trans. PAS, Sept./Oct. 1979, Volume PAS-98, No.5, pp. 1636-1644.
i) Hamilton, H.B. and Strangas, E., "Series Motor Parameter Variations as a Function of Frequency and Saturation," IEEE Trans. PAS, July/Aug. 1980, Vol. PAS-99, pp. 1567-1574.
8) "Direct Current Machines," BOOK, Liwschit-Garik and Whipple. Van Nostrand Co., Princeton, NJ, 1961, pp. 176, 179.
9) "Direct Current Machinery," BOOK, Kloeffler, Brenneman, Kerchner. The MacMillan Co., New York, 1934, p. 79.
10)
11)
12)
13) ...
"Transient Performance of Electrical Power Systems," BOOK, R. Rudenberg, McGraw-Hill, 1950, MIT Press, 1970, p. 117.
NASA-Lewis Research Center, "STATE-OF-THE-ART ASSESSMENT OF ELECTRIC AND HYBRID VEHICLES" MCP/MlOll-Ol, UC-96 available from NTIS, U.S. Dept. of Commerce, 5285 Port Royal Road, Springfield, VA 22161.
Thompson, M.A. and Waters, L.A., "The Design of DC Commutator Motors for High Performance Electric Vehicles," SAE Paper 11740169.
Snively, H.D. and Robinson, P.B., "Measurement and Calculation of DC Machine Armature Inductances" AlEE Transactions, 1950, Vol. 69, pp. 1228-1237.
14) Kusko, A., "Solid State Motor Drives," BOOK, MIT Press, Cambridge, MA, 1969 •
15) Maxda, F.F., "Thyristor Control," BOOK, Chapter 5 and Appendix to Chap. 5, Newner-Butterworth, London, 1973.
-123-
NON CITED REFERENCES
Hamilton, H.B., McBrien, E.F., Strangas, E., "Chopper Controlled DC Tract~on Motor Testing: Some Methods and Results," presented at the l-bnterrey, Mexico IEEE Meet~ng, September 1979 ~n Monterrey, Mexico.
Knowlton, A.R., "Standard Handbook for Electr~cal Eng~neers," 8th Edition, BOOK MCGraw-Hill Book Co., NY (7-120).
Ewing, J.S., "Lumped C~rcu~t Impedance Representation for DC Machines," IEEE PAS Transactions, Vol. PAS-80, No.4, April, 1968.
Dubey, G.K. and Shepherd, " Analysis of DC Series l-btor Controlled by Power Pulses," Proc. IEEE, Vol. 122, 1975.
Yanase, A., "Starting Characteristics of Chopper Controlled DC Series Motor w~th Non-l~near Magnetization Curve," EE in Japan, Vol. 97, No.1, 1977.
Strangas, E., "The T~me Dependent Fin~te Element Modeling of the Electro-magnet~c Field ~n Electrical Machines - Methods and Applications," Ph.D. D~ssertat~on. Un~versity Microfilms, Ann Arbor, Michigan, 1980.
Strangas, E., Hamilton, H.B., "Computer l-bde1~ng of Chopper Controlled DC Machines," presented at the International Conference on Electric Machines, Sept. 1980, Athens, Greece.
Strangas, E., Hamilton, H.B., "A Model for the Chopper Controlled DC Series Motor," to be presented at the IEEE Summer Power Meeting, 1982.
Hamilton, H.B., '~y a Standard for Chopper Controlled DC Motors for Electr1c Vehicles?" SAE Technical Paper Series 11820400 and in SAE P-105, "Developments 1n Electric and Hybrid Vehicles."
-124-
..
..
1 Report No I 2 Government AccesSIon No 3 RecIpIent. Catalog No
NASA CR-167845 4 TItle and SubtItle 5 Report Date
LOSSES rn CHOPPER-CONTROLLED DC SERIES MOTORS April 1982 6 PerformIng OrganizatIon Code
778-36-06
7 Author(s) 8 PerformIng OrganizatIon Report No
Howard B. Hamilton 10 Work UnIt No
9 Performong OrganizatIon Name and Address
University of Pittsburgh 11 Contract or Grant No
Pittsburgh, PA 15261 . NSG-3163 13 Type of Report and PerIod Covered
12 Sponsoring Agency Name and Address Contractor Report U.S. Department of Energy 14 Sponsoring Agency OI:JID[ Report No Office of Vehicle and Engine R&D Washington, D. C. 20585 DOE/NASA/3163-1
15 Supplementary Notes Fmal Report. Report prepared under Interagency Agreement DE-AI01-77CS51044. Project Managers, E. F. McBrien and H. B. Tryon, Transportation Propulsion Division, NASA Lewis Research Center, Cleveland, Ohio 44135.
16 Abstract
Motors for electric vehicle (EV) applications must have different features than dc motors de-slgned for industrial applications. The EV motor application is characterized by the follOWing requirements.
(1) The need for highest possible efficiency from light load to overload, for maximum EV range.
(2) Large short time overload capability. The ratio of peak to average power varies from 5/1 in heave city traffic to 3/1 in suburban driving situations.
(3) Operation from power l;iupply voltage levels of 84-144 volts (probably 120 volts maximum).
The objectives of the research program were the design and fabrication of a test facUity SUitable for conducting tests of EV motors, to develop test procedures, to obtain data which can be used to isolate losses, to visualize where motor design changes can and should be made, to indicate problem areas arising from chopper control, and to make recommendations with respect to test procedures, instrumentation and chopper operating modes.
A test facility utilizing a dc generator as a substitute for a battery pack was designed and utilized. Crlteria for the design of such a facility are presented. Two motors, differing in design detail, commerically available for EV use were tested.
Losses measured are discussed, as are wave forms and their harmonic content, the measure-ments of resistance and inductance, EV motor/chopper application crlteria, and motor design considerations.
17 Key Words (Suggested by Author(s)) 18 DIStributIon Statement Electric vehicles Unclassified - unlimited dc Motors STAR Category 33
Chopper controller DOE Category UC-96
Motor losses
19 Security Classlf (of thIS report) 20 Security ClasSlf (of thIS page) I 21 No of Pages 122 PrIce'
Unclassified Unclassified 124 : A06
• For sale by the NatIOnal TechnIcal InformatIon SerVIce, SpringfIeld, Vtrglnta 22161

End of Document