Embed Size (px)
Citation preview
Loudness
Physics of Music PHY103
http://www.swansea.gov.uk/media/images/e/l/Screaming_.jpg http://greenpack.rec.org/noise/images/noise.jpg
Physical units
For a sound wave • The amplitude of the pressure variation • The amplitude of velocity variations • The power in the wave --- that means the
energy carried in the wave
Decibel scale
• A sound that is ten times more powerful is 10 decibels higher.
• What do we mean by ten times more powerful? Ten times the power. • Decibel is abbreviated dB Amplitude in pressure or velocity would be related
to the square root of the power.
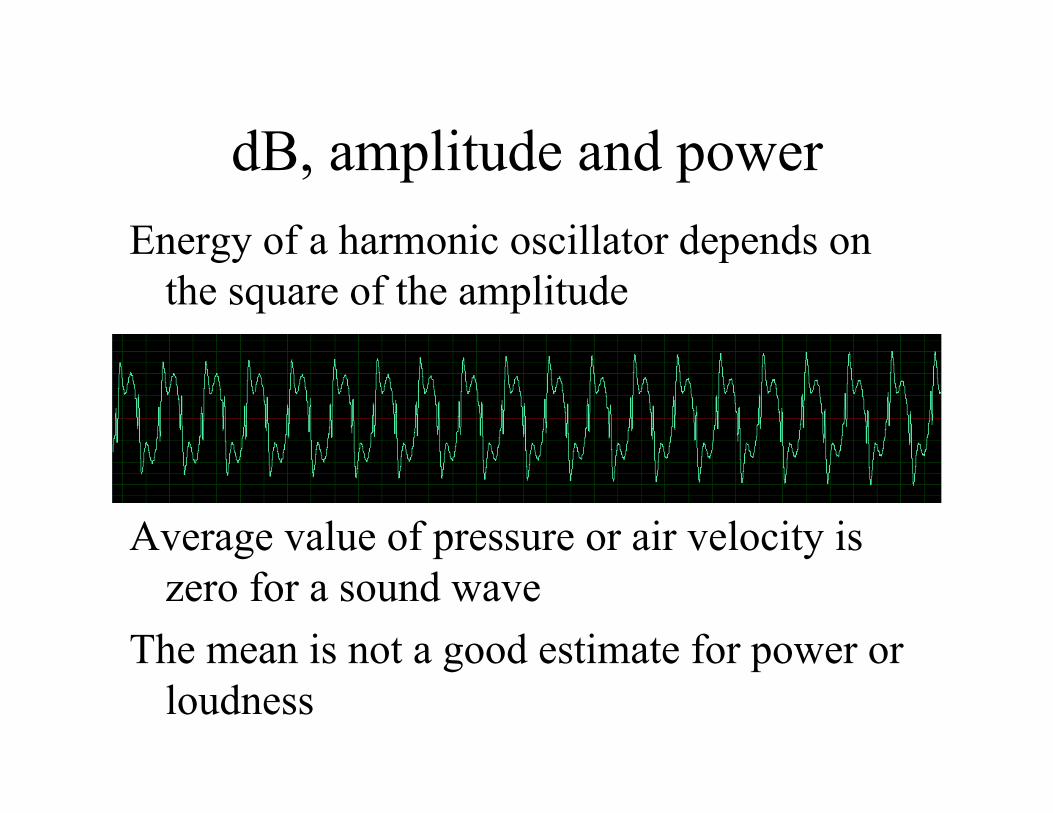
dB, amplitude and power Energy of a harmonic oscillator depends on
the square of the amplitude
Average value of pressure or air velocity is zero for a sound wave
The mean is not a good estimate for power or loudness
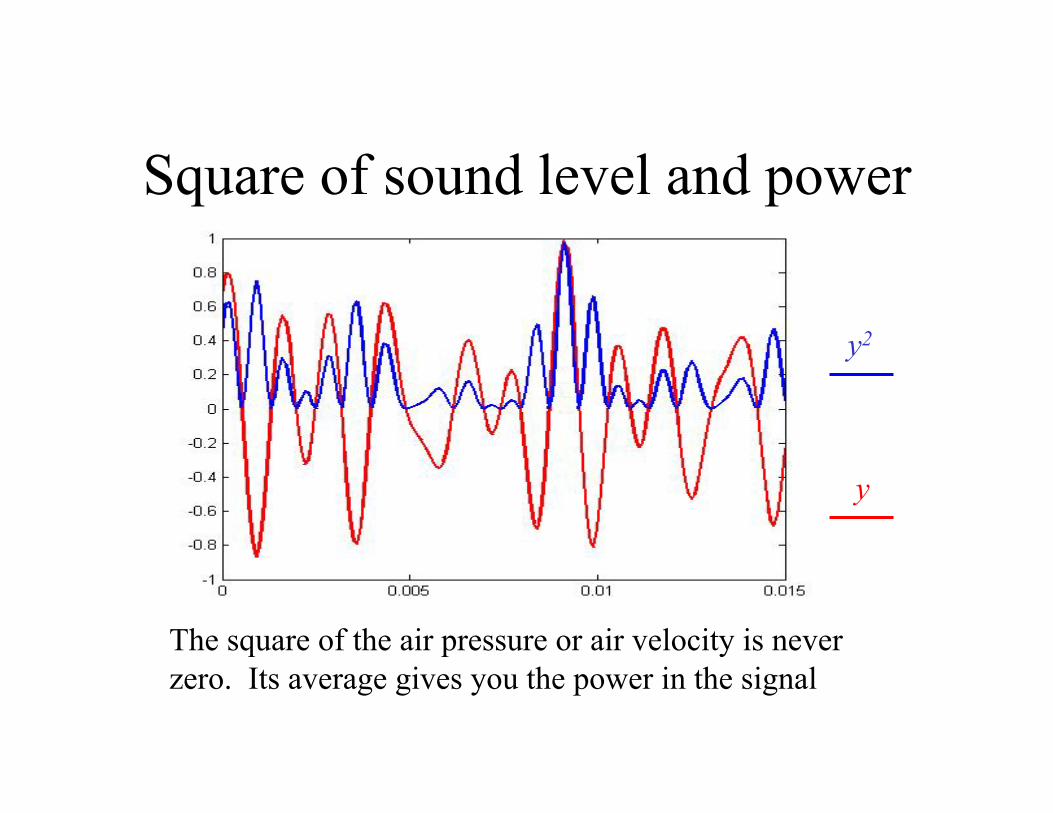
Square of sound level and power
y2
y
The square of the air pressure or air velocity is never zero. Its average gives you the power in the signal
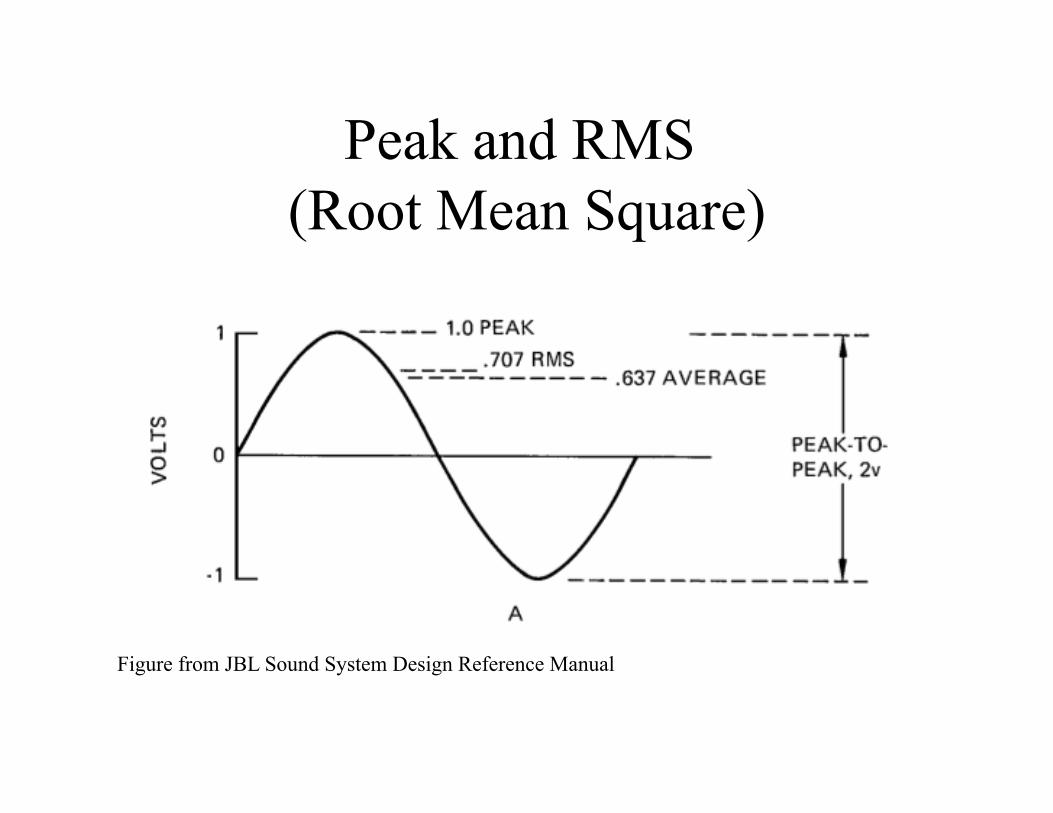
Peak and RMS (Root Mean Square)
Figure from JBL Sound System Design Reference Manual
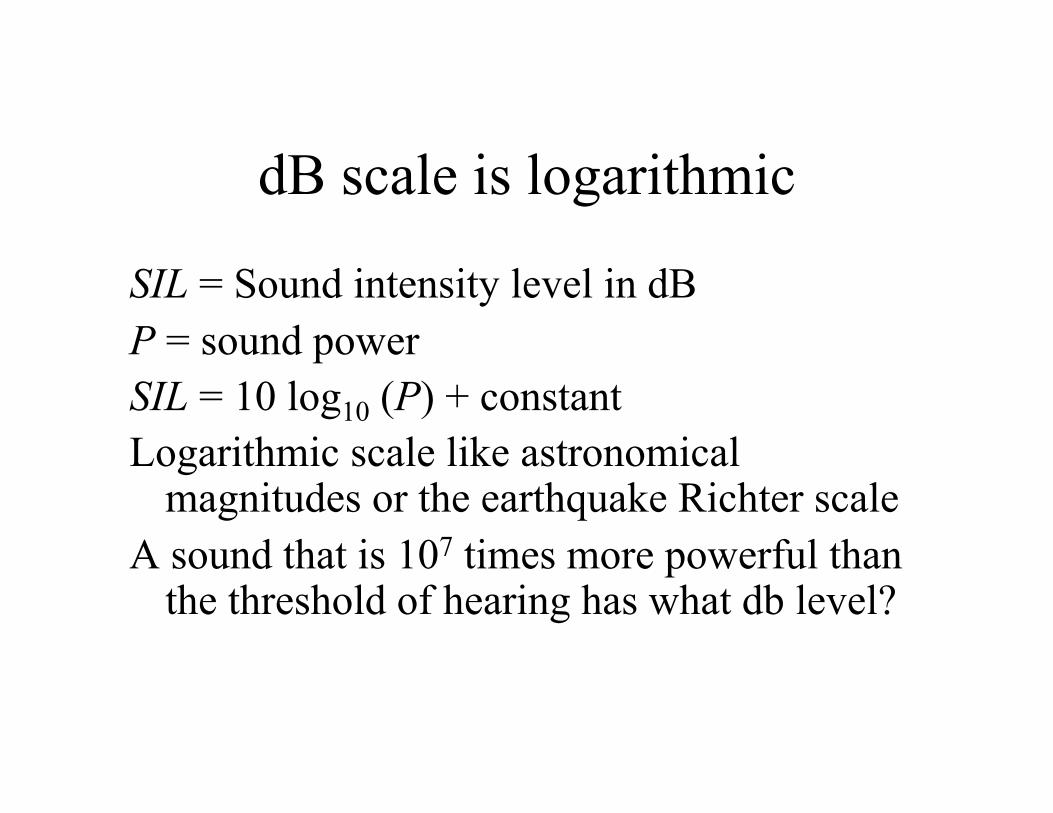
dB scale is logarithmic
SIL = Sound intensity level in dB P = sound power SIL = 10 log10 (P) + constant Logarithmic scale like astronomical
magnitudes or the earthquake Richter scale A sound that is 107 times more powerful than
the threshold of hearing has what db level?
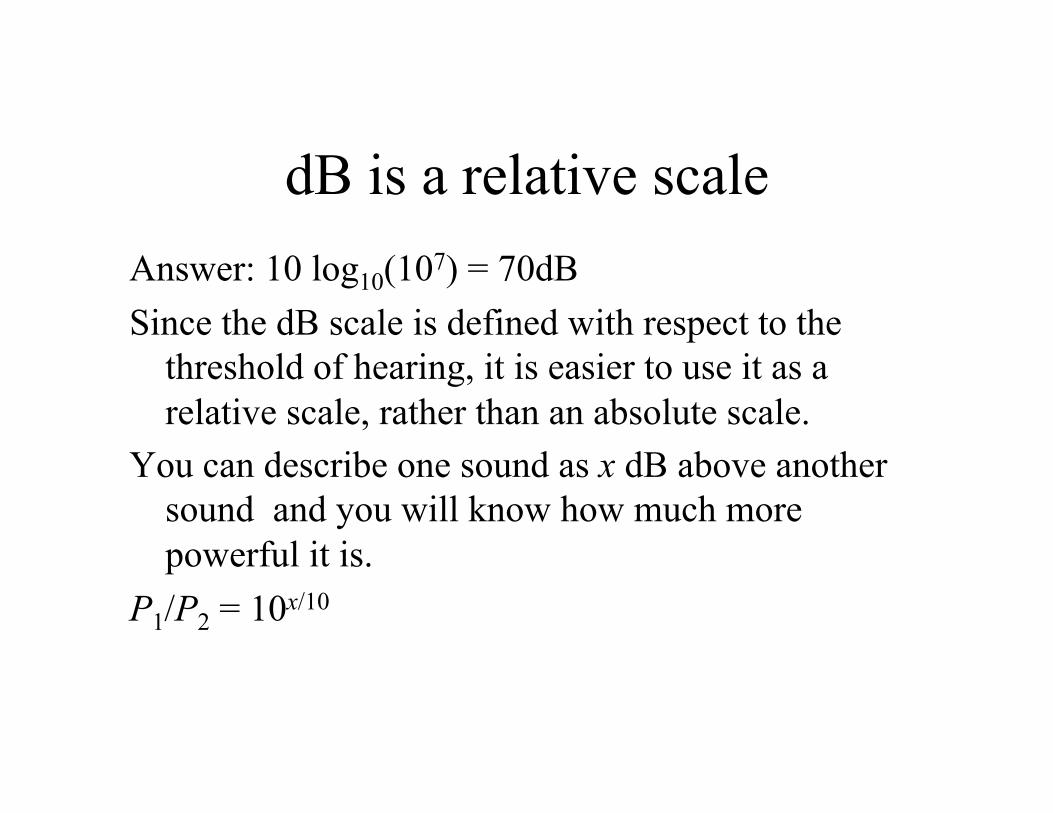
dB is a relative scale Answer: 10 log10(107) = 70dB Since the dB scale is defined with respect to the
threshold of hearing, it is easier to use it as a relative scale, rather than an absolute scale.
You can describe one sound as x dB above another sound and you will know how much more powerful it is.
P1/P2 = 10x/10
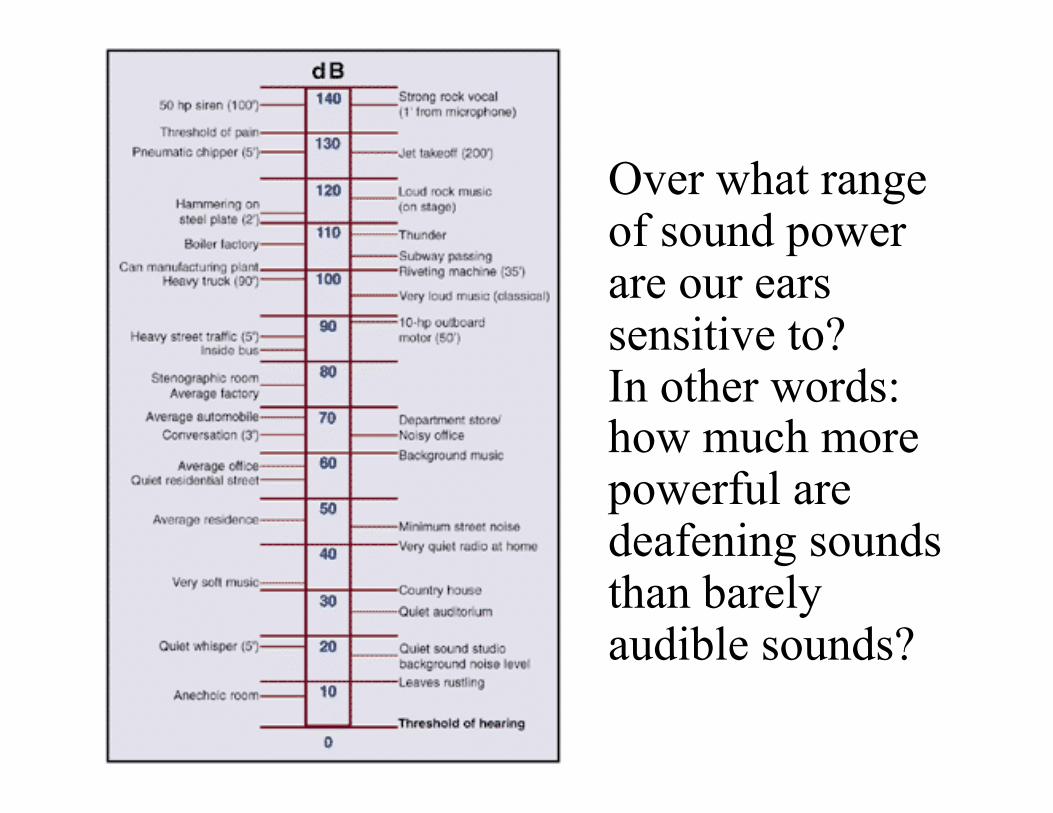
Over what range of sound power are our ears sensitive to? In other words: how much more powerful are deafening sounds than barely audible sounds?
Combining sound levels
• Supposing you have two speakers and each produces a noise of level 70dB at your location.
• What would the combined sound level be?
Combining sound levels
1) The two sounds have the same frequency and are in phase:
Amplitudes add, the total amplitude is twice that of the original signal.
The power is then 4 times original signal. The change in dB level would be
10log10(4)=6.0 70dB + 6dB = 76dB for total signal
Combining Sound Levels
2) The two signals don’t have the same frequency
They go in and out of phase. In this case the power’s add instead of the amplitudes.
We expect an increase in dB level of 10log10(2)=3.0
70dB + 3dB=73dB for total signal
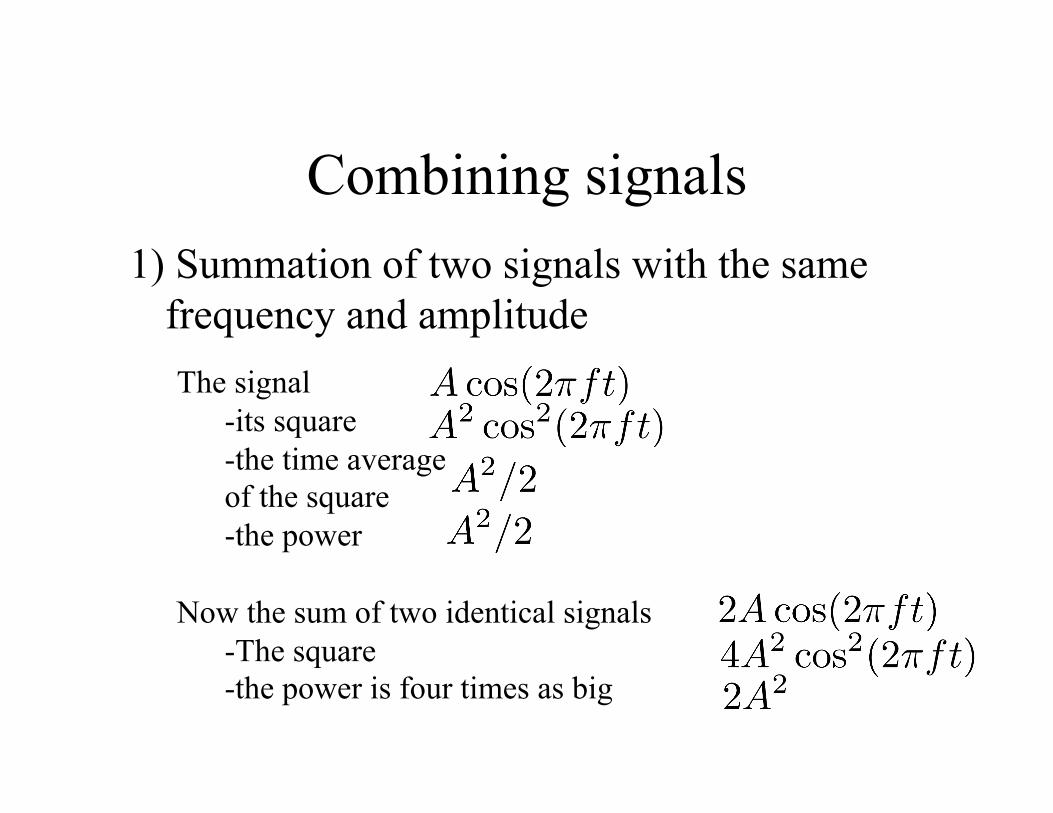
Combining signals 1) Summation of two signals with the same
frequency and amplitude The signal
-its square -the time average of the square -the power
Now the sum of two identical signals -The square -the power is four times as big
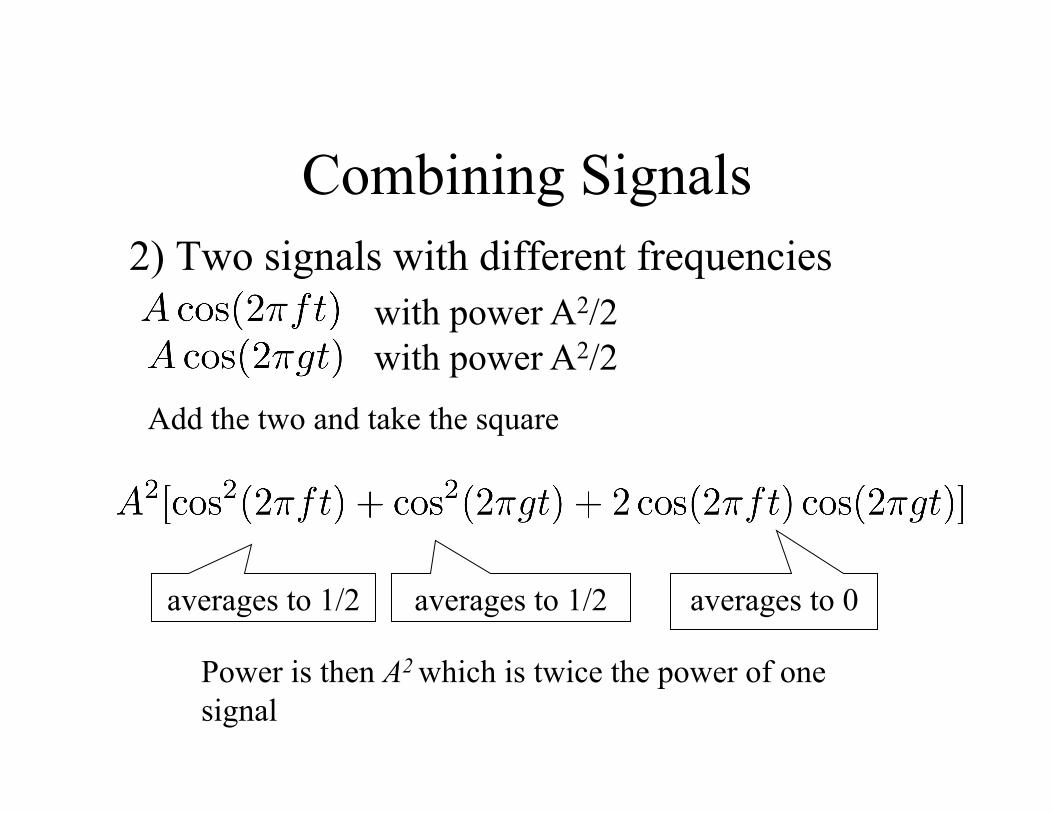
Combining Signals 2) Two signals with different frequencies
averages to 1/2 averages to 1/2 averages to 0
Power is then A2 which is twice the power of one signal
with power A2/2 with power A2/2
Add the two and take the square
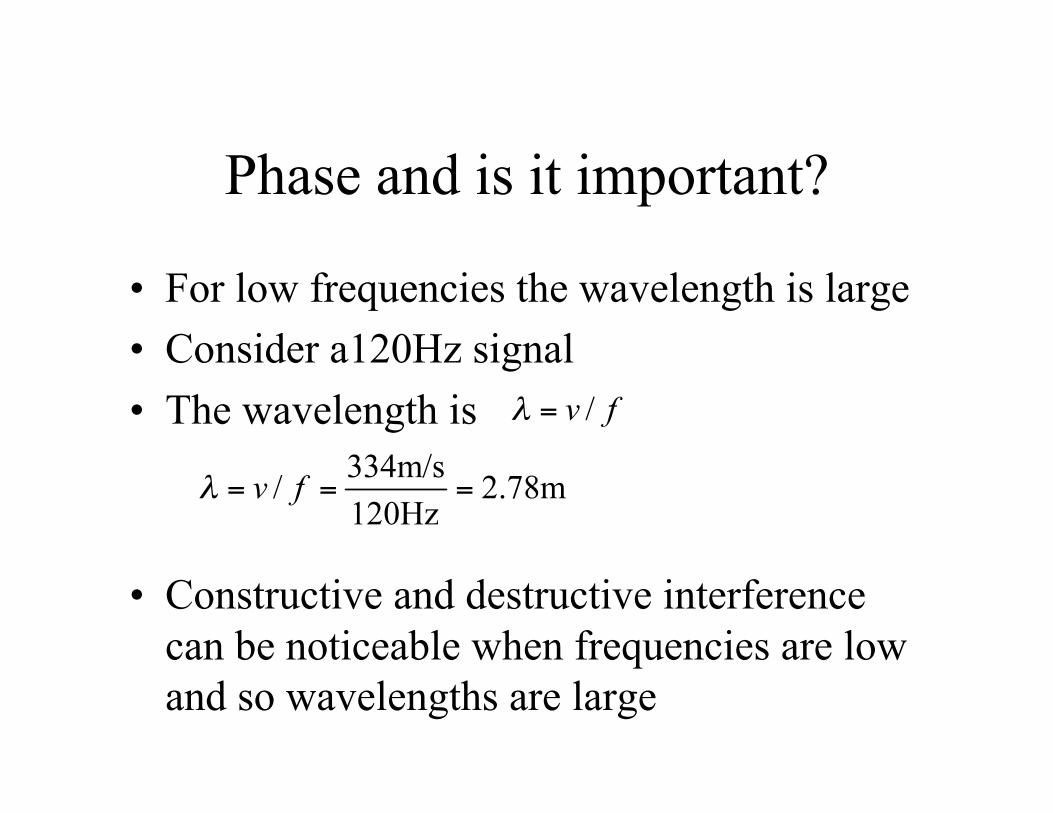
Phase and is it important?
• For low frequencies the wavelength is large • Consider a120Hz signal • The wavelength is
• Constructive and destructive interference can be noticeable when frequencies are low and so wavelengths are large
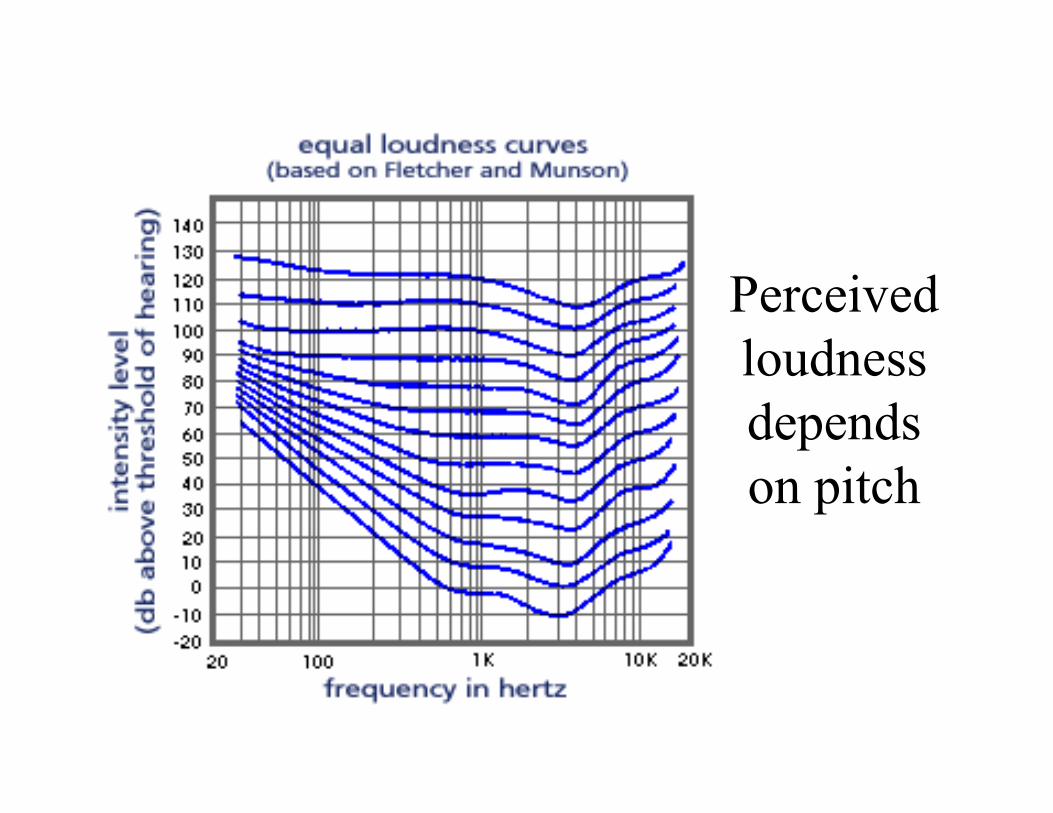
Perceived loudness depends on pitch
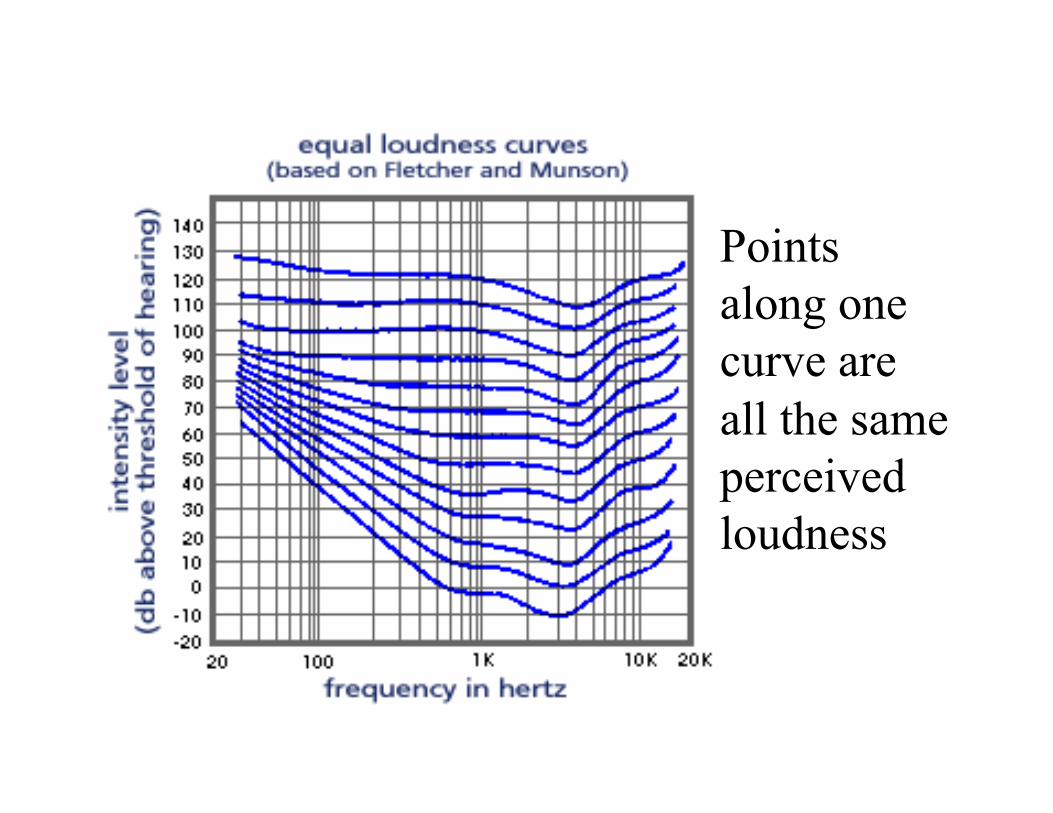
Points along one curve are all the same perceived loudness
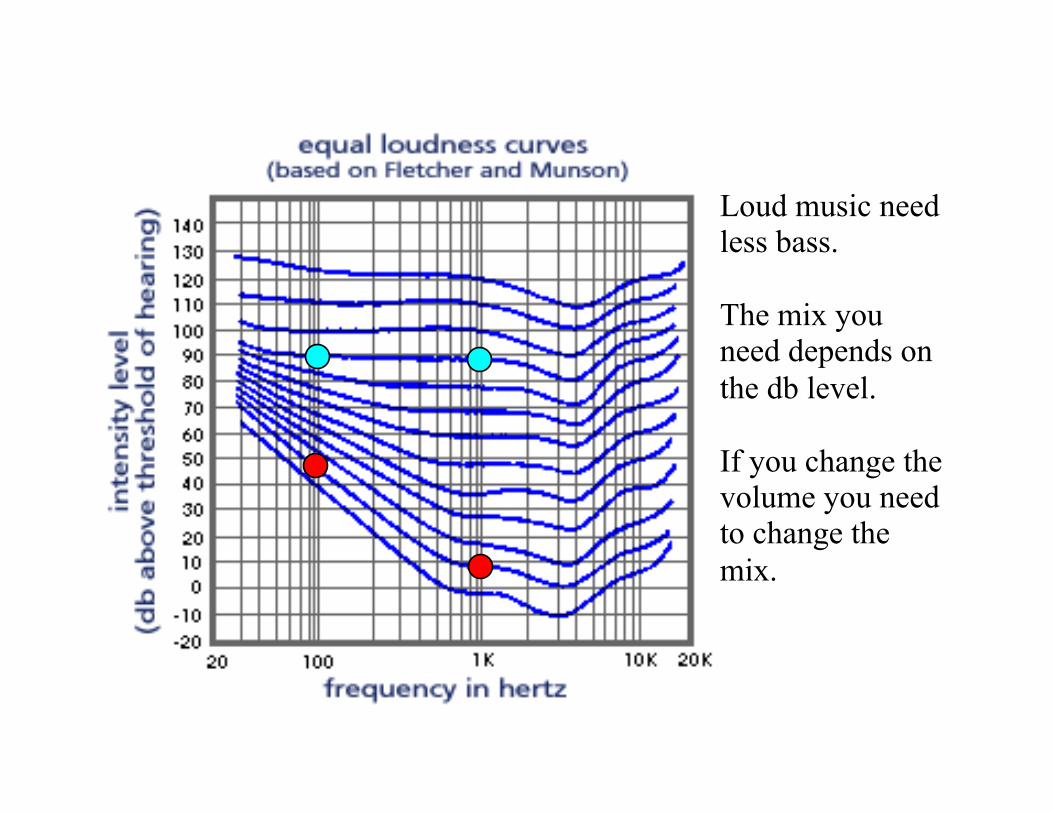
Loud music need less bass.
The mix you need depends on the db level.
If you change the volume you need to change the mix.
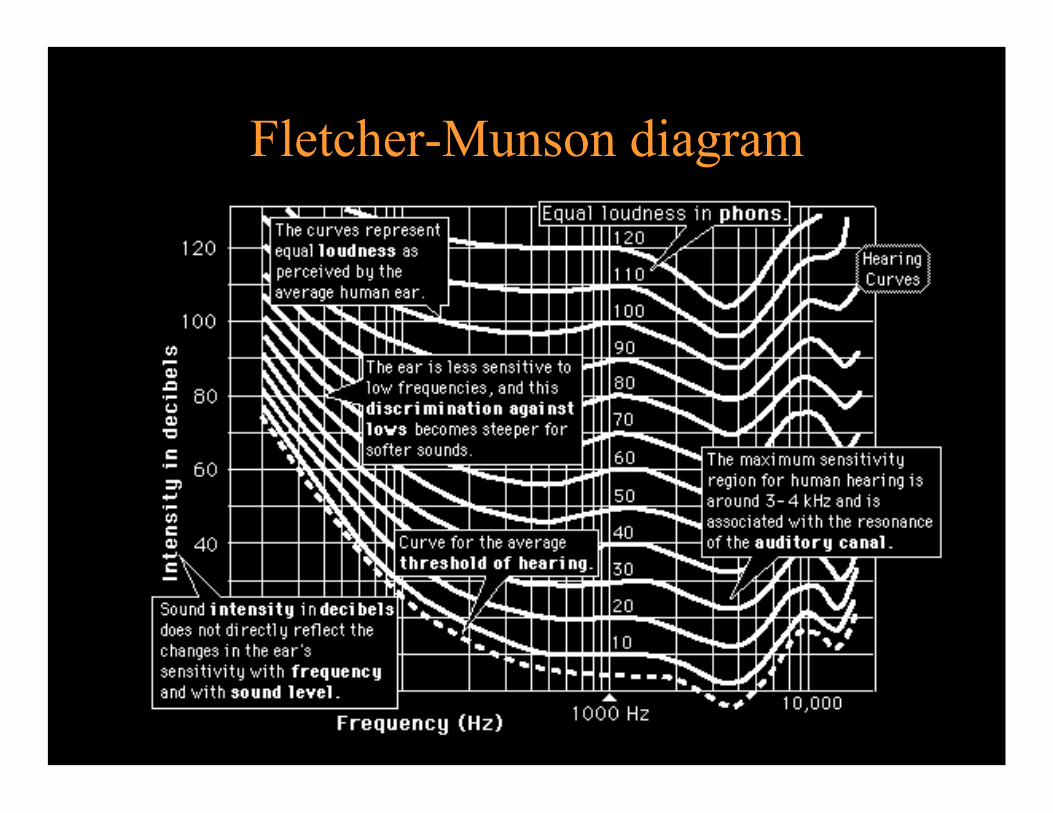
Fletcher-Munson diagram
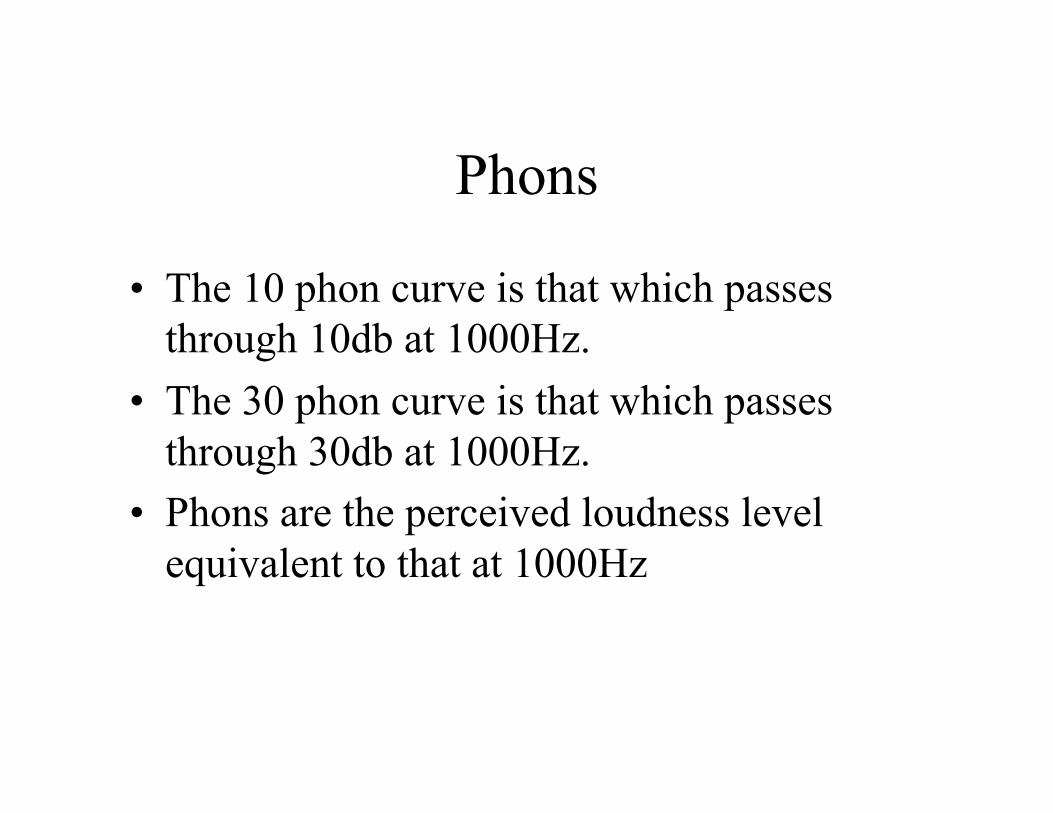
Phons
• The 10 phon curve is that which passes through 10db at 1000Hz.
• The 30 phon curve is that which passes through 30db at 1000Hz.
• Phons are the perceived loudness level equivalent to that at 1000Hz
How is the Fletcher-Munson diagram measured?
• It is a “perceived loudness” diagram? • So how would you carry out an experiment to
measure this?
Done with sine waves. Psychoacoustic experiments: 1) Matching the volume of one sound to that of
another with a fixed frequency and volume (reference sound)
2) Rating sounds on a numerical scale (magnitude estimation
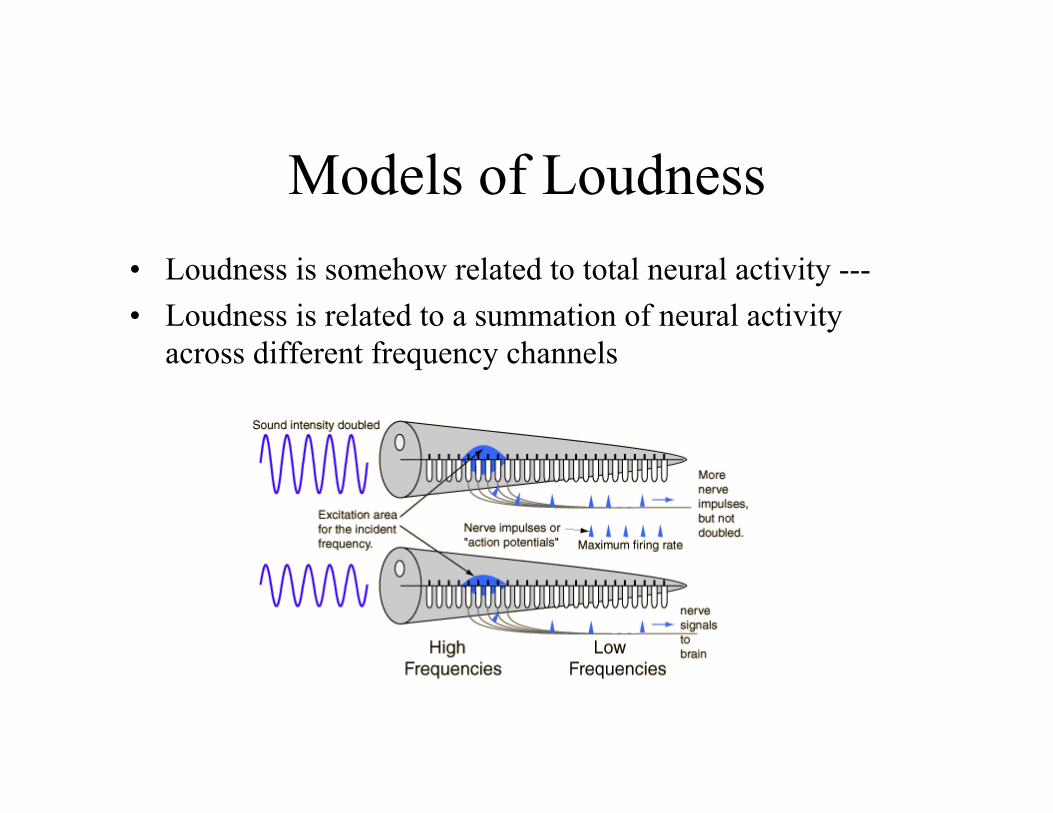
Models of Loudness • Loudness is somehow related to total neural activity --- • Loudness is related to a summation of neural activity
across different frequency channels
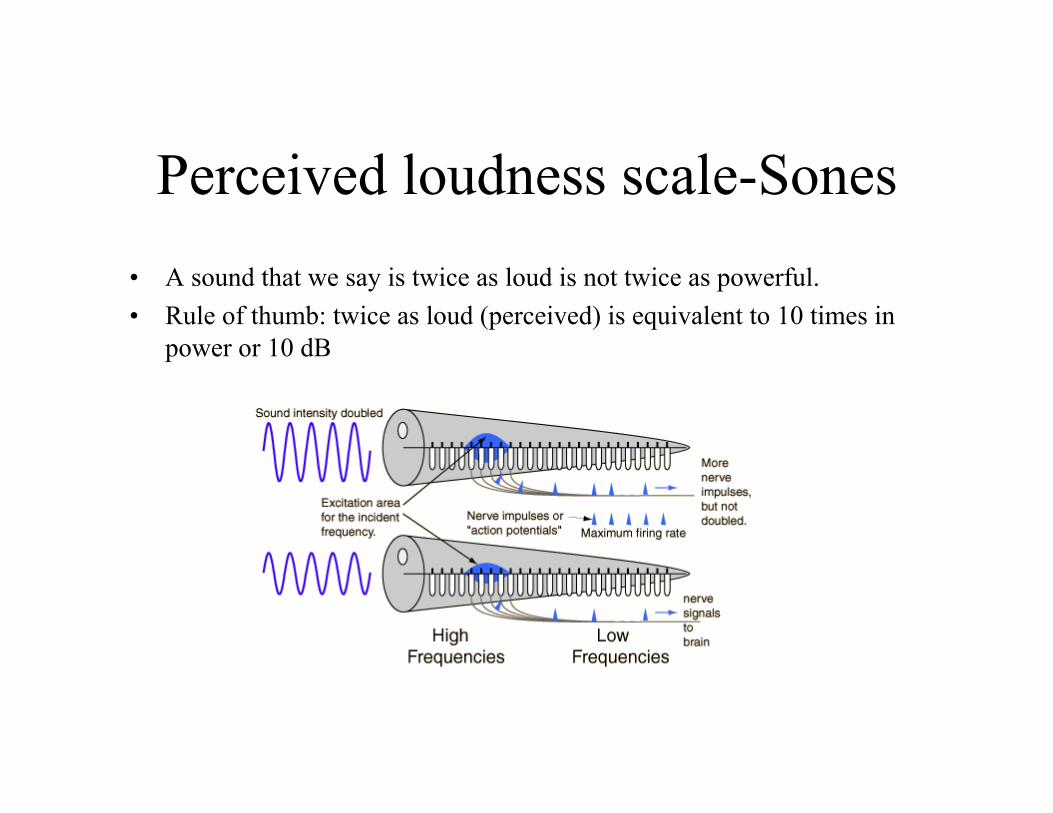
Perceived loudness scale-Sones • A sound that we say is twice as loud is not twice as powerful. • Rule of thumb: twice as loud (perceived) is equivalent to 10 times in
power or 10 dB
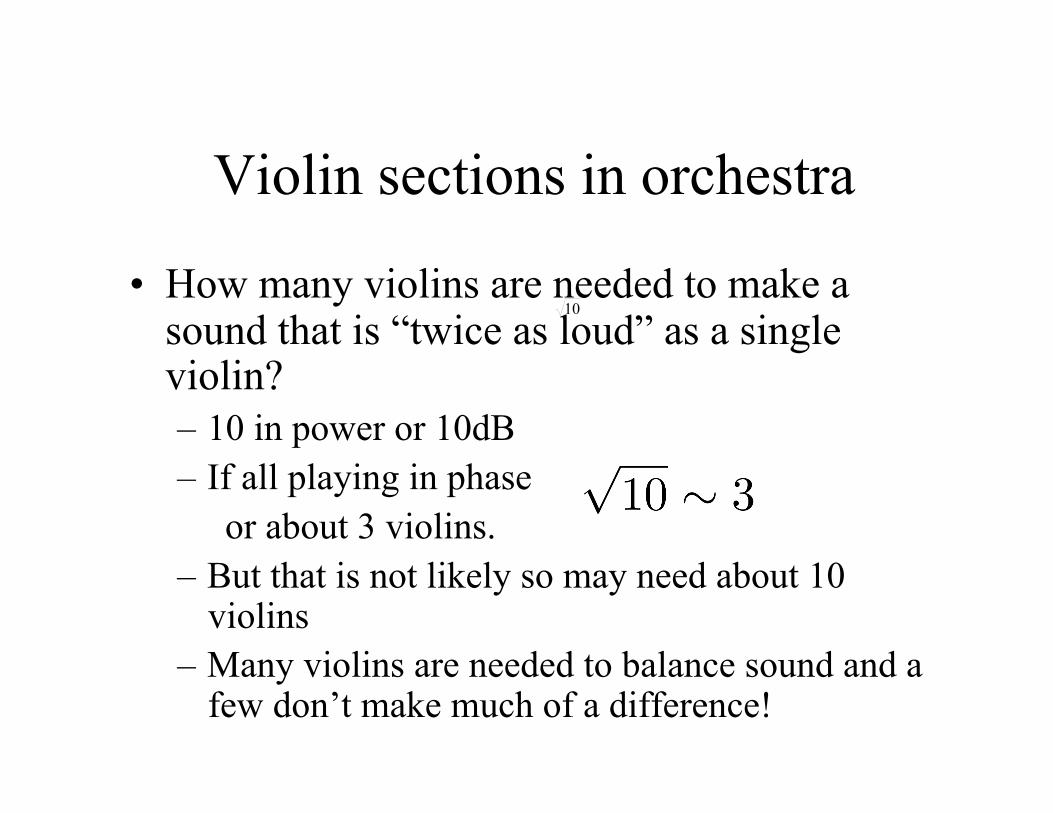
Violin sections in orchestra
• How many violins are needed to make a sound that is “twice as loud” as a single violin? – 10 in power or 10dB – If all playing in phase
or about 3 violins. – But that is not likely so may need about 10
violins – Many violins are needed to balance sound and a
few don’t make much of a difference!
Dynamic range
• Threshold of pain is about 140 dB above the threshold of hearing.
• A difference of 1014 in power. • How is this large range achieved?
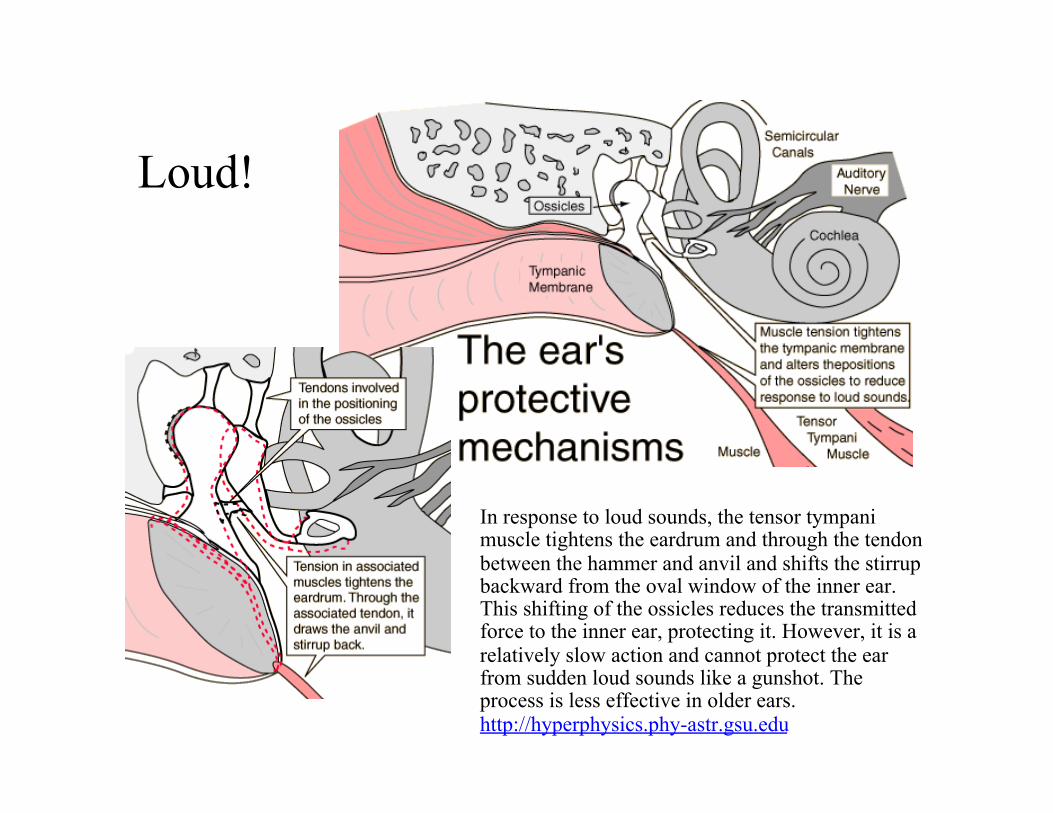
In response to loud sounds, the tensor tympani muscle tightens the eardrum and through the tendon between the hammer and anvil and shifts the stirrup backward from the oval window of the inner ear. This shifting of the ossicles reduces the transmitted force to the inner ear, protecting it. However, it is a relatively slow action and cannot protect the ear from sudden loud sounds like a gunshot. The process is less effective in older ears. http://hyperphysics.phy-astr.gsu.edu
Loud!
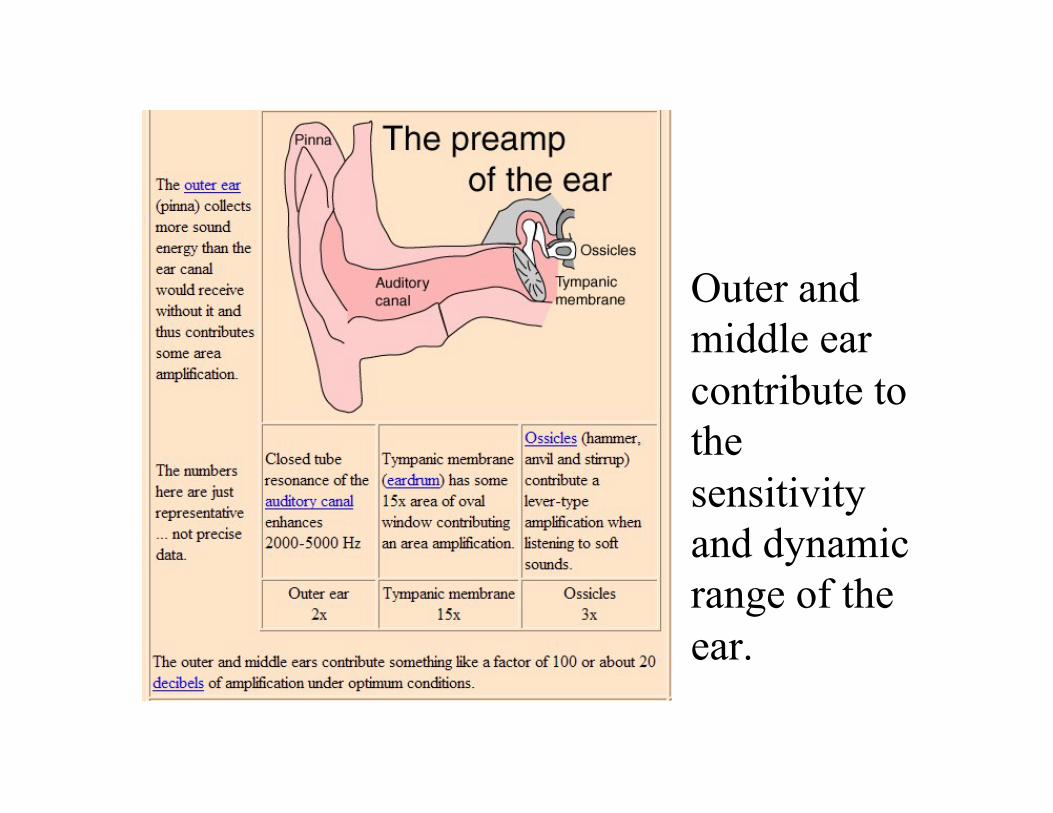
Outer and middle ear contribute to the sensitivity and dynamic range of the ear.
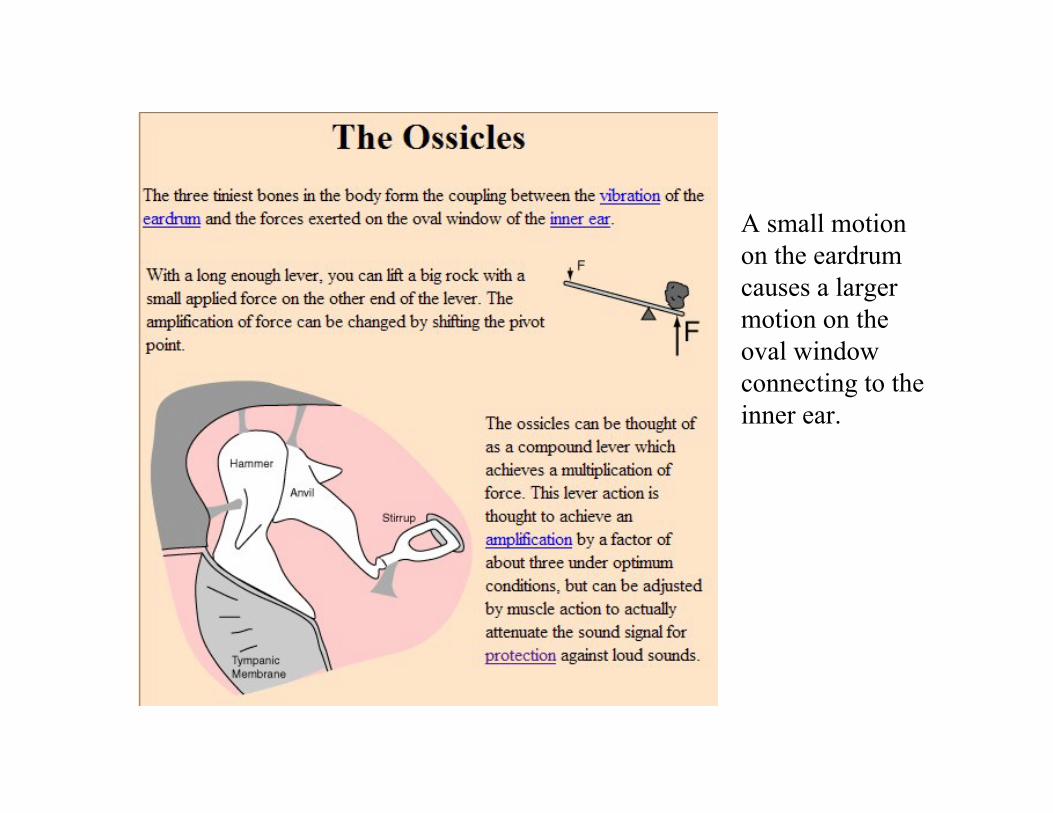
A small motion on the eardrum causes a larger motion on the oval window connecting to the inner ear.
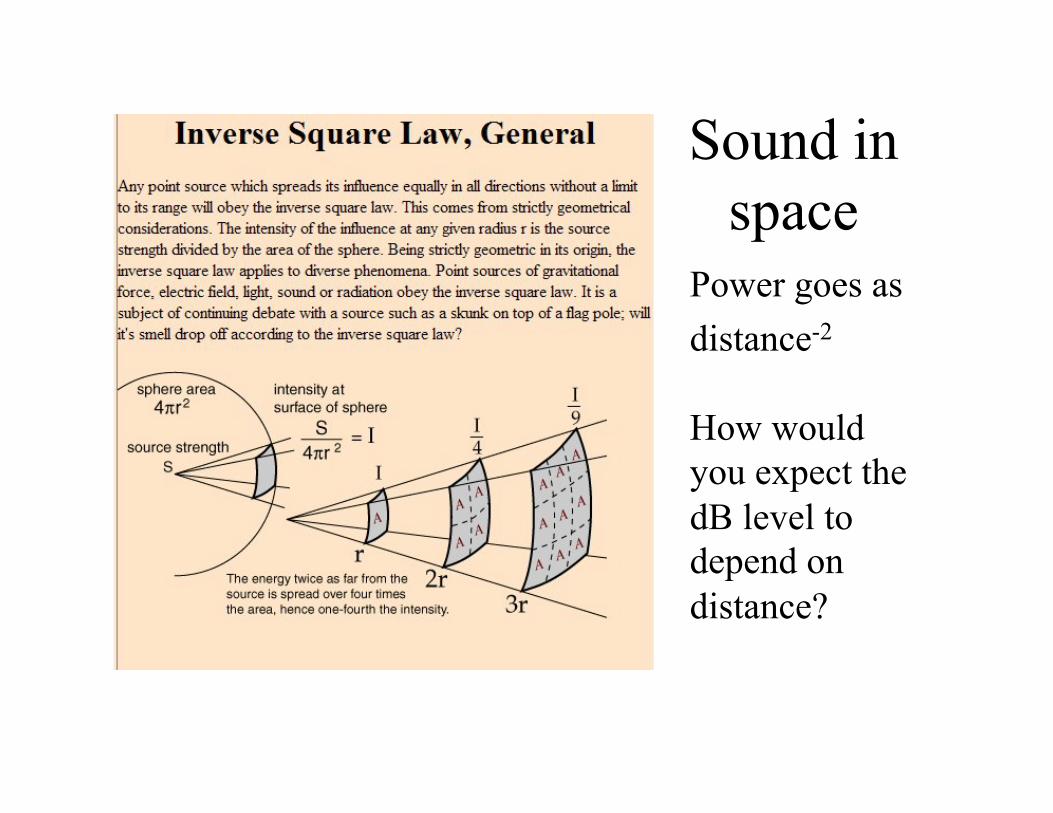
Sound in space
Power goes as distance-2
How would you expect the dB level to depend on distance?
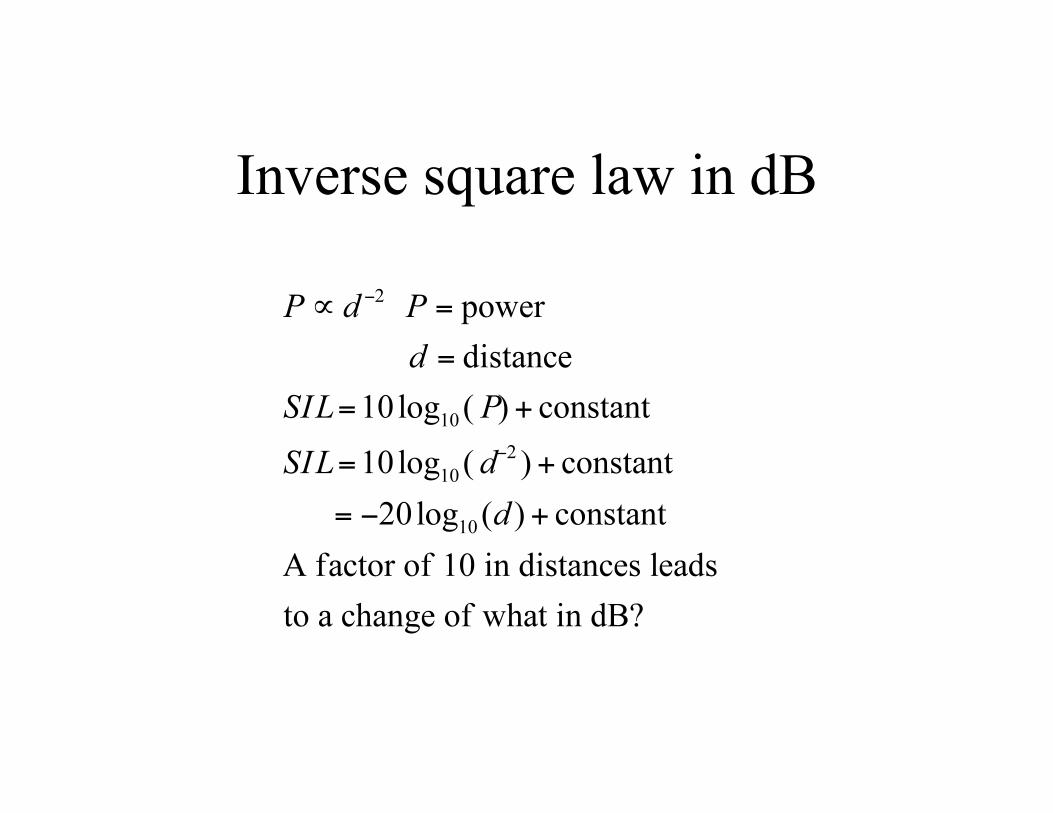
Inverse square law in dB
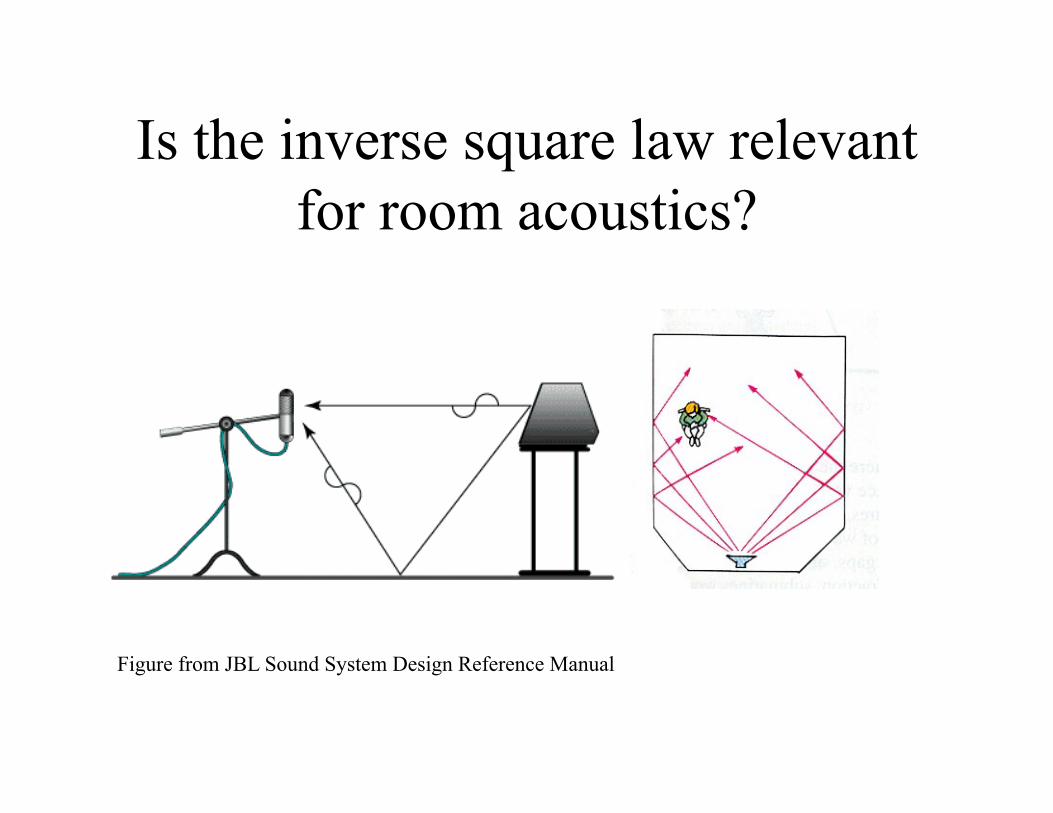
Is the inverse square law relevant for room acoustics?
Figure from JBL Sound System Design Reference Manual
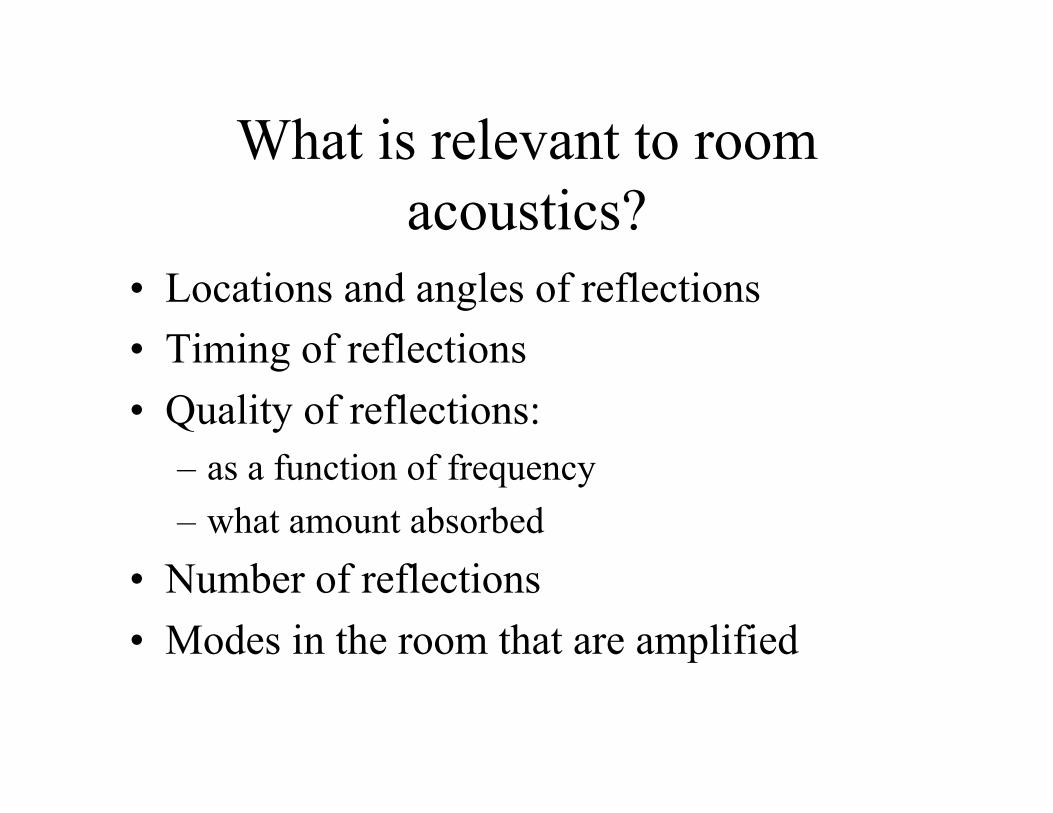
What is relevant to room acoustics?
• Locations and angles of reflections • Timing of reflections • Quality of reflections:
– as a function of frequency – what amount absorbed
• Number of reflections • Modes in the room that are amplified
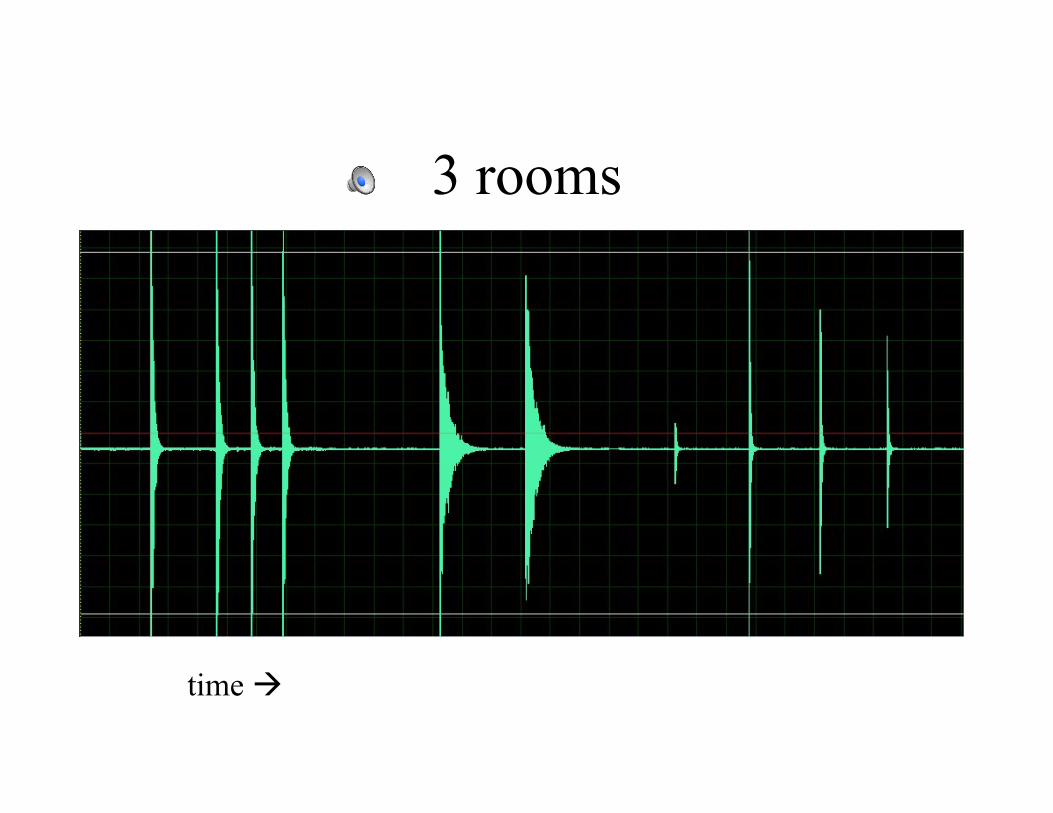
3 rooms
time !
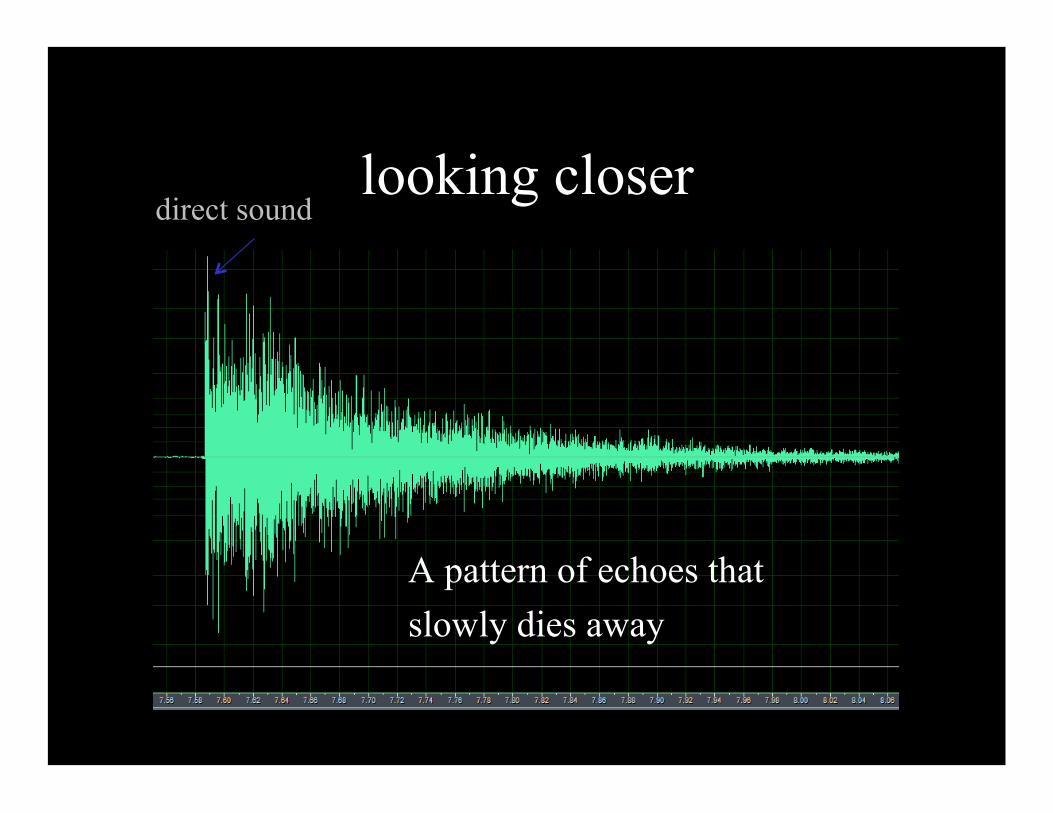
looking closer
A pattern of echoes that slowly dies away
direct sound
Timing of echos
• Speed of sound is 340m/s. • 1/340 ~ 0.003 ~ 3ms • 3 milliseconds per meter. • Echo across a room of 10m is 30ms. • Decay rates related to the travel time across
a room.
Effect of Echoes
• ASAdemo 35 Speech in 3 rooms and played backwards so echoes are more clearly heard
• Echo suppression
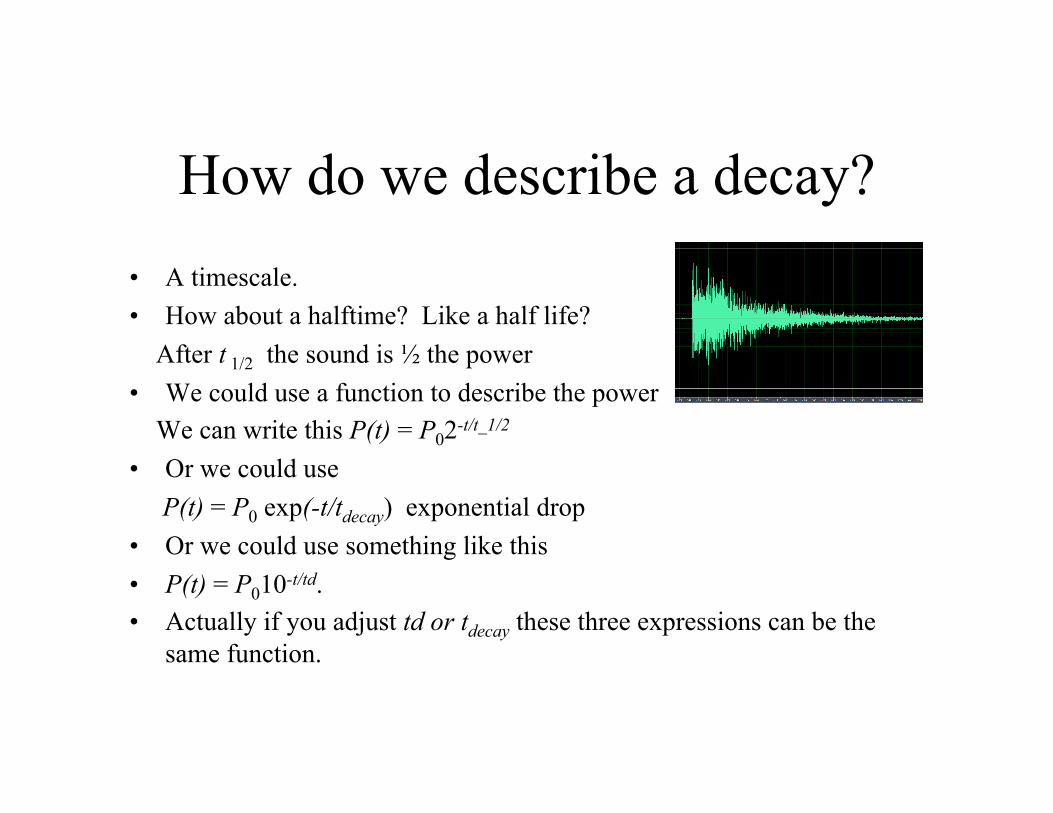
How do we describe a decay? • A timescale. • How about a halftime? Like a half life? After t 1/2 the sound is ½ the power • We could use a function to describe the power We can write this P(t) = P02-t/t_1/2
• Or we could use P(t) = P0 exp(-t/tdecay) exponential drop • Or we could use something like this • P(t) = P010-t/td. • Actually if you adjust td or tdecay these three expressions can be the
same function.
An exponential decay
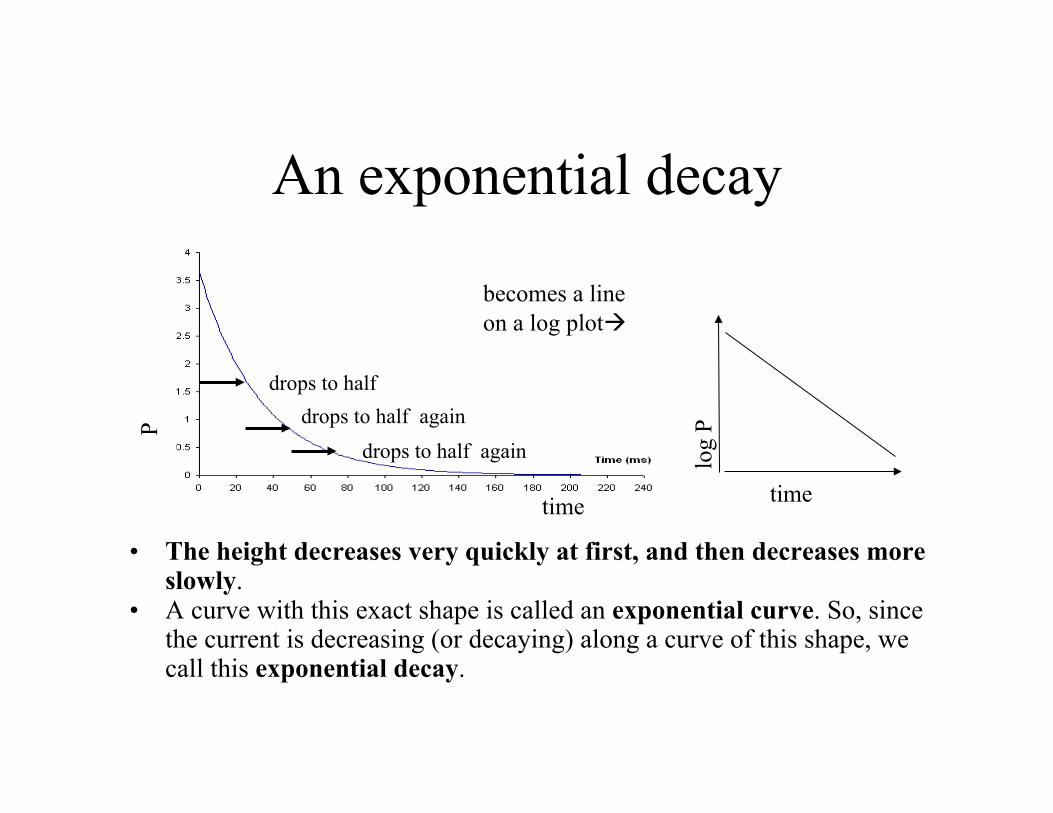
• The height decreases very quickly at first, and then decreases more slowly.
• A curve with this exact shape is called an exponential curve. So, since the current is decreasing (or decaying) along a curve of this shape, we call this exponential decay.
drops to half
drops to half again drops to half again
P
becomes a line on a log plot!
log
P
time time
Measuring a half life
• Suppose we measure power in dB. How many dB change corresponds to twice the power?
• 10log102 ~ 3.0dB • Measure the time it takes to drop in power
by 3dB and that corresponds to the t1/2.
Room acoustics
• It is now recognized that the most important property of a room is its reverberation time.
• This is the timescale setting the decay time, or the half time of acoustic power in the room
• Surfaces absorb sound so the echoes get weaker and weaker.
• The reverberation time depends on the size of the room and the way the surfaces absorb sound.
• Larger rooms have longer reverberation times. • More absorptive rooms have shorter reverberation times.
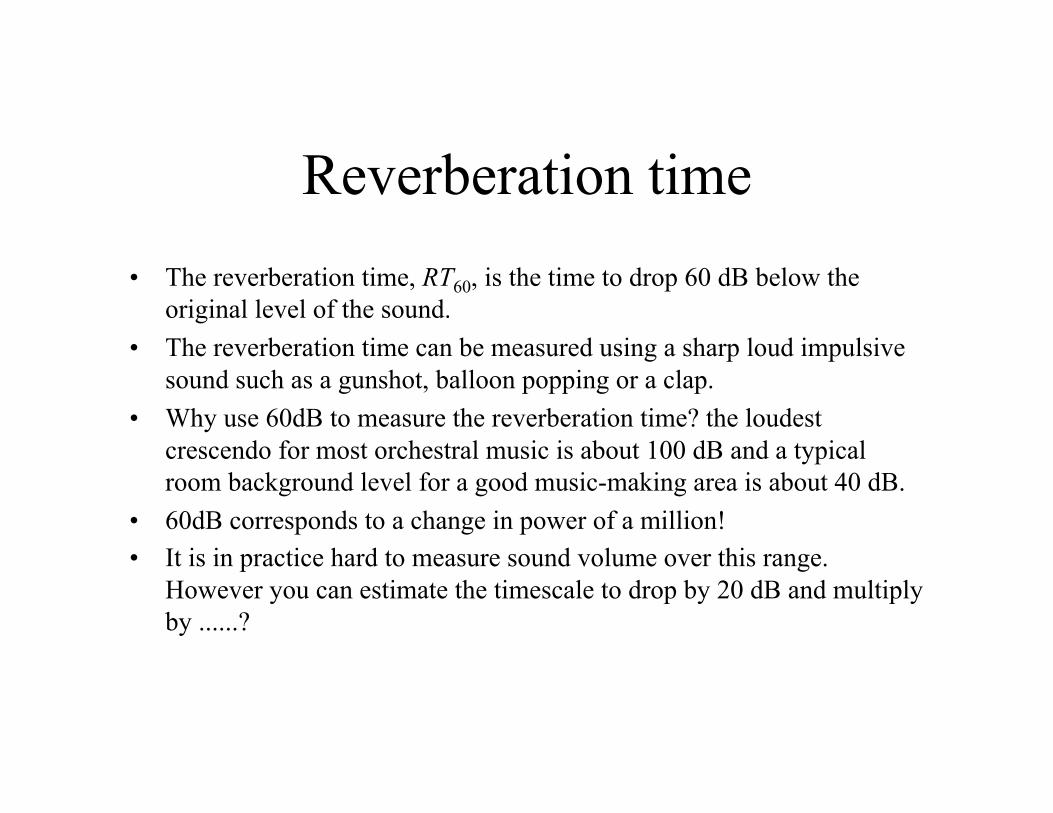
Reverberation time • The reverberation time, RT60, is the time to drop 60 dB below the
original level of the sound. • The reverberation time can be measured using a sharp loud impulsive
sound such as a gunshot, balloon popping or a clap. • Why use 60dB to measure the reverberation time? the loudest
crescendo for most orchestral music is about 100 dB and a typical room background level for a good music-making area is about 40 dB.
• 60dB corresponds to a change in power of a million! • It is in practice hard to measure sound volume over this range.
However you can estimate the timescale to drop by 20 dB and multiply by ......?
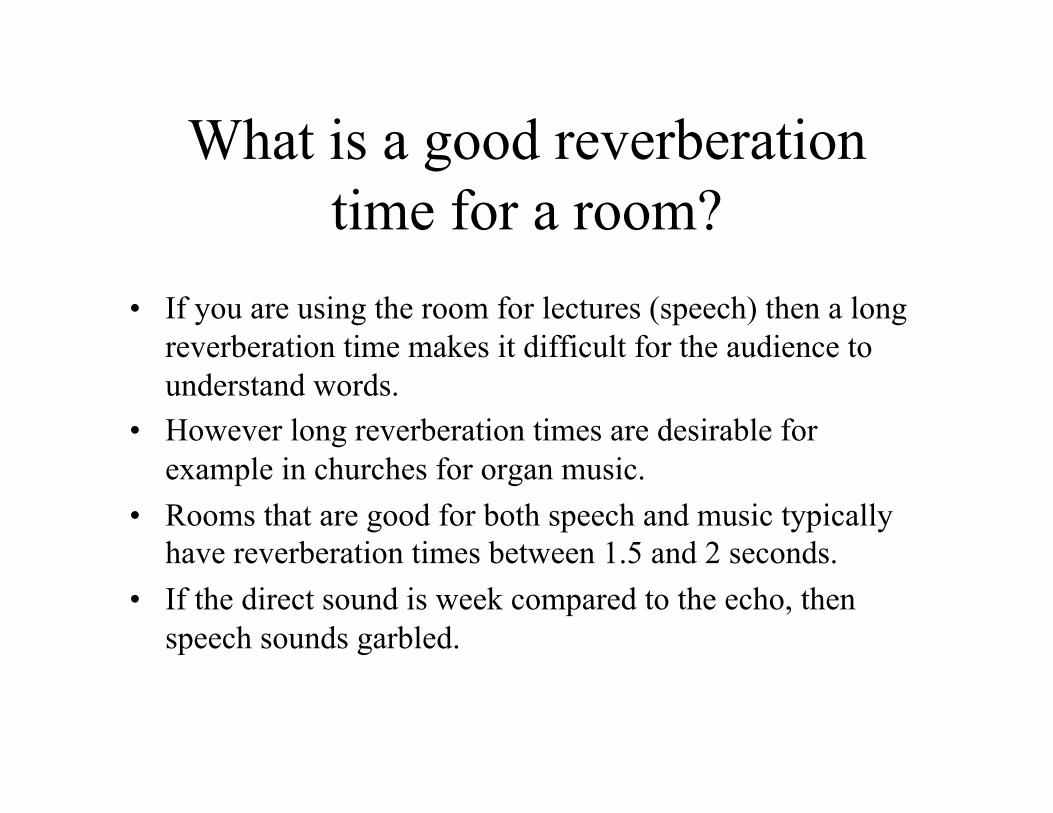
What is a good reverberation time for a room?
• If you are using the room for lectures (speech) then a long reverberation time makes it difficult for the audience to understand words.
• However long reverberation times are desirable for example in churches for organ music.
• Rooms that are good for both speech and music typically have reverberation times between 1.5 and 2 seconds.
• If the direct sound is week compared to the echo, then speech sounds garbled.
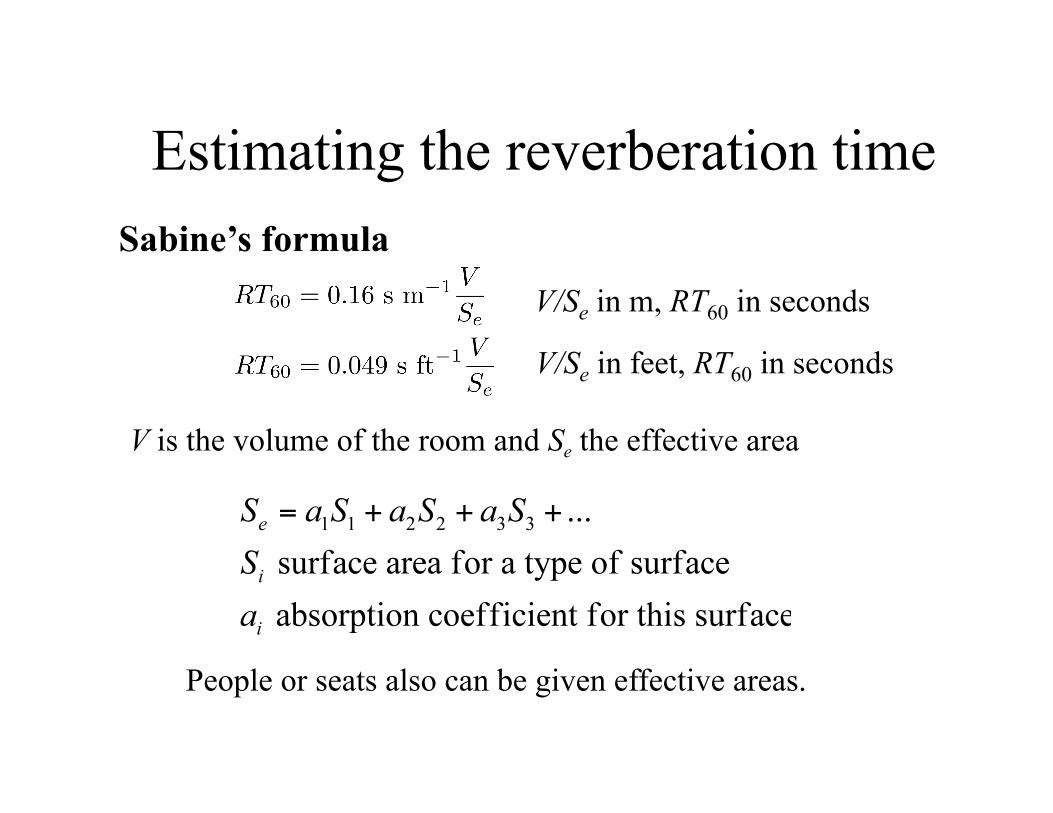
Estimating the reverberation time
V is the volume of the room and Se the effective area
V/Se in m, RT60 in seconds
Sabine’s formula
V/Se in feet, RT60 in seconds
People or seats also can be given effective areas.
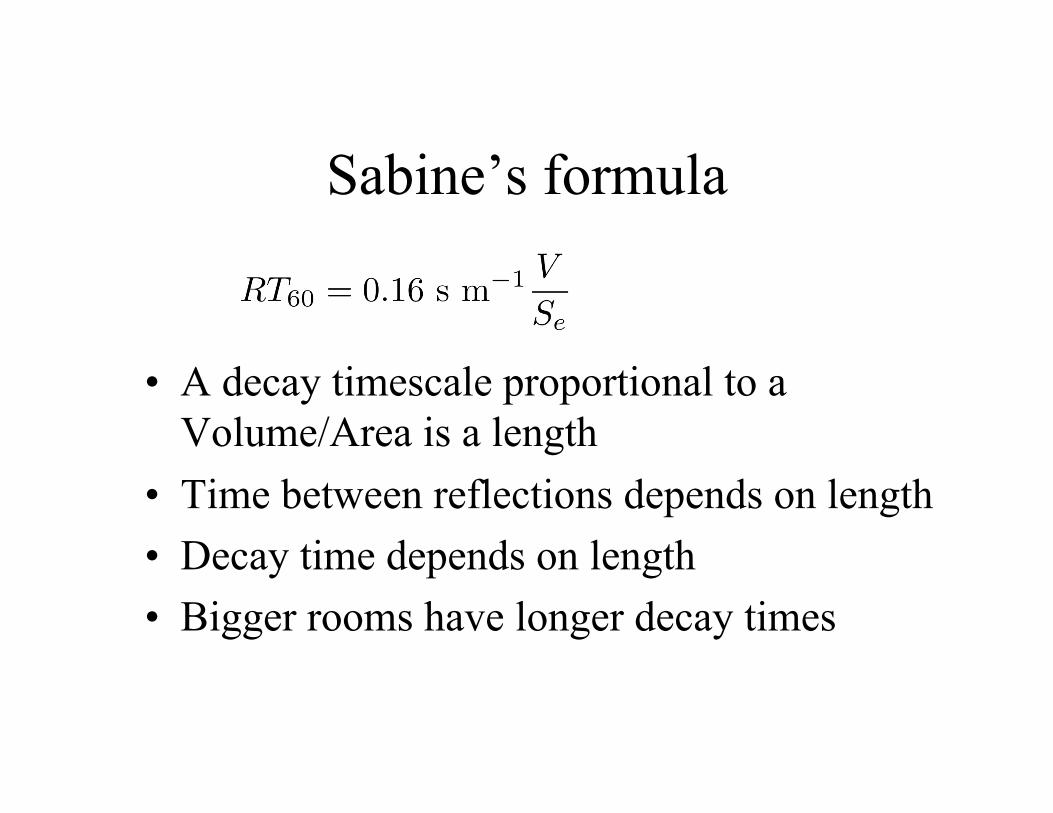
Sabine’s formula
• A decay timescale proportional to a Volume/Area is a length
• Time between reflections depends on length • Decay time depends on length • Bigger rooms have longer decay times
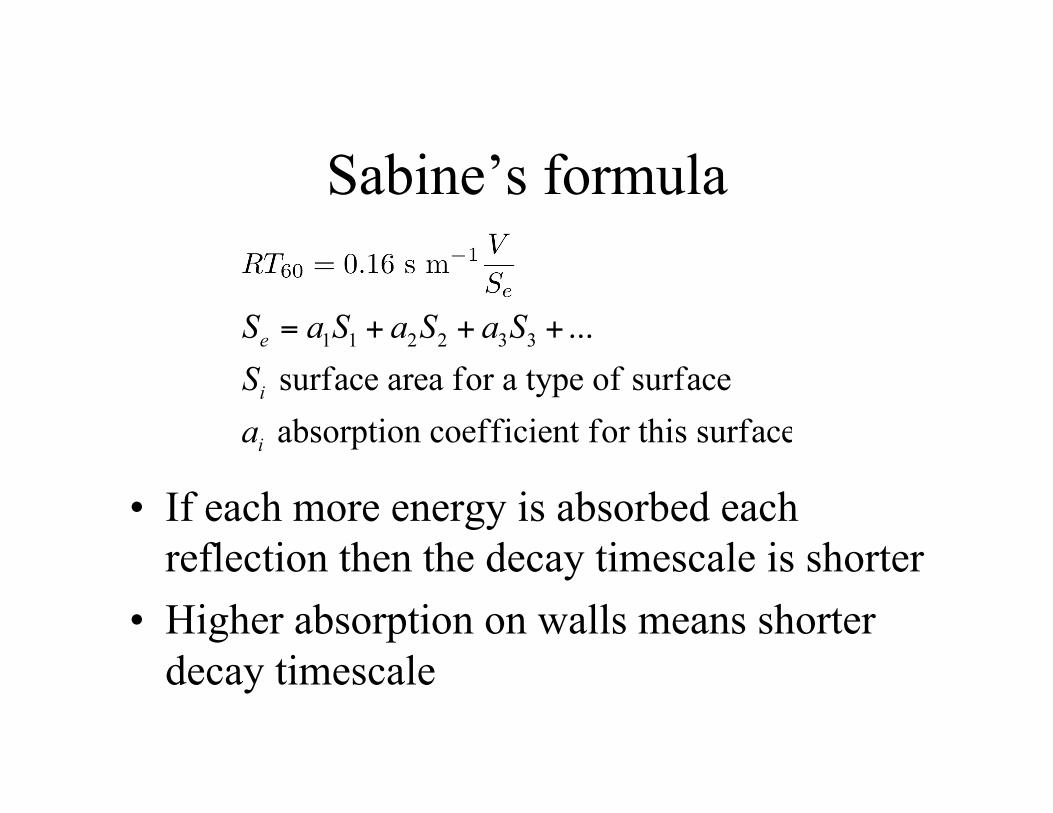
Sabine’s formula
• If each more energy is absorbed each reflection then the decay timescale is shorter
• Higher absorption on walls means shorter decay timescale
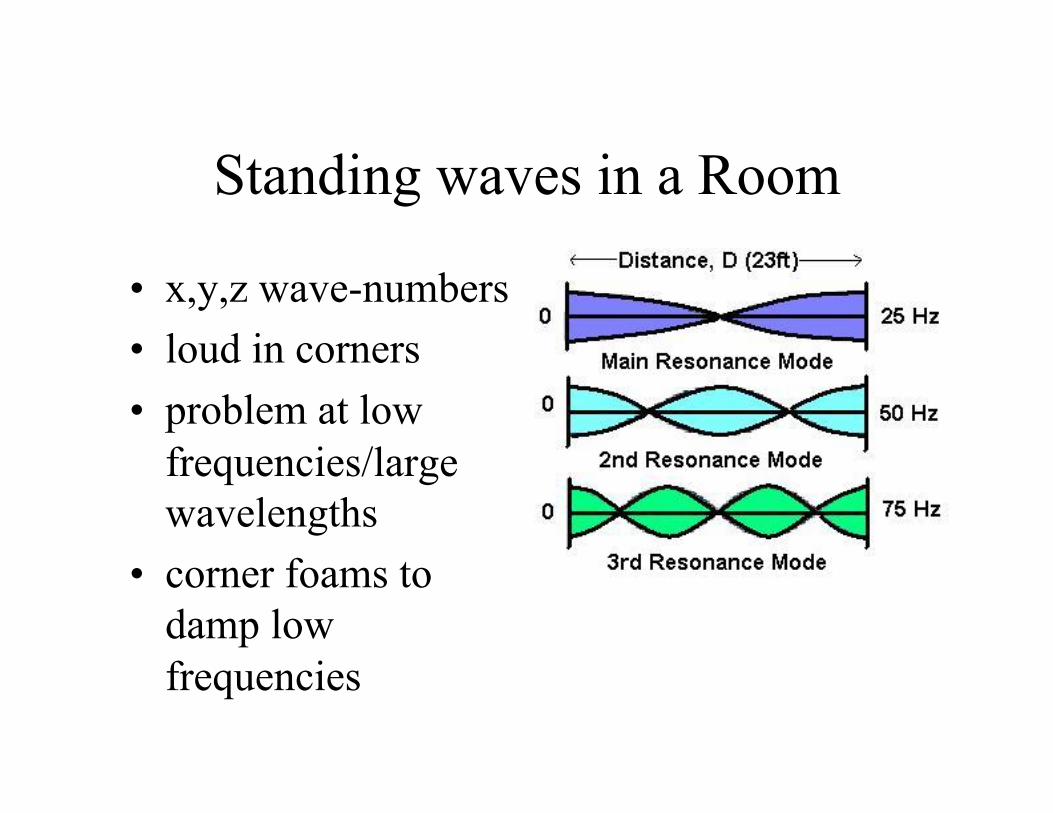
Standing waves in a Room
• x,y,z wave-numbers • loud in corners • problem at low
frequencies/large wavelengths
• corner foams to damp low frequencies
Just Noticeable Differences
• JND in Sound Intensity • A useful general reference is that the just
noticeable difference in sound intensity for the human ear is about 1 decibel.
• JND = 1 decibel • In fact, the use of the factor of 10 in the definition
of the decibel is to create a unit which is about the least detectable change in sound intensity.
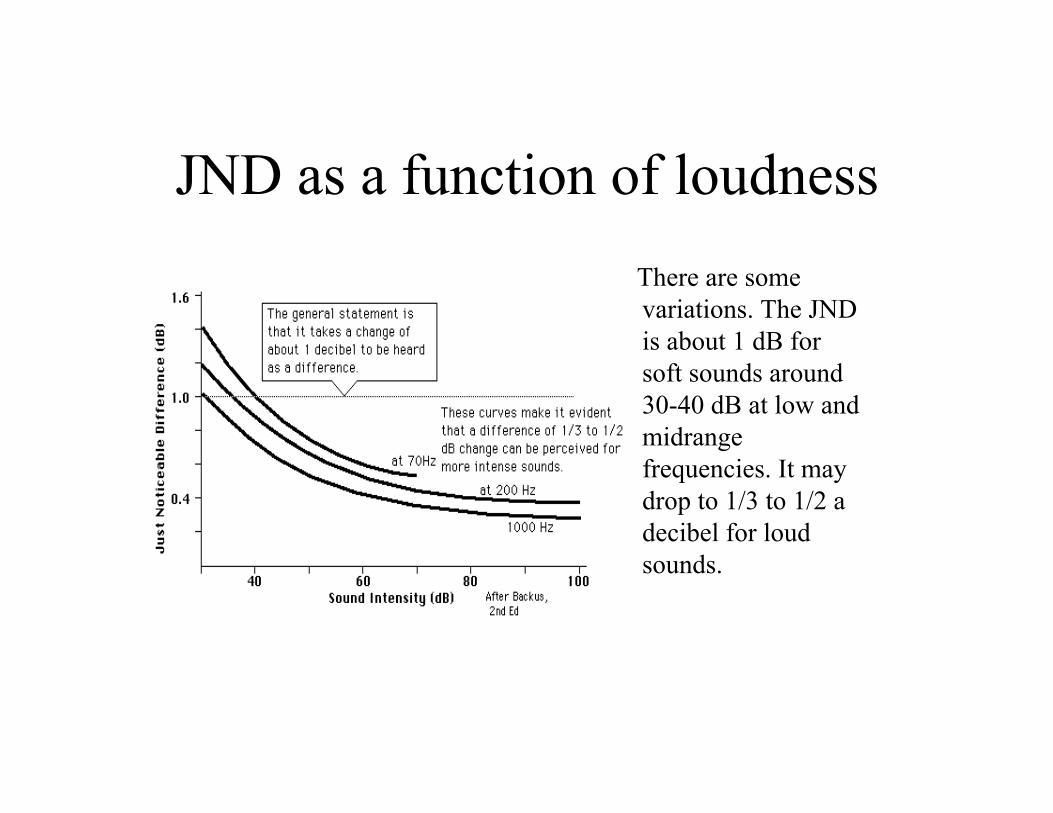
JND as a function of loudness There are some variations. The JND is about 1 dB for soft sounds around 30-40 dB at low and midrange frequencies. It may drop to 1/3 to 1/2 a decibel for loud sounds.
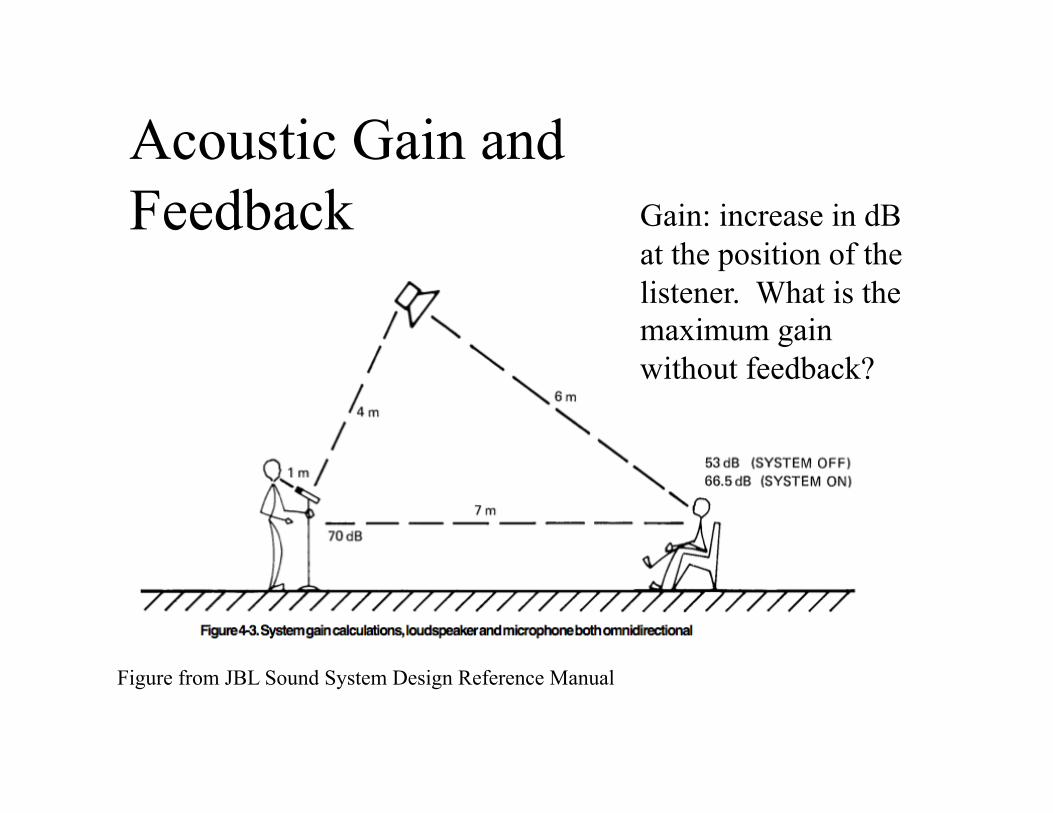
Acoustic Gain and Feedback
Figure from JBL Sound System Design Reference Manual
Gain: increase in dB at the position of the listener. What is the maximum gain without feedback?
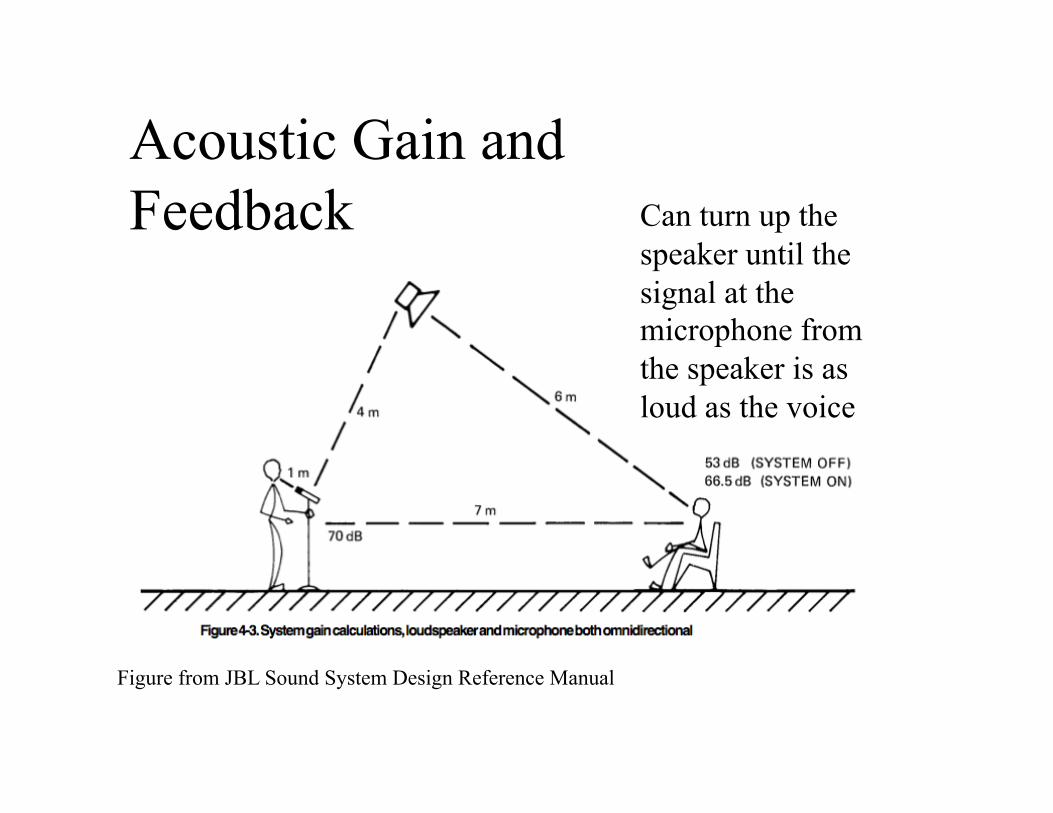
Acoustic Gain and Feedback
Figure from JBL Sound System Design Reference Manual
Can turn up the speaker until the signal at the microphone from the speaker is as loud as the voice
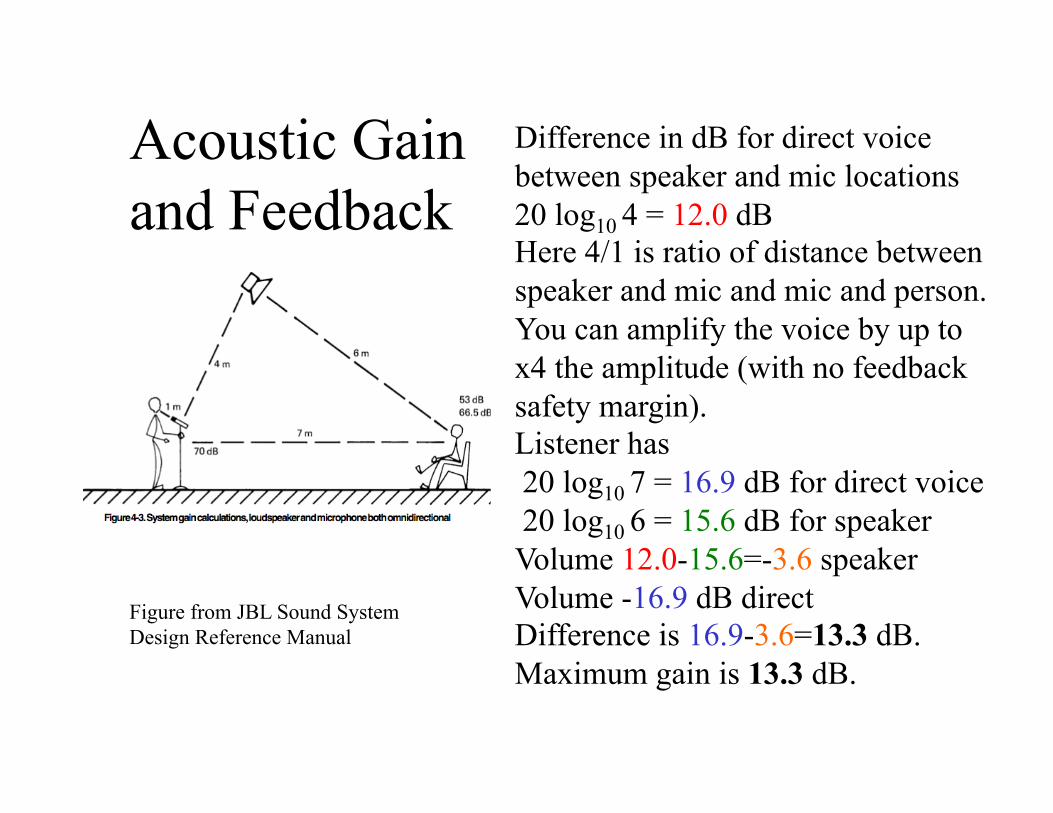
Acoustic Gain and Feedback
Figure from JBL Sound System Design Reference Manual
Difference in dB for direct voice between speaker and mic locations 20 log10 4 = 12.0 dB Here 4/1 is ratio of distance between speaker and mic and mic and person. You can amplify the voice by up to x4 the amplitude (with no feedback safety margin). Listener has 20 log10 7 = 16.9 dB for direct voice 20 log10 6 = 15.6 dB for speaker Volume 12.0-15.6=-3.6 speaker Volume -16.9 dB direct Difference is 16.9-3.6=13.3 dB. Maximum gain is 13.3 dB.
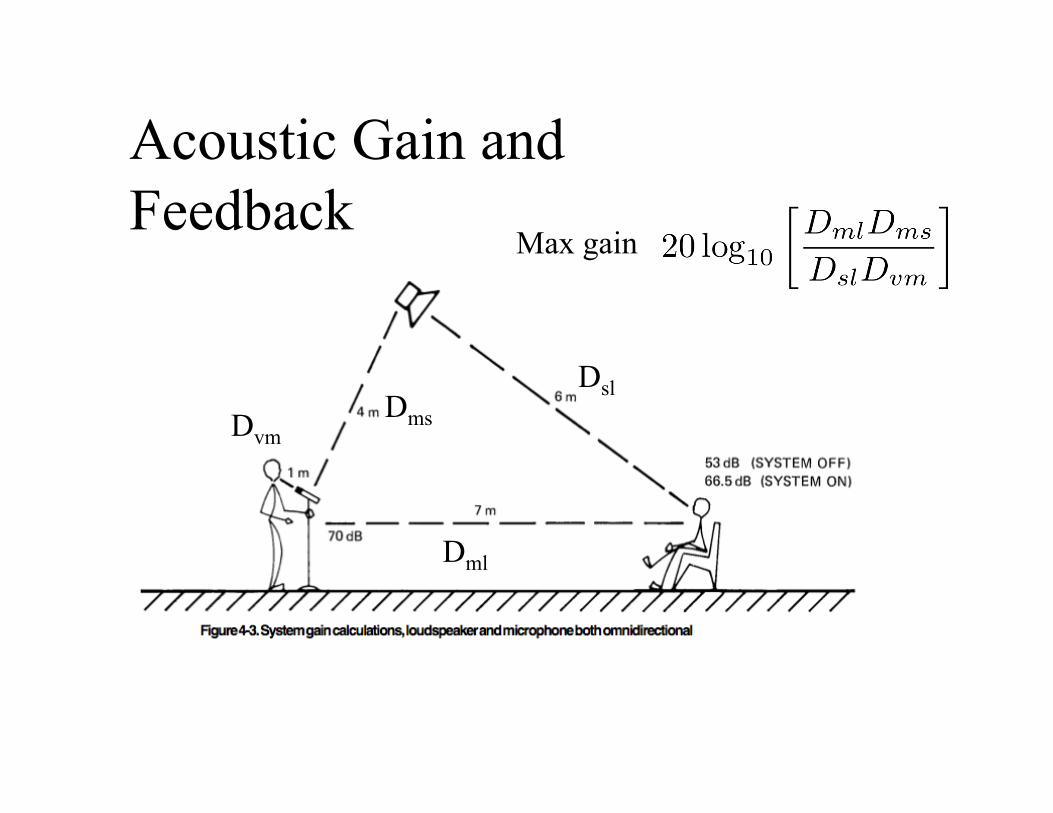
Acoustic Gain and Feedback
Dms
Dsl
Dml
Dvm
Max gain
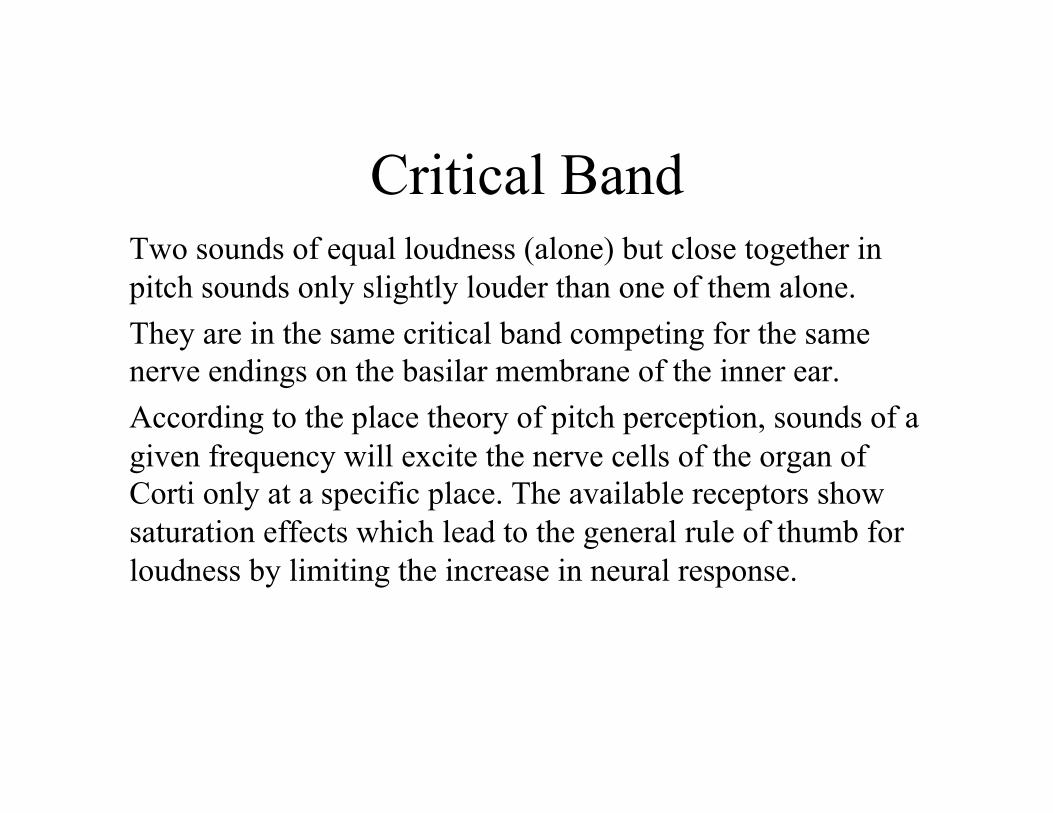
Critical Band Two sounds of equal loudness (alone) but close together in pitch sounds only slightly louder than one of them alone. They are in the same critical band competing for the same nerve endings on the basilar membrane of the inner ear. According to the place theory of pitch perception, sounds of a given frequency will excite the nerve cells of the organ of Corti only at a specific place. The available receptors show saturation effects which lead to the general rule of thumb for loudness by limiting the increase in neural response.

Outside the critical band
• If the two sounds are widely separated in pitch, the perceived loudness of the combined tones will be considerably greater because they do not overlap on the basilar membrane and compete for the same hair cells.
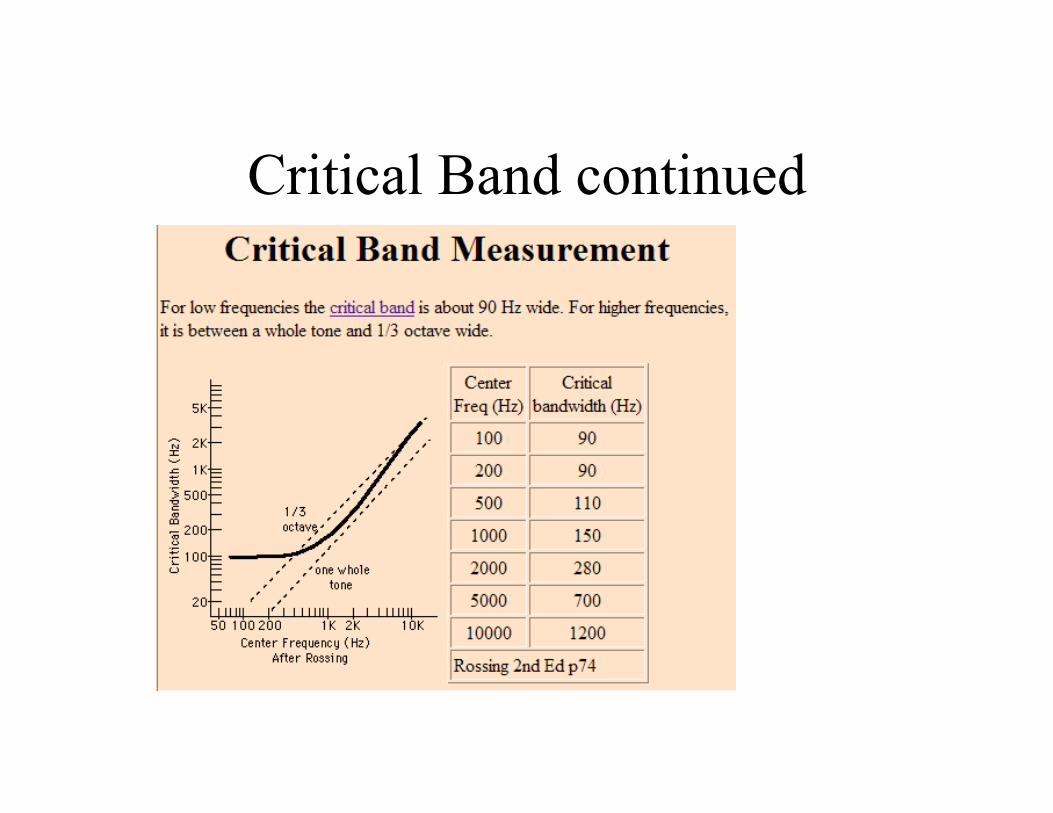
Critical Band continued
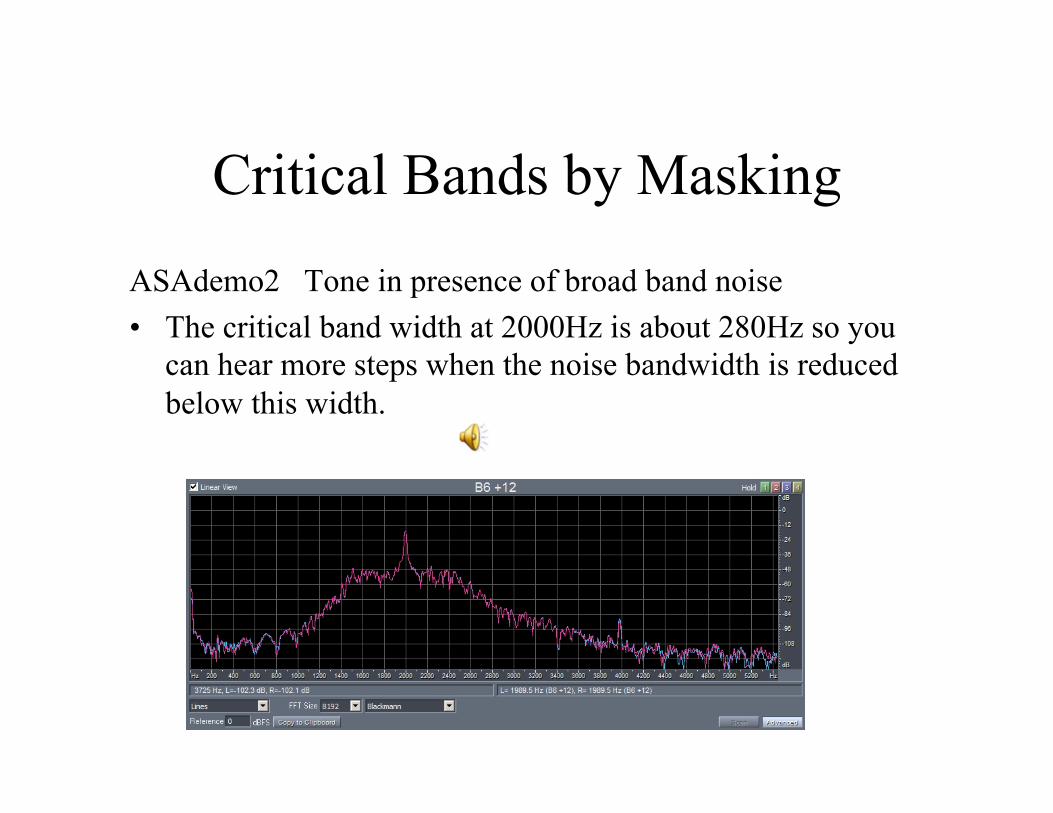
Critical Bands by Masking
ASAdemo2 Tone in presence of broad band noise • The critical band width at 2000Hz is about 280Hz so you
can hear more steps when the noise bandwidth is reduced below this width.
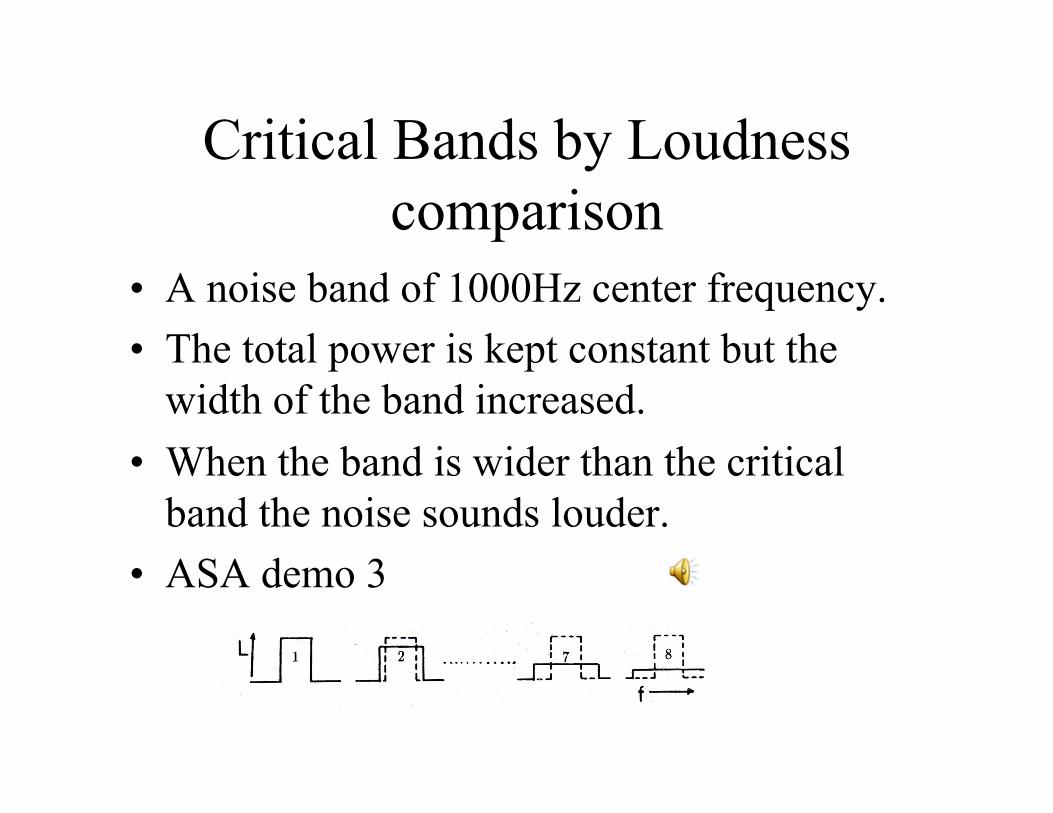
Critical Bands by Loudness comparison
• A noise band of 1000Hz center frequency. • The total power is kept constant but the
width of the band increased. • When the band is wider than the critical
band the noise sounds louder. • ASA demo 3
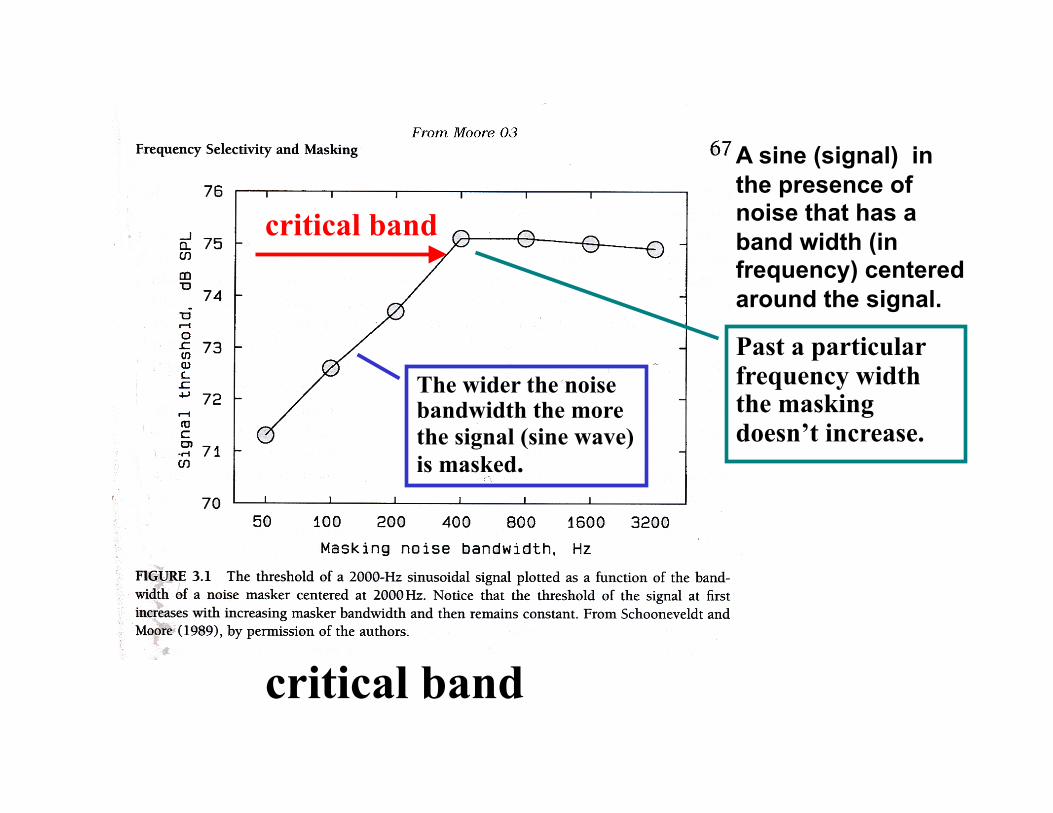
A sine (signal) in the presence of noise that has a band width (in frequency) centered around the signal.
The wider the noise bandwidth the more the signal (sine wave) is masked.
Past a particular frequency width the masking doesn’t increase.
critical band
critical band
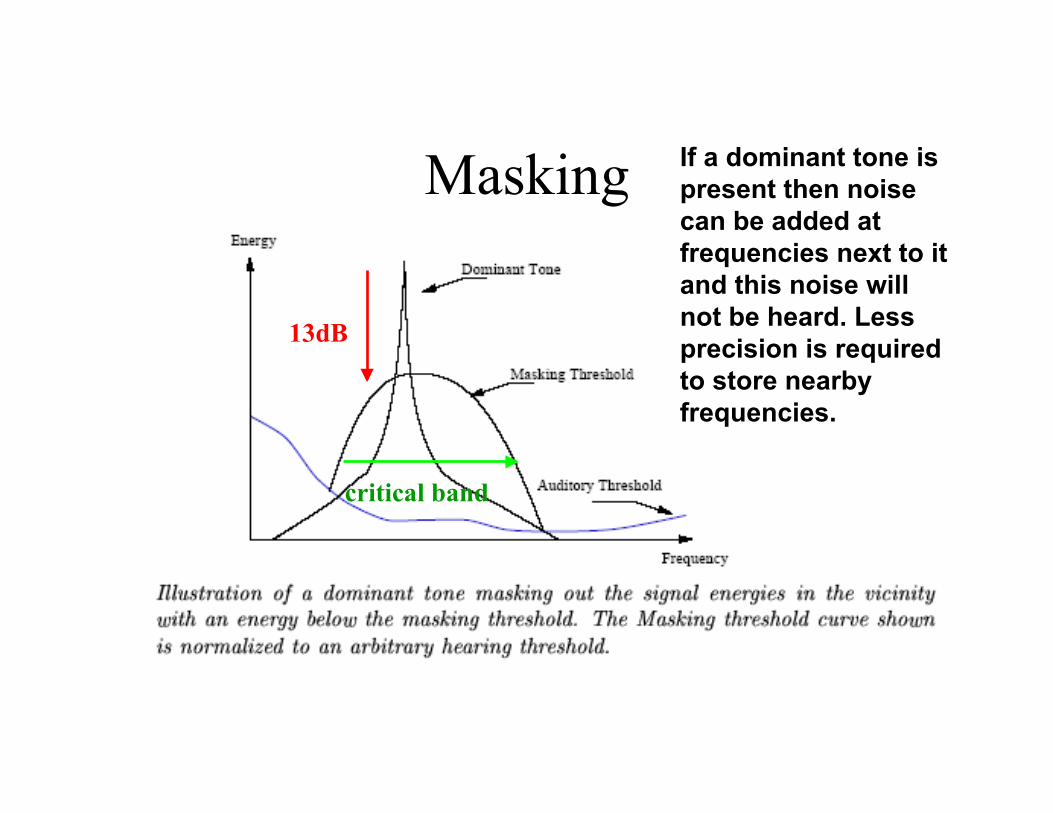
Masking If a dominant tone is present then noise can be added at frequencies next to it and this noise will not be heard. Less precision is required to store nearby frequencies.
13dB
critical band
13 dB miracle
• If the signal is 13 dB louder than the noise then the noise can’t be heard (within a band).
• Each sub-band is quantized differently depending upon the masking threshold estimated in that band
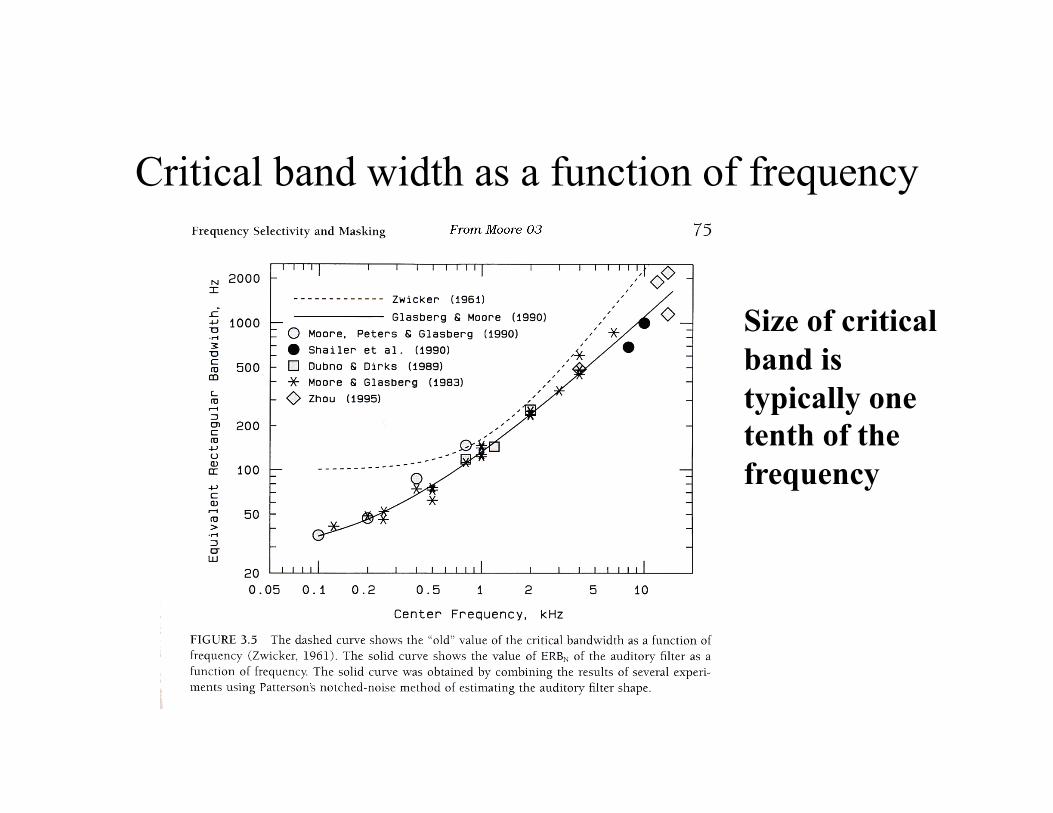
Critical band width as a function of frequency
Size of critical band is typically one tenth of the frequency
Critical band concept
• Only a narrow band of frequencies surrounding the tone – those within the critical band contribute to masking of the tone
• When the noise just masks the tone, the power of the tone divided by the power of the noise inside the band is a constant.
The nature of the auditory filter
• The auditory filter is not necessarily square – actually it is more like a triangle shape
• Critical band width is sometimes referred to as ERB (equivalent rectangular bandwidth)
• Shape difficult to measure in psychoacoustic experiments because of side band listening affects -some innovative experiments (notched filtered noise + signal) designed to measure the actual shape of the filter).
Physiological reasons for the masking
• Basal membrane? The critical bandwidths at different frequencies correspond to fixed distances along the basal membrane.
• However the masking could be a result of feedback in the neuron firing instead. Negative reinforcement or suppression of signals. Or swamping of signals.
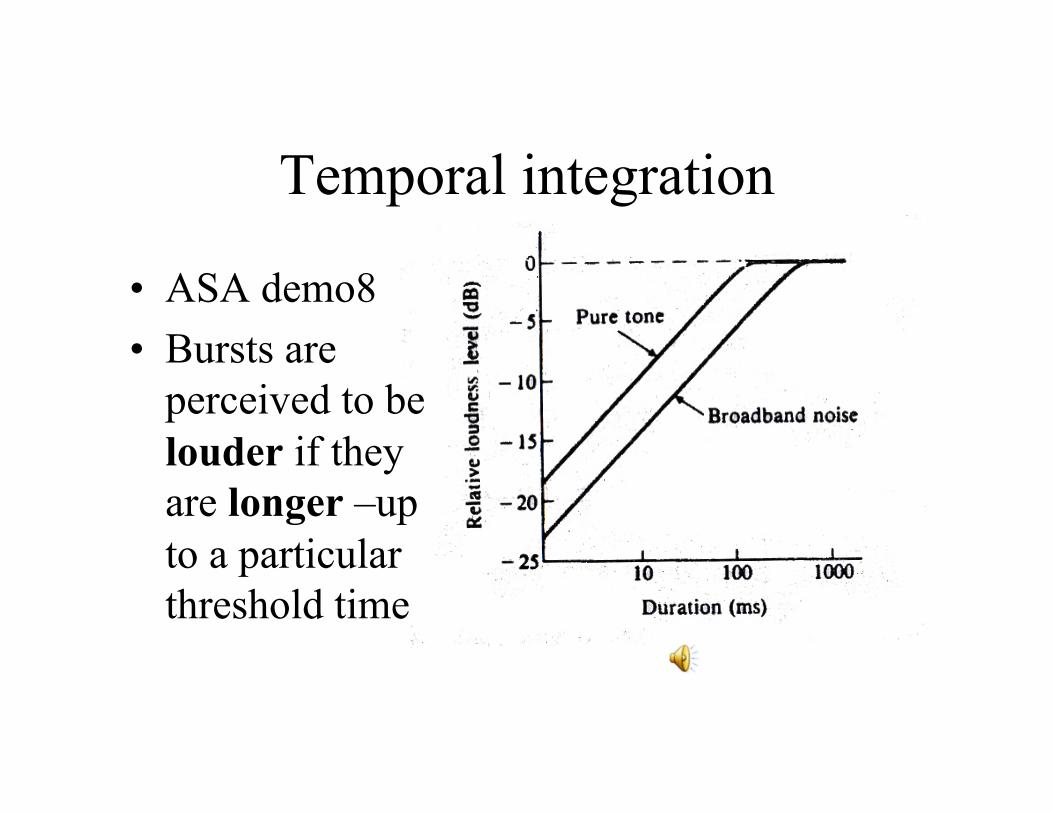
Temporal integration
• ASA demo8 • Bursts are
perceived to be louder if they are longer –up to a particular threshold time
Temporal effects - non-simultaneous masking
• The peak ratio of the masker is important -- that means its variations in volume as a function of time compared to its rms value. Short loud peaks don’t necessarily contribute to the masking as much as a continuous noise.
• Both forward and backward masking - masking can occur if a loud masker is played just after the signal!
• Masking decays to 0 after 100-200ms
Physiological explanations for temporal masking
• Basal membrane is ringing preventing detection in that region for a particular time
• Neurons take a while to recover - neural fatigue
Outside the critical band
• If the two sounds are widely separated in pitch, the perceived loudness of the combined tones will be considerably greater because they do not overlap on the basilar membrane and compete for the same hair cells.
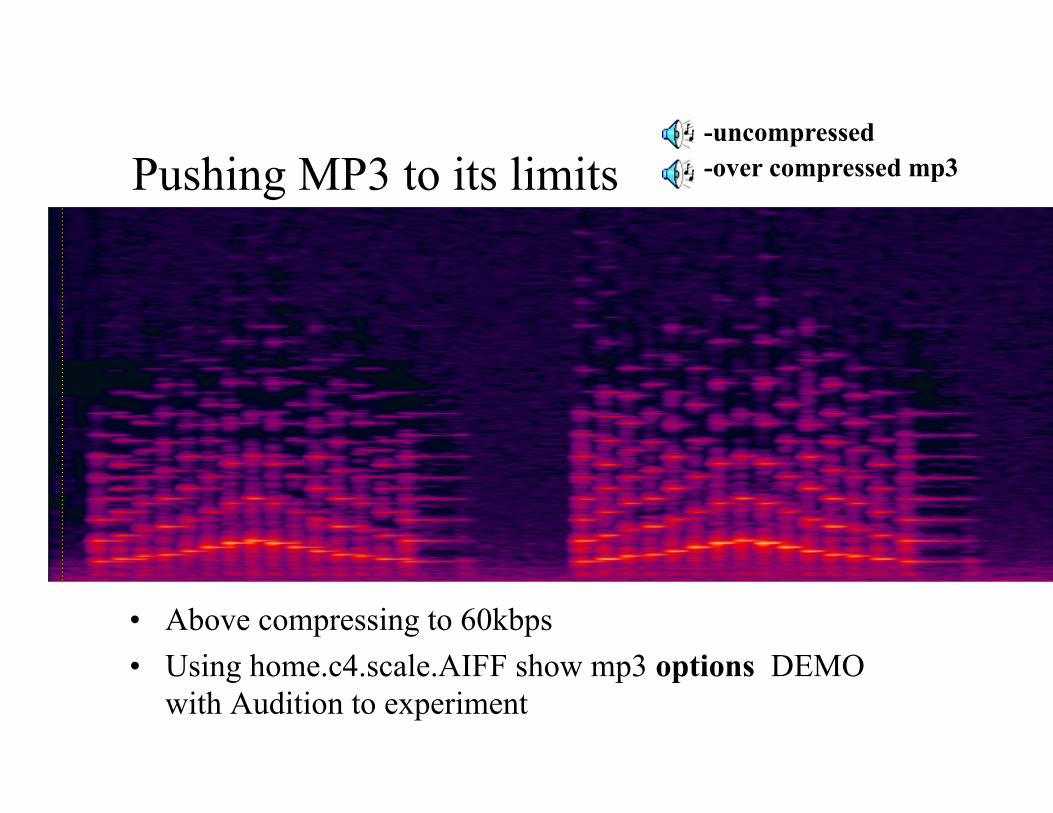
Pushing MP3 to its limits
• Above compressing to 60kbps • Using home.c4.scale.AIFF show mp3 options DEMO
with Audition to experiment
-uncompressed -over compressed mp3
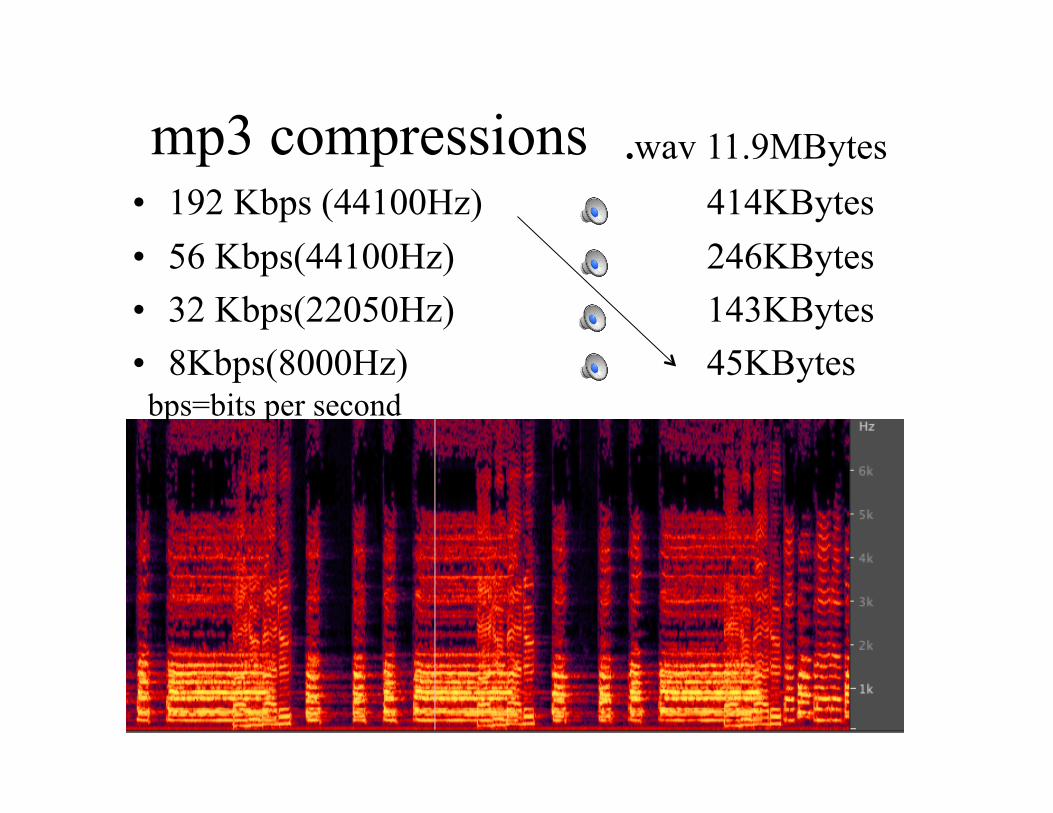
mp3 compressions • 192 Kbps (44100Hz) 414KBytes • 56 Kbps(44100Hz) 246KBytes • 32 Kbps(22050Hz) 143KBytes • 8Kbps(8000Hz) 45KBytes
.wav 11.9MBytes
bps=bits per second
Recommended Reading
• Moore Chap 4 on the Perception of Loudness
• Berg and Stork Chap 6 pages 144-156 on the dB scale and on the Human Auditory System or Hall chapters 5+6
• On Room acoustics: Berg and Stork Chap 8 or Hall Chap 15.


![Celestial Mechanics - University of Rochesterastro.pas.rochester.edu/~aquillen/mypapers/research.pages.pdf · Celestial Mechanics In 2006 I developed theory on orbital resonance capture[82]](https://img.pdfslide.net/doc/110x75/5f043c057e708231d40cf951/celestial-mechanics-university-of-aquillenmypapersresearchpagespdf-celestial.jpg)


![[PHY103] Introduction to General Physics for Engineering Students 1/2013](https://img.pdfslide.net/doc/110x75/5452cc34af7959ed5f8b771c/phy103-introduction-to-general-physics-for-engineering-students-12013.jpg)

![[PHY103] Infographics of the Physics Course PHY103 for Mechanical Engineering Students](https://img.pdfslide.net/doc/110x75/54c471ac4a7959251f8b459d/phy103-infographics-of-the-physics-course-phy103-for-mechanical-engineering-students.jpg)