Embed Size (px)
Citation preview

I M I N I S T R Y OF A V I A T I O N
R. & M. No. 3353
AERONAUTICAL RESEARCH COUNCIL
REPORTS AND MEMORANDA
Low-Speed Wind-Tunnel Tests on the Characteristics of Leading-Edge Air Intakes
Swept Wings By J. SEDDON, P h . D . and D. J. KETTLE
in
• .%
LONDON: HER MAJESTY'S STATIONERY OFFICE
I964 SEVENTEEN SHILLINGS NET
Low-Speed Wind-Tunnel Tests Characteristics of Leading-Edge Air
Swept Wings By J. SEDDON, P h . D . and D. J. KETTLE
on the Intakes in
COMMUNICATED BY THE PRINCIPAL DIRECTOR OF SCIENTIFIC RESEARCH (AIR),
MINISTRY OF SUPPLY
Reports and Memoranda No. 3353*
November, z95o
Summary.
Low-speed wind-tunnel tests have been made to determine the external and internal characteristics of leading-edge air intakes in swept wings, under flight conditions.
Tests on a delta model show that leading-edge intakes in the wing root give an advantage in effective sweepback and critical Mach number (estimated from the low-speed pressure distribution) compared with nacelle-type intakes adjacent to the body.
The internal loss in level flight for a 52 ° sweptback entry is 4~/o ram worse than when the entry is square to the direction of flight. The explanation of this loss is found in the nature of the pre-entry retardation for level-flight velocity ratios. A boundary-layer bypass leading from a slot inside the intake removes most of the additional loss.
Tests on a swept-wing model with a simplified intake give the effects of duct diffusion, of boundary layer from an adjacent body, and of boundary-layer removal through a slot or porous wall.
A general formula for intake loss is applied to show the dependence of the loss on entry shape and on the value of the design velocity ratio.
Section
1.
2.
.
L I S T OF C O N T E N T S
In t roduc t ion
Details of Exper iments on Delta Model
2.1 Model with nacelle intakes
2.2 Leading-edge intakes
2.3 Tes t technique
External Characteristics
3.1 Presentation of results
3.2 Discussion
e Replaces R.A.E. Report No. Aero. 2402--A.R.C. 13,899.

Section
4.
.
i~IST OF C O N T E N T S - - c o n t i n u e d
Intake Loss
4.1 Presentation of results
4.2 Comparison of~ feading-edge and nacelle intakes
4.3 Loss increment caused by. sweepback
4.4 A special form of boundary-layer bypass
4.5 IncidenCe effects ,i:~
Intake Loss Measurements on Swept-Wing Model
5.1 Purpose and nature of tests
5.2 Effect of duct shape
5.3 Body effect
5.4 Tests with controlled suction
5.5 Comparison of slot and porous suction
Summary of Results and Conclusions .
Acknowledgements
List of Symbols
References
Detachable Abstract Cards
LIST OF APPENDICES Appendix
I. Note on a general method of estimating intake swept leading-edge intakes
loss and its application to
Table
1.
2.
3.
4.
5.
LIST OF TABLES
Model data
Internal loss of swept leading-edge intake on delta model
Internal loss of squared leading-edge intake on delta model
Effect of angle of sweepback on intake loss--leading-edge intakes on delta model
Effect of boundary-layer bypass on swept intake on delta model
F•guYe 1.
2.
3.
4.
LIST OF ILLUSTRATIONS
General arrangement of delta model with nacelle intake
General arrangement of delta model with swept intake
Details of swept intake
Details of squared intake
2
J
I~'igur e
5.
6.
7.
8..
9.
10.
11.
12.
13.
14.
15.
16.
17.
18.
19.
20 and 21.
20.
21.
22.
23.
24.
25.
26.
27.
28.
29.
30.
L IST OF I L L U S T R A T I O N S - - c o h t i n u e d
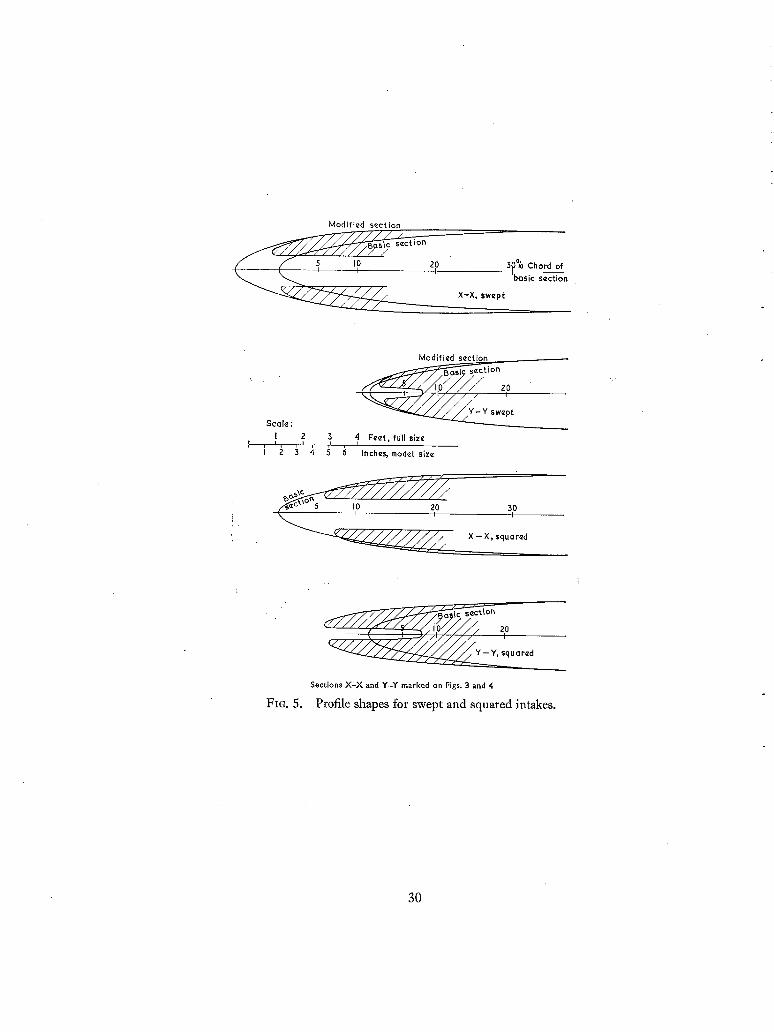
Profile shapes for swept and squared intakes ' , ' "
Typical chordwise pressure distributions (C2; ~ ~ :"" • = O) o~l:l, npdel ;~vith swept intake
Typical chordwise pressure distributions (C L ' O)'on' model -with squared intake
Isobar diagrams for swept and squared retakes (~C~ ~: 0), ' "
Isobar diagrams fo.r nacelle intake and plain _w,rng'.fC L = 0)
Estimated local critical Mach number ( C L .... = 0)ml~ading-edg6intakes
Estimated local critical Mach number (CL = 0) ~nacelle intake and plain wing
Intake loss (C_c = 0) of principal arrangements on delta model
Pressure gradient at zero incidence on inboard wal lof swept and squared ir/takes
Distribution of total head at engine position
Effect of sweepback on intake loss at C L = 0
Loss coefficient vs. angle of sweepback at constant velocity ratio (C L = O)
Effect of boundary-layer slot on loss coefficient of swept intake at C L = 0
Variation of loss coefficient with incidence
Effect of duct shape on loss coefficient
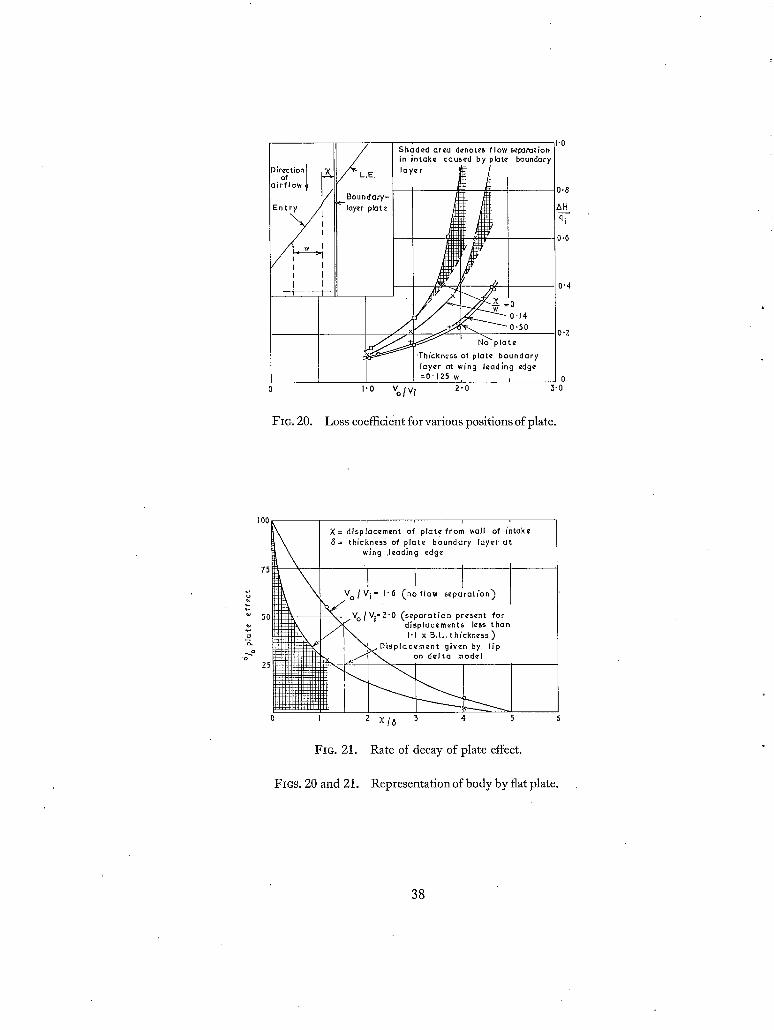
Representation of body by flat plate:
Loss coefficient for various positions of plate
Rate of decay of plate effect
Loss coefficient at various rates of suction: swept intake with boundary-layer slot
Loss coefficientat various rates of suction: swept intake with porous wall
Effect of suction on loss coefficient: summary of results for level flight
Power gain and loss with suction on swept intake
Variation of k (retardation factor) with sweepback
Correlation of estimated and measured intake losses
Approach loss of wing-root intakes in level flight
Optimum velocity ratio for different sweepback angles
Difference between peak efficiency and that for velocity ratio 2.0
1. Introduction.
In the design of swept-wing aircraft for flight at h!gh subsonic speeds it is important to minimise the proportion of wing covered by the body and nacelles, because of a loss of effective " sweepback which normally occurs on these items and in their junctions with the wing. One way in which this can be done is by the use, in suitable cases, of leading-edge air intakes with buried ducts.
3 (89t6t) A 2

Wing-root intakes, in particular, provide an opportunity not only to reduce the amount of wing covered, but, by modifying the root sections, to correct the body-junction effect also. This point
is demonstrated in the report. On a wing without sweepback, a leading-edge intake has a high internal efficiency, provided that
a satisfactory compromise with the requirements of low external drag and high maximum lift can
be achieved. In a previous review 1 the leading-edge intake was discussed in these terms, and a set of design recommendations were made. With wings of high sweepback the situation is changed somewhat. On the one hand, the emphasis on maintaining a high local maximum lift coefficient is reduced, because sweepback has the effect of postponing the stall on the inboard part of the wing.
The former requirement, that the upper lip should project forward of the lower so as to tilt the plane of the entry about 25 °, is no longer necessary, a nominal tilt, or stagger of say 10 ° being
probably sufficient. This improves the intake at low incidences. On the other hand, the use of 40 °
or 50 ° sweepback of the leading edge, by analogy with the stagger problem, may be expected to
increase the intake loss. Added to this; the external requirement of low peak suctions on the lips
becomes more stringent as the design Mach number increases; although it is now generally recognised
that the drag rise associated with a region of high velocity near the leading edge may be delayed to a Mach number considerably in excess of that at which the flow becomes locally supersonic.
A wind-tunnel investigation has been made with the object of providing data for general application to the design of leading-edge intakes in wings of high sweepback. Experiments were first made on a model of a typical twin-engined fighter with a delta wing. The following designs
were compared:
(1) wing-root leading-edge intakes with the full sweepback of the basic leading edge;
(2) wing-root leading-edge intakes squared to the direction of flight;
(3) circular intakes in nacelles adjacent to and faired into the body.
External pressure-plotting tests were made to substantiate the case for leading-edge intakes outlined in the opening remarks above. This part of the investigation is described in Section 3 of
the report. The rest of the work was devoted to a study of internal loss under flight conditions. A comparison
was first made of intake efficiencies on the three different designs. Then in order to analyse the loss resulting from sweepback, the fully swept intake was modified in stages to a squared intake, and tested at each stage. Lastly, a special form of boundary-layer bypass was devised for the fully swept intake, to eliminate the sweepback effect. The results of these tests are given in Section 4.
In order to amplify certain sections of the data, a further set of experiments was made using a simplified model, which consisted of a swept half-wing (of constant chord) with a leading-edge entry and straight duct. The tests on this model are recorded in Section 5. They include:
(a) a comparison of diffusing and non-diffusing ducts,
(b) the effect of an adjacent wall, as of a fuselage, displaced at various distances from the side
of the intake,
(c) an investigation of the use of controlled suction of the boundary layer, through a single slot or porous wall inside the duct.
In the course of analysis, a general method of estimating intake loss has been developed. This will be given fully in a separate report, but in an Appendix to the present report the application to
4

swept intakes is described briefly, and further conclusions are drawn regarding the effects of entry shape and of changes in the design Velocity ratio for level flight.
The report is lengthy, as the various experiments entail a good deal of description and explanation. The data are not all of equal practical value. Thus the utilisation of external pressure-plotting results is 'a t present hampered by lack of information on high-speed drag effects. Some of the experiments with controlled suction are of academic rather than immediate practical interest. It is felt that the most important data are those obtained on the intake loss resulting from sweepback, and the associated effects of duct shape and body interference. These are to be found in Sections 4.3, 4.4, 5.2, 5.3 of the main report and in Sections 5, 6 of the Appendix. This may assist the practical designer with insufficient time to tackle the whole report.
The tests were all made at low speed (120 ft/sec) in the No. 1 11½ ft and 5 ft Tunnels of the R.A.E.. They were begun in December, 1948 and continued at various times throughout 1949.
2. Details of Experiment on Delta Model.
2.1. Model with Nacelle Intakes.
The model for the first tests was a 1/7 scale representation of a twin-engined delta-wing fighter, consisting of wing, body and ducts, without tail unit or cabin. "The centre section was made detachable, to allow interchange between the various intake forms.
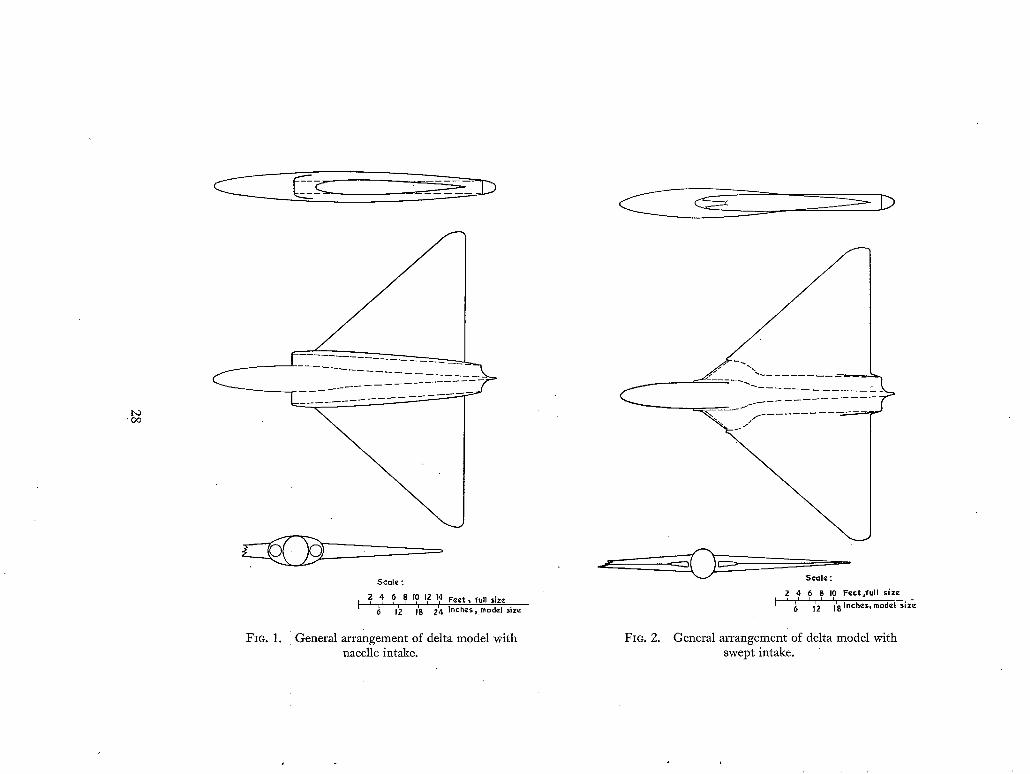
A drawing of the model with the circular nacelle intakes is shown in Fig. 1. The arrangement was
evolved from a conventional twin-engined layout, only in this case the nacelles were adjacent to the
sides of the fuselage, blending into a single body of flat oval cross-section. The complete body covered
20% of the wing span (33% of the total wing area). The ducts were practically straight and of circular section throughout. Further details are given in Table 1.
2.2. Leading-Edge Intakes.
The leading-edge intakes were of the tapering slot type, the spanwise width at entry being about twice the internal diameter of the nacelle intakes. Up to the wing maximum-thickness position the ducts were buried in the wing, leaving a minimum front body as the only projection (Fig. 2). The width of this body was 9 ~ of the wing span. Aft of the maximum thickness the ducts were carried in a rear body of roughly rectangular cross-section with rounded corners. The rear body width was 14°/o wing span.
Two principal forms of intake were tried. These are shown in Figs. 3 and 4, and are called respectively 'swept intake' and 'squared intake'. In the former case, the full sweepback of the leading edge was maintained across the entry face. This involved a minimum alteration of the planform and in that respect gave the best chance of preserving the external flow characteristics of the basic wing. In the latter case, the entry was squared to the line of flight to ensure optimum internal efficiency.
Duct sections were identical in the two cases downstream of the first completely closed section of the swept intake (AA, Fig. 3). Upstream of section AA there was no change of shape normal to the line of flight in either case.
In both cases the inboard wall of the intake was separated from the side of the body by a narrow lip
of standard type for wing-root entries (e.g. Vampire). Because of the shape and position of the entries, the ducts had greater curvature and more change of section shape than that of the nacelle intake. On the other hand the wing ducts were Shorter.

. ¸11:.i
, 7
.)) ?
Wing sections at inboard and outboard stations on each intake are shown in Fig. 5. For the swept version, a series of modified sections Were first defined, giving a higher leading-edge sweepback than
the outboard wing and a maximum-thickness position changing linearly from 35% chord at the
outboard end of the intake to 25% chord at the inboard end. When the entry was put into this
modified wing, the sweepback of the entry plane was approximately the same as that of the outboard
wing leading edge, and the far forward thickness position was helpful in fairing the entry lips at
the inboard end, where the intake was deepest. The effect of this matching of wing profile and lip
shape is discernible in the external pressure distributions (see Section 3). No such matching was possible in the case of the squared intake.'
In order to provide additional data on the effect of sweepback on internal loss, Plasticine extensions were built on to the swept intake, reducing the angle and sweep of the leading edges in stages to
zero. The final Plasticine version (zero sweepback) was similar to the squared intake of the principal comparison, except that the entry plane "was farther forward and the straight portion of the duct
approximately twice as long (cf. Figs. 3 and 4). In this series, little attention was paid to the details of external fairing, since the tests were confined to measurements of internal pressure and loss.
2.3. Test Technique.
Flow through the ducts was contr.olled by means of a series of interchangeable exit nozzles and
measured by a cross of pitot tubes and a pair of wall statics a few inches upstream of the exit. Intake
total head was measured on a cross of pitot tubes at a representative engine position (near the wing
maximum-thickness position). For some tests a pitot comb-was fitted spanwise across the middle of the duct at section AA (the nominal entry plane)to show the extent of boundary layer on the inboard
wall. Pressure distribution along this walt was recorded from a line of flush static holes at the mid-
height. The measurements for each intake were made over a range of internal flow and a range of incidence.
For the external pressure plotting, ~ chordwise distributions were obtained at seven spanwise
stations from centre-line to mid-span of tile model. Readings near the leading edge or on the entry.
lips were taken from flush holes let into the model. Elsewhere the measurements were made by
means of a static tape, giving nine readings at one time, or by individual creeper static tubes. The
tests were made at zero incidence, with internal flow corresponding approximately to top level-
speed conditions. A few measurements at other flow ratios indicated that the effect of flow ratio on the results was as expected from previous tests; so that small variations near the level-speed condition
may be ignored. In addition to the three main intake arrangements, a 'plain wing' condition, i.e. model without intakes and ducts,'both with and without the small front body, was also tested. It Was found that the small body made no appreciable difference to the pressure distribution; consequently only one set of results is given.
3. External Characteristics.
3.1. Presentation qf Results.
Typical chordwise pressure distributions for the two leading-edge intake arrangements are shown in Figs. 6, 7. Complete results are g~v.en in Figs. 8, 9 in the form of isobar diagrams at C L = 0. In Fig. 8 the two types of leading-edge intake are compared: in Fig. 9 the nacelle intake and plain
wing.
The further stage of analysis adopted is to calculate sectioia vaiues of critical Mach number s from the local peak-suction values and sweepback of the peak-suctio~ line (shown dotted in the isobar diagrams). These estimated values of Morit are plotted against spanwise position in Figs. 10, 11, where the four main cases are compared.
3.2. Discussion.
The first and obvious advantage of leading-edge intakes Over the nacelle type is that since with the former a greater portion of the wing is left uncovered, the area of effective sweepback extends farther inboard. Examination of the main peak-suction lines on the isobar diagrams (Figs. 8, 9)
confirms that this is so. Over the region from 10~o to 3 0 G wing semi-span, the swept and squared
leading-edge arrangements have on the average 22 ° and 10. ° greater sweepback respectively than the nacelle-intake version.
The advantage of the
shows the usual effect
thickness and increased
estimated critical Mach
swept intake is a twofold one. The plain-wing pressure distribution (Fig. 9)
near the centre, whereby suctions are reduced ahead of the maximum
behind it. The sweep of the isobars is reduced accordingly, so that the
number (Fig. 11) is 0.85 in the wing root compared with 0.94 at mid-semi- span. Now with any air intake, additional suction forces are associated with the retarded flow ahead
of the entry. In the case of the swept intake, these are used to fill up the low-velocity region behind
the leading edge, so as to produce a smooth chordwise pressftre distribution, as shown, by traverse B in Fig. 6. The corresponding peak-suction region is such'as to maintain full sweepback right up to
the body junction, or even produce a local increase (Fig.' 8). Thus the estimated critical Mach number is at least 0.94 up to the side of the body (Fig. 10).
In producing this result, the sweeping forward of maximum-thickness position described in Section 2 is complementary to the introduction of the intake. Without the intake, the section modifications would need to be greater to produce an equal effect. In the combined scheme the farther forward maximum thickness is advantageous ir~ fairing the intake lips so as to obtain a correctly blended pressure distribution. "
In the case of the squared leading-edge intake, the lip faifi'ngs are not easily merged into the wing contour and it is seen from traverse B in Fig. 7 that the suction peak on the entry lip remains distinct from the main-wing field. This is the type of pressure distribution more usually found with leading-edge intakes on unswept wings. The main peak-suction line (Fig. 8) is practically the same as on the plain wing (Fig. 9) giving 0.86 as the estimated value of critical Mach number in the root (Fig. 10). The separated entry peak line follows closely the line of the leading edge and
therefore has virtually no sweepback. Taking this line as a basis, the estimated critical Mach
number falls to 0.77 (Fig. 10). The value is pessimistic however, since it is often found that the drag rise associated with a local high-velocity region near a leading edge is delayed considerably beyond the stage at which the velocity first becomes sonic.
The nacelle intake as tested produces a pressure distribut'ion in the junction similar to that at the centre of the plain wing, with a rather higher peak velocity. Thus the estimated critical Mach number falls off much farther outboard and to a lower vllue; M = 0'81. The entry peak, which is highest on the outboard side of the nacelle owing to the asymmetrical effect of the body, corresponds to a still lower critical Mach number, M = 0.71. As with 'the squared leading-edge intake, this value is pessimistic.
i.e. Mach number at which the local flow becomes sonic.
7

Summarising, the nacelle intake arrangement as tested has a detrimental effect on the overall pressure distribution, the wide body resulting in a large area over which the effective sweepback is
reduced. The squared leading,-edge intake leaves the plain-wing pressure distribution in the main unaltered, and merely introduces an entry peak-suction line which may or may not have an appreciable
effect on the drag. The swept leading-edge intake improves on the pressure distribution of the plain
wing, because the Superimposed entry field, in combination with modified root sections, has the effect of maintaining full sweepback up to the junction with the minimum body. The estimated values of critical Mach number are summarised in the following table.
Arrangement
Plain wing (no intakes) . Nacelle intakes Squared L.E. intakes Swept L.E. intakes
Estimated critical M
Main peak line as basis
0" 84 0'81 0"85 0"94
Entry peak line as basis
0.71 0.77 0.94 "
It is not possible to express the differences between the various arrangements accurately in
terms of drag increase at compressibility speeds. There is by now considerable evidence to show
that when the peak suction occurs over a region near the maximum thickness, a substantial drag
increase follows closely on the attainment of local sonic conditions; while in the case of a well
forward peak of narrow extent there is often an appreciable lag. But this cannot be put into figures,
and moreover the three-dimensional character of flow in the wing root adds to the doubt which
must be attached to predictions based on two-dimensional characteristics. However, high-speed
tunnel tests ~ on another series of intake and body arrangements on a delta wing show that the critical
Mach number, estimated as in the present case, provides a fairly good guide to the order of merit of the arrangements. The two sets of tests also demonstrate a further important point, namely
that the nacelle intake scheme may alternatively be improved by reshaping the body in the region
of the wing intersection. In Ref. 2 the estimated Mcri~ reached with a different body line from the present one was 0.88, which is equivalent to about 0.90 with the present wing. This probably represents the limit for the nacelle intake arrangement.
4. Intake Loss.
4.1. Presentation of Results.
For the presentation and discussion of the results of internal measurements, the following definitions are required:
G v,
%
qi
H
AH
flee-stream speed
mean entry velocity
flee-stream dynamic head ½p V0 ~
entry dynamic head ½pVi ~
mean total head over duct area at representative engine position (section EE in Fig. 3)
intake loss = amount by which H is less than the free-stream total head.

For determination of V i and related quantities, a projected entry area is used. For the leading-edge
intakes this is the area of section AA in Fig. 3. Intake loss is expressed as a coefficient AH/q i , and plotted against entry velocity ratio Vo/Vi.
This form of presentation can be used for all working conditions of the intake. The scale of velocity ratio has the convenient property that the points Vo/V i = 0, 1:0, 2-0, 3.0 are representative of the four main conditions in which it is normally required tos tudy the intake performance.
v0 - 0 represents the static condition
Vi
V0 - 1.0 represents the climb condition Vi
V0 - 2.0 represents the level-flight condition
v,
v0 - 3 '0 represents the dive condition. g i -
In a general treatment, it is seldom necessary to introduce more precise values, and throughout
the following discussion these representative points are used to define and localise the picture. A
note on the extent to which sweepback affects the precise value of optimum velocity ratio for level
flight is included in Appendix I. When plotting the results, the method has been adopted of showing also the mean total head,
or 'ram efficiency', H/q o . This figure of merit is widely used, and is often convenient; as for example when comparing intakes of different sizes on the same aircraft, in which case the loss coefficients do not bear a constant relationship to the thrust losses. The use of ram efficiency, however, should be confined to the level-flight condition, since large variations of flight speed, and hence of the parameter qo, cause variations in the factor which are not directly related to the aerodynamic efficiency of the
intake. Values of loss coefficient and ram efficiency for the leading-edge intakes in the various conditions
of test are given in Tables 2 to 5i In cases where measurements were also made at the entry plane,
the loss to this section, called 'approach loss,' is given separately.
4.2. Comparison of Leading-Edge and Nacelle Intakes.
Internal losses of the three principal intake arrangements at zero incidence are compared in Fig. 12. At the climb point, the wing intakes have slightly lower loss coefficients than the nacelle intake: this is because the ducts are shorter. But whereas the nacelle intake loss is virtually independent
of forward speed, that of each of the wing intakes rises with increase of velocity ratio. At the
level-flight point, the comparison is as shown in the following table:
Type of intake
Nacelle Squared leading edge Swept leading edge
Loss coefficient
0"18 0-25 0"44
% ram efficiency
95"6 93"7 89"0

On an aircraft of the type under consideration, the loss of thrust resulting from intake loss is of the order of one-fifth of the loss coefficient. Hence from the above results the thrust losses in level flight with the squared and swept leading-edge intakes are respectively about 1~/o and 5~o greater than with the nacelle intake.
Scale effect on the model results would be expected to reduce the losses by 20 to 30~o (see Appendix I).
The rise in loss coefficient of the squared intake above the climb point is accounted for by a number of small factors. These include:
(1) incomplete diversion of body boundary layer by the inboard lip,
(2) boundary-layer development on the lip itself,
(3) non-uniform distribution at the entry, resulting from the unsymmetrical shape, and leading to the presence of equalising pressure gradients inside the lips.
The total effect is fairly small. The sharper rise in the case of the swept intake denotes an additional effect of the sweepback. This is by no means inconsiderable, as the 4% increase in thrust loss (model figure) shows. The experiments discussed in the following paragraphs are concerned with the explanation and prevention of this effect.
4.3. Loss Increment Caused by Sweepback.
It has been seen from Fig. 12 that at Vo/V i = 1.0 (i.e. when the air is taken into the duct without retardation) there is no additional loss of head associated with sweepback. At a velocity ratio of infinity
(i.e. '100% retardation', corresponding to either infinite forward apeed or zero flow through the intake) the swept intake would be comparable with a yawed pitot tube, and would have a lower internal pressure than the squared or normal pitot-type intake. The case of an intake in high-speed
level flight lies roughly halfway between these extremes (V o/V, ~ about 2.0, 50% retardation), so it
is to be expected that the additional loss resulting from sweepback will be connected with' the retardation from velocity V 0 to V i taking place ahead of the effective entry of the intake.
In Fig. 13 pressure distributions along the inboard walls of the swept and squared intakes at various velocity ratios are shown. Near Vo/V i = 1.0 there is little significant difference between the two cases, but at higher ratios the pressure rise corresponding to retardation from V o to V i is later and more protracted in the case of the swept intake. It may be concluded that the retardation is virtually completed only when section AA (the projected entry plane) is reached. Section AA is in this sense the effective entry of the swept intake. The approach region ahead of section AA is a region of adverse pressure gradient; consequently there is rapid boundary-layer development on the surfaces of the approach, which explains the increased loss. At a sufficiently high velocity ratio the flow may be expected to separate from the approach wall. This probably happens in the dive case of Fig. 13: the indications are a sudden breakdown of the pressure rise, which occurs just ahead of section AA, and a low final value of the pressure coefficient.
Thus it is seen that whereas the leading-edge intake in an unswept wing is a form of nose (or pitot type) intake, the leading-edge intake in a swept wing is a special form of rear intake, i.e. one in which surface boundary layers ahead of the entry have a determining influence on the losses.
Total-head contours and traverses inside the duct, plotted in Fig. 14, illustrate the build-up of boundary layer on the inboard wall, in particular the different extent of this for the squared and swept intakes at velocity ratios above 1.0.
i 1 0

The way in which intake loss varies with angle of sweepback is shown in Figs. 15, 16. For these measurements, entries of similar shape and constant projected area but varying sweepback were built successively on to the basic swept-intake model. Considering results at the level-flight point, we see that the effect of sweepback is not large up to 40 ° , but increases rapidly for larger angles. To a first approximation the variation might be expected to be proportional to tan ~ (where ~ = angle of sweepback), since for a given shape of entry the surface area of the approach is proportional to tan~. For small angles of sweep, however, part of the retardation must take place ahead of the
approach surfaces, while for very large angles a considerable part of the approach may be in a region of free-stream velocity. This would explain the type of variation found which, as shown in Fig. 16, is more nearly proportional to tan 2 ~. The result is discussed further in Appendix I (variation of
retardation factor k with angle of sweep). The magnitude of the loss associated with sweepback will also depend on the shape of the entry
cross-section. Some notes on this point are also given in Appendix I.
4.4. A Special Form of Boundary-Layer Bypass. The lip between intake and fuselage, used on the present models, has little effect on the loss
caused by sweepback, since this loss is essentially built up on the approach surfaces behind the lip.
It seemed desirable at this stage of the tests to try out some form of additional boundary-layer bypass. The inboard wall, being the longest part of the approach, has the thickest boundary layer,
so a bypass slot for this wall was devised and tested. The slot was placed in the inboard wall at the effective entry plane AA. The entry of the slot was flush with the surface of the duct, the height was the full height of the wall, and the width was made equal to the local measured boundary-layer thickness at the level-flight velocity ratio, 2.0. A bifurcated passage with exits on both surfaces of
the wing was used, in order to minimise the passage length. Flow through the slot is governed by the retardation pressure rise occurring in the main intake.
Hence the effect of the slot is small at the climb point, but increases with increasing velocity ratio. The results are given in Fig. 17: they show that the swept intake with slot is almost as good as the squared intake. Figures for the level-flight point, comparing with those in Section 4.2, are as
follows:
Type of intake Loss coefficient % ram efficiency
Swept intake with bypass 0.28 93' 0
As with all bypass devices, it is important to recognise that the boundary layer diverted from the
duct by this means necessarily increases the external drag; so that a net advantage for the slot can
only be obtained by careful design.
4.5. Incidence Effects. The results so far discussed all apply to zero incidence and C L . In practice, incidence and velocity
ratio generally vary together, but it is preferable in the analysis to keep the two variables separated as far as possible. Loss coefficients for the swept and squared intakes at a number of fixed incidences are plotted in Fig. 18. It can be seen that the effect of incidence is small up to C L = 0.4. For most practical purposes, therefore, in the range of flight conditions between the climb and level-flight points, the effect can be neglected.
11

More generally, it is interesting to note that the rate of increase of loss coefficient with incidence is lower for the swept than for the squared intake. Roughly, the rise produced by an increase of incidence of amount ~ with the former is the same as that produced by an increase of amount
cos ¢ with the latter, ¢ being the angle of sweepback of the entry.
5. Intake Loss Measurements on Swept-Wing Model.
5.1. Purpose and Nature of Tests.
In order to separate effects at the sweptback entry from those caused by changes of shape and
direction in the duct, and also to explore in greater detail the effect of an adjacent body and the
use of boundary-layer suction, a second model was made. This consisted of a portion of constant-
chord wing swept at 52 ° (the same angle as the swept entry on the delta model), with a fully
swept intake and straight duct of constant rectangular section and area. The span of the entry was the same as on the delta; the height was equal to the mean height of the tapered delta intake. The
model was mounted vertically on the floor of the tunnel at zero incidence. Total head in the duct was measured at the same distance from the entry as on the previous model.
5.2. Effect of Duct Shape.
The loss coefficient of the simplified intake, while showing the characteristic rise caused by
sweepback, is at the level-flight point only about 60% of that of the more complex intake on the
delta model. The comparison is shown in Fig. 19. Factors contributing to the higher loss of the complex intake are:
(1) taper of the entry, which increases the loss associated with sweepback (see Appendix I),
(2) diffusion in the duct, which increases the apparent friction coefficient,
(3) curvature of the duct, which accelerates the build-up of boundary layer on the inboard wall,
(4) change of section shape, which may aggravate effects (2) and (3),
(5) a residual effect of the body and inboard lip (see Section 5.3 below).
Of these factors, (2) is the most important. It has been shown in previous work 3 that diffusion of
an amount often present in current intake designs* increases the apparent friction coefficient of the duct by 30 to 40o/o . This is confirmed in the present case by the result of a further test, for which the parallel duct was modified to a diffusing duct by building on to the side walls of the entry. The entry area was reduced by this means to 0-7 of its former value. The duct shape is illustrated in Fig. 19, which also gives the results. At level-flight point, the loss coefficient of the diffusing intake !s 85~o of that of the complex intake on the delta. The remaining 15~o represents the total effect of the other four factors listed. About two thirds of this would be estimated for the body effect (from Section 5.3), and roughly the remaining one third for taper (fromFig. 28, Appendix I). From this it is inferred that the curvature effect is negligible to the accuracy of the tests.
5.3. Body Effect.
The increase of loss caused by a body wall alongside and extending ahead of the intake is shown by the results (Fig. 20) of a series of tests with a fiat plate clamped to the wing at various spanwise
* A normal amount is 50~ increase in area between entry and engine.
12

\
displacements from the side of the duct. To avoid interference from the flow on the side of the plate away from the intake, it was found necessary to make the forward extension of the plate longer than would represent a normal body. The results are therefore expressed in terms of thickness of the boundary layer, which can be estimated for a given body. In the present case the boundary-layer thickness on the plate, at the wing leading-edge position, was found by measurement to be one eighth
of the width of the intake. Fig. 20 shows loss coefficient for various positions of the plate. In Fig. 21 the percentage plate
effect (i.e. the fraction of the total difference between results for plate absent and plate continuous with intake wall) is plotted against spanwise displacement in terms of boundary-layer thickness.
This shows the rate of decay of the plate effect as the distance from the side of the intake is
increased. Some ambiguity exists in interpretation of the results, owing to the fact that with plate
in each of the two positions closest to the duct, flow separation occurs above a certain velocity ratio.
In these circumstances the improvement resulting from displacing the plate spanwise is initially more
rapid than would be the case if separation were not present. By choosing suitable values of velocity ratio for the cross plot, decay curves both with and without separation are obtained. In full-scale practice, the latter form would be the more likely to apply, independently of the value of velocity
ratio. We see from Fig. 21 that a displacement about five times the boundary-layer width is required
for the body effect to disappear entirely. This is about twicewhat would be expected for a squared intake. On the delta model with swept intake the width of the inboard lip (Fig. 3) is roughly 1½ times the estimated boundary-layer thickness for the body. Therefore, from Fig. 21, approximately half the maximum body effect (assuming no separation) remains in this case. The maximum effect itself is probably about half that measured on the second model with plate. In terms of total head, this means that the body-lip arrangement on the delta model contributes about 0.02% (two percent
ram) to the total intake loss at the level-flight point.
5.4. Tests with Controlled Suction.
Following the useful improvement obtained from a boundary-layer slot on the delta model (Section 4.4), tests were made on the swept-wing model to determine the quantity of air that has to be led
off, and to compare the merits of the alternative methods of suction at a single slot and distributed
or porous suction. In the first place, tests were made using a single slot, 0.3 in. wide, similar to that used on the
delta model. Fig. 22 illustrates the essential part of the model arrangement. The quantity sucked off
was measured inside the suction duct, which led through the interior of the wing to a system of
driving fans mounted beneath the tunnel. Measurements were made both with and without the plate used to simulate a body effect.
Loss-coefficient curves at constant CQ e (suction quantity) are given in Fig. 22, and show in both cases a progressive improvement as increasing amounts of suction are applied. By extrapolation the maximum useful suction coefficient is C O = 0.06 without plate and 0.10 with plate. At the level-flight point these values correspond to 12% and 20% of the main duct flow. With this maximum suction, the results with and without plate are practically identical up to the level-flight point,
e CQ = suction flow coefficient, defined as Volume flow in suction duct V 0 x Entry area of main duct
13

indicating that in each case the whole boundary layer ahead of the slot is removed. The residual slope of the loss curves may be attributed to boundary layers on the roof and floor of the approach, which are not affected by the slot.
In view of the large suction quantities involved in the single-slot method, comparative tests were made with the slot replaced by a porous sheet forming the complete inboard wall of the approach. Grade D Porosint was used, on the basis that this would pass about one third of the slot flow (i.e. 4~o main duct flow at an average pressure drop of 0.5%, the latter corresponding to Vo/V ~ =
2.0). The arrangement is illustrated in Fig. 23: a sealed tapering collecting chamber was provided behind the porous wall; from the collecting chamber the air was led through a measuring nozzle into the suction duct.
Loss coefficients with and without plate were measured as before, and are plotted in Fig. 23.
Without plate, the maximum useful suction flow is, as expected, about one third of that required with the slot. There is some accidental difference between initial conditions of the duct as measured on the two occasions, but the final result in the principal working range is much the same for the two types of suction. In the presence of an initial turbulent boundary layer from the plate, however, the porous wall is relatively less efficient, and requires practically the same suction quantity as the slot, with of course a much greater pressure drop.
5.5. Comparison of Slot and Porous Suction.
A summary of results and comparison of the two methods is given in Figs. 24, 25. In Fig. 24
loss coefficient at the level-flight point is plotted against CQ for each type of suction, with and with-
out plate. The gap between the final level of the suction curve and the line for zero sweepback effect is practically the same for both slot-suction cases and for porous suction without plate,
and may be taken to represent the effect of boundary layers on the surfaces of the approach to which the suction has not been applied. In the case of porous suction with plate, it is doubtful whether this minimum level could be reached, however great the suction.
A point marked on each curve indicates the amount of 'natural suction' available, i.e. that which would be obtained automatically from the influence of the intake pressure rise, assuming atmospheric pressure at the suction exit and no losses beyond those occurring on the model up to the measuring section in the suction duct. Natural suction provides the following proportions of the maximum effect possible:
(a) slot suction without plate 92%
(b) slot suction with plate 84%
(c) porous suction without plate 86%
(d) porous suction with plate 40%.
The conclusion is that slot suction gives a good result in both cases, i.e. it may be applied satis- factorily to any initial thickness of boundary layer within normal working limits. Porous suction is also satisfactory provided the porous area is of sufficient extent to control the boundary-layer development from the beginning; but is unsuitable in the presence of an initial turbulent boundary layer. For this reason the porous method could not be applied successfully to the case of a sweptback intake with an adjacent body, unless the body boundary layer were diverted by independent means.
14

In Fig. 25 an attempt is made to obtain a rough idea of the probable balance of gain and loss coupled with the use of suction. The improvement in the main intakeand the loss in the air led off are compared on a power basis (volume flow per unit time x gain or loss in total head). The loss side is obtained from the total head measured in the suction duct as part of the flow deter- mination. It represents the initial loss in the boundary layer drawn off, plus losses in the slot or through the porous wall, but includes no allowance for losses which in a practical installation might
occur in the suction exit system and in subsequent mixing. Curves of gain against loss are plotted for constant values of the main intake flow. It is seen that
the possibility of a net gain increases as the velocity ratio increases. A special point is marked on
each diagram indicating the result corresponding to natural suction at Vo/V i = 2.0. With slot
suction and no plate there is, under the assumptions made, a net gain at this point equivalent to
65~o of the observed improvement in the main intake. With the thicker boundary layer provided by the plate, the net gain is 75°/o. But with porous suction the pressure drop through the wall is so
high, despite the smaller suction flow, that no net gain is obtained; and from the nature of the
curves it seems unlikely that a profitable system, judged on this basis, could be obtained using the
porous-suction method.
6. Summary of Results and Conclusions.
The tests provide a comparison of external and internal characteristics of wing leading-edge and
nacelle-type intakes on a twin-engined delta-wing aircraft intended for high subsonic flight speeds.
The external pressure distributions substantiate the case for wing intakes with buried ducts. On the internal side the additional losses associated with sweepback of the entry have been investigated, and data are provided for application to swept intakes in general.
The main results and conclusions can be summarised as follows:
(1) On the delta model, leading-edge intakes with buried ducts and a narrow front body give a greater effective sweepback (judged by the direction of the isobars) than nacelle-type intakes adjacent to the body. Over the region from 10~ to 30~o semi-span, the average improvement is 10 ° in effective angle of sweepback for squared leading-edge intakes, and 22 ° for intakes swept to the line of the basic leading edge. Estimated critical Mach numbers in this region are
0.81 for the nacelle intakes,
0.85 for the squared leading-edge intakes and
0.94 for the swept leading-edge intakes.
(2) Against this improvement there is an internal loss associated with sweepback of the entry,
amounting in the present case to 4 .7% on the ram efficiency of the intake under level-flight
conditions. An explanation of this loss is found in the nature of the retardation of flow ahead of the entry. The loss varies approximately as tan 2 ~, ~ being the angle of sweepback.
(3) Most of the internal loss associated with sweepback can be removed by means of a boundary- layer bypass, consisting of a flush slot in the wall of the intake. On the delta model the slot increases the ram efficiency of the swept intake by 4.00/0 . A porous wall may be used instead of the slot in limited circumstances, but this method is relatively uneconomical.
(4) Data for the swept intake are provided showing the associated effects of
(a) changes of shape and direction in the duct,
(b) an adjacent wall, as of a fuselage.
15

(5) The application to swept intakes of a general method of estimating intake loss is described in an Appendix. Further conclusions are drawn regarding the effects of entry shape, and of changes in the design velocity ratio for level flight.
Acknowledgements. All the members of the subsonic duct research group assisted in the investigation at various times.
The contributions of J. Scanlon e and D. B. Barret, B.A., who were engaged on most of the experimental work, require special mention.
~ On loan from Westland Aircraft cO. Ltd.
16

%
qi
H
AH
Hi, A
Ai P
x
L
S
I
cF
R
k
M
¢ w
X
Q
Q8
CQ
AHo
LIST OF SYMBOLS
Free-stream speed
Mean entry velocity, based on projected entry area
Entry velocity ratio V° Vi Free-stream dynamic head ½p K0 ~
Mean entry dynamic head ½p Vi a
Mean total head at section of duct representing engine position
Difference between free-stream total head and H, i.e. intake loss:
Similarly defined for the projected entry section
Duct area at any section
Projected entry area
Duct perimeter at any section
Projected entry perimeter
Distance along duct measured from projected entry section
Length of duct from projected entry to engine section
Total surface area, ahead of projected entry plane, wetted by duct air when flowing at velocity ratio/~ = 1.0
Duct integral= o \ A ] A i dx
Effective friction coefficient of intake system
Duct Reynolds number = 2AiVo/vP i
Empirical retardation factor in intake loss
Static-pressure coefficient (local static pressure-free-stream static pressure)/qo
Mach number
Angle of sweepback of entry plane (unprojected)
Spanwise width of leading-edge entry
Spanwise displacement of boundary-layer plate from inboard wall of intake
Boundary-layer thickness on plate at wing leading edge
Volume flow in main intake = A i V i
Volume flow in suction duct
Suction flow coefficient, Q8 AiVo
Total-head loss from free stream.to measurement in suction duct
Total-head gain in intake due to suction
17 ( 8 9 1 6 1 ) B '

No. Author~)
1 A. Spence and J. Seddon ..
3 J. Seddon and A. Spence ..
4 J. Seddon . . . . . .
5 L. Prandtl and O. G. Tietjens
REFERENCES
Title, etc.
A review of wing leading edge entry design based on the results of model tests at the R.A.E.
R.A.E. Report Aero. 1989. A.R.C. 8351. November, 1944.
Unpublished M.o.A. Report.
A wind-tunnel investigation of entry loss on propeller turbine installations. Part I: Annular entries behind propeller.
A.R.C.R. & M. 2894. August, 1948.
A general method of estimating the total head loss of subsonic aircraft intakes under: flight conditions.
Unpublished M.o.A. Report.
Applied Hydro- and Aero mechanics. Chapter III, p. 45, Fig. 24. McGraw Hill Book Co., New York. 1934.
18

APPENDIX I
Note dn a General Method of Estimating Intake Loss and its Application to Swept Leading-Edge Intakes
1. Introduction.
A general method of estimating intake loss in subsonic flow is to be given fully in a separate report 4. The following notes give a brief account of the method as applied to swept leading-edge intakes, and indicate the measure of agreement between theory and experiment. The method is used to show the way in which the loss of a swept intake varies with the shape of entry, and also the effect of sweepback on the optimum velocity ratio for level flight.
2. Notation.
The notation, additional to that defined and used in Section 4 of the report, is as follows:
A Area of any duct cross-section
A~ Projected entry area
P Perimeter of duct cross-section
x Distance down duct, measured from projected entry plane
L Total length of duct (entry to engine)
S Total surface area, ahead of projected entry plane, wetted by duct air at velocity ratio 1.0
I Duct integral = 0
c F Apparent friction coefficient of intake system
/~ Entry velocity ratio V°
k Empirical retardation factor in loss formula
R Duct Reynolds number = 2AiVo/vP i.
3. Loss Coejficient at Velocity Ratio 1. O.
Intake loss is considered as the sum of two components:
(1) the approach loss consisting of the loss of total head up to the projected entry plane as determined by body boundary layers, sweepback effect, etc.;
(2) the duct loss, or loss of total head between the projected entry plane and the final duct section before delivery to the engine, as determined by the length of duct, diffusion ratio, curvature and change of section.
19 (89161) B 2

A formula for duct loss has been suggested previously (Ref. 3). In its most general form this is
= C fo ,A: Ai dx : (1)
At velocity ratio 1.0, i.e. when there is no pre-entry retardation, the total intake loss is obtained
by adding a similar te rm for friction losses on the surfaces of the approach. Here the local velocity
is not constrained as in the duct, but it is sufficiently accurate to assume a constant velocity V 0 • The approach loss is then
and the total intake loss
S c~
- c F + . ( 2 )
Using equation (2), the apparent friction coefficient of an intake is determined from the measured
loss at velocity ratio 1.0. Values of c~ derived in this way for the leading-edge intakes on both the
delta and simplified models are given in the table below. Values of the parameters S/A i and I are
also shown. In the case of the delta intakes S/A i includes an allowance for the body and inboard
lip. Following a conclusion drawn in Section 5.3 of the report this is taken as half the maximum
body contribution (given by inboard height of entry x length of body ahead).
Type of intake
Complex intake on delta model
Parallel intake on simplified model
Diffusing intake on simplified model .
Entry Sweepback
52 ° 40 ° 30 °
0 o
52 °
52 °
S
Ai
10.05 7.70 6.13 2.75
7.67 7.67
5.12 5.12
10.85 15.40 18.30 24.15
(a) 18.7" (b) 66.7
(a) 14.7* (b) 37.7
C~
• 0.0053 0.0050 0.0056 0.0052
0.0036 0.0043
O. 0060 O. 0053
The value of c F for turbulent flow in a smooth pipe at the average Reynolds number of the
tests is 0. 0042 according to BlasiusL Results for the parallel intake are seen to be in good agreement
with this value. Those for diffusing intakes are on the average about 30% higher.
There is evidence to show that within the accuracy required for purposes of estimation, scale
effect on the loss of a developed intake (i.e. one without separations) follows the standard pipe-
flow law. To a crude approximation this would mean that full-scale losses are of the order of
two-thirds the magnitude of those measured in model tests of the kind described in the report.
Differences in surface roughness can alter this relationship considerably, however, and since such
differences are generally to the detr iment of the full-scale intake, the net scale effect is likely to be smaller.
* The two values of I in these cases apply to measurements at different positions down the duct, (a) the nominal engine position and (b) the model exit.
20
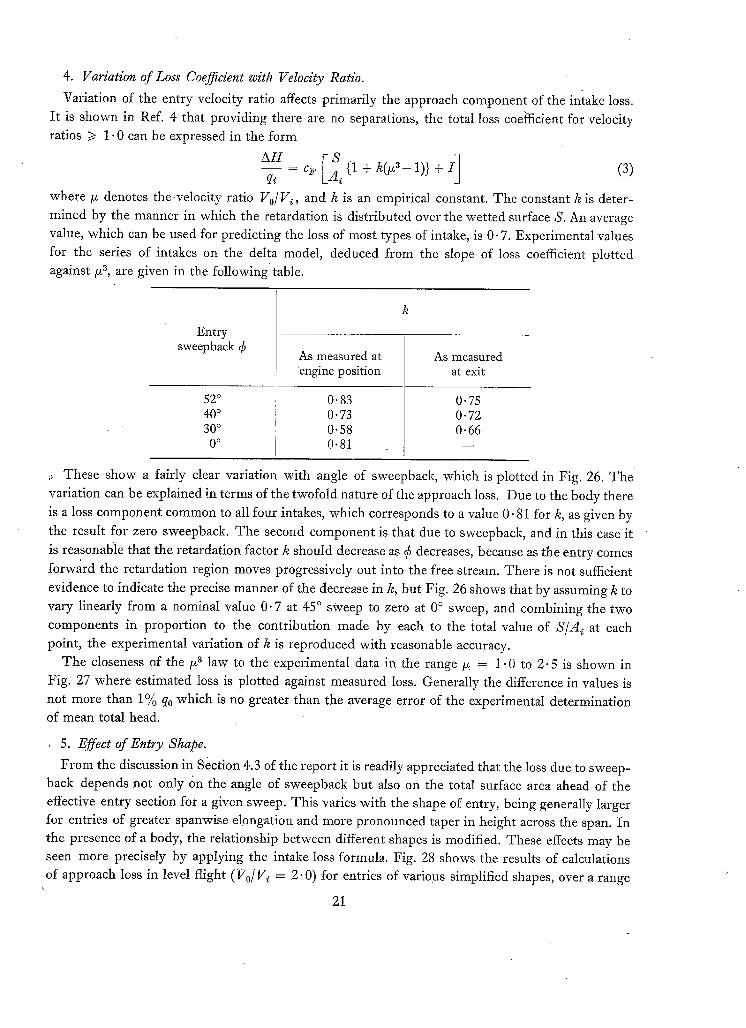
4. Variation of Loss Coefficient with Velocity Ratio.
Variation of the entry velocity ratio affects primarily the approach component of the intake loss.
It is shown in Ref. 4 that providing there are no separations, the total loss coefficient for velocity ratios i> 1.0 can be expressed in the form
e - {1 + + (3)
where/z denotes the-velocity ratio Vo/Vi, and k is an empirical constant. The constant k is deter-
mined by the manner in which the retardation is distributed over the wetted surface S. An average
value, which can be used for predicting the loss of most types of intake, is 0.7. Experimental values
for the series of intakes on the delta model, deduced from the slope of loss coefficient plotted against/x 3, are given in the following: table.
Entry sweepback ¢
52 ° 40 ° 30 ° 0 o
As measured at engine position
0.83 0.73 0"58 0.81
As measured at exit
0.75 0.72 0.66
~ These show a fairly clear variation with angle of sweepback, which is plotted in Fig. 26. The
variation can be explained in terms of the twofold nature of the approach loss. Due to the body there
is a loss component common to all four intakes, which corresponds to a value 0.81 for k, as given by
the result for zero sweepback. The second component is that due to sweepback, and in this case it
is reasonable that the retardation factor k should decrease as ¢ decreases, because as the entry comes
forward the retardation region moves progressively out into the free stream. There is not sufficient
evidence to indicate the precise manner of the decrease in k, but Fig. 26 shows that by assuming k to
vary linearly from a nominal value 0.7 at 45 ° sweep to zero at 0 ° sweep, and combining the two
components in proportion to the contribution made by each to the total value of S/A i at each point, the experimental variation of k is reproduced with reasonable accuracy.
The closeness of the/~a law to the experimental data in the range/4 = 1.0 to 2.5 is shown in
Fig. 27 where estimated loss is plotted against measured loss. Generally the difference in values is
not more than 1% q0 which is no greater than the average error of the experimental determination of mean total head.
. 5. EffectofEntry Shape.
From the discussion in Section 4.3 of the report it is readily appreciated that the loss due to sweep-
back depends not only on the angle of sweepback but also on the total surface area ahead of the effective entry section for a given sweep. This varies with the shape of entry, being generally larger for entries of greater spanwise elongation and more pronounced taper in height across the span. In the presence of a body, the relationship between different shapes is modified. These effects may be
seen more precisely by applying the intake loss formula. Fig. 28 shows the results of calculations of approach loss in level flight (Vo/V i = 2.0) for entries of various simplified shapes, over a range
\
21

of angles of sweepback, with or without an adjacent body. A constant entry area is assumed, and the body length forward of the intake is taken to be 6 x @(entry area) (e.g. a 10 ft nose with an intake of 2.75 sq. ft entry area). The apparent friction coefficient is taken as C s = 0.005.
With a circular entry the effect of sweepback is small, and the effect of body, since there is only single-point contact, is zero. e" The high efficiency of an intake of this type is confirmed by tests in the report (Section 4.2). An elongated entry, of width four times the mean height, has roughly three times as much loss due to sweepback as the circular entry, the loss amounting to 6 or 7% ram at 60 ° sweep. The body effect, assuming no lip or bypass, is a further 2to 4~o ram depending on the amount of taper of the entry. With an entry elongated in the 'vertical' direction, the body effect is all-important
and without a bypass, may amount to 8 or 10~o ram. Sweepback in the 'horizontal' plane has little application to this type of entry; in any case the effect is small.
A few examples of typical wing-root intakes of practical design (including body-side intakes) are placed in the diagram. These show roughly to what extent the various lip or bypass devices can be expected to reduce the intake toss.
6. Optimum Velocity Ratio for High Speed.
The choice of entry area of an intake is normally governed by the need to operate close to the optimum velocity ratio when in level flight. For a pitot intake, unhampered by forward boundary layers, the optimum velocity ratio, purely from the internal aspect, is clearly infinite; since the bigger the entry the lower are the internal velocities. External requirements decree that in fact the design velocity ratio shall not normally be greater than 2.5, and for leading-edge intakes, where those re- quirements are particularly stringent, a value of 2.0 is generally accepted. It has been tacitly assumed throughout the report that the value 2.0 represents a satisfactory design point for all angles of sweepback. In view of the adverse effect of increasing velocity ratio on highly swept intakes, this assumption should be examined critically in order to determine to what extent the sweepback difficulty can be alleviated by the choice of a still smaller design velocity ratio.
Using the intake loss formula, calculations of ram efficiency have been made for a 4 : 1 rectangular intake at various angles of sweepback, with prescribed values of the duct integral I. A set of curves for one value of I is given in Fig. 29. The optimum design points are joined by a dotted line. It is seen that with this particular value of l, velocity ratio 2.0 is the optimum design point for a sweep- back of 50 °. For smaller angles of sweep, optimum design would require a higher velocity ratio, which however is normally precluded for external reasons. Only in the case of an intake swept back more than 50 ° would a practical gain be possible by choice of a design velocity ratio different from 2.0. For 60 ° sweepback the optimum is at 1.7.
In practice, if the design velocity ratio is lowered by decreasing the entry area, this will normally increase the duct loss (see Section 5.2 of main report), thereby offsetting some of the expected improvement. This effect would be best taken into account by examining sets of curves for different constant values o f / .
In Fig. 30 the difference between optimum ram efficiency and that at Vo/g ~ = 2.0 is plotted against angle of sweepback for two values of I. It is seen that up to 60 ° sweepback, apart from the high and impractical velocity ratios required for zero or very small sweep, the optimum velocity ratio gives no more than 1% better efficiency than the generally accepted design value of 2.0.
e Only approximately true, since the body boundary layer has real thickness~ which overlaps the entry.
22

Delta model: Wing
TABLE 1
Model Data
(Models 1/7 scale; dimensions full scale)
area
span
mean chord
centre-line chord
aspect ratio
leading-edge sweepback
dihedral
twist
angle to body
section
895 sq. ft
52 ft
17.2 ft
32.0 ft
3.0
50 ° 0 o
0 o
0 o
Symmetrical, max. tic = 10% at 35%c
Body length
max. width, front t max. width, rear ]
max. depth
Nacelle httakes Wing intakes 49"3 48.0 ft
9.8 4 . 4 f t
7 . 3 f t
5 .2 5 . 0 f t
Intake.s: entry area
entry width
entry height inboard entry height outboard
entry mean height/wing thickness entry o,~erhang
engine area
2.75 2.60 sq. ft 1.87 3.42 ft
(circular) 1- 09 ft
0.44 ft
- - 0-28 0 o ,15 °
4" 95 3" 90 sq. ft
Swept-wing model: Wing area
span
chord (constant)
leading-edge sweepback
dihedral
twist
section
Intake: entry area
entry width
entry height (constant)
entry mean height/wing thickness entry overhang
engine area
entry area for diffusing duct
1125 sq. ft
35.3 ft
31.8 ft
52 ° 0 o
0 o
Cambered, max. t/c = 8}% at 34%c
2.61 sq. ft
3.50 ft
0.76 ft
0.31
15 ° 2.61 sq. ft
1.83 sq. ft
23

T A B L E 2
Internal Loss of Swept Leading-Edge Intake on Delta Model
Vo Forward speed + mean entry velocity Vi
H i Arithmetic mean total head at entry
AH i Loss of total head to this point
H Arithmetic mean total head at engine
AH Loss of total head to this point
q0 Free-stream dynamic head
qi Mean entry dynamic head
(X
0"3
3"5
6 '8
11 "0
0"03
0" 20
0"36
0"59
Exit Area sq. ft
full scale
4"84 3"47 2"57 1"95 1.54 1 "08 0.99
4" 84 3" 47 2.57 1 "95 1 "54 0"99
4" 84 3 "47 2'57 1"95 1"54 0"99
4"84 3"47 2-57 1"95 1"54
0"99
G Vi
0"72 0"88 1"12 1 "51 1 "96 2"69 3"22
0"72 0"89 1:11 1"51 1"91 3"19
0"74 0"92 1'16 1 '55 1 "98 3"28
0-80 0"98 1.21 1"65 2"03 3'30
Approach Loss
Hi AH i
qo qi
0.952 0.025 0.980 0- 015 0.976 0.030 0.976 0.055 0.970 0.115
0. 892 1-120
0. 948 0.027 0-988 0-010 0. 984 0- 020 0. 986 0. 032 0. 976 0.088 0. 904 0.974
0.94O 0. 033 0.982 • 0.015 0.988 0.016 0-954 0.111 0. 890 0- 431 0. 906 1. 011
0. 882 0. 075 0. 898 0. 098 0. 854 0. 214 0.766 0. 637 0.742 1.063 0-818 1.980
Total Intake Loss
H AH
qo qi
0. 743 0.133 0. 845 0.120 0. 898 0.128 0- 901 0- 226 0. 891 0.421 0. 836 1.190 0. 823 1. 830
0.739 0.135 O- 868 O. 104 O. 899 O. 125 O. 903 O. 220 O- 897 O- 376 0.830 1.730
0.769 0.126 0.827 0. 146 0.885 0.154 0.898 0.244 0.882 0.462 0. 843 1.680
0.688 0.199 0. 805 0.187 0. 844 0.229 0. 826 0.472 0- 809 0.784 0.837 1-770
24

Internal Loss
7o Vi Hi
AHi H
AH
.qo
qi
T A B L E 3
of Squared Leading-Edge Intake on Delta Model
Forward speed + mean entry velocity
Arithmetic mean total head at entry
Loss of total head to this point
Arithmetic mean total head at engine
Loss of total head to this point
Free-stream dynamic head
Mean entry dynamic head
0~
0.3
3.5
6"8
11"0
cL
0.03
0"20
0"36
0.59
Exit area sq. ft
full scale
4"84 3"47 2"57 1.95 1"54 0"99
4"84 3 "47 2"57 1"95 1"54 0"99
4" 84 3"47 2"57 1 "95 1 "54 0"99
4"84 3"47 2"57 1"95 1"54 0"99
vo
0.69 0" 87 1.12 1.44 1.81 2.95
0.73 0-89 1.14 1.44 1.79 2.95
0 '77 0.95 1.22 1 '48 1.89 3"00
0"85 1.03 1.26 1.59 2.03 2.80
Approach Loss
qo qi
0.974 0.012 0.972 0- 021 0.972 0.035 0.978 0-046 0- 972 0- 092 0.972 0.244
0- 980 0- 011 0.976 0.019 0- 976 0.031 0.982 0.037 0.982 0.058 0.980 0.174
0.986 0.008 0.986 0.013 0.988 0-018 0.986 0.031 0.988 0.043 0.984 0.144
0.924 0.055 0.914 0.091 0.924 0.121 0.924 0-192 0.922 0.321 0.930 0.549
Total Intake Loss
H
%
0.727 0.818 0.882 0.929 0.932 0.945
0.686 0- 805 0. 873 0.919 0.933 0.942
0.632 0.754 0.837 0.892 0.909 0.934
0.458 0.585 0.695 0.781 0.797 0- 877
AH
qi
0.130 0.137 0-148 0.147 0.222 0.482
0.167 0.154 0.165 0.167 0.216 0.500
0.218 0.222 0.243 0.236 0.324 0.590
0.390 0.440 0.484 0.552 0.834 0- 964
25

T A B L E 4
Effect of Angle of Sweepback on Intake Loss---Leading-Edge Intakes on Delta Model
Vo
:,Hi H
AH
qo
qi
o~ = 0.3, C L = 0.03
Forward speed - mean entry velocity
Arithmetic mean total head at entry
Loss of total head to this point
Arithmetic mean total head at engine
Loss of total head to this point
Free-stream dynamic head
Mean entry dynamic head
Angle of sweepback of entry plane (Fig. 15)
40 °
30 °
o
Exit area sq. ft
full scale
4-84 3"47 2"57 1 "95 1 "54 0"99
4"84 3 "47 2.57 1.95 1 "54 0'99
2"57 1"95 1'54 0"99 0"99
Vo Vi
0"68 0"86 1.10 1 "47 1 "90 2"96
0"68 0"86 1.11 1.47 1 "84 2"88
1.13 1.50 1.88 2.89 2.88
Approach Loss
% qi
0. 982 0- 008 0- 992 0. 006 0. 989 0- 013 0. 993 0- 015 0. 985 0.054 0. 955 0. 394
0. 994 0.003 0. 991 0. 007 0.990 0. 012 0.992 0. 017 0. 989 0- 037 0.974 0.216
0. 995 0.006 0. 990 0. 022 0. 990 0. 035 0. 983 0.,142 0.980 0.166
Total Intake Loss
H AH
qo qi
0.786 0.099 0. 858 0-105 0. 895 0-127 0. 925 0.161 0. 923 0.278 0. 889 0. 970
0.747 o. 117 0. 826 0.128 0. 881 0.146 0.918 0.178 0. 933 0.227 0. 929 0.590
0. 887 0.144 0.926 0.167 0. 935 0.228 0.958 0.353 0.948 0.391
26

T A B L E .5
Effect of Boundary-Layer Bypass on Swept Intake. Slot shown in Fig. 17
v0
H
AH
q0
qi
Forward speed - mean entry velocity
Arithmetic mean total head at entry
Loss of total head to this point
Arithmetic mean total head at engine
Loss of total head to this point
Free-stream dynamic head
Mean entry dynamic head
0"3
3"5
6.8
11.0
0"03
O" 20
0"36
0"59
Exit area sq. ft
full scale
4" 84 3"47 2"57 1"95 1"95 1"54
3"47. 2"57 1.95 1-54
3"47 2"57 1"95 1"54
2"57 1"95 1"54
Vo
0"68 0"87 1"08 1 '47 1-81 3"00
0"86 1" 07 1"41 1"86
0-90 1.12 1.44 1"93
1.23 1 "59 1 "98
Total Intake Loss
H
qo
O. 740 O. 844 0.913 0-932 0.928 0-930
0-870 0-925 0.931 0.922
0.855 0.906 0.906 0-878
0.799 0.786 0.750
AH
qi
0-120 0.118 0-101 0.147 0.235 0-631
0-096 0"086 0"137 0-268
0.117 0.118 0.194 0.456
0.305' 0.541 0.976
27
_ I - ~ ©
bO
½ . . . . . _ . . . . . 2 2 2 2 - - 2 2 (
Scale"
, 2 4 9 8 I(} [Z 14 Feet , I~ull SiZe
FIC. 1. General arrangement of delta model with nacelle intake.
Scale :
2 4 I 6 B IO Fectjl'ul[ sl'z~: ['2 ['8 Inches, model s ize
Fie. 2. General arrangement of delta model with swept intake.

b~
'1 °
\ \
t I I I
I I I I I I I I I I I I I I I 1/
S c a l ~ :
[ 2 5 I t 11
o u
- o £
E~ o , .
II 4 t F~et~ fu l l s ize
IncheS, mod~l size
I I I I I I I .
' , \ U
\ \
× \
I ,::;, < i T .
~ o
Sccal~z ~
i ii
FIC. 3. Details of swept intake. FIc. 4. Details of squared intake.
Modifbzd s(~ct ion
...,B~ Sic s~ction
~X, swept
Scale: 1 2 S
I" t , I , ,r 2 3 4 5
Modified section
-
4 F<zct, full size i inches, mod(zl size
~o~ ~c
~ - - X~ s q u a r e d
FIG. 5.
, y/Bosic section
Sections X - X and Y-Y marked on Figs. 3 and 4
Profile shapes for swept and squared intakes.
3 0

Cp
-0"2
~ _ ~ , t . ~ . . Position of traverses: A (Lip centre-line) ~//
~'/. B {Duct centre-line) / / / / / / / -
//
C ( mid 7 S <a._SP_a_E.)~ __~
Traverse A
~ . ~ P l a i n wing
D L.E.
Cp
-0.2
Traverse B
/ <-"~7-<x, - - -2 - x -×~ . . .~ " - . x j Plain wing
0 " ~ _ x~. LE.
FIG. 6. (C L = 0) on model with swept intake.
~T,E Cp Traverse C ~
-O-Z x- f × - % ~
/ \ ~/
LE. T.E.
Typical chordwise pressure distributions
L.E. T.E.
Fro. 7. Typical chordwise pressure distributions (C L = 0) on model with squared intake.

f ,/~:"Dl{Yl;n ~,
;o--g.,Z~.~o l J 25 I
\ \ \ \ \ \ \ \ \ \ \ \ \~
/ ~J --_ I ( \
Entry peak lin£
Squared I~ad(ng- ed~ intake
- \ \
\ \
\ \
\ \
\ \
\ \
\
S
Fro. 8. Isobar diagrams for swept and squared intakes (Cr~ = 0). Pressure given as (-C~0 ) x 10 2.
FIG. 9. Isobar diagrams for nacelle intake and plain wing (C z = 0). Pressure given as ( - C ~ ) x 10 2.

1.0
0.9
Mcr; t
0 " 8
0°7
I I Swept leading-edge ~ntake
/ ~ _ _ . - - - - ~ - - -~ . . . .
Squared lead ing-edg¢ X ~ I in take
\ I
\ / - PosMbl¢ e f fec t o f ~°" ~ _ _ o - - " entry peak
0-I 0-2 0"3 0 "4 Dist. from model centre- lln¢ -'. seml-span
"FIG. 10. Est imated local critical Mach number (C L = 0)-- leading-edge intakes.
0-5
I°0
0"9 Merit '
0"8
0-7 0
I Plain w;ng (no intakes)
I
___.+ I • j Possible e f fec t of entry peak
0.1 0,Z 0"3 0"4 Dist. from model centre-l ine--semi-span
0"S
FIG. 11. Est imated local critical Mach number (C L = 0)--nacel le intake and plain
wing.
0"8
AH qi
0-6
0-4
0-Z
at ic
r 1 . 0 Ram e f f i c iency H
~- -'-'-'--x 0.9
/~ ~x~" 0.8 / Loss coeff ic ' lent
- - x - - Swept leadlng-edge in take
Squared leading-edge in take
Nacelle in take x'
.
o 0 ° ~ - o " - ~ I
/ /
Cllm b Level Dive I I I
I -0 Z-0 3-0 Vo/V = = forward speed~mean, entry v e l o c i t y
FIG. 12. Intake loss (C L = 0) of principal arrange- ments on delta model,

4~
0-6
0"4 S ~
Cp i/ ~ ~., I---- ~o" / 0.z / . " , , "d / (el;rob)
/ ~. , . . /~ ~o 0-8 O
0.6 -~'" - " ~" -~" /
Cp I
0"4 / ~ . ' / I l / Oe--'
0"2 ~ fh'gh t ) i
/ 0 1"0 - - ~ - -
O'g ~--x 0 /
0.6 / / ¢~ I
(d;ve) // / ~ - - Swe)t intake __
0"4 ~ < Squared intake
o x / <
o.z ~ /
0 ? h Swept [ntak¢ *L Ip " * " ' -App roach - - ~ Duct
Squar~l intake.Lip . ~ /, IDuc t I 0 0-5 I'D 1-5 2-0 Z-5 3"0 3"5
Distance from leading edge of l ip -: /ntakewidth
Fro. 13. Pressure gradient at zero inci- dence on inboard wall of swept and
squared intakes.
Values assigned to contours are of percentage f ree -s t ream head Le, 100 H/qo
Bad
¢ ¢ j- . /
. /
@ Squared Jntoke:Vo/Vi=l'O Squared intake:Vo/Vi=Z.O
Swept intake:Vo/Vi=l'O Swept intake:Vo/Vi=2.0
,0
0.5 ~ v°/v~ =F° o.s, , X Y X Y
Traverses XY
FIG. 14. Distribution of total head at engine position. (Port duct facing down-
stream: a = 0°.)

e~
I I'O
Ram ef f ic iency <~=O ° H
~ r - - ~ . ~ . . 4 o O * - o . 9
1.0 l
Loss i co~f f ic~ent
0 " 8 I A n g l e o f .
qi I I .-.~2" ,S:~y
0.6 5oO~ . Q / o/',A"
40 / /,~1 Duct
0 i-o Vo/V i z-o 5-o
FIG. 15. Effect of sweepback on intake loss at. C~=O.
Point3 are cro3s plotted from experiment curves CFig, 15~. Full lines are curves of tcln 2 ~ through
| . i - end point3. Dotted line is a curve of tan through end points.
1.0
, 0-8 AH ql
0.6
0.4 j J
~ ~ 2, . , . . . . . .~. . . ~
/ /
vV--i= Z-5
J
0 ° 10 ° 20 ° 30 o 400 500 60 o
Entry sweepback
FIG. 16. Loss coefficient vs. angle of sweepback at constant velocity ratio (Cr, = 0).

C~
] Squared Ram efficiency intak2_x ~
~' With / '* slot
/ W i t h ~
I ' 0
Loss coefficient / I I
&H W ~-V
Slot entr ~ / 6 O. 6 - - With /
/ /-"
' Squared / exit \ ~ , / " intake
I I i
0.2 t
0 I-0 2.0 3"0 Vo/Vi
i,0 H %
0,9
Fzo. 17. Effect of boundary-layer slot on loss coefficient of swept intake at C L = 0.
0"8
1.4
1.2 (°) - - s.ept intake / f - ' l / J
(o) (b) =° CL x ® 0 0 L o O 3 I/2 0"2
t • 0 t ® 7 0 "4 ' ~ -
Al l I~ 13 II 0,6 0 -6 qi
,1 / /
0'6 ~ /. / ... . . d 0 . 4 / -
0-4 "-o- ~ .'". ~ . j> / / 0
o l.o v o i v i 2 .0 3.0
0-8 Swept intake / Squared i n t a k e
, . ....¢ % . 4 - + - + - r - ; - - t - ÷ - r / , , /
o z - o - - T - ' ~ ' - - - ~ " v ° I v r l ' ° -
0 0-2 C L 0-4 0 -6
FIO. 18. Variation of loss coefficient with incidence.

D~ectioo / / / of air f l o w / ~
• E Z I i • I I
B [ - i B Duct sections
l I AA I I B B
Parallel duct
Dif~ctlon I / of o,rflow ~ l
" f A ~ A
I I
Duct sectfons AA
I } B B
Diffusing duct Body - ~
Direction / of airf o w / ~ [
Complex duct / ~w[th entry taper d if fuslonj cur vat u rej change of sect[on~" and body wall etfec~
E . ~ " I -A t -/ " \~
B , - ' , B / / Duct sections
A A ing
Complex duct
" ~ duct 5//~ara lie I
l .o %1 vi 2-0
FIe. 19. Effect of duct shape on loss coefficient.
'0
&H qi 0,8
0-6
0.4
0.2
3.0
' 3 7
O~rectlon I X ~ L . air, ft, ow ~ ~/ E.
Boundary- E n t ~ l l l <--layer plate
I I
I I
- - t - - - --1--
S
1'0
Shaded area denotes flow saturation I in intake caused by plate boundary! layer ~ t
N S °i:o "Thickness of plate boundary " layer at wl'ng lead~ng edge =0-125 w, I
v l v ~ z-0
['0
0.8
&H qi 0.6
0"4
0"2
0 3-0
FIG. 20. Loss coefficient for various positions of plate.
100
75
: 5o
25
, , i .
\ X= displacement of plate from wall of {ntake \ 6 = thickness at plate boundary layer at
wing leading edge
\ Vo/Vi = 1"6 (noflow separati'on, J
~ Vo/V=2"O (separation present for . ~ "' d~splacemcnts less than
. . / I ~ I'1 x B.L.thl'ck . . . . ) ; -~ ~ . . "P'°e;2edd, tXiTog~, "P
I 2 X l 6 3 4 5
FIG. 21. Rate of decay of plate effect.
FIGS. 20 and 21. Representation of body by flat plate.
38

c~3
1"2
1.0
0"8
0"6 AH qi
0"4
O"Z
Bc~Jndary-~ ~pmte
~ Suction duct
With ~late
//
//
slot sealed # "
/ t
.i I*
0 '0-8
0.6 Without plate
H ,,@'~ No suc t ion :
0"4 slot sealed- ~
Volume flow through slot / / O'Z _CQ= Voxcntryarea ofmoinduct
0 I-0 Vo/V I 2-0 3 .0
FIG. 22. Loss coefficient at various rates of suction: swept intake with boundary-layer slot.
I' 2 Boundory-~ layer A~" /
0 / / o.o ~ ,
,~ ,~.-, , //~/~/! / ~/~,~/ AH qi 0-4 ¢
With plate
0"20 !
Wi hour plat 0.6
&H t- Volume flow throuoh suction duct ~1/ ~,~ ~o= VoXO,try ° r , °o : m°l, d~t OO/ ./1/~
No suction : / ¢; /~- o. .o.o.°.o,,,///'-./
0 1.0 VolV i 0 3.0
FIG. 23. Loss coeffcient at various rates of suction: swept intake with porous wall.

0 .5
0 ,4
~_HH qi
0'3
0"2
0.1
"0'4
0-3
A H q!
0-2
0-I
1 I Slot suction
plate
Without plate
~o suction: ~ / ~Iot scaled*
lno plate) Vo/Vi= 2-0 \
- ~ - - - -
Effect of -sweepbacl~ . . . . . . . . . . . ~_ . . . . ~ . . . . . . . . . reduced to /
zero Point on each curve indicates amount of natural suction possible assuming atmospheric pressure at
suction exit. i
0 0"02 0,~04 CO 0-06 O~-OB 0"I0
No ~uctlon~ wall sealed (no p l a t e )
Effect of s~zep~c k
I I
Porous suction
With plate
Vo/V i =2-0
plate
reduced to t zero
Point on each curve indicates amount of natural suction possible assuming atmospheric pressure at
suction exit ' O 0.02 0.04 0!06 0~,08
C o 0.10
FIG. 24. Effect of suction on loss coefficient: summary of results for level flight.
z °
c
.E g
g o.
0-02
0 '01
0'02
0'01
0'06
0'04
0-02
-' Vo/V i / + / / ~ + ~ Z' 8 / ,
/ 2,1 , ~ --'---~-- 1.9
no plate
0.01 0.02 / /
/
/ /
/ /
/
Vo/vi
/ /
0'0~, 0.02
vo/vi ~2-2
; ~ l '9
"5 / f / ~ / / . 0
Slot suction no plate
0.03 / t /
/ /
/
/ /
/
Slot suction with plate
(Note change ofscale)
0,02 0.04 0.06 Qs~Hs
Power loss in suction duct VoAi qo
FIG. 25. Power gain and loss with suction on swept intake.
g.=_
= _ o ~> ._c-o_u
Io ~ =- "6 .2
II "= ~
L o
o .~_ E L . . ~ .-= ~ II
U ~._c
o

a)
q=
20
o~
°.C.lO
o
~E 5
1,0
0,~
0.6
k
0.4
0"Z
i 1 Body k (mea~,urN at~ O)
\ _> Combined k / / / (calculated')
/ / / /
/ : Sweepback k / .Guggested)
/ /
/ / /
J I n Denotes experimental results
I t I I 20 30 40 50 60
Angle of sweepback (~B)
Fro. 26. Variation of k (retardation factor) with sweepback.
0
FIG. 27.
AH -~1 =CFE--~i{ I +
= Vo/Vi 1,0</~< 2.~ k varies with sw~zpbock as in Fig. 26
o/ : /
S ,
c .~..W~,~F~ Key to results / Delta model,cornplex intoke~q~=52 ° x
/ S ° Delta mod~l,compiex mtok¢,~b=40 o Delta model,complex intake. ~=30 ° + Delta model,compleX intake,qb = 0 ° a Swept model.parallel intoke,~,=SZ ° z~
• . o Swept model,d=ffuslng intak~ ~ =5Z
5 10 IS 20 Estimated loss (°/o % )
Correlation of estimated and measured intake losses.
8
~4E o
2
- J / i 1 _ / ' J - - !
- - - - - /
• //,
/ . / ' S
40 60 Z0 Entry sweepback (degrees)
Notes:- Full l ines:wi thout body, Broken lines: with body, Body length ahead of entry ~ 6 x / e n t r y area. v o / v = Z - O , C F =O-OOS.
Typical examples : [~ Body side intake wi thout bypass
Body side intake with bypass (normal inboard slot) O Root L.E, intak¢ on wing of moderate sweep without lip
Root L.E, intake on wing of moderate sweep with lip /x RootL.E. intakeon delta without I~p or bypass
. A RootL.E, intokeon delta w~th lip and bypass Cspeclal internal slot)
Entry. shapes: shad ing denotes adjacent body.
FIG. 28. Approach loss of wing-root intakes in level flight.

1.0
H qo
0'9
0'8
0
Fig. 29.
¢__~0o 200
/ ~ ~ 4 0 o
Y/ o&.c;eoo ,n. "<--.
/ ~ ° I y l 4 = angle of sweepback
I = 20
I I 1.0 / l 2.0 3'0
Optimum velocity ratio for different sweep- back angles.
0'02
qo
0-0
AH/q ° = d i f f e r e n c e in ram e f f i c i e n c y be tween peak value and that for /1=2.0
I=20
\\ 20 °
#opt > 2"0[ #opt< ~O
40 ° 60 a
FIG. 30. Difference between peak efficiency and that for velocity ratio 2.0.
(89161) Wt. 64/I418 K.5 7/64 Hw.
42

Publications of the Aeronautical Research Council
ANNUAL TECHNICAL REPORTS OF THE AERONAUTICAL RESEARCH COUNCIL (BOUND VOLUMES)
I94z Vol. L Aero and Hydrodynamics, Aerofoils, Airscrews, Engines. 7Ss. (post as. 9d.) Vol. n . Noise, Parachutes, Stability and Control, Structures, Vibration, Wind Tunnels. 47s. 6d. (post 2s. 3d.)
I943 Vol. I. Aerodynamics, Aerofoils, Airscrews. 8os. (post as. 6d.) Vol. II. Engines, Flutter, Materials, Parachutes, Performance, Stability and Control, Structures.
9os. (post 2s. 9d.) I944 Vol. I. Aero and Hydrodynamics, Aerofoils, Aircraft, Airscrews, Controls. 84s. (post 3s.)
Vol. n . Flutter and Vibration, Materials, Miscellaneous, Navigation, Parachutes, Performance, Plates and @ Panels, Stability, Structures, Test Equipment, Wind Tunnels. 84 s. (post 3s.)
1945 Vol. I. Aero and Hydrodynamics, Aerofoils. i3os. (post 3s. 6d.) Vol. n . Aircraft, Airscrews, Controls. I3OS. (post 3 s. 6d.) Vol. n I . Flutter and Vibration, Instruments, Miscellaneous , Parachutes, Plates and Panels, Propulsion.
I3os. (post 33. 3d.) Vol. IV. Stability, Structures, Wind Tunnels, Wind Tunnel Technique. I3os. (post 38. 3d.)
I946 Vol. I. Accidents, Aerodynamics, Aerofoils and Hydrofoils. I68s. (post 3s. 9d.) Vol. II. Airserews, Cabin Cooling, Chemical Hazards, Controls, Flames, Flutter, Helicopters, Instruments and
Instrumentation, Interference, Jets, Miscellaneous, Parachutes. i68s. (post 3s. 3d.) Vol. III. Performance, Propulsion, Seaplanes, Stability, Structures, Wind Tunnels. I68s. (post 33. 6d.)
I947 Vol. I. Aerodynamics, Aerofoils, Aircraft. i68s. (post 3s. 9d.) Vol. II. Airscrews and Rotors, Controls, Flutter, Materials, Miscellaneous, Parachutes, Propulsion, Seaplanes,
Stability, Structures, Take-off and Landing. i68s. (post 3s. 9d.)
1948 Vol. I. Aerodynamics, Aerofoils, Aircraft, Airscrews, Controls, Flutter and Vibration, Helicopters, Instruments, • Propulsion, Seaplane, Stability, Structures, Wind Tunnels. z3os. (post 3s. 3d.)
Vol. II. Aerodynamics, Aerofoils, Aircraft, Airscrews, Controls, Flutter and Vibration, Helicopters, Instruments, Propulsion, Seaplane, Stability, Structures, Wind Tunnels. izos. (post 3s. 3&)
Special Volumes Vol. L Aero and Hydrodynamics, Aerofoils, Controls, Flutter, Kites, Parachutes, Performance, Propulsion,
Stability. iz6s. (post 3s.) Vol. II. Aero and Hydrodynamics, Aerofoils, Airscrews, Controls, Flutter, Materials, Miscellaneous, Parachutes,
Propulsion, Stability, Structures. x47s. (post 3s.) Vol. III. Aero and Hydrodynamics, Aerofoils, Airscrews, Controls, Flutter, Kites, Miscellaneous, Parachutes,
Propulsion, Seaplanes, Stability, Structures, Test Equipment. x89s. (post 3s. 9d.)
Reviews of the Aeronautical Research Council 1939-48 3s. (post 6d.) 1949-54 5s. (post 5d.)
Index to all Reports and Memoranda published in the Annual Technical Reports ' I9o9-x947 R. & M. 2600 (out of print)
Indexes to the Reports and Memoranda of the Aeronautical Research Council Between Nos. 2351-2449 R. & M. No. 2450 zs. (post 3d.) Between Nos. 2451-2549 Between Nos. 2551-2649 Between Nos. 2651-2749 Between Nos. z75I-Z849 Between Nos. 2851-2949 Between Nos. 2951-3o49 Between Nos. 3o5z-3149
R. & M. No. 255o 2s. 6d. (post 3d.) R. & M. No. a65o 2s. 6d. (post 3d.) R. & M. No. z75o 2s. 6d. (post 3d.) R. & M. No. 2850 as. 6d. (post 36/.) R. & M. No. 2950 3s. (post 3d.) R. & M. No. 3o5o 3s. 6d. (post 3d.) R. & M. No. 315o 3s. 6d. (post 3d.)
HER MAJESTY'S STATIONERY OFFICE from the addresses overleaf
l o ' .

R. & M. No. 3353
© Crown copyright x964
Printed and published by HER MAJESTY'S STATIONERY OFFICE
To be purchased from York House, Kingsway, London w.c.2
423 Oxford Street, London w.x I3A Castle Street, Edinburgh 2
xo9 St. Mary Street, Cardiff 39 King Street, Manchester 2
5o Fairfax Street, Bristol x 35 Smallbrook, Ringway, Birmingham 5
80 Chichester Street, Belfast x or through any bookseller
Printed in England
R. & M~ No. 3353
S.O. Code No. 23-3353