Embed Size (px)
Citation preview

1
Investor Relations - Chris Koegel, (617) 897-4574
For Immediate Release Media Relations - Jeff Mochal, (704) 733-3589
investor.lpl.com/contactus.cfm
LPL Financial Announces Third Quarter 2016 Results
Key Performance Indicators
• Earnings per share ("EPS") increased 35% year-over-year to $0.58, up 9% sequentially.
◦ This included $0.16 of EPS benefit from:
▪ $0.12 EPS benefit from management tax planning initiatives related to prior periods.
▪ $0.04 EPS benefit from account termination fees related to an institutional client that was
acquired by a bank with its own broker-dealer and departed.
◦ Net Income increased 27% year-over-year to $52 million, up 9% sequentially.
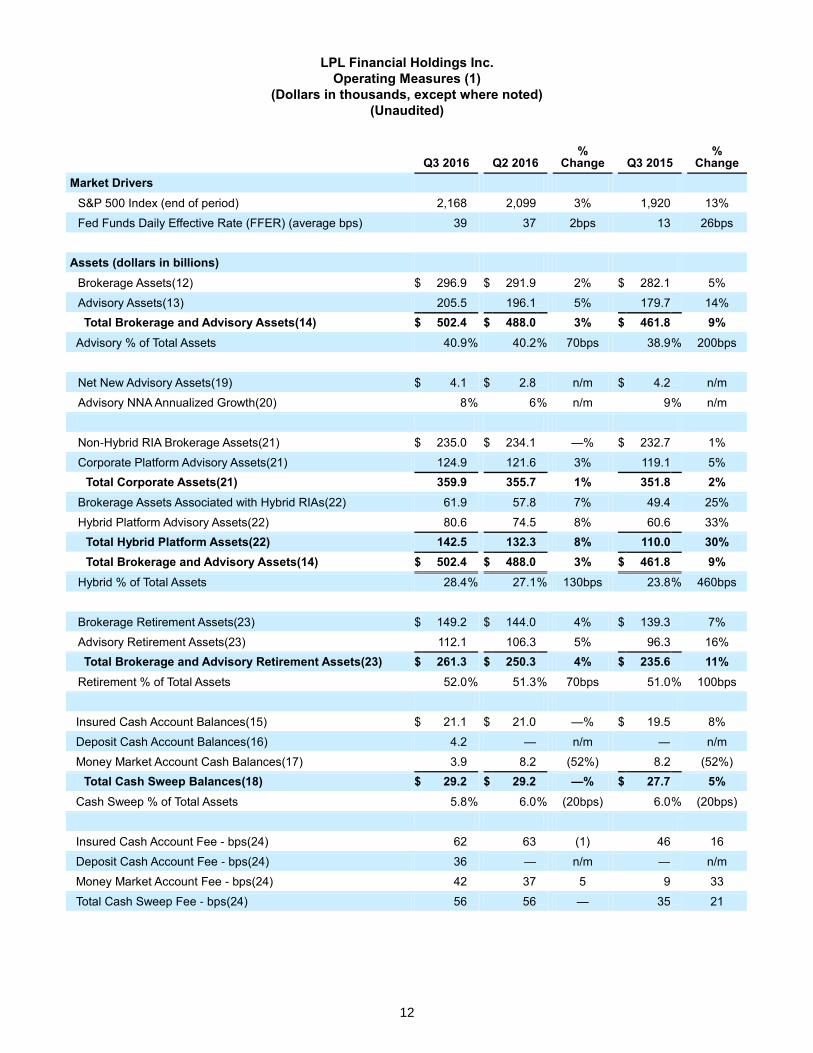
• Total Brokerage and Advisory Assets increased 9% year-over-year to $502 billion, up 3% sequentially.
• Net new advisory assets grew at an annualized rate of 8%, or $4.1 billion.
◦ Excluding the impact of an institutional client that was acquired, Total Brokerage and Advisory Assets
would have been $505 billion and net new advisory assets would have grown at an annualized rate of
10% or $4.7 billion.
• Gross Profit** increased 2% year-over-year to $347 million, up 1% sequentially.
• EBITDA** increased 10% year-over-year to $120 million, down 9% sequentially.
◦ EBITDA as a percentage of Gross Profit was 34.6%.
◦ Core G&A** increased 3% year-over-year to $175 million, up 4% sequentially.
Key Outlook Updates
• Reduced 2016 Core G&A outlook range to $700 to $705 million, from $705 to $715 million
• Established 2017 Core G&A outlook range of $710 to $725 million
• Lowered 2016 target Credit Agreement Net Leverage ratio to 3.25 to 3.5 times, from 4 times
SAN DIEGO - November 2, 2016 — LPL Financial Holdings Inc. (NASDAQ: LPLA) (the "Company") today
announced results for its third quarter ended September 30, 2016, reporting net income of $52 million, or $0.58 per
share. This compares with $41 million, or $0.43 per share, in the third quarter of 2015 and $48 million, or $0.53 per
share, in the prior quarter.
"We are pleased to deliver another solid quarter, as our business continues to gain momentum, especially on
recruiting," said Mark Casady, chairman and chief executive officer. "We have made significant progress on our
primary focus areas of service, technology, and risk management, and our advisors and institutional clients are
experiencing the benefits of this progress as they serve investors and work to grow their businesses."
Casady continued, "We believe we are leading the industry in innovating and adapting to the changing regulatory
environment. Our efforts to be early in the market with solutions designed to help advisors meet a range of investor
needs in the midst of regulatory changes are helping to create more opportunities for LPL and our advisors to grow."
"We continued to manage expenses prudently in Q3, while also investing in key priorities like technology, service,
and implementation of the DOL rule," said Matt Audette, chief financial officer. "Our focus on efficiency and
productivity this year has helped us make great progress on expenses. As a result, we are lowering our 2016 Core
G&A outlook to $700 to $705 million, and we are establishing our 2017 Core G&A outlook at $710 to $725 million."
Audette continued, "Balance sheet strength remains a top priority as it has been a volatile year, especially for the
interest rate and equity markets. Given the environment, we now feel it is prudent to lower our target Credit
Agreement Net Leverage ratio from 4 times to a range of 3.25 to 3.5 times. We plan to get there over the next few
quarters through earnings growth, paying down debt, or a combination of both. These efforts should strengthen our
balance sheet and give us confidence to deploy capital towards an increasingly attractive set of opportunities we
are seeing in the market."
2
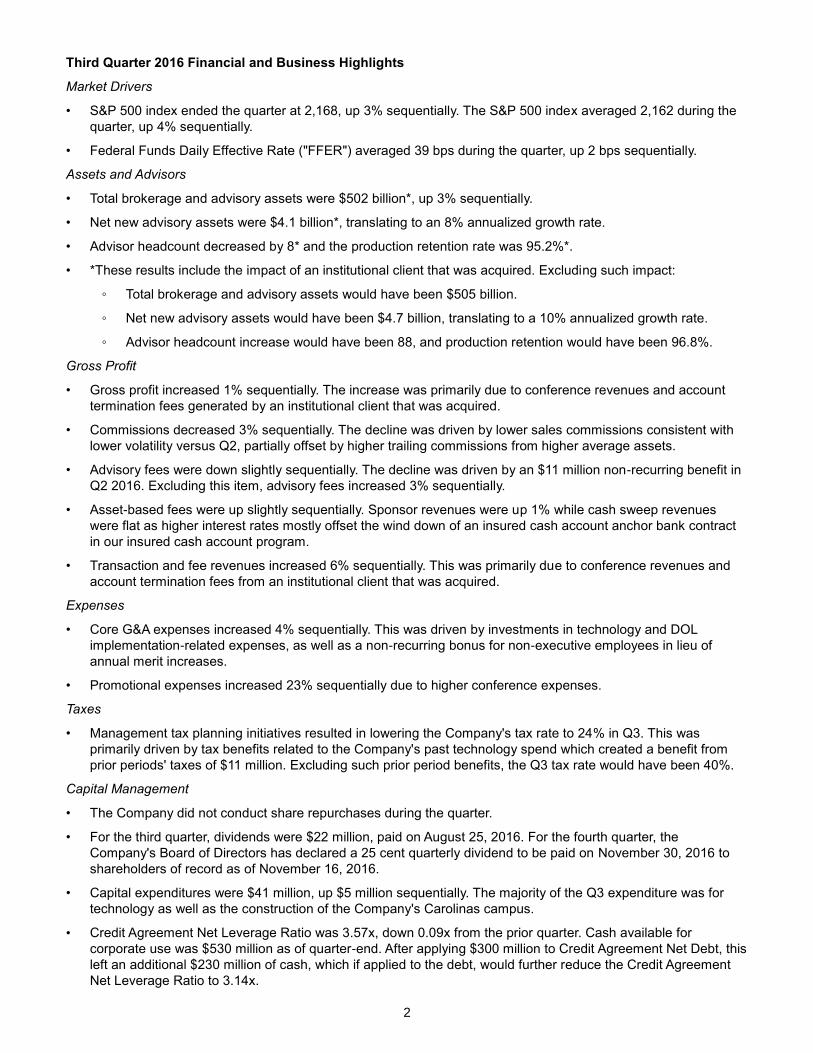
Third Quarter 2016 Financial and Business Highlights
Market Drivers
• S&P 500 index ended the quarter at 2,168, up 3% sequentially. The S&P 500 index averaged 2,162 during the
quarter, up 4% sequentially.
• Federal Funds Daily Effective Rate ("FFER") averaged 39 bps during the quarter, up 2 bps sequentially.
Assets and Advisors
• Total brokerage and advisory assets were $502 billion*, up 3% sequentially.
• Net new advisory assets were $4.1 billion*, translating to an 8% annualized growth rate.
• Advisor headcount decreased by 8* and the production retention rate was 95.2%*.
• *These results include the impact of an institutional client that was acquired. Excluding such impact:
◦ Total brokerage and advisory assets would have been $505 billion.
◦ Net new advisory assets would have been $4.7 billion, translating to a 10% annualized growth rate.
◦ Advisor headcount increase would have been 88, and production retention would have been 96.8%.
Gross Profit
• Gross profit increased 1% sequentially. The increase was primarily due to conference revenues and account
termination fees generated by an institutional client that was acquired.
• Commissions decreased 3% sequentially. The decline was driven by lower sales commissions consistent with
lower volatility versus Q2, partially offset by higher trailing commissions from higher average assets.
• Advisory fees were down slightly sequentially. The decline was driven by an $11 million non-recurring benefit in
Q2 2016. Excluding this item, advisory fees increased 3% sequentially.
• Asset-based fees were up slightly sequentially. Sponsor revenues were up 1% while cash sweep revenues
were flat as higher interest rates mostly offset the wind down of an insured cash account anchor bank contract
in our insured cash account program.
• Transaction and fee revenues increased 6% sequentially. This was primarily due to conference revenues and
account termination fees from an institutional client that was acquired.
Expenses
• Core G&A expenses increased 4% sequentially. This was driven by investments in technology and DOL
implementation-related expenses, as well as a non-recurring bonus for non-executive employees in lieu of
annual merit increases.
• Promotional expenses increased 23% sequentially due to higher conference expenses.
Taxes
• Management tax planning initiatives resulted in lowering the Company's tax rate to 24% in Q3. This was
primarily driven by tax benefits related to the Company's past technology spend which created a benefit from
prior periods' taxes of $11 million. Excluding such prior period benefits, the Q3 tax rate would have been 40%.
Capital Management
• The Company did not conduct share repurchases during the quarter.
• For the third quarter, dividends were $22 million, paid on August 25, 2016. For the fourth quarter, the
Company's Board of Directors has declared a 25 cent quarterly dividend to be paid on November 30, 2016 to
shareholders of record as of November 16, 2016.
• Capital expenditures were $41 million, up $5 million sequentially. The majority of the Q3 expenditure was for
technology as well as the construction of the Company's Carolinas campus.
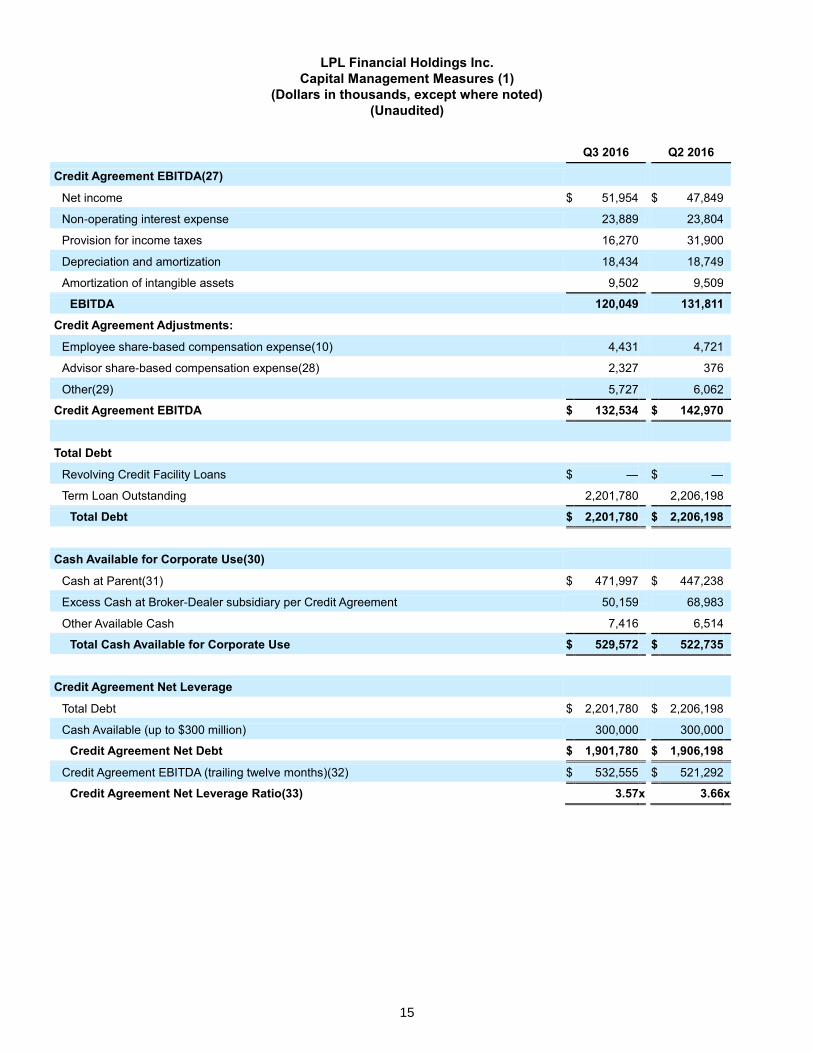
• Credit Agreement Net Leverage Ratio was 3.57x, down 0.09x from the prior quarter. Cash available for
corporate use was $530 million as of quarter-end. After applying $300 million to Credit Agreement Net Debt, this
left an additional $230 million of cash, which if applied to the debt, would further reduce the Credit Agreement
Net Leverage Ratio to 3.14x.
3
Conference Call and Additional Information
The Company will hold a conference call to discuss its results at 5:00 p.m. EDT on Wednesday, November 2, 2016.
The conference call can be accessed by dialing either 877-677-9122 (domestic) or 708-290-1401 (international)
and entering passcode 82407567.
The conference call will also be webcast simultaneously on the Investor Relations section of the Company's
website (investor.lpl.com), where a replay of the call will also be available following the live webcast. A telephonic
replay will be available approximately two hours after the call and can be accessed by dialing 855-859-2056
(domestic) or 404-537-3406 (international) and entering passcode 82407567. The telephonic replay will be
available until 11:59 p.m. EDT on November 9, 2016 and the webcast replay will be available until November 23,
2016.
About LPL Financial
LPL Financial LLC, a wholly owned subsidiary of LPL Financial Holdings Inc. (NASDAQ:LPLA), is a leader in the
retail financial advice market and served $502 billion in advisory and brokerage assets as of September 30, 2016.
LPL is one of the fastest growing RIA custodians and is the nation's largest independent broker-dealer (based on
total revenues, Financial Planning magazine June 1996-2016). The Company provides proprietary technology,
comprehensive clearing and compliance services, practice management programs and training, and independent
research to more than 14,000 independent financial advisors and over 700 financial institutions, enabling them to
help their clients turn life's aspirations into financial realities. Advisors associated with LPL also serviced an
estimated 45,000 retirement plans with an estimated $129 billion in retirement plan assets, as of September 30,
2016. LPL also supports approximately 4,200 financial advisors licensed and affiliated with insurance companies
with customized clearing, advisory platforms, and technology solutions. LPL Financial and its affiliates have more
than 3,200 employees with primary offices in Boston, Charlotte, and San Diego. For more information, please visit
www.lpl.com.
Securities and Advisory Services offered through LPL Financial. A Registered Investment Advisor, Member
FINRA/SIPC.
**Non-GAAP Financial Measures
Management believes that presenting certain non-GAAP measures by excluding or including certain items can be
helpful to investors and analysts who may wish to use some or all of this information to analyze the Company’s
current performance, prospects, and valuation. Management uses this non-GAAP information internally to evaluate
operating performance and in formulating the budget for future periods. Management believes that the non-GAAP
measures and metrics discussed below are appropriate for evaluating the performance of the Company.
Gross Profit is calculated as net revenues less commission and advisory expenses and brokerage, clearing, and
exchange fees. All other expense categories, including depreciation and amortization, are considered general and
administrative in nature. Because the Company’s gross profit amounts do not include any depreciation and
amortization expense, the Company considers its gross profit amounts to be non-GAAP measures that may not be
comparable to those of others in its industry. Management believes that Gross Profit can be useful to investors
because it shows the Company’s core operating performance before indirect costs that are general and
administrative in nature.
Core G&A consists of total operating expenses, which were $925.3 million for the three months ended September
30, 2016, excluding the following expenses: commission and advisory, regulatory charges (see FN 8), promotional
(see FN 9), employee share-based compensation (see FN 10), depreciation and amortization, amortization of
intangible assets, and brokerage, clearing, and exchange. The Company’s management presents Core G&A
because it believes Core G&A reflects the corporate operating expense categories over which management can
generally exercise a measure of control, compared with expense items over which management either cannot
exercise control, such as commission and advisory expenses, or which management views as promotional expense
necessary to support advisor growth and retention including conferences and transition assistance. Core G&A is not
a measure of the Company’s total operating expenses as calculated in accordance with GAAP. For a reconciliation
of Core G&A against the Company’s total operating expenses, please see footnote 7 on page 18 of this release.
The Company does not provide an outlook for its total operating expenses because it contains expense
components, such as commission and advisory expenses, that are market-driven and over which the Company
cannot exercise control. Accordingly a reconciliation of the Company’s outlook for Core G&A to an outlook for total
operating expenses cannot be made available without unreasonable effort. Prior to 2016, the Company calculated

4
Core G&A as consisting of total operating expenses, excluding the items described above, as well as excluding
other items that primarily consisted of acquisition and integration costs resulting from various acquisitions and
organizational restructuring and conversion costs. Beginning with results reported for Q1 2016, Core G&A was
presented as including these items that were historically adjusted out, and for periods prior to Q1 2016, reflects
those items in employee share-based compensation and other historical adjustments for comparative purposes.
EBITDA is defined as net income plus interest expense, income tax expense, depreciation, and amortization. The
Company presents EBITDA because management believes that it can be a useful financial metric in understanding
the Company’s earnings from operations. EBITDA is not a measure of the Company's financial performance under
GAAP and should not be considered as an alternative to net income or any other performance measure derived in
accordance with GAAP, or as an alternative to cash flows from operating activities as a measure of profitability or
liquidity. In addition, the Company’s EBITDA can differ significantly from EBITDA calculated by other companies,
depending on long-term strategic decisions regarding capital structure, the tax jurisdictions in which companies
operate, and capital investments.
Credit Agreement EBITDA is defined in, and calculated by management in accordance with, the Company's credit
agreement (“Credit Agreement”) as “Consolidated EBITDA,” which is Consolidated Net Income (as defined in the
Credit Agreement) plus interest expense, tax expense, depreciation and amortization and further adjusted to
exclude certain non-cash charges and other adjustments, including unusual or non-recurring charges and gains.
The Company presents Credit Agreement EBITDA because management believes that it can be a useful financial
metric in understanding the Company’s debt capacity and covenant compliance under its Credit Agreement. Credit
Agreement EBITDA is not a measure of the Company's financial performance under GAAP and should not be
considered as an alternative to net income or any other performance measure derived in accordance with GAAP, or
as an alternative to cash flows from operating activities as a measure of profitability or liquidity. In addition, the
Company’s Credit Agreement-defined EBITDA can differ significantly from adjusted EBITDA calculated by other
companies, depending on long-term strategic decisions regarding capital structure, the tax jurisdictions in which
companies operate, and capital investments.
Forward-Looking Statements
Statements in this press release regarding the Company's future financial and operating results, outlook, growth,
plans, business strategies, future market position, future operating environment, and goals, including forecasts and
statements relating to the Company’s expense and capital plans, target leverage ratio, opportunities for the
deployment of cash, future efficiency gains, future investments and future expense growth, as well as any other
statements that are not related to present facts or current conditions or that are not purely historical, constitute
forward-looking statements. These forward-looking statements are based on the Company's historical performance
and its plans, estimates, and expectations as of November 2, 2016. The words “anticipates”, “believes”, “expects”,
“may”, “plans”, “predicts”, “will”, and similar expressions are intended to identify forward-looking statements,
although not all forward-looking statements contain these identifying words. Forward-looking statements are not
guarantees that the future results, plans, intentions, or expectations expressed or implied by the Company will be
achieved. Matters subject to forward-looking statements involve known and unknown risks and uncertainties,
including economic, legislative, regulatory, competitive, and other factors, which may cause actual financial or
operating results, levels of activity, or the timing of events, to be materially different than those expressed or implied
by forward-looking statements. Important factors that could cause or contribute to such differences include:
changes in general economic and financial market conditions, including retail investor sentiment; fluctuations in the
value of advisory and brokerage assets; fluctuations in levels of net new advisory assets and the related impact on
fee revenue; fluctuations in the number of retail investors served by the Company; effects of competition in the
financial services industry and the success of the Company in attracting and retaining financial advisors and
institutions; changes in the number of the Company's financial advisors and institutions, and their ability to market
effectively financial products and services; changes in interest rates and fees payable by banks participating in the
Company's cash sweep program, including the Company's success in negotiating agreements with current or
additional counterparties; the Company's strategy in managing cash sweep program fees; changes in the growth
and profitability of the Company's fee-based business; the effect of current, pending and future legislation,
regulation and regulatory actions, including the U.S. Department of Labor's final rule ("DOL Rule") and disciplinary
actions imposed by federal and state securities regulators and self-regulatory organizations; the costs of settling
and remediating issues related to pending or future regulatory matters or legal proceedings; execution of the
Company's capital management plans, including its compliance with the terms of its existing credit agreement; the
price, the availability of shares, and trading volumes of the Company's common stock, which will affect the timing
and size of future share repurchases by the Company; changes made to the Company’s offerings and services in
response to the current, pending and future legislation, regulation and regulatory actions, including the DOL Rule,

5
and the effect that such changes may have on the Company’s gross profit streams and costs; execution of the
Company's plans and its success in realizing the expense savings and service improvements and efficiencies
expected to result from its initiatives and programs, particularly its expense plans and technological initiatives; the
Company's success in negotiating and developing commercial arrangements with third-party services providers; the
performance of third-party service providers to which business processes are transitioned from the Company; the
Company's ability to control operating risks, information technology systems risks, cybersecurity risks, and sourcing
risks; and the other factors set forth in Part I, “Item 1A. Risk Factors” in the Company's 2015 Annual Report on
Form 10-K, as may be amended or updated in the Company's Quarterly Reports on Form 10-Q. Except as required
by law, the Company specifically disclaims any obligation to update any forward-looking statements as a result of
developments occurring after the date of this earnings release, even if its estimates change, and you should not rely
on statements contained herein as representing the Company's views as of any date subsequent to the date of this
press release.

6
LPL Financial Holdings Inc.
Condensed Consolidated Statements of Income
(Dollars in thousands, except per share data)
(Unaudited)
Three Months Ended
September 30, Nine Months Ended
September 30,
2016 2015 %
Change 2016 2015 %
Change
REVENUES
Commission $ 431,686 $ 480,271
(10 %) $ 1,314,168 $ 1,513,359
(13 %)
Advisory 321,911 341,217
(6 %) 964,298 1,028,213
(6 %)
Asset-based 138,291 123,921
12 % 412,339 369,625
12 %
Transaction and fee 108,413 105,593
3 % 312,927 305,099
3 %
Interest income, net of interest expense 5,372 5,221
3 % 15,940 14,976
6 %
Other 11,767 (1,478 ) n/m 22,254
23,436 (5 %)
Total net revenues 1,017,440 1,054,745 (4 %) 3,041,926 3,254,708 (7 %)
EXPENSES
Commission and advisory 657,432 701,585
(6 %) 1,954,123 2,179,686
(10 %)
Compensation and benefits 107,988 110,494
(2 %) 327,816 335,111
(2 %)
Promotional 42,609 42,040
1 % 113,010 104,416
8 %
Depreciation and amortization 18,434 17,231
7 % 56,145 50,856
10 %
Amortization of intangible assets 9,502 9,535
— % 28,536 28,708
(1 %)
Occupancy and equipment 23,530 19,760
19 % 67,347 61,957
9 %
Professional services 17,045 15,341
11 % 49,184 43,914
12 %
Brokerage, clearing and exchange 13,098 13,403
(2 %) 40,296 39,680
2 %
Communications and data processing 10,333 11,253
(8 %) 31,801 33,974
(6 %)
Restructuring charges — 3,071
n/m — 11,487
n/m
Other 25,356 28,852
(12 %) 69,512 86,796
(20 %)
Total operating expenses 925,327 972,565 (5 %) 2,737,770 2,976,585 (8 %)
Non-operating interest expense 23,889 13,493 77 % 71,583 40,671 76 %
INCOME BEFORE PROVISION FOR INCOME TAXES 68,224
68,687
(1 %) 232,573
237,452
(2 %)
PROVISION FOR INCOME TAXES 16,270 27,635
(41 %) 82,378 95,480
(14 %)
NET INCOME $ 51,954 $ 41,052 27 % $ 150,195 $ 141,972 6 %
Earnings per share, basic $ 0.58 $ 0.43 35 % $ 1.69 $ 1.48 14 %
Earnings per share, diluted $ 0.58 $ 0.43 35 % $ 1.67 $ 1.46 14 %
Weighted-average shares outstanding, basic 89,092 94,972 (6 %) 89,025 95,744 (7 %)
Weighted-average shares outstanding, diluted 89,951 96,472 (7 %) 89,732 97,303 (8 %)

7
LPL Financial Holdings Inc.
Condensed Consolidated Statements of Income Trend
(Dollars in thousands, except per share data)
(Unaudited)
Quarterly Results
Q3 2016 Q2 2016 Q1 2016
REVENUES
Commission $ 431,686 $ 445,755
$ 436,727
Advisory 321,911 322,955
319,432
Asset-based 138,291 137,797
136,251
Transaction and fee 108,413 101,824
102,690
Interest income, net of interest expense 5,372 5,238
5,330
Other 11,767 5,612
4,875
Total net revenues 1,017,440 1,019,181 1,005,305
EXPENSES
Commission and advisory 657,432 660,680
636,011
Compensation and benefits 107,988 105,773
114,055
Promotional 42,609 34,717
35,684
Depreciation and amortization 18,434 18,749
18,962
Amortization of intangible assets 9,502 9,509
9,525
Occupancy and equipment 23,530 21,980
21,837
Professional services 17,045 14,984
17,155
Brokerage, clearing and exchange 13,098 13,609
13,589
Communications and data processing 10,333 10,971
10,497
Other 25,356 24,656
19,500
Total operating expenses 925,327 915,628 896,815
Non-operating interest expense 23,889 23,804 23,890
INCOME BEFORE PROVISION FOR INCOME TAXES 68,224 79,749 84,600
PROVISION FOR INCOME TAXES 16,270 31,900
34,208
NET INCOME $ 51,954 $ 47,849 $ 50,392
Earnings per share, basic $ 0.58 $ 0.54 $ 0.57
Earnings per share, diluted $ 0.58 $ 0.53 $ 0.56
Weighted-average shares outstanding, basic 89,092 89,019 88,964
Weighted-average shares outstanding, diluted 89,951 89,699 89,621
8
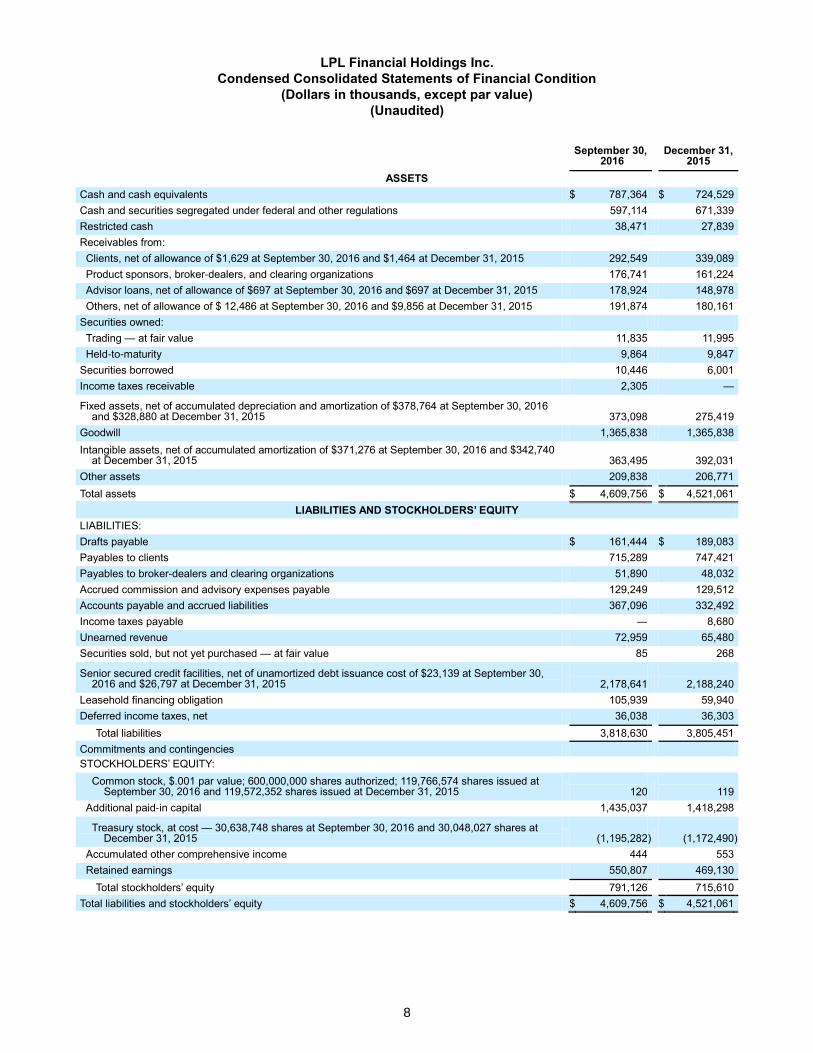
LPL Financial Holdings Inc.
Condensed Consolidated Statements of Financial Condition
(Dollars in thousands, except par value)
(Unaudited)
September 30,
2016 December 31,
2015
ASSETS
Cash and cash equivalents $ 787,364 $ 724,529
Cash and securities segregated under federal and other regulations 597,114 671,339
Restricted cash 38,471 27,839
Receivables from: Clients, net of allowance of $1,629 at September 30, 2016 and $1,464 at December 31, 2015 292,549 339,089
Product sponsors, broker-dealers, and clearing organizations 176,741 161,224
Advisor loans, net of allowance of $697 at September 30, 2016 and $697 at December 31, 2015 178,924 148,978
Others, net of allowance of $ 12,486 at September 30, 2016 and $9,856 at December 31, 2015 191,874 180,161
Securities owned: Trading — at fair value 11,835 11,995
Held-to-maturity 9,864 9,847
Securities borrowed 10,446 6,001
Income taxes receivable 2,305 —
Fixed assets, net of accumulated depreciation and amortization of $378,764 at September 30, 2016 and $328,880 at December 31, 2015 373,098
275,419
Goodwill 1,365,838 1,365,838
Intangible assets, net of accumulated amortization of $371,276 at September 30, 2016 and $342,740 at December 31, 2015 363,495
392,031
Other assets 209,838 206,771
Total assets $ 4,609,756 $ 4,521,061
LIABILITIES AND STOCKHOLDERS’ EQUITY
LIABILITIES:
Drafts payable $ 161,444 $ 189,083
Payables to clients 715,289 747,421
Payables to broker-dealers and clearing organizations 51,890 48,032
Accrued commission and advisory expenses payable 129,249 129,512
Accounts payable and accrued liabilities 367,096 332,492
Income taxes payable — 8,680
Unearned revenue 72,959 65,480
Securities sold, but not yet purchased — at fair value 85 268
Senior secured credit facilities, net of unamortized debt issuance cost of $23,139 at September 30, 2016 and $26,797 at December 31, 2015 2,178,641
2,188,240
Leasehold financing obligation 105,939 59,940
Deferred income taxes, net 36,038 36,303
Total liabilities 3,818,630 3,805,451
Commitments and contingencies STOCKHOLDERS’ EQUITY:
Common stock, $.001 par value; 600,000,000 shares authorized; 119,766,574 shares issued at September 30, 2016 and 119,572,352 shares issued at December 31, 2015 120
119
Additional paid-in capital 1,435,037 1,418,298
Treasury stock, at cost — 30,638,748 shares at September 30, 2016 and 30,048,027 shares at December 31, 2015 (1,195,282 ) (1,172,490 )
Accumulated other comprehensive income 444 553
Retained earnings 550,807 469,130
Total stockholders’ equity 791,126 715,610
Total liabilities and stockholders’ equity $ 4,609,756 $ 4,521,061
9
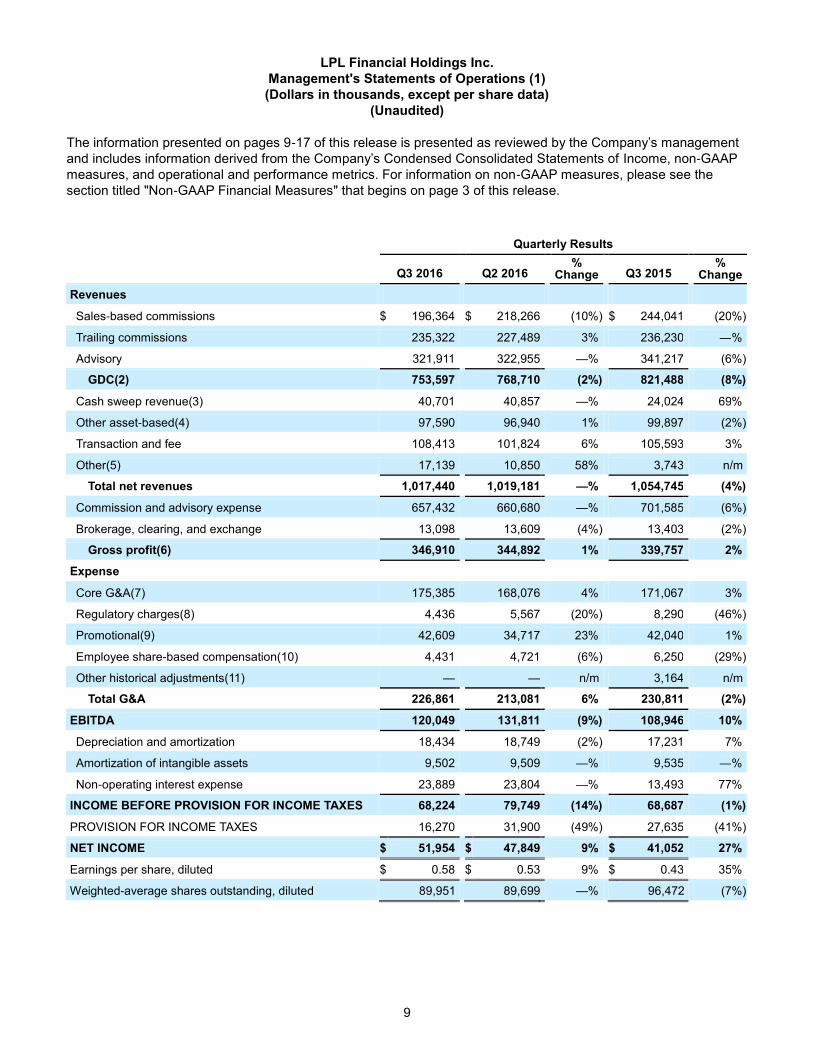
LPL Financial Holdings Inc.
Management's Statements of Operations (1)
(Dollars in thousands, except per share data)
(Unaudited)
The information presented on pages 9-17 of this release is presented as reviewed by the Company’s management
and includes information derived from the Company’s Condensed Consolidated Statements of Income, non-GAAP
measures, and operational and performance metrics. For information on non-GAAP measures, please see the
section titled "Non-GAAP Financial Measures" that begins on page 3 of this release.
Quarterly Results
Q3 2016 Q2 2016 %
Change Q3 2015 %
Change
Revenues
Sales-based commissions $ 196,364 $ 218,266
(10 %) $ 244,041 (20 %)
Trailing commissions 235,322 227,489
3 % 236,230 — %
Advisory 321,911 322,955
— % 341,217 (6 %)
GDC(2) 753,597 768,710 (2 %) 821,488 (8 %)
Cash sweep revenue(3) 40,701 40,857
— % 24,024 69 %
Other asset-based(4) 97,590 96,940
1 % 99,897 (2 %)
Transaction and fee 108,413 101,824
6 % 105,593 3 %
Other(5) 17,139 10,850
58 % 3,743 n/m
Total net revenues 1,017,440 1,019,181 — % 1,054,745 (4 %)
Commission and advisory expense 657,432 660,680 — % 701,585 (6 %)
Brokerage, clearing, and exchange 13,098 13,609
(4 %) 13,403 (2 %)
Gross profit(6) 346,910 344,892 1 % 339,757 2 %
Expense
Core G&A(7) 175,385 168,076
4 % 171,067 3 %
Regulatory charges(8) 4,436 5,567
(20 %) 8,290 (46 %)
Promotional(9) 42,609 34,717
23 % 42,040 1 %
Employee share-based compensation(10) 4,431 4,721
(6 %) 6,250 (29 %)
Other historical adjustments(11) — —
n/m 3,164 n/m
Total G&A 226,861 213,081 6 % 230,811 (2 %)
EBITDA 120,049 131,811 (9 %) 108,946 10 %
Depreciation and amortization 18,434 18,749 (2 %) 17,231 7 %
Amortization of intangible assets 9,502 9,509
— % 9,535 — %
Non-operating interest expense 23,889 23,804
— % 13,493 77 %
INCOME BEFORE PROVISION FOR INCOME TAXES 68,224 79,749 (14 %) 68,687 (1 %)
PROVISION FOR INCOME TAXES 16,270 31,900
(49 %) 27,635 (41 %)
NET INCOME $ 51,954 $ 47,849 9 % $ 41,052 27 %
Earnings per share, diluted $ 0.58 $ 0.53 9 % $ 0.43 35 %
Weighted-average shares outstanding, diluted 89,951 89,699 — % 96,472 (7 %)
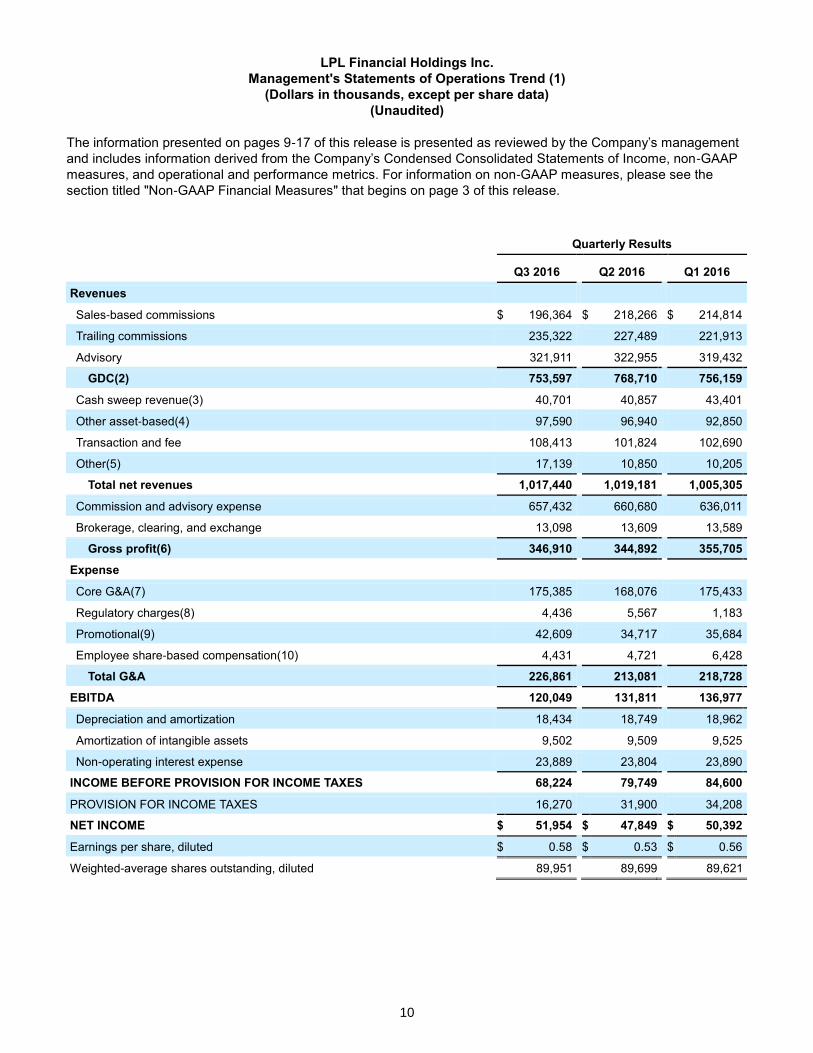
10
LPL Financial Holdings Inc.
Management's Statements of Operations Trend (1)
(Dollars in thousands, except per share data)
(Unaudited)
The information presented on pages 9-17 of this release is presented as reviewed by the Company’s management
and includes information derived from the Company’s Condensed Consolidated Statements of Income, non-GAAP
measures, and operational and performance metrics. For information on non-GAAP measures, please see the
section titled "Non-GAAP Financial Measures" that begins on page 3 of this release.
Quarterly Results
Q3 2016 Q2 2016 Q1 2016
Revenues
Sales-based commissions $ 196,364 $ 218,266
$ 214,814
Trailing commissions 235,322 227,489
221,913
Advisory 321,911 322,955
319,432
GDC(2) 753,597 768,710 756,159
Cash sweep revenue(3) 40,701 40,857
43,401
Other asset-based(4) 97,590 96,940
92,850
Transaction and fee 108,413 101,824
102,690
Other(5) 17,139 10,850
10,205
Total net revenues 1,017,440 1,019,181 1,005,305
Commission and advisory expense 657,432 660,680 636,011
Brokerage, clearing, and exchange 13,098 13,609
13,589
Gross profit(6) 346,910 344,892 355,705
Expense
Core G&A(7) 175,385 168,076
175,433
Regulatory charges(8) 4,436 5,567
1,183
Promotional(9) 42,609 34,717
35,684
Employee share-based compensation(10) 4,431 4,721
6,428
Total G&A 226,861 213,081 218,728
EBITDA 120,049 131,811 136,977
Depreciation and amortization 18,434 18,749 18,962
Amortization of intangible assets 9,502 9,509
9,525
Non-operating interest expense 23,889 23,804
23,890
INCOME BEFORE PROVISION FOR INCOME TAXES 68,224 79,749 84,600
PROVISION FOR INCOME TAXES 16,270 31,900
34,208
NET INCOME $ 51,954 $ 47,849 $ 50,392
Earnings per share, diluted $ 0.58 $ 0.53 $ 0.56
Weighted-average shares outstanding, diluted 89,951 89,699 89,621
11
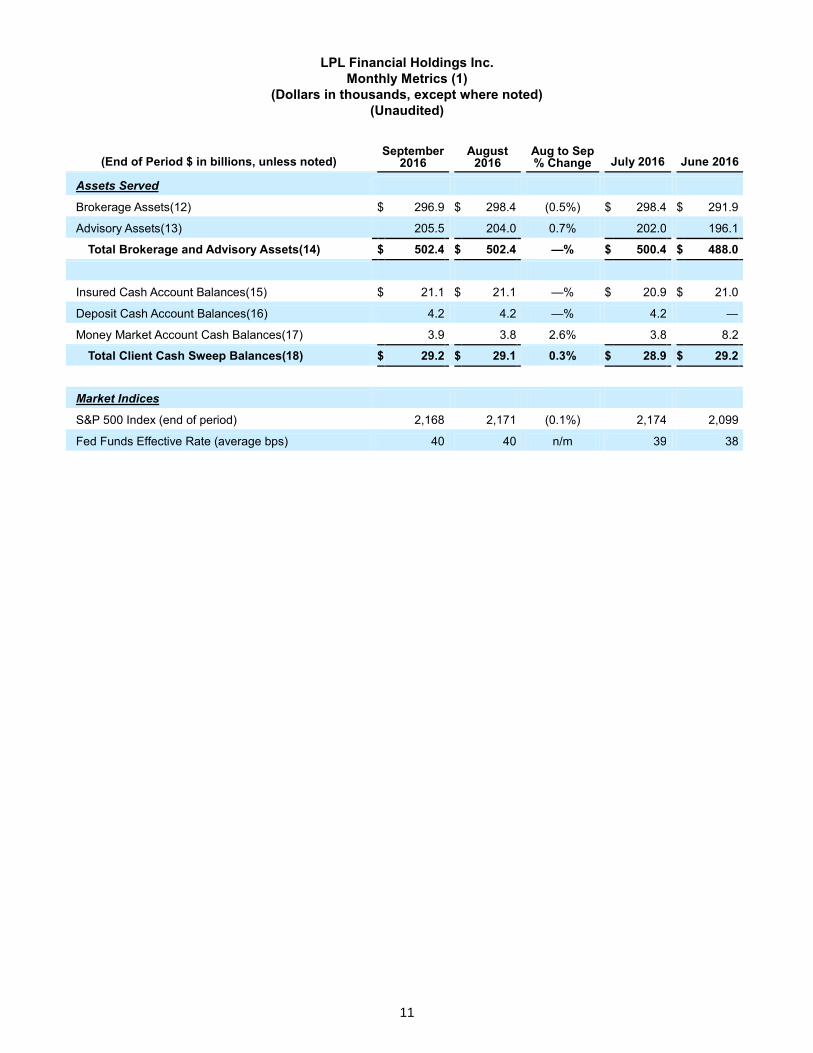
LPL Financial Holdings Inc.
Monthly Metrics (1)
(Dollars in thousands, except where noted)
(Unaudited)
(End of Period $ in billions, unless noted) September
2016 August
2016 Aug to Sep % Change July 2016 June 2016
Assets Served
Brokerage Assets(12) $ 296.9 $ 298.4
(0.5%) $ 298.4 $ 291.9
Advisory Assets(13) 205.5 204.0
0.7% 202.0 196.1
Total Brokerage and Advisory Assets(14) $ 502.4 $ 502.4 —% $ 500.4 $ 488.0
Insured Cash Account Balances(15) $ 21.1 $ 21.1
—% $ 20.9 $ 21.0
Deposit Cash Account Balances(16) 4.2 4.2
—% 4.2 —
Money Market Account Cash Balances(17) 3.9 3.8
2.6% 3.8 8.2
Total Client Cash Sweep Balances(18) $ 29.2 $ 29.1 0.3% $ 28.9 $ 29.2
Market Indices
S&P 500 Index (end of period) 2,168 2,171
(0.1%) 2,174 2,099
Fed Funds Effective Rate (average bps) 40 40
n/m 39 38
12
LPL Financial Holdings Inc.
Operating Measures (1)
(Dollars in thousands, except where noted)
(Unaudited)
Q3 2016 Q2 2016 %
Change Q3 2015 %
Change
Market Drivers
S&P 500 Index (end of period) 2,168 2,099 3% 1,920 13%
Fed Funds Daily Effective Rate (FFER) (average bps) 39 37 2bps 13 26bps
Assets (dollars in billions)
Brokerage Assets(12) $ 296.9 $ 291.9 2% $ 282.1 5%
Advisory Assets(13) 205.5 196.1 5% 179.7 14%
Total Brokerage and Advisory Assets(14) $ 502.4 $ 488.0 3% $ 461.8 9%
Advisory % of Total Assets 40.9 % 40.2 % 70bps 38.9 % 200bps
Net New Advisory Assets(19) $ 4.1 $ 2.8 n/m $ 4.2 n/m
Advisory NNA Annualized Growth(20) 8 % 6 % n/m 9 % n/m
Non-Hybrid RIA Brokerage Assets(21) $ 235.0 $ 234.1 —% $ 232.7 1%
Corporate Platform Advisory Assets(21) 124.9 121.6 3% 119.1 5%
Total Corporate Assets(21) 359.9 355.7 1% 351.8 2%
Brokerage Assets Associated with Hybrid RIAs(22) 61.9 57.8 7% 49.4 25%
Hybrid Platform Advisory Assets(22) 80.6 74.5 8% 60.6 33%
Total Hybrid Platform Assets(22) 142.5 132.3 8% 110.0 30%
Total Brokerage and Advisory Assets(14) $ 502.4 $ 488.0 3% $ 461.8 9%
Hybrid % of Total Assets 28.4 % 27.1 % 130bps 23.8 % 460bps
Brokerage Retirement Assets(23) $ 149.2 $ 144.0 4% $ 139.3 7%
Advisory Retirement Assets(23) 112.1 106.3 5% 96.3 16%
Total Brokerage and Advisory Retirement Assets(23) $ 261.3 $ 250.3 4% $ 235.6 11%
Retirement % of Total Assets 52.0 % 51.3 % 70bps 51.0 % 100bps
Insured Cash Account Balances(15) $ 21.1 $ 21.0 —% $ 19.5 8%
Deposit Cash Account Balances(16) 4.2 — n/m — n/m
Money Market Account Cash Balances(17) 3.9 8.2 (52%) 8.2 (52%)
Total Cash Sweep Balances(18) $ 29.2 $ 29.2 —% $ 27.7 5%
Cash Sweep % of Total Assets 5.8 % 6.0 % (20bps) 6.0 % (20bps)
Insured Cash Account Fee - bps(24) 62 63 (1) 46 16
Deposit Cash Account Fee - bps(24) 36 — n/m — n/m
Money Market Account Fee - bps(24) 42 37 5 9 33
Total Cash Sweep Fee - bps(24) 56 56 — 35 21
13
LPL Financial Holdings Inc.
Financial Measures (1)
(Dollars in thousands, except where noted)
(Unaudited)
Q3 2016 Q2 2016 %
Change Q3 2015 %
Change
Commission Revenue by Product
Variable annuities $ 169,413 $ 173,421
(2%) $ 189,623 (11%)
Mutual funds 137,238 135,770
1% 144,441 (5%)
Alternative investments 8,514 9,098
(6%) 26,113 (67%)
Fixed annuities 44,933 53,623
(16%) 42,417 6%
Equities 20,263 20,706
(2%) 24,875 (19%)
Fixed income 21,756 21,279
2% 21,778 —%
Insurance 18,083 19,980
(9%) 19,105 (5%)
Group annuities 11,266 11,686
(4%) 11,777 (4%)
Other 220 192
15% 142 55%
Total commission revenue $ 431,686 $ 445,755 (3%) $ 480,271 (10%)
Commission Revenue by Sales-based and Trailing Commission
Sales-based commissions
Variable annuities $ 57,337 $ 64,987
(12%) $ 78,113 (27%)
Mutual funds 34,985 38,223
(8%) 39,463 (11%)
Alternative investments 7,198 7,002
3% 24,932 (71%)
Fixed annuities 41,995 50,970
(18%) 40,552 4%
Equities 20,263 20,706
(2%) 24,875 (19%)
Fixed income 16,588 16,288
2% 16,588 —%
Insurance 16,520 18,595
(11%) 17,675 (7%)
Group annuities 1,258 1,303
(3%) 1,701 (26%)
Other 220 192
15% 142 55%
Total sales-based commissions $ 196,364 $ 218,266 (10%) $ 244,041 (20%)
Trailing commissions
Variable annuities $ 112,076 $ 108,434
3% $ 111,510 1%
Mutual funds 102,253 97,547
5% 104,978 (3%)
Alternative investments 1,316 2,096
(37%) 1,181 11%
Fixed annuities 2,938 2,653
11% 1,865 58%
Fixed income 5,168 4,991
4% 5,190 —%
Insurance 1,563 1,385
13% 1,430 9%
Group annuities 10,008 10,383
(4%) 10,076 (1%)
Total trailing commissions $ 235,322 $ 227,489 3% $ 236,230 —%
Total commission revenue $ 431,686 $ 445,755 (3%) $ 480,271 (10%)
14
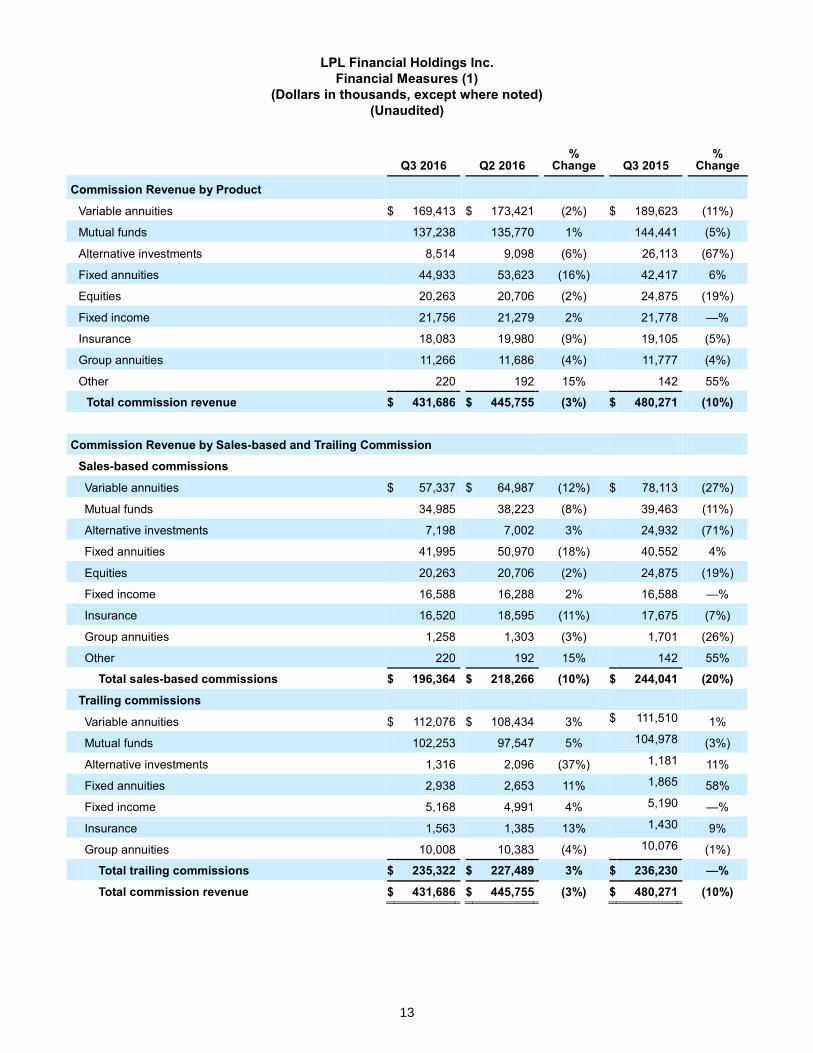
LPL Financial Holdings Inc.
Financial Measures (1)
(Dollars in thousands, except where noted)
(Unaudited)
Q3 2016 Q2 2016 %
Change Q3 2015 %
Change
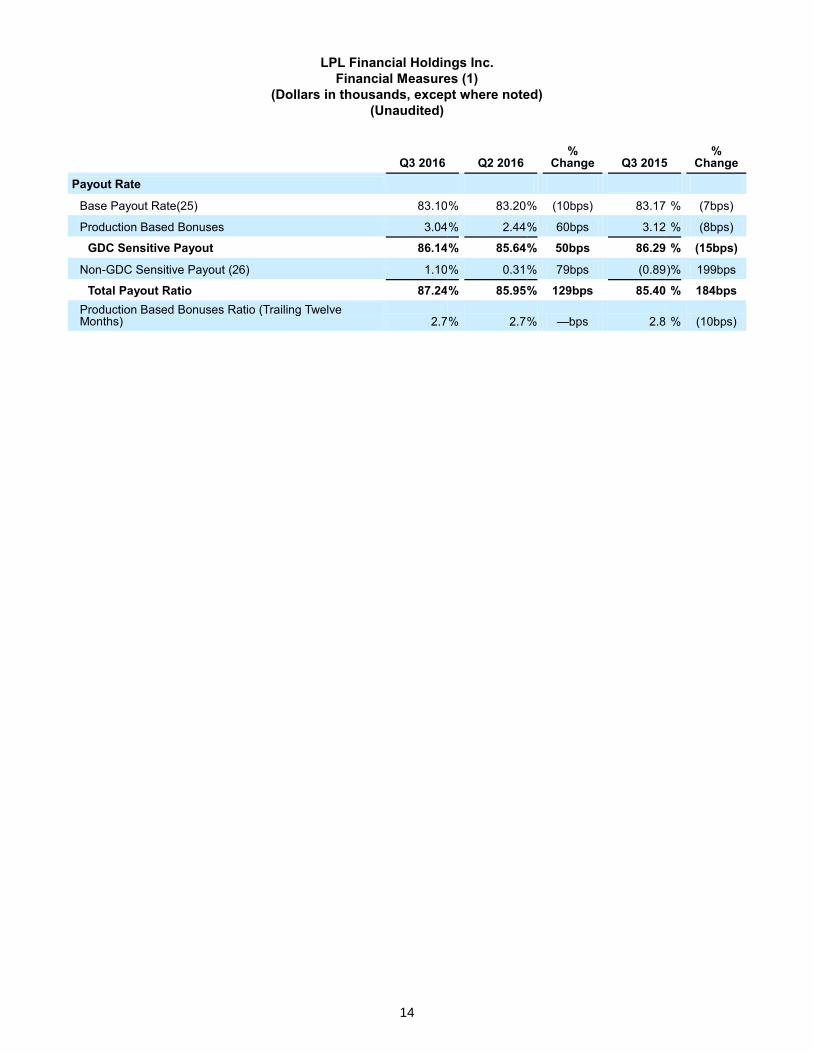
Payout Rate
Base Payout Rate(25) 83.10 % 83.20 % (10bps) 83.17 % (7bps)
Production Based Bonuses 3.04 % 2.44 % 60bps 3.12 % (8bps)
GDC Sensitive Payout 86.14 % 85.64 % 50bps 86.29 % (15bps)
Non-GDC Sensitive Payout (26) 1.10 % 0.31 % 79bps (0.89 )% 199bps
Total Payout Ratio 87.24 % 85.95 % 129bps 85.40 % 184bps
Production Based Bonuses Ratio (Trailing Twelve Months) 2.7 % 2.7 % —bps 2.8 % (10bps)
15
LPL Financial Holdings Inc.
Capital Management Measures (1)
(Dollars in thousands, except where noted)
(Unaudited)
Q3 2016 Q2 2016
Credit Agreement EBITDA(27)
Net income $ 51,954 $ 47,849
Non-operating interest expense 23,889 23,804
Provision for income taxes 16,270 31,900
Depreciation and amortization 18,434 18,749
Amortization of intangible assets 9,502 9,509
EBITDA 120,049 131,811
Credit Agreement Adjustments:
Employee share-based compensation expense(10) 4,431 4,721
Advisor share-based compensation expense(28) 2,327 376
Other(29) 5,727 6,062
Credit Agreement EBITDA $ 132,534 $ 142,970
Total Debt
Revolving Credit Facility Loans $ — $ —
Term Loan Outstanding 2,201,780 2,206,198
Total Debt $ 2,201,780 $ 2,206,198
Cash Available for Corporate Use(30)
Cash at Parent(31) $ 471,997 $ 447,238
Excess Cash at Broker-Dealer subsidiary per Credit Agreement 50,159 68,983
Other Available Cash 7,416 6,514
Total Cash Available for Corporate Use $ 529,572 $ 522,735
Credit Agreement Net Leverage
Total Debt $ 2,201,780 $ 2,206,198
Cash Available (up to $300 million) 300,000 300,000
Credit Agreement Net Debt $ 1,901,780 $ 1,906,198
Credit Agreement EBITDA (trailing twelve months)(32) $ 532,555 $ 521,292
Credit Agreement Net Leverage Ratio(33) 3.57 x 3.66 x
16
LPL Financial Holdings Inc.
Debt Schedule (1)
(Dollars in thousands, except where noted)
(Unaudited)
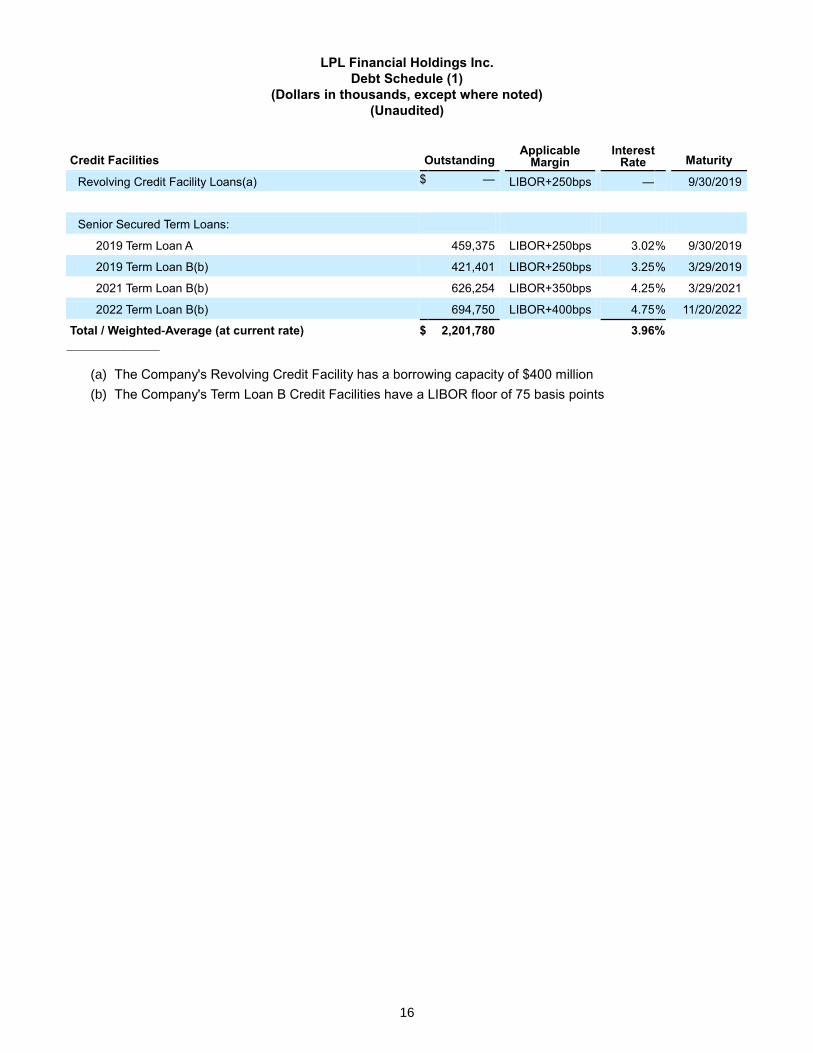
Credit Facilities Outstanding Applicable
Margin Interest
Rate Maturity
Revolving Credit Facility Loans(a) $ — LIBOR+250bps — 9/30/2019
Senior Secured Term Loans:
2019 Term Loan A 459,375 LIBOR+250bps 3.02 % 9/30/2019
2019 Term Loan B(b) 421,401 LIBOR+250bps 3.25 % 3/29/2019
2021 Term Loan B(b) 626,254 LIBOR+350bps 4.25 % 3/29/2021
2022 Term Loan B(b) 694,750 LIBOR+400bps 4.75 % 11/20/2022
Total / Weighted-Average (at current rate) $ 2,201,780 3.96 % _____________________
(a) The Company's Revolving Credit Facility has a borrowing capacity of $400 million
(b) The Company's Term Loan B Credit Facilities have a LIBOR floor of 75 basis points
17
LPL Financial Holdings Inc.
Key Business and Financial Metrics (1)
(Dollars in thousands, except where noted)
(Unaudited)
Q3 2016 Q2 2016 % Change Q3 2015 % Change
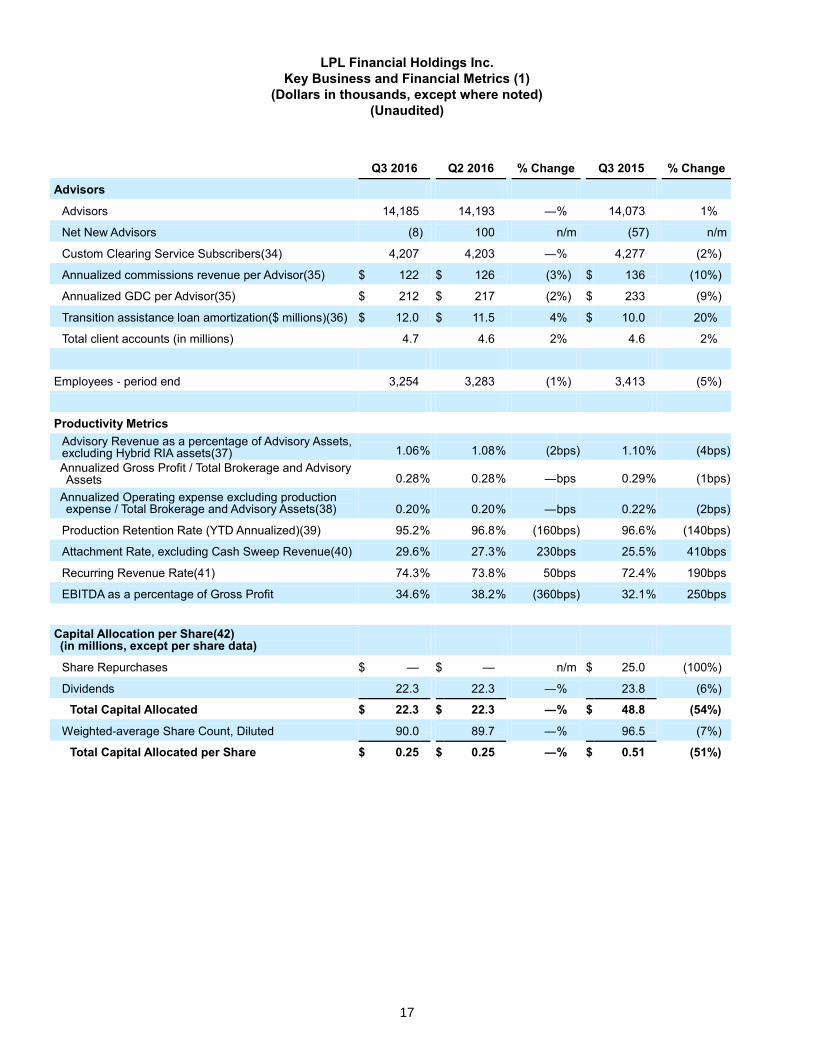
Advisors
Advisors 14,185 14,193
— % 14,073 1 %
Net New Advisors (8 ) 100 n/m (57 ) n/m
Custom Clearing Service Subscribers(34) 4,207 4,203
— % 4,277 (2 %)
Annualized commissions revenue per Advisor(35) $ 122 $ 126
(3 %) $ 136 (10 %)
Annualized GDC per Advisor(35) $ 212 $ 217
(2 %) $ 233 (9 %)
Transition assistance loan amortization($ millions)(36) $ 12.0 $ 11.5
4 % $ 10.0 20 %
Total client accounts (in millions) 4.7 4.6
2 % 4.6 2 %
Employees - period end 3,254 3,283
(1 %) 3,413 (5 %)
Productivity Metrics
Advisory Revenue as a percentage of Advisory Assets, excluding Hybrid RIA assets(37) 1.06 % 1.08 % (2 bps) 1.10 % (4 bps)
Annualized Gross Profit / Total Brokerage and Advisory Assets 0.28 % 0.28 % — bps 0.29 % (1 bps)
Annualized Operating expense excluding production expense / Total Brokerage and Advisory Assets(38) 0.20 % 0.20 % — bps 0.22 % (2 bps)
Production Retention Rate (YTD Annualized)(39) 95.2 % 96.8 % (160 bps) 96.6 % (140 bps)
Attachment Rate, excluding Cash Sweep Revenue(40) 29.6 % 27.3 % 230 bps 25.5 % 410 bps
Recurring Revenue Rate(41) 74.3 % 73.8 % 50 bps 72.4 % 190 bps
EBITDA as a percentage of Gross Profit 34.6 % 38.2 % (360 bps) 32.1 % 250 bps
Capital Allocation per Share(42) (in millions, except per share data)
Share Repurchases $ — $ —
n/m $ 25.0 (100 %)
Dividends 22.3 22.3
— % 23.8 (6 %)
Total Capital Allocated $ 22.3 $ 22.3 — % $ 48.8 (54 %)
Weighted-average Share Count, Diluted 90.0 89.7
— % 96.5 (7 %)
Total Capital Allocated per Share $ 0.25 $ 0.25 — % $ 0.51 (51 %)
18
Endnote Disclosures
(1) The information presented on pages 9-17 includes non-GAAP financial measures and operational and
performance metrics. For more information on non-GAAP measures, please see the section titled “Non-GAAP
Financial Measures” on page 3.
(2) GDC, or gross dealer concessions, a financial measure, is equal to the sum of Commission and Advisory
revenues.
(3) Cash sweep revenue consists of fees from the Company’s cash sweep program, specifically a money market
sweep vehicle involving money market fund providers and two insured bank deposit sweep vehicles (see FNs
15, 16, and 17). Cash sweep revenues are a component of asset-based revenues and are derived from the
Company’s Condensed Consolidated Statements of Income.
(4) Other asset-based revenues consists of the Company’s sponsorship programs with financial product
manufacturers and omnibus processing and networking services, but not including fees from cash sweep
programs. Other asset-based revenues are a component of asset-based revenues and are derived from the
Company’s Condensed Consolidated Statements of Income.
(5) Other consists of interest income as well as other revenues, as presented on the Company’s Condensed
Consolidated Statements of Income.
(6) Gross Profit is a non-GAAP measure. Please see a description of Gross Profit under “Non-GAAP Financial
Measures” on page 3 of this release for additional information.
(7) Core G&A is a non-GAAP measure. Please see a description of Core G&A under “Non-GAAP Financial
Measures” on page 3 of this release for additional information. Below is a reconciliation of Core G&A against
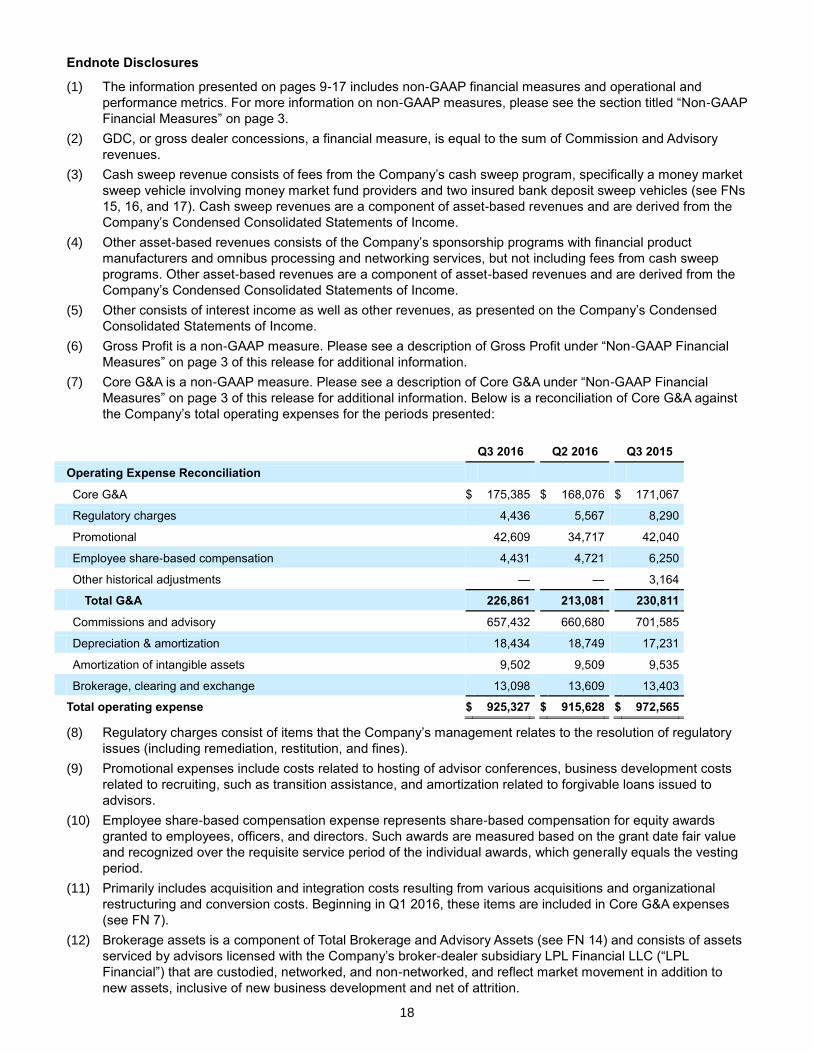
the Company’s total operating expenses for the periods presented:
Q3 2016 Q2 2016 Q3 2015
Operating Expense Reconciliation
Core G&A $ 175,385 $ 168,076
$ 171,067
Regulatory charges 4,436 5,567
8,290
Promotional 42,609 34,717
42,040
Employee share-based compensation 4,431 4,721
6,250
Other historical adjustments — —
3,164
Total G&A 226,861 213,081 230,811
Commissions and advisory 657,432 660,680 701,585
Depreciation & amortization 18,434 18,749
17,231
Amortization of intangible assets 9,502 9,509
9,535
Brokerage, clearing and exchange 13,098 13,609
13,403
Total operating expense $ 925,327 $ 915,628 $ 972,565
(8) Regulatory charges consist of items that the Company’s management relates to the resolution of regulatory
issues (including remediation, restitution, and fines).
(9) Promotional expenses include costs related to hosting of advisor conferences, business development costs
related to recruiting, such as transition assistance, and amortization related to forgivable loans issued to
advisors.
(10) Employee share-based compensation expense represents share-based compensation for equity awards
granted to employees, officers, and directors. Such awards are measured based on the grant date fair value
and recognized over the requisite service period of the individual awards, which generally equals the vesting
period.
(11) Primarily includes acquisition and integration costs resulting from various acquisitions and organizational
restructuring and conversion costs. Beginning in Q1 2016, these items are included in Core G&A expenses
(see FN 7).
(12) Brokerage assets is a component of Total Brokerage and Advisory Assets (see FN 14) and consists of assets
serviced by advisors licensed with the Company’s broker-dealer subsidiary LPL Financial LLC (“LPL
Financial”) that are custodied, networked, and non-networked, and reflect market movement in addition to
new assets, inclusive of new business development and net of attrition.
19
(13) Advisory Assets is a component of Total Brokerage and Advisory Assets (see FN 14) and consists of advisory
assets under management on the Company’s corporate advisory platform (see FN 21) and Hybrid RIA assets
in advisory accounts custodied at the Company (see FN 22).
(14) End of period Total Brokerage and Advisory Assets are comprised of assets that are custodied, networked,
and non-networked, and reflect market movement in addition to new assets, inclusive of new business
development and net of attrition. End of period Insured Cash Account, Deposit Cash Account and Money
Market Account Balances are also included in Total Brokerage and Advisory Assets.
(15) Insured Cash Account Balances represents advisors’ clients’ accounts balances in one of the Company's two
insured bank deposit sweep vehicles at the end of the reporting period. These accounts are available to
individuals, trusts (where beneficiaries are natural persons), and sole proprietorships, and these assets are
included in Total Brokerage and Advisory Assets (see FN 14).
(16) Deposit Cash Account Balances represents advisors’ clients’ accounts balances in one of the Company’s two
insured bank deposit sweep vehicles at the end of the reporting period. These accounts are available only to
advisory individual retirement accounts (IRAs), and these assets are included in Total Brokerage and
Advisory Assets (see FN 14)
(17) Money Market Account Cash Balances represents advisors’ clients’ accounts balances in money market fund
providers at the end of the reporting period. These assets are included in Total Brokerage and Advisory
Assets (see FN 14).
(18) Represents the sum of Insured Cash Account Balances, Deposit Cash Account Balances, and Money Market
Account Cash Balances, which together comprise end of period assets in the Company’s cash sweep
program. These assets are included in Total Brokerage and Advisory Assets (see FN 14).
(19) Net New Advisory Assets consist of total inflows of funds deposited into new advisory accounts and additional
funds deposited into existing advisory accounts that are custodied in the Company's fee-based advisory
platforms and total outflows from all closed and existing advisory accounts custodied on such platforms
during the period.
(20) Annualized growth is calculated by dividing Net New Advisory Assets (see FN 19) by the prior quarter end of
period advisory assets and multiplying by four.
(21) Total Corporate Assets represents the sum of total brokerage assets serviced by advisors who are licensed
with LPL Financial but not associated with Hybrid RIAs (see FN 22); and total advisory assets managed on
LPL Financial's corporate advisory platform by advisors who are registered investment advisory
representatives of LPL Financial. Total Corporate Assets are custodied, networked, and non-networked with
the Company, and reflect market movement in addition to new assets, inclusive of new business development
and net of attrition.
(22) The Company serves independent RIAs that conduct their advisory business through separate entities
(“Hybrid RIAs”) operating pursuant to the Investment Advisers Act of 1940 or through their respective states'
investment advisory licensing rules, rather than through LPL Financial. Advisors associated with Hybrid RIAs
pay fees to access the Company’s Hybrid RIA platform for an integrated offering of technology, clearing,
compliance, and custody services to Hybrid RIAs. Most financial advisors associated with Hybrid RIAs carry
their brokerage license with LPL Financial, although some financial advisors associated with Hybrid RIAs do
not carry a brokerage license through LPL Financial. Total Hybrid Platform Assets consist of assets managed
or serviced by advisors associated with a Hybrid RIA firm that are custodied, networked, and non-networked
with the Company, and reflect market movement in addition to new assets, inclusive of new business
development and net of attrition. This measure does not include assets managed by Hybrid RIAs that are
custodied with a third-party custodian.
(23) Total Brokerage and Advisory Retirement Assets are a component of Total Brokerage and Advisory Assets
(see FN 14), and consist of retirement plan assets held in advisory and brokerage accounts that are
custodied, networked, and non-networked at the Company, and reflect market movement in addition to new
assets, inclusive of new business development and net of attrition. This measure does not include additional
retirement plan assets serviced by advisors through either LPL Financial or Hybrid RIAs, which the Company
currently estimates at approximately $129 billion.
(24) With respect to the applicable cash sweep vehicle (Insured Cash Account, Deposit Cash Account and/or
Money Market Account), reflects the average fee yield over the period, as calculated by dividing total fee
revenue received from such vehicle by the average end of day balance level during the quarter in such
vehicle.
(25) The Company's production payout ratio is calculated as commission and advisory expenses, divided by GDC
(see FN 2).

20
(26) Non-GDC Sensitive Payout, a statistical or operating measure, includes share-based compensation expense
from equity awards granted to advisors and financial institutions (see FN 28) and mark-to-market gains or
losses on amounts designated by advisors as deferred.
(27) Credit Agreement EBITDA is a non-GAAP measure. Please see a description of Credit Agreement EBITDA
under “Non-GAAP Financial Measures” on page 4 of this release for additional information.
(28) Advisor share-based compensation expense represents share-based compensation for the stock options and
warrants awarded to advisors and financial institutions based on the fair value of the awards at each reporting
period.
(29) Other represents items that are adjustable in accordance with the Credit Agreement to calculate Credit
Agreement EBITDA, including employee severance costs, employee signing costs, employee retention or
completion bonuses, and other non-recurring costs.
(30) Consists of cash unrestricted by the Credit Agreement and other regulations available for operating, investing,
and financing uses.
(31) Parent refers to LPL Holdings, Inc., a direct subsidiary of the Company, which is the Borrower under the
Credit Agreement.
(32) Under the Credit Agreement, management calculates Credit Agreement EBITDA for a four-quarter period at
the end of each fiscal quarter, and in so doing may make further adjustments to prior quarters.
(33) Credit Agreement Net Leverage Ratio is calculated in accordance with the Credit Agreement, which includes
a maximum of $300 million of cash available for corporate use.
(34) Custom Clearing Service subscribers are financial advisors who are affiliated and licensed with insurance
companies that receive customized clearing services, advisory platforms, and technology solutions from the
Company.
(35) A simple average advisor count is used to calculate "per advisor" metrics by taking the average advisor count
from the current period and sequential period. The calculation uses the average advisor count at the
beginning and the end of period, and excludes Custom Clearing Service subscribers (see FN 34).
(36) Transition assistance consists of payments to newly recruited advisors and financial institutions to assist in
the transition process. Smaller advisor practices receive payments that are charged to earnings in the current
period, whereas larger advisor practices and financial institutions typically receive transition assistance in the
form of forgivable loans or recoverable advances that are generally amortized into earnings over a period of
three to five years. Transition assistance loan amortization represents the amortizable amount of forgivable
loans or recoverable advances that are charged to earnings in the period presented.
(37) Based on annualized advisory revenues divided by corporate advisory assets at the prior quarter's end
(corporate advisory assets is defined as total Advisory Assets (see FN 13) less Hybrid Platform Advisory
Assets (see FN 22)).
(38) Represents annualized operating expenses for the period, excluding production-related expense, divided by
Total Brokerage and Advisory Assets (see FN 14) for the period. Production-related expense includes
commissions and advisory expense and brokerage, clearing and exchange expense. For purposes of this
metric, operating expenses includes include Core G&A (see FN 7), Regulatory (see FN 8), Promotional (see
FN 9), Employee Share Based Compensation (see FN 10), Other Historical Adjustments (see FN 11),
Depreciation & Amortization, and Amortization of Intangibles.
(39) Reflects retention of commission and advisory revenues, calculated by deducting the prior year production of
the annualized year-to-date attrition rate, over the prior year total production.
(40) Attachment revenue is comprised of asset-based revenues (including revenue from cash sweep programs),
transaction and fee revenue, and other revenue. Attachment rate, excluding cash sweep revenue, is
calculated as attachment revenue (less revenue from cash sweep programs) over total commission and
advisory revenues for the quarter.
(41) Recurring Revenue Rate refers to the percentage of total net revenue that was recurring revenue for the
quarter. The Company tracks recurring revenue, a characterization of net revenue and a statistical measure,
which management defines to include revenues from asset-based fees, advisory fees, trailing commissions,
cash sweep programs, and certain other fees that are based upon accounts and advisors. Because certain
recurring revenues are associated with asset balances, they will fluctuate depending on the market values
and current interest rates. Accordingly, recurring revenue can be negatively impacted by adverse external
market conditions. However, management believes that recurring revenue is meaningful despite these
fluctuations because it is not dependent upon transaction volumes or other activity-based revenues, which
are more difficult to predict, particularly in declining or volatile markets.

21
(42) Capital allocation per share equals the amount of capital allocated for share repurchases and cash dividends
divided by the diluted weighted-average shares outstanding.