Embed Size (px)
Citation preview
Post, Broadcasting and Telecommunications
Market and Industry Report
Third Quarter
(July-September 2015)
Legal Disclaimer
The information and figures contained herein were obtained from licensees’ submissions to the
Commission and other sources available to the Commission. It is intended to provide an overview of the industry performance to the stakeholders. UCC does not give any warranty and may not be
liable for any loss or damage arising from its use or misuse.
2 | Q 3 ( J u l y - A u g u s t ) M a r k e t & I n d u s t r y R e p o r t
Table of contents Page
Contents
1.0 Introduction ................................................................................................................................... 4
2.0 Macroeconomic Factors .................................................................................................................. 4
2.1 Consumer Price Index (CPI)............................................................................................................ 4
2.1.1 Core CPI ..................................................................................................................................... 5
Figure 1: Quarterly -Trend in Consumer Price Index .............................................................................. 5
2.2 Exchange Rate................................................................................................................................ 6
Figure 2: Trend in Exchange Rates of the Shilling against the USD .................................................. 6
4.0 Telecommunications ....................................................................................................................... 6
4.1 National Telephony ........................................................................................................................ 6
4.2 Mobile Telephony .......................................................................................................................... 6
4.3 Fixed Telephony............................................................................................................................. 7
Table 1: Mobile & Fixed Telephony............................................................................................... 7
4.4 Tele-density ................................................................................................................................... 7
4.5 Traffic Growth ............................................................................................................................... 7
4.5.1 On-net & off-net Voice Traffic ..................................................................................................... 7
Table 2 On-net and Off-net Traffic data.......................................................................................... 7
4.5.2 International Voice Traffic ..................................................................................................... 8
Table 3. International Traffic (Minutes).......................................................................................... 8
4.5.3 Roaming Traffic (Voice) .............................................................................................................. 8
Table 4. Roaming Traffic (Minutes) ............................................................................................... 8
4.6 Communications Infrastructure........................................................................................................ 8
4.6.1 Public Infrastructure Providers (PIP) and Public Service Providers (PSP) ........................................ 8
Table 5. Communications Infrastructure data .................................................................................. 8
5.0 Mobile & Fixed Internet services ..................................................................................................... 9
Table 6. Internet and Data ............................................................................................................. 9
5.1 Bandwidth...................................................................................................................................... 9
Table 7. Bandwidth ....................................................................................................................... 9
6.0 Short Message Services (SMS) ...................................................................................................... 10
Table 8. Mobile data SMS ........................................................................................................... 10
7.0 Tariffs.......................................................................................................................................... 10
8.0 Telecommunication Revenue......................................................................................................... 10
3 | Q 3 ( J u l y - A u g u s t ) M a r k e t & I n d u s t r y R e p o r t
Table 9. Telecommunications Tax Revenue Data .......................................................................... 11
9.0 Broadcasting ................................................................................................................................ 11
Table 10. Broadcasting................................................................................................................ 11
9.1 Pay Television.............................................................................................................................. 11
Table 11. Pay TVs, Mode of broadcasting & Geographical coverage.............................................. 12
10.0 Postal Services ........................................................................................................................... 12
Table 12. Postal Data .................................................................................................................. 12
11.0 Mobile Money Services............................................................................................................... 13
Table 13. Mobile Money Services ................................................................................................ 13
12.0 Consumer Affairs ....................................................................................................................... 14
TABLE 14. Complaint types received, resolved and pending for the period under review ................ 14
Table 15 Second Level Consumer Complaints .............................................................................. 15
4 | Q 3 ( J u l y - A u g u s t ) M a r k e t & I n d u s t r y R e p o r t
1.0 Introduction
This report is a summary of the analysis done on the market and industry data largely extracted
from the operational reports of licensees in the communications sector, and covers the period July
to September 2015. In this report, data for Q3 (July-September) is compared against that for Q2
(April-June) as the baseline. The information derived from the market and industry data covers the
following key aspects of the communications sector:
a) Macroeconomic factors
b) Mobile telephony
c) Fixed telephony
d) Teledensity
e) Traffic growth
f) Communications Infrastructure
g) Internet/data services
h) Tariffs
i) Tax Revenue contributions of the communications sector
j) Mobile money services
k) Broadcasting and Postal services
l) Consumer Affairs
2.0 Macroeconomic Factors
Macroeconomic factors especially exchange rates and inflation have an impact on the operations
of telecommunication, broadcasting and postal operators. A big percentage of the investment and
operational expenditures is denominated in foreign currencies (especially the US Dollar), while
the increase in prices of commodities as well, has a direct effect on the operations of these
companies.
2.1 Consumer Price Index (CPI)
CPI is a measure that examines the weighted average of prices of a basket of consumer goods and
services, such as transportation, food and medical care. The CPI is calculated by taking price
changes for each item in the predetermined basket of goods and averaging them; the goods are
weighted according to their importance. Changes in CPI are used to assess price changes
associated with the cost of living.
5 | Q 3 ( J u l y - A u g u s t ) M a r k e t & I n d u s t r y R e p o r t
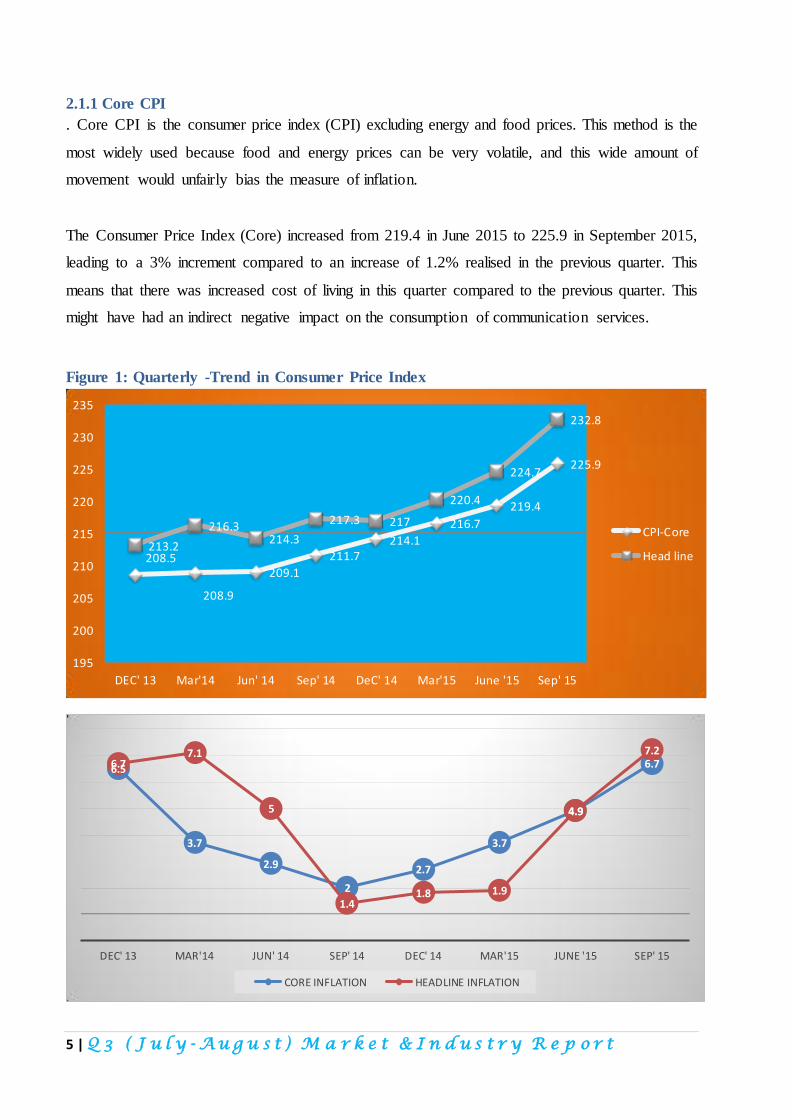
2.1.1 Core CPI
. Core CPI is the consumer price index (CPI) excluding energy and food prices. This method is the
most widely used because food and energy prices can be very volatile, and this wide amount of
movement would unfairly bias the measure of inflation.
The Consumer Price Index (Core) increased from 219.4 in June 2015 to 225.9 in September 2015,
leading to a 3% increment compared to an increase of 1.2% realised in the previous quarter. This
means that there was increased cost of living in this quarter compared to the previous quarter. This
might have had an indirect negative impact on the consumption of communication services.
Figure 1: Quarterly -Trend in Consumer Price Index
208.5
208.9
209.1
211.7 214.1
216.7
219.4
225.9
213.2
216.3 214.3
217.3 217
220.4
224.7
232.8
195
200
205
210
215
220
225
230
235
DEC' 13 Mar'14 Jun' 14 Sep' 14 DeC' 14 Mar'15 June '15 Sep' 15
CPI-Core
Head line
6.5
3.7
2.9
2
2.7
3.7
4.9
6.7 6.7 7.1
5
1.4 1.8 1.9
4.9
7.2
DEC' 13 MAR'14 JUN' 14 SEP' 14 DEC' 14 MAR'15 JUNE '15 SEP' 15
CORE INFLATION HEADLINE INFLATION
6 | Q 3 ( J u l y - A u g u s t ) M a r k e t & I n d u s t r y R e p o r t
Source: BOU website
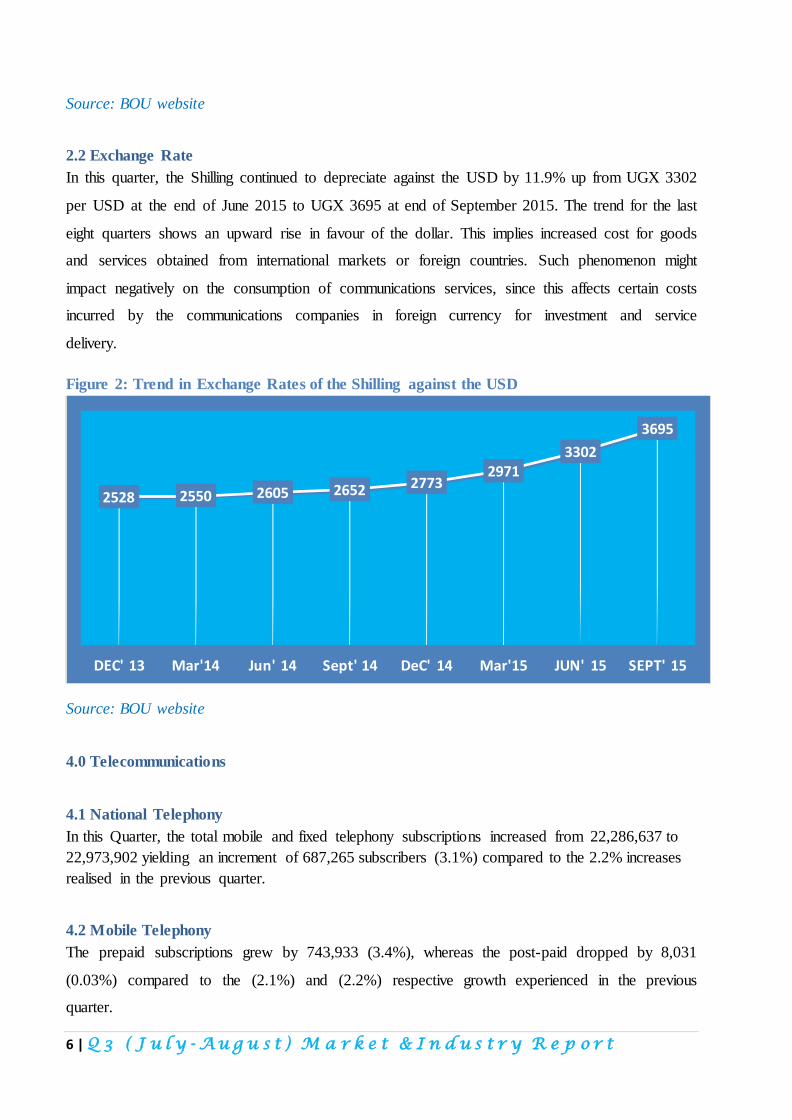
2.2 Exchange Rate
In this quarter, the Shilling continued to depreciate against the USD by 11.9% up from UGX 3302
per USD at the end of June 2015 to UGX 3695 at end of September 2015. The trend for the last
eight quarters shows an upward rise in favour of the dollar. This implies increased cost for goods
and services obtained from international markets or foreign countries. Such phenomenon might
impact negatively on the consumption of communications services, since this affects certain costs
incurred by the communications companies in foreign currency for investment and service
delivery.
Figure 2: Trend in Exchange Rates of the Shilling against the USD
Source: BOU website
4.0 Telecommunications
4.1 National Telephony
In this Quarter, the total mobile and fixed telephony subscriptions increased from 22,286,637 to
22,973,902 yielding an increment of 687,265 subscribers (3.1%) compared to the 2.2% increases
realised in the previous quarter.
4.2 Mobile Telephony
The prepaid subscriptions grew by 743,933 (3.4%), whereas the post-paid dropped by 8,031
(0.03%) compared to the (2.1%) and (2.2%) respective growth experienced in the previous
quarter.
2528 2550 2605 2652 2773 2971
3302
3695
DEC' 13 Mar'14 Jun' 14 Sept' 14 DeC' 14 Mar'15 JUN' 15 SEPT' 15
7 | Q 3 ( J u l y - A u g u s t ) M a r k e t & I n d u s t r y R e p o r t
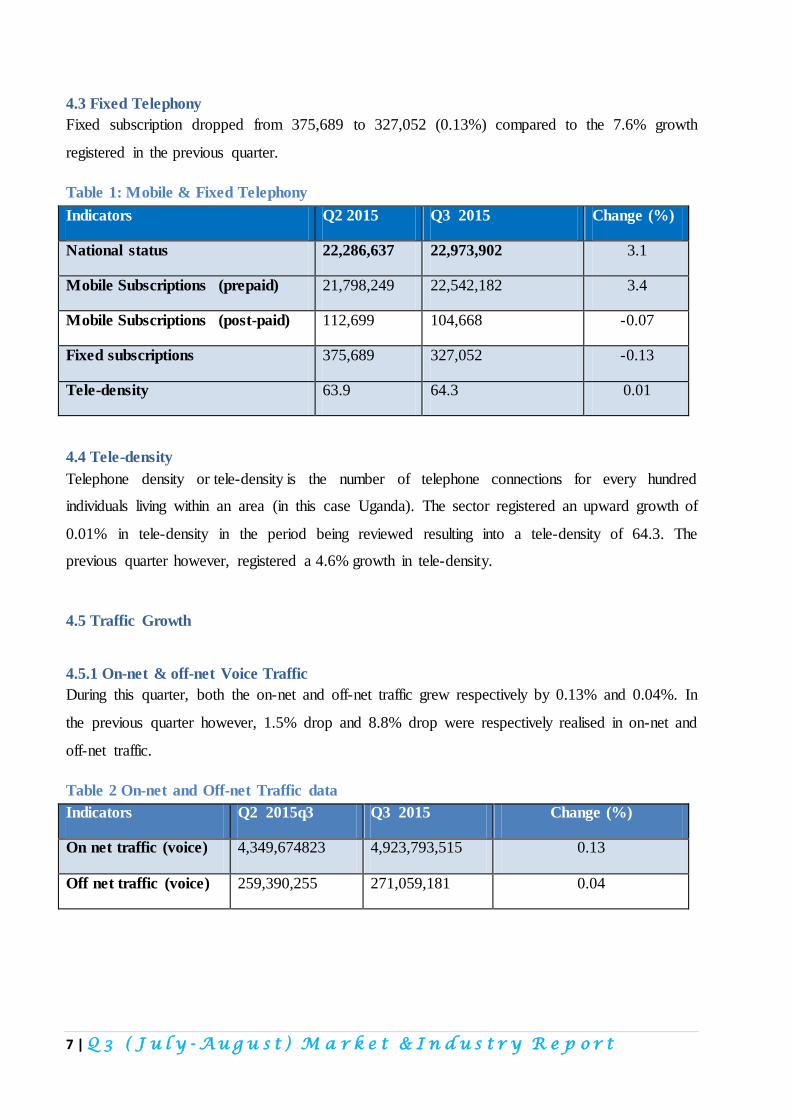
4.3 Fixed Telephony
Fixed subscription dropped from 375,689 to 327,052 (0.13%) compared to the 7.6% growth
registered in the previous quarter.
Table 1: Mobile & Fixed Telephony
Indicators Q2 2015 Q3 2015 Change (%)
National status 22,286,637 22,973,902 3.1
Mobile Subscriptions (prepaid) 21,798,249 22,542,182 3.4
Mobile Subscriptions (post-paid) 112,699 104,668 -0.07
Fixed subscriptions 375,689 327,052 -0.13
Tele-density 63.9 64.3 0.01
4.4 Tele-density
Telephone density or tele-density is the number of telephone connections for every hundred
individuals living within an area (in this case Uganda). The sector registered an upward growth of
0.01% in tele-density in the period being reviewed resulting into a tele-density of 64.3. The
previous quarter however, registered a 4.6% growth in tele-density.
4.5 Traffic Growth
4.5.1 On-net & off-net Voice Traffic
During this quarter, both the on-net and off-net traffic grew respectively by 0.13% and 0.04%. In
the previous quarter however, 1.5% drop and 8.8% drop were respectively realised in on-net and
off-net traffic.
Table 2 On-net and Off-net Traffic data
Indicators Q2 2015q3 Q3 2015 Change (%)
On net traffic (voice) 4,349,674823 4,923,793,515 0.13
Off net traffic (voice) 259,390,255 271,059,181 0.04
8 | Q 3 ( J u l y - A u g u s t ) M a r k e t & I n d u s t r y R e p o r t
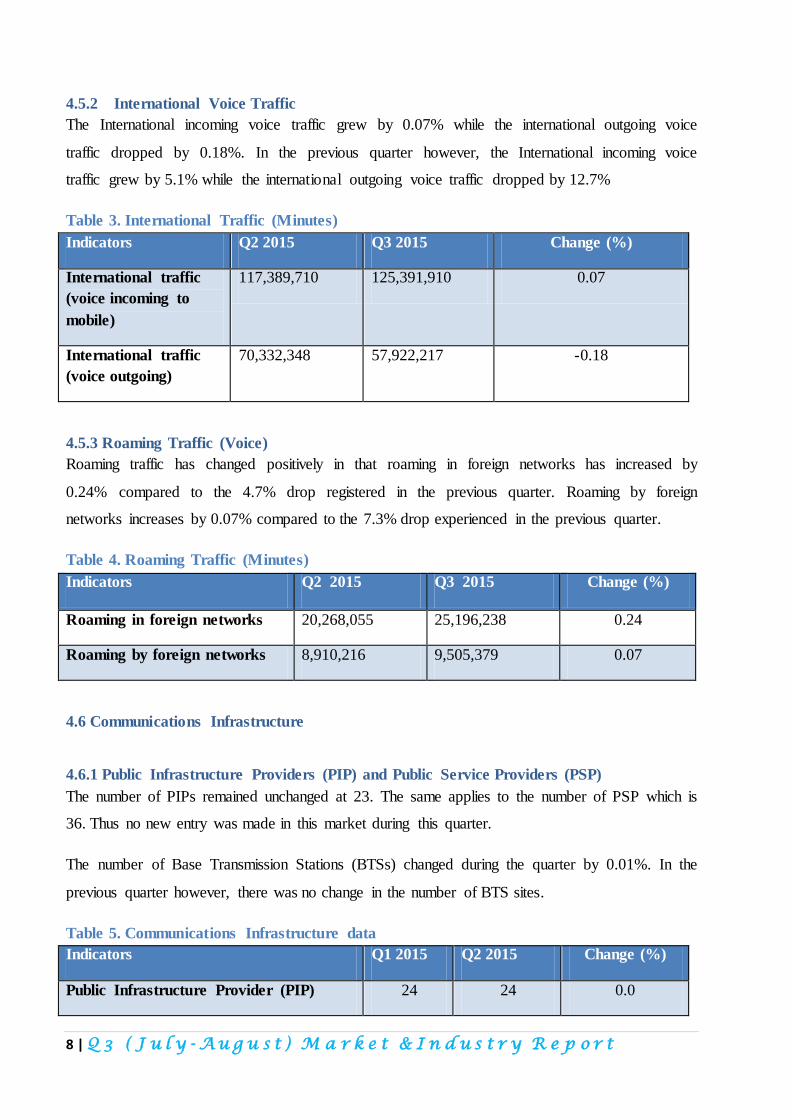
4.5.2 International Voice Traffic
The International incoming voice traffic grew by 0.07% while the international outgoing voice
traffic dropped by 0.18%. In the previous quarter however, the International incoming voice
traffic grew by 5.1% while the international outgoing voice traffic dropped by 12.7%
Table 3. International Traffic (Minutes)
Indicators Q2 2015 Q3 2015 Change (%)
International traffic
(voice incoming to
mobile)
117,389,710 125,391,910 0.07
International traffic
(voice outgoing)
70,332,348 57,922,217 -0.18
4.5.3 Roaming Traffic (Voice)
Roaming traffic has changed positively in that roaming in foreign networks has increased by
0.24% compared to the 4.7% drop registered in the previous quarter. Roaming by foreign
networks increases by 0.07% compared to the 7.3% drop experienced in the previous quarter.
Table 4. Roaming Traffic (Minutes)
Indicators Q2 2015 Q3 2015 Change (%)
Roaming in foreign networks 20,268,055 25,196,238 0.24
Roaming by foreign networks 8,910,216 9,505,379 0.07
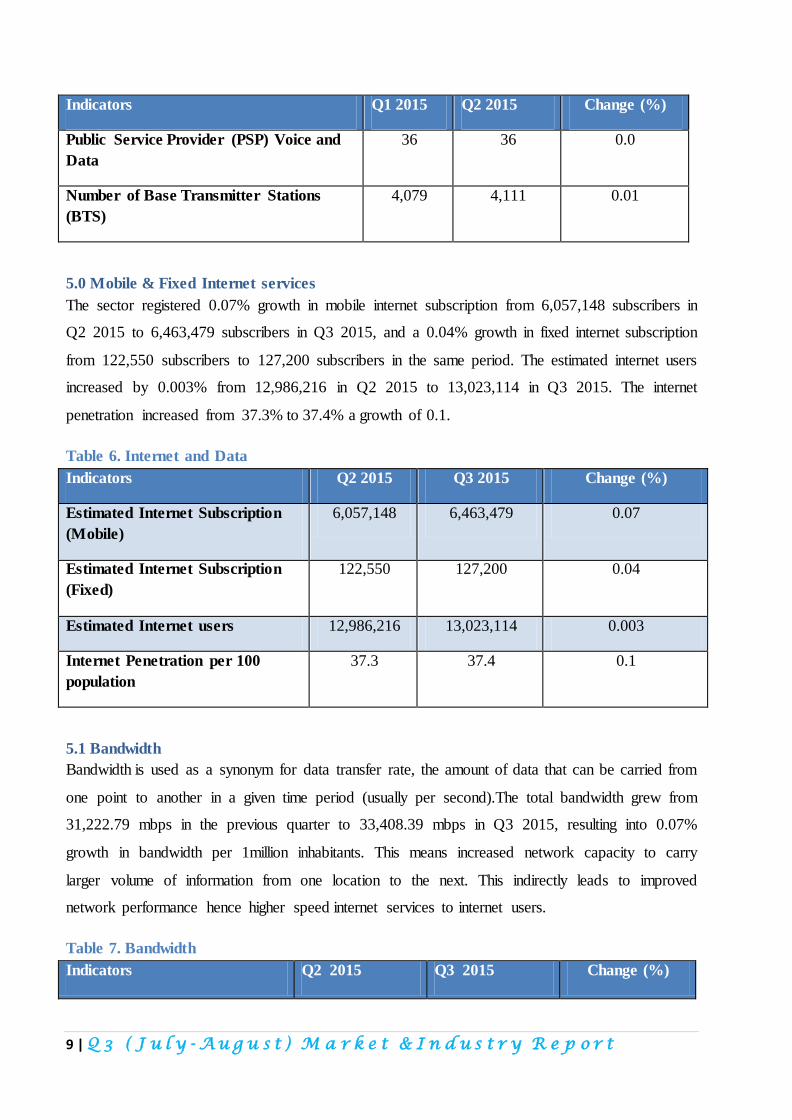
4.6 Communications Infrastructure
4.6.1 Public Infrastructure Providers (PIP) and Public Service Providers (PSP)
The number of PIPs remained unchanged at 23. The same applies to the number of PSP which is
36. Thus no new entry was made in this market during this quarter.
The number of Base Transmission Stations (BTSs) changed during the quarter by 0.01%. In the
previous quarter however, there was no change in the number of BTS sites.
Table 5. Communications Infrastructure data
Indicators Q1 2015 Q2 2015 Change (%)
Public Infrastructure Provider (PIP) 24 24 0.0
9 | Q 3 ( J u l y - A u g u s t ) M a r k e t & I n d u s t r y R e p o r t
Indicators Q1 2015 Q2 2015 Change (%)
Public Service Provider (PSP) Voice and
Data
36 36 0.0
Number of Base Transmitter Stations
(BTS)
4,079 4,111 0.01
5.0 Mobile & Fixed Internet services
The sector registered 0.07% growth in mobile internet subscription from 6,057,148 subscribers in
Q2 2015 to 6,463,479 subscribers in Q3 2015, and a 0.04% growth in fixed internet subscription
from 122,550 subscribers to 127,200 subscribers in the same period. The estimated internet users
increased by 0.003% from 12,986,216 in Q2 2015 to 13,023,114 in Q3 2015. The internet
penetration increased from 37.3% to 37.4% a growth of 0.1.
Table 6. Internet and Data
Indicators Q2 2015 Q3 2015 Change (%)
Estimated Internet Subscription
(Mobile)
6,057,148 6,463,479 0.07
Estimated Internet Subscription
(Fixed)
122,550 127,200 0.04
Estimated Internet users 12,986,216 13,023,114 0.003
Internet Penetration per 100
population
37.3 37.4 0.1
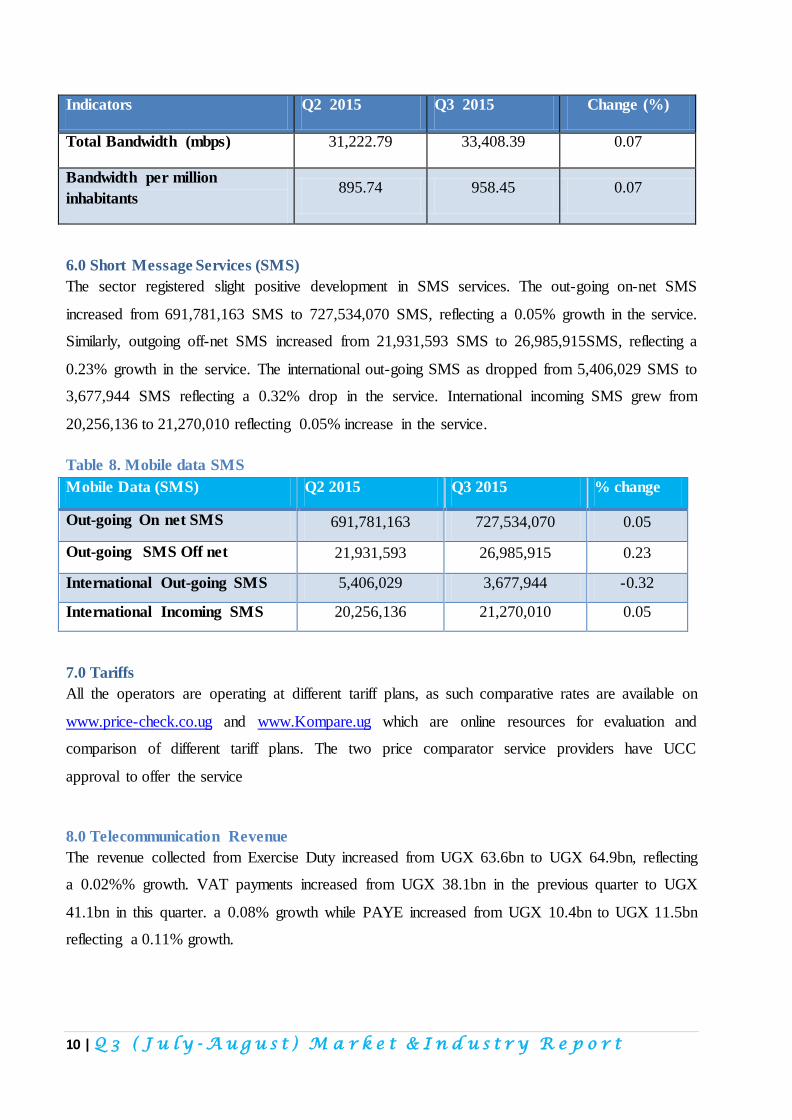
5.1 Bandwidth
Bandwidth is used as a synonym for data transfer rate, the amount of data that can be carried from
one point to another in a given time period (usually per second).The total bandwidth grew from
31,222.79 mbps in the previous quarter to 33,408.39 mbps in Q3 2015, resulting into 0.07%
growth in bandwidth per 1million inhabitants. This means increased network capacity to carry
larger volume of information from one location to the next. This indirectly leads to improved
network performance hence higher speed internet services to internet users.
Table 7. Bandwidth
Indicators Q2 2015 Q3 2015 Change (%)
10 | Q 3 ( J u l y - A u g u s t ) M a r k e t & I n d u s t r y R e p o r t
Indicators Q2 2015 Q3 2015 Change (%)
Total Bandwidth (mbps) 31,222.79 33,408.39 0.07
Bandwidth per million
inhabitants 895.74 958.45 0.07
6.0 Short Message Services (SMS)
The sector registered slight positive development in SMS services. The out-going on-net SMS
increased from 691,781,163 SMS to 727,534,070 SMS, reflecting a 0.05% growth in the service.
Similarly, outgoing off-net SMS increased from 21,931,593 SMS to 26,985,915SMS, reflecting a
0.23% growth in the service. The international out-going SMS as dropped from 5,406,029 SMS to
3,677,944 SMS reflecting a 0.32% drop in the service. International incoming SMS grew from
20,256,136 to 21,270,010 reflecting 0.05% increase in the service.
Table 8. Mobile data SMS
Mobile Data (SMS) Q2 2015 Q3 2015 % change
Out-going On net SMS 691,781,163 727,534,070 0.05
Out-going SMS Off net 21,931,593 26,985,915 0.23
International Out-going SMS 5,406,029 3,677,944 -0.32
International Incoming SMS 20,256,136 21,270,010 0.05
7.0 Tariffs
All the operators are operating at different tariff plans, as such comparative rates are available on
www.price-check.co.ug and www.Kompare.ug which are online resources for evaluation and
comparison of different tariff plans. The two price comparator service providers have UCC
approval to offer the service
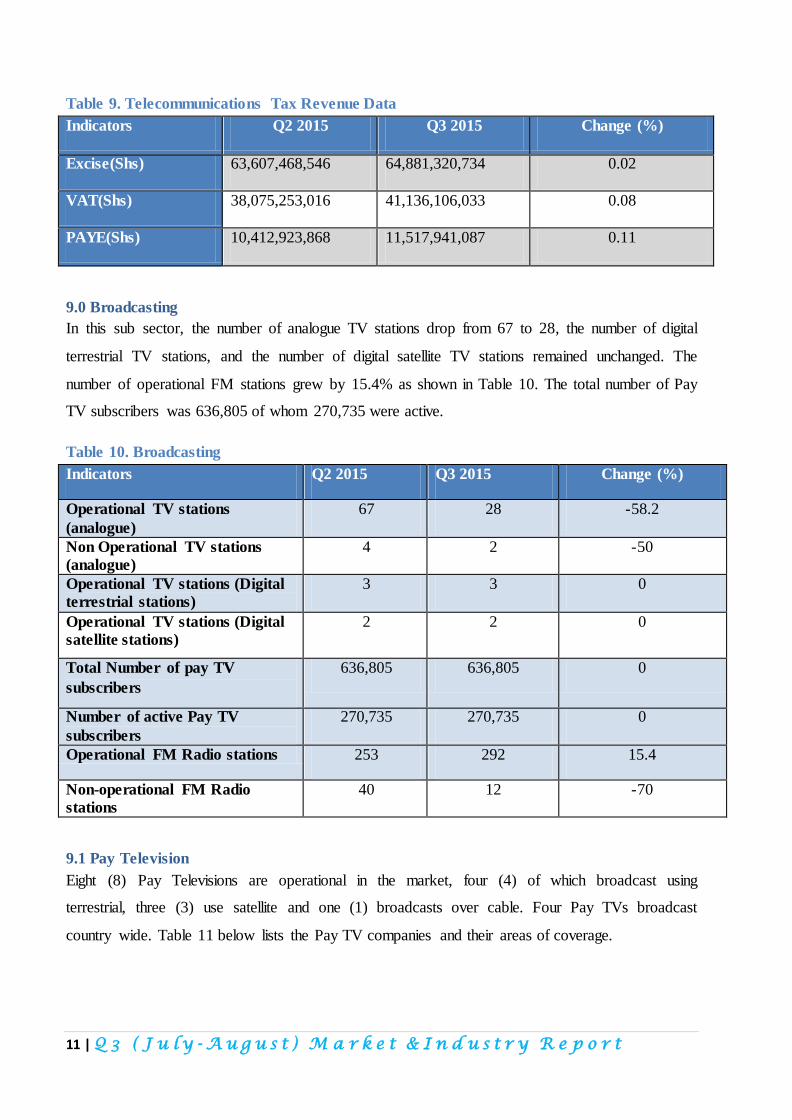
8.0 Telecommunication Revenue
The revenue collected from Exercise Duty increased from UGX 63.6bn to UGX 64.9bn, reflecting
a 0.02%% growth. VAT payments increased from UGX 38.1bn in the previous quarter to UGX
41.1bn in this quarter. a 0.08% growth while PAYE increased from UGX 10.4bn to UGX 11.5bn
reflecting a 0.11% growth.
11 | Q 3 ( J u l y - A u g u s t ) M a r k e t & I n d u s t r y R e p o r t
Table 9. Telecommunications Tax Revenue Data
Indicators Q2 2015 Q3 2015 Change (%)
Excise(Shs) 63,607,468,546 64,881,320,734 0.02
VAT(Shs) 38,075,253,016 41,136,106,033 0.08
PAYE(Shs) 10,412,923,868 11,517,941,087 0.11
9.0 Broadcasting
In this sub sector, the number of analogue TV stations drop from 67 to 28, the number of digital
terrestrial TV stations, and the number of digital satellite TV stations remained unchanged. The
number of operational FM stations grew by 15.4% as shown in Table 10. The total number of Pay
TV subscribers was 636,805 of whom 270,735 were active.
Table 10. Broadcasting
Indicators Q2 2015 Q3 2015 Change (%)
Operational TV stations
(analogue)
67 28 -58.2
Non Operational TV stations
(analogue)
4 2 -50
Operational TV stations (Digital
terrestrial stations)
3 3 0
Operational TV stations (Digital
satellite stations)
2 2 0
Total Number of pay TV
subscribers
636,805 636,805 0
Number of active Pay TV
subscribers
270,735 270,735 0
Operational FM Radio stations 253 292 15.4
Non-operational FM Radio
stations
40 12 -70
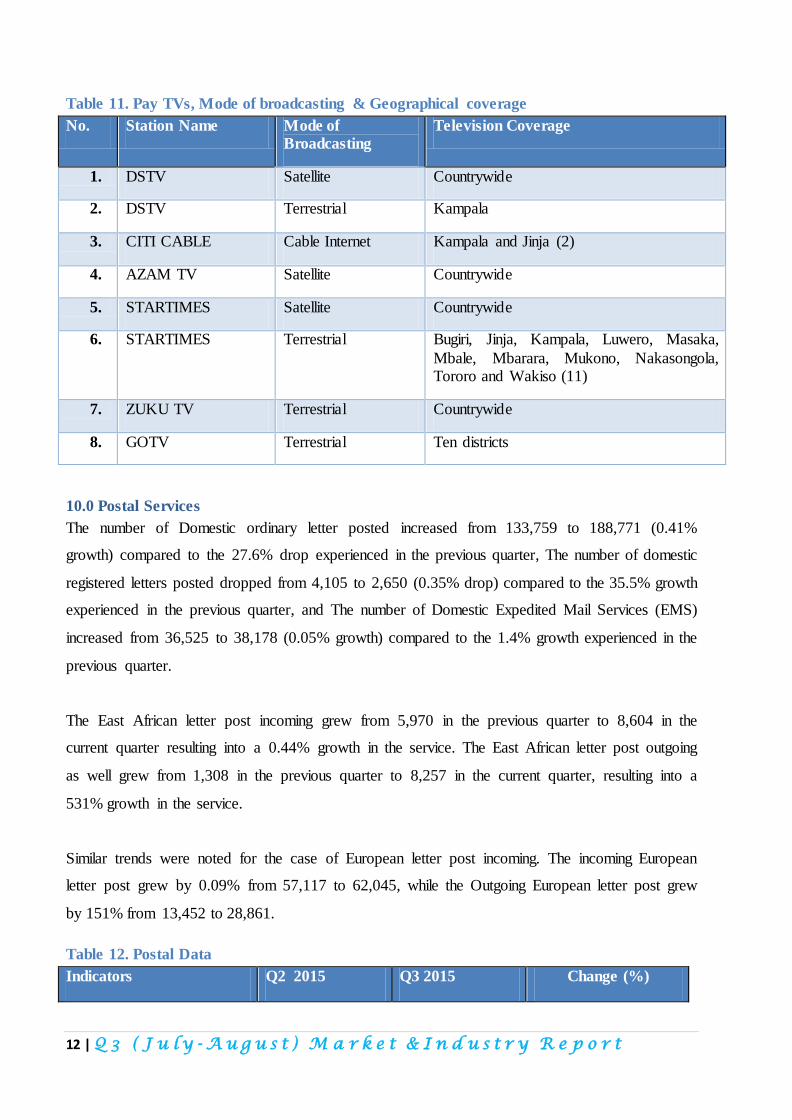
9.1 Pay Television
Eight (8) Pay Televisions are operational in the market, four (4) of which broadcast using
terrestrial, three (3) use satellite and one (1) broadcasts over cable. Four Pay TVs broadcast
country wide. Table 11 below lists the Pay TV companies and their areas of coverage.
12 | Q 3 ( J u l y - A u g u s t ) M a r k e t & I n d u s t r y R e p o r t
Table 11. Pay TVs, Mode of broadcasting & Geographical coverage
No. Station Name Mode of
Broadcasting
Television Coverage
1. DSTV Satellite Countrywide
2. DSTV Terrestrial Kampala
3. CITI CABLE Cable Internet Kampala and Jinja (2)
4. AZAM TV Satellite Countrywide
5. STARTIMES Satellite Countrywide
6. STARTIMES Terrestrial Bugiri, Jinja, Kampala, Luwero, Masaka,
Mbale, Mbarara, Mukono, Nakasongola, Tororo and Wakiso (11)
7. ZUKU TV Terrestrial Countrywide
8. GOTV Terrestrial Ten districts
10.0 Postal Services
The number of Domestic ordinary letter posted increased from 133,759 to 188,771 (0.41%
growth) compared to the 27.6% drop experienced in the previous quarter, The number of domestic
registered letters posted dropped from 4,105 to 2,650 (0.35% drop) compared to the 35.5% growth
experienced in the previous quarter, and The number of Domestic Expedited Mail Services (EMS)
increased from 36,525 to 38,178 (0.05% growth) compared to the 1.4% growth experienced in the
previous quarter.
The East African letter post incoming grew from 5,970 in the previous quarter to 8,604 in the
current quarter resulting into a 0.44% growth in the service. The East African letter post outgoing
as well grew from 1,308 in the previous quarter to 8,257 in the current quarter, resulting into a
531% growth in the service.
Similar trends were noted for the case of European letter post incoming. The incoming European
letter post grew by 0.09% from 57,117 to 62,045, while the Outgoing European letter post grew
by 151% from 13,452 to 28,861.
Table 12. Postal Data
Indicators Q2 2015 Q3 2015 Change (%)
13 | Q 3 ( J u l y - A u g u s t ) M a r k e t & I n d u s t r y R e p o r t
Indicators Q2 2015 Q3 2015 Change (%)
Courier Licence operators
(International, Regional,
Domestic)
(8,5,11) (8,5,11) N/A
Domestic Ordinary Letter
Posted
133,759 188,771 0.41
Domestic Registered
Letter
4,105 2,650 -0.35
Domestic Express Mail
Services (DEMS)
36,525 38,178 0.05
East African letter post
(Incoming)
5,970 8,604 0.44
East African letter post
(Outgoing)
1,308 8,257 5.31
European letter post
(Incoming)
57,117 62,045 0.09
European letter post
(Outgoing)
13,452 33,709 1.51
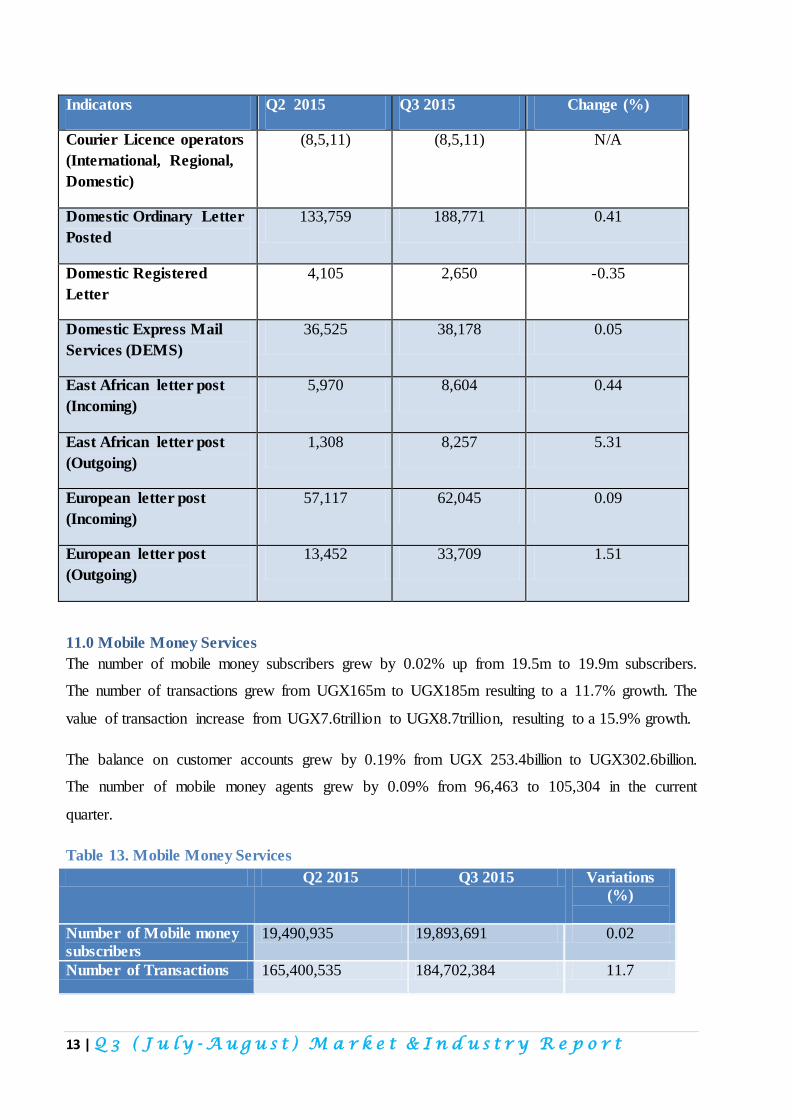
11.0 Mobile Money Services
The number of mobile money subscribers grew by 0.02% up from 19.5m to 19.9m subscribers.
The number of transactions grew from UGX165m to UGX185m resulting to a 11.7% growth. The
value of transaction increase from UGX7.6trillion to UGX8.7trillion, resulting to a 15.9% growth.
The balance on customer accounts grew by 0.19% from UGX 253.4billion to UGX302.6billion.
The number of mobile money agents grew by 0.09% from 96,463 to 105,304 in the current
quarter.
Table 13. Mobile Money Services
Q2 2015 Q3 2015 Variations
(%)
Number of Mobile money
subscribers
19,490,935 19,893,691 0.02
Number of Transactions 165,400,535 184,702,384 11.7
14 | Q 3 ( J u l y - A u g u s t ) M a r k e t & I n d u s t r y R e p o r t
Value of Transactions 7,554,399,782,777 8,754,400,345,665 15.9
Balance on customer
accounts
253,415,279,271 302,554,989,281 0.19
Number of mobile money
agents
96,463 105,304 0.09
(Source BOU)
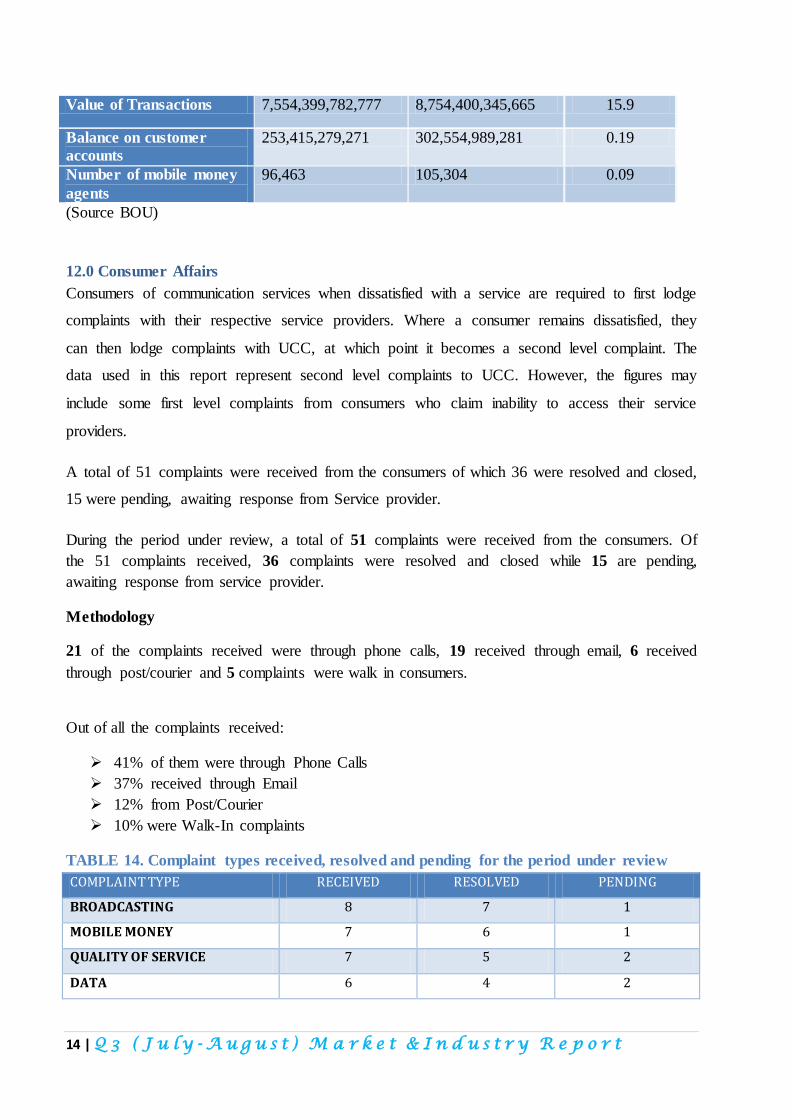
12.0 Consumer Affairs
Consumers of communication services when dissatisfied with a service are required to first lodge
complaints with their respective service providers. Where a consumer remains dissatisfied, they
can then lodge complaints with UCC, at which point it becomes a second level complaint. The
data used in this report represent second level complaints to UCC. However, the figures may
include some first level complaints from consumers who claim inability to access their service
providers.
A total of 51 complaints were received from the consumers of which 36 were resolved and closed,
15 were pending, awaiting response from Service provider.
During the period under review, a total of 51 complaints were received from the consumers. Of
the 51 complaints received, 36 complaints were resolved and closed while 15 are pending,
awaiting response from service provider.
Methodology
21 of the complaints received were through phone calls, 19 received through email, 6 received
through post/courier and 5 complaints were walk in consumers.
Out of all the complaints received:
41% of them were through Phone Calls
37% received through Email
12% from Post/Courier
10% were Walk-In complaints
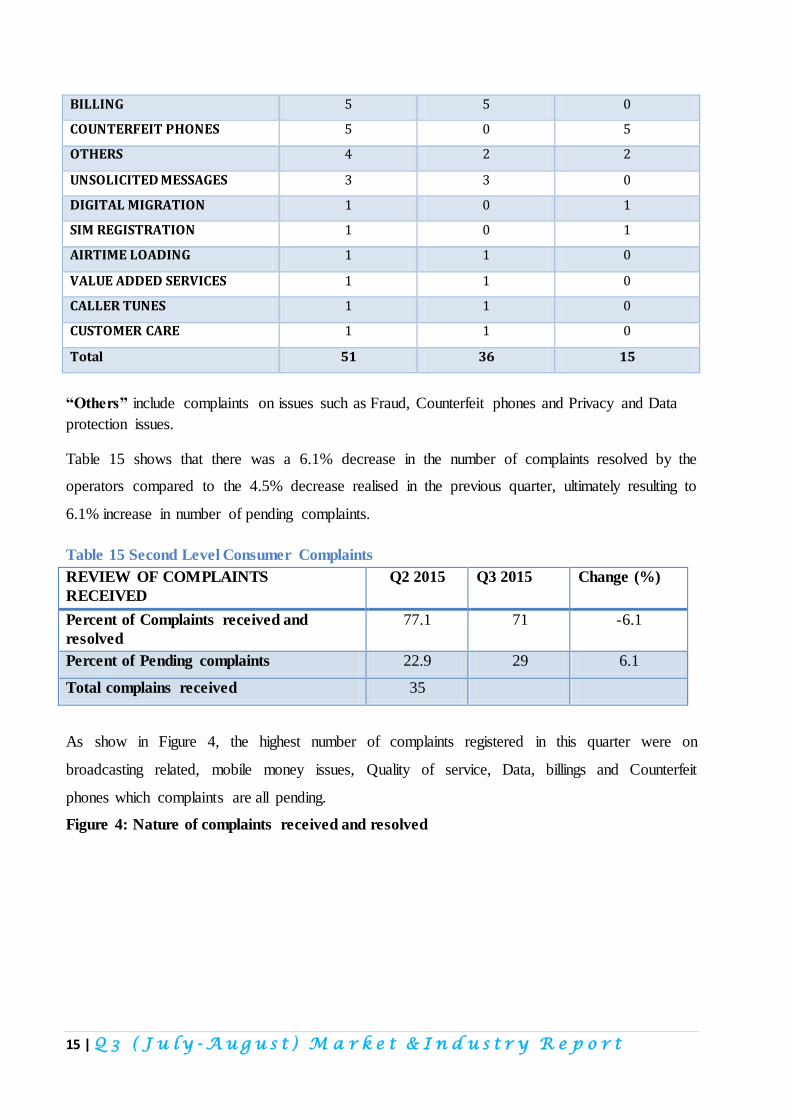
TABLE 14. Complaint types received, resolved and pending for the period under review
COMPLAINT TYPE RECEIVED RESOLVED PENDING
BROADCASTING 8 7 1
MOBILE MONEY 7 6 1
QUALITY OF SERVICE 7 5 2
DATA 6 4 2
15 | Q 3 ( J u l y - A u g u s t ) M a r k e t & I n d u s t r y R e p o r t
BILLING 5 5 0
COUNTERFEIT PHONES 5 0 5
OTHERS 4 2 2
UNSOLICITED MESSAGES 3 3 0
DIGITAL MIGRATION 1 0 1
SIM REGISTRATION 1 0 1
AIRTIME LOADING 1 1 0
VALUE ADDED SERVICES 1 1 0
CALLER TUNES 1 1 0
CUSTOMER CARE 1 1 0
Total 51 36 15
“Others” include complaints on issues such as Fraud, Counterfeit phones and Privacy and Data
protection issues.
Table 15 shows that there was a 6.1% decrease in the number of complaints resolved by the
operators compared to the 4.5% decrease realised in the previous quarter, ultimately resulting to
6.1% increase in number of pending complaints.
Table 15 Second Level Consumer Complaints
REVIEW OF COMPLAINTS
RECEIVED
Q2 2015 Q3 2015 Change (%)
Percent of Complaints received and
resolved
77.1 71 -6.1
Percent of Pending complaints 22.9 29 6.1
Total complains received 35
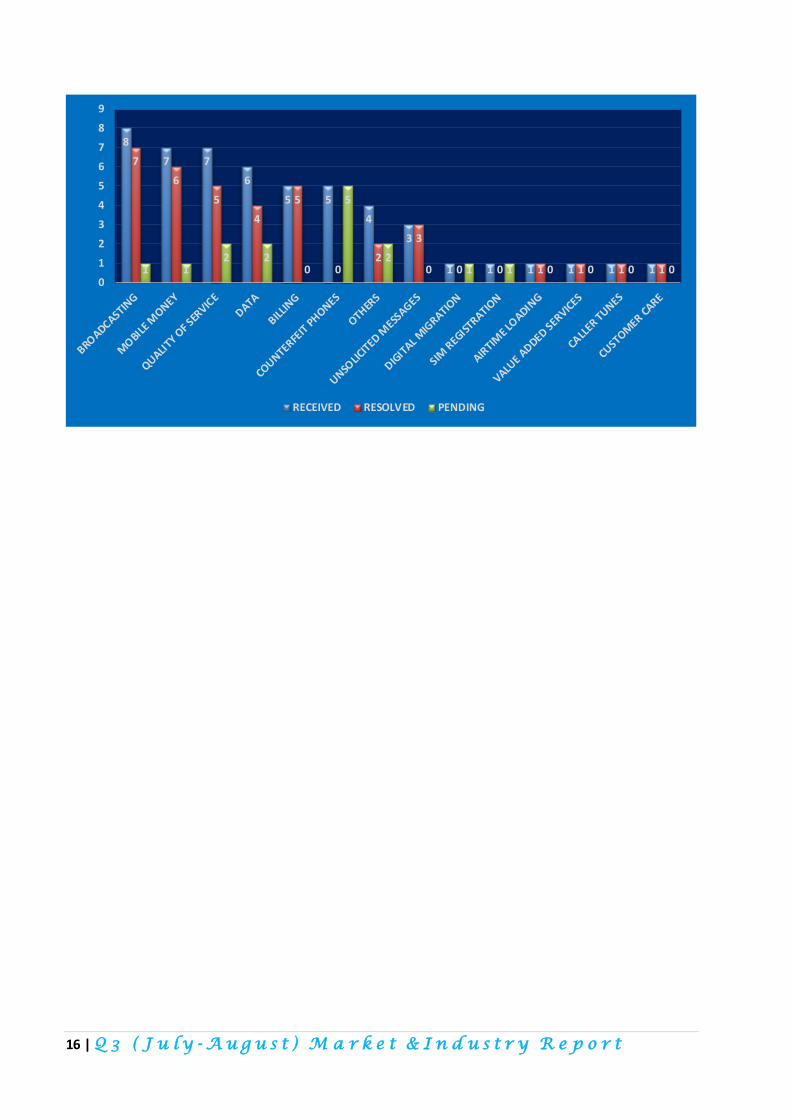
As show in Figure 4, the highest number of complaints registered in this quarter were on
broadcasting related, mobile money issues, Quality of service, Data, billings and Counterfeit
phones which complaints are all pending.
Figure 4: Nature of complaints received and resolved
16 | Q 3 ( J u l y - A u g u s t ) M a r k e t & I n d u s t r y R e p o r t
8
7 7
6
5 5
4
3
1 1 1 1 1 1
7
6
5
4
5
0 2
3
0 0 1 1 1 1 1 1 2 2
0
5
2 0 1 1 0 0 0 0
0
1
2
3
4
5
6
7
8
9
RECEIVED RESOLVED PENDING