Embed Size (px)
Citation preview
Containment Hydrodynamic Loads 3B-1
Preliminary Safety Analysis Report
LUNGMEN UNITS 1 & 2
3B Containment Hydrodynamic Loads
3B.1 Introduction
3B.1.1 Purpose
This appendix provides a description and load definition methodology for hydrodynamic loading conditions inside the primary containment Lungmen Nuclear Power Station (NPS) during Safety Relief Valve (SRV) actuation and a loss-of-coolant accident (LOCA) events. Overall, the load definition methodology used for the Lungmen NPS containment design is similar to that used for prior BWR containment designs.
3B.1.2 Containment Design Features
Subsection 6.2.1.1.2 provides a description of the design features of the Lungmen NPS containment system. The basic Lungmen NPS containment features are shown in Figure 3B-1. The Lungmen NPS design utilizes a horizontal vent system that is similar to the prior Mark III design.
3B.2 Review of Phenomena
This section describes the sequence of events occurring during SRV actuations and a postulated LOCA, and describes the potential load producing conditions. A spectrum of break sizes is considered for the LOCA event.
3B.2.1 Safety Relief Valve Actuation
SRVs are utilized in a BWR pressure suppression system to provide pressure relief during certain reactor transients. Steam discharge through the SRVs is routed through discharge lines into the pressure suppression pool, where it is condensed. Each discharge pipe is fitted at the end with a device called a quencher to promote heat transfer during SRV actuation between the high temperature compressed air and steam mixture and the cooler water in the suppression pool. This enhances heat transfer results in a low amplitude oscillating pressure in the pool and eliminates concern over operation at high suppression pool temperature. The discharge device used for the Lungmen NPS is an X-quencher.
SRV actuation may occur (1) in response to a reactor system transient pressure increase (pressure actuation), (2) as the result of planned operator action (manual operation), or (3) as the result of a failure or error affecting one SRV (inadvertant opening). Inadvertant operation involves a single SRV, as does manual operation. Pressure actuation involves from one to all SRVs opening sequentially during the vessel pressure rise. The opening sequence depends on the SRV pressure setpoints.
The discharge piping of an SRV contains ambient air and a column of water whose volume is determined by (1) the submergence and inclination of the SRV discharge line in the suppression pool, and (2) the difference in the drywell and wetwell airspace pressures. Upon SRV actuation,
3B-2 Containment Hydrodynamic Loads
Preliminary Safety Analysis Report
LUNGMEN UNITS 1 & 2
pressure builds up inside the piping as SRV blowdown steam compresses the air and forces the water column through the quencher into the suppression pool. The expulsion of water from the SRV line into the suppression pool is called the Òwater-clearing phaseÓ of the SRV discharge. The loads associated with the water-clearing phase are: (1) transient SRV pipe pressure and thermal loads; (2) pipe reaction forces from transient pressure waves and fluid motion in the pipe; (3) drag loads on structures located in the path of the submerged water jet, and (4) pool boundary loads.
Air, initially contained in the SRV discharge line, follows the water column into the suppression pool in the form of high-pressure air bubbles. Once in the pool, the bubbles expand because the ambient pool pressure is lower than the bubble pressure. The subsequent interaction of the air bubbles and the pool water manifests itself as an oscillatory pressure field which persists with decaying amplitude until the air bubbles rise to the pool surface. This period of air bubbles rising to the pool surface is called the Òair-clearing phase.Ó The frequency of the pressure oscillation is influenced by (1) the initial mass of air in the SRV line, (2) the submergence of SRV discharge line in the pool, (3) the suppression pool temperature, (4) the suppression pool geometry, and (5) the wetwell airspace pressure. Loads associated with the air bubble dynamic phenomena are transient drag loads on submerged structures caused by the velocity field (standard drag) and the acceleration field (inertial drag), and oscillating pressure loads on the pool boundary.
Following the air-clearing phase, steady steam discharge flow is established and continues until the SRV is closed. The steam enters the pool from the quencher discharge device as submerged jets, and the discharging steam is completely condensed outside the quencher. Loads associated with the steady steam flow phase of the SRV discharge include (1) pipe reaction forces caused by steady steam flow through pipe bends, (2) thrust forces on the quencher, (3) thermal loads on structures contacted by the steam, and (4) pool boundary loads caused by the oscillation of the condensing steam jets at the quencher.
Following SRV closure, the steam in the discharge line will start condensing creating vacuum in the discharge line. As a result of the vacuum conditions, the pressure in the discharge line will decrease and a relatively high (greater than the initial) water leg may be drawn into the line. The water leg after a short time, will return to near normal level while SRV remains in its closed position. However, subsequent actuation of an SRV before the water leg reduces to near the normal level can result in loads substantially higher than those with normal water leg conditions. To mitigate this potential for higher loads, vacuum breakers on each SRV discharge line are provided. The vacuum breakers connect to the drywell and they open when pressure in the discharge line falls below the drywell pressure. Consequently, drywell air is drawn into the discharge line which limits water reflood rise within the discharge line and restore the water leg in the discharge line to near normal value before SRV reopens. Water leg condition at this time is effectively the same as that prior to first actuation, and reopening of the SRV will result in a repeat of the previously described sequence of events. However, the magnitudes of loads
Containment Hydrodynamic Loads 3B-3
Preliminary Safety Analysis Report
LUNGMEN UNITS 1 & 2
associated with the subsequent SRV actuation may be influenced by hot pipe conditions from steam flow during the previous actuation.
For multiple SRV discharge conditions, the basic discharge line clearing phenomena are the same as for single SRV discharges. The loads on structures in the suppression pool, including the pool boundary, will be the result of combined effects of the SRV discharge at a number of locations in the suppression pool.
3B.2.2 Loss-of-Coolant Accidents
A spectrum of postulated loss-of-coolant-accidents (LOCAs) is considered to assess the design adequacy of the Lungmen NPS containment structure. Each accident condition is described in this section.
3B.2.2.1 Large Break Accident
Two types of large break accidents for the Lungmen NPS control the design: the feedwater line break and the main steamline break. In these transients, the upper drywell pressure increases as a result of the mass and energy release from the break, and a steam-air mixture is forced through the drywell connecting vents into the lower drywell. The pressure differential, between the upper and lower drywells, before the pressure is equalized, causes a loading condition on the vessel skirt. Additionally, the flow through the drywell connecting vents causes a drag loading on all structures in those vents.
Concurrent with the air-steam mixture being forced into the lower drywell, the water initially contained in the vent system is accelerated out of the horizontal vents into the suppression pool. During this vent-clearing process, the water exiting the vents will form submerged jets in the suppression pool which can produce loads on structures near the vent exits and on the suppression pool boundaries.
Immediately following the vent clearing, bubbles containing air and steam form at the vent exits. As the flow of air and steam/water from the drywell becomes established in the vent system, the initial bubbles at the vent exits expand with the bubble initial pressure nearly equal to the drywell pressure. The steam fraction of the flow into the pool will be condensed, but continued injection of drywell air and the resultant expansion of the air bubbles will produce a rapid rise of the suppression pool surface (termed as pool swell). The expanding bubble will cause loads on submerged structures and the suppression pool boundaries.
During the early stages of pool swell, a slug of water is accelerated upward by the expanding air bubbles. Structures and equipment close to the pool surface will experience impact loads as the rising pool surface hits the bottom surface of the structures. Along with these inertial loads, dissipative drag loads will develop as water flows past structures and equipment at elevations above the vent exit and below the maximum pool swell height. These rising and expanding bubbles eventually break through the water ligament and communicates with the wetwell airspace. Breakthrough occurs when the instabilities formed in the rising ligament causes the
3B-4 Containment Hydrodynamic Loads
Preliminary Safety Analysis Report
LUNGMEN UNITS 1 & 2
surface to become unstable and shatter. Froth will continue upward until decelerated to zero velocity by gravity. Because of increasing wetwell airspace pressure, froth would not reach the diaphragm floor, so a pool swell uplift load on the diaphragm floor not expected to occur.
Following the pool swell transient, a period of high steam flow rate through the vent system will commence. This is followed by a decreasing flow rate as the reactor vessel blowdown progresses, and the steam will be entirely condensed in the vent exit region.
The steam condensation process is influenced by the vent steam mass flow rate, the subcooling at the vent exit, and the vent flow air content fraction. At medium vent flow rates, the water-to-steam condensation interface will oscillate, causing pressure oscillations in the pool. This phenomenon, referred to as Òcondensation oscillation (CO)Ó, produces oscillatory and steady pressure loadings potentially severe enough to establish some of the containment design parameters. As the vessel blowdown continues, the vent flow rate will decrease and vent flow air content fraction will become negligibly small. At lower vent flow rates (below a threshold level), the steam bubbles at the vent exit alternately grow, and then nearly instantaneously collapse in a condensation process referred to as Òchugging (CH)Ó. This chugging process produces transient dynamic loading on the vents and suppression pool boundaries which must be considered in design evaluation of the containment system.
Shortly after a large break accident, which results in rapid depletion of vessel inventory, the Emergency Core Cooling System (ECCS) pumps will automatically start pumping water from condensate storage pool or suppression pool into the reactor pressure vessel (RPV) to flood the reactor core. Eventually water will cascade into the upper drywell from the pipe break. The time at which this occurs depends on the break size, type, and location. Because the drywell would be full of steam at the time of the vessel flooding, the sudden introduction of water from broken pipe into the drywell will cause condensation of the steam in the drywell and thus depressurization of the drywell. When the drywell pressure falls below the wetwell pressure, the wetwell-to-drywell vacuum breaker (WDVB) system will open vacuum breakers admitting air (noncondensables) from the wetwell airspace to the drywell. This depressurization of the drywell could cause upward loads on the diaphragm floor, whose magnitude would depend on the WDVB system characteristics, and the drywell and wetwell pressure histories. Eventually, a sufficient amount of air will return to equalize the drywell and wetwell pressures.
Following the vessel flooding and drywell-to-wetwell pressure equalization, suppression pool water will continuously recirculate through the reactor vessel via the ECCS pumps. The energy associated with the core decay heat will be absorbed by the circulating water and transferred to the suppression pool which will result in a gradual rise of the suppression pool temperature. Heat energy from the suppression pool is subsequently removed from the suppression pool by the residual heat removal (RHR) heat exchangers. The capacity of the RHR heat exchangers is such that the maximum suppression pool temperature, reached after several hours, remains below the allowable limit. The increase in pool temperature and the corresponding increase in
Containment Hydrodynamic Loads 3B-5
Preliminary Safety Analysis Report
LUNGMEN UNITS 1 & 2
wetwell airspace pressure due to pool-to-air space heat transfer process are considered in the design of the containment systems.
3B.2.2.2 Intermediate Break Accident (IBA)
The IBA is defined as a break size for which break flow does not result in rapid depressurization of the RPV. However, the reactor inventory loss is sufficiently rapid to cause a reduction in the reactor water level which may have potential for core uncovery. Since the Lungmen NPS design provides three high-pressure ECCSs, the vessel will be flooded without having to depressurize the reactor vessel.
The IBA will increase drywell pressure and temperature at a moderate rate, compared to that due to a large break accident. Water initially contained in the vent system will be accelerated from the horizontal vents. During the vent-clearing process, the water exiting the vents will form water jets in the suppression pool, which will cause loads on structures and equipment near the vent exits. The submerged structure loads from an IBA are expected to be less severe than those from a large break design basis accident (DBA). Structures and equipment designed for the DBA water jet loads can readily accommodate the less severe IBA water jet loads.
Immediately following vent water clearing, air and steam bubbles will form at the vent exits. The drywell pressurization rate for an IBA is less than a DBA. Consequently, the bubble pressure in the suppression pool is less severe and the moderate rate of drywell pressurization does not result in significant pool swell. The resulting IBA loads on pool boundaries, submerged structures, and equipment are bounded by the corresponding loads from a DBA.
A high drywell pressure signal scrams the reactor during the IBA. The sequence of events following the scram can lead to closure of the main steamline isolation valves (MSIVs) due to low reactor water level. The closure of the MSIVs can result in an increase in RPV pressure, which is relieved by opening of the SRVs. SRV discharge may continue intermittently to regulate reactor pressure and remove decay heat. Consequently, the suppression pool boundary may be subjected to a pressure loading resulting from the SRV discharge during IBA.
For IBAs, the steam flow rate through the vents may be insufficient to cause condensation oscillation loads as severe as those during a DBA. Following air carryover, however, chugging loads will be experienced until the reactor vessel blowdown is reduced to a flow rate which results in vent steam mass flux value to a point where chugging becomes insignificant. The subsequent long-term pool temperature transient is essentially the same as that described in earlier subsections for the DBA.
3B.2.2.3 Small Break Accident (SBA)
The SBA is defined as an event in which the fluid loss from the RPV is insufficient to either depressurization of the reactor or result in a substantial decrease of reactor water level. Following the break, the drywell pressure will slowly increase until the high drywell pressure
3B-6 Containment Hydrodynamic Loads
Preliminary Safety Analysis Report
LUNGMEN UNITS 1 & 2
scram setting is reached. The reactor will scram, but the MSIVs remain open, and close when water level drops low enough.
The drywell pressure will continue to increase at a rate dependent on the size of the postulated break. The pressure increase will depress the water level in the vent system until the water is expelled out and air and steam mixture from the drywell enters the suppression pool. The air flow rate will be such that the air will bubble through the pool without causing any appreciable pool swell. The steam will be condensed in the pool and the drywell air will rise and bubble through the pool into the wetwell airspace. The wetwell airspace will start pressurizing slowly at a rate dependent upon the air carryover rate, which, in turn, depends upon the pipe break size. Eventually, the steam and air flow through the vents will transfer essentially all the drywell air to the wetwell airspace. Following the air transfer, wetwell pressurization will increase at a rate dependent on the rate of increase of the suppression pool temperature.
The vent steam mass flux for an SBA is expected to be insufficient to produce steady condensation oscillation type loading conditions. However, there may be sufficient steam flow rate to cause chugging type of loading conditions, and this process of chugging type of loading conditions will continue.
Further, as a result of closure of MSIVs during this event, the reactor pressure will rise which, in turn, will actuate SRVs when vessel pressure reaches to their opening pressure setpoint value. Actuation of SRVs will result in lowering of the vessel pressure and the SRVs will close when the vessel pressure drops below their closing pressure setpoints. Upon closure of SRVs, vessel pressure will start rising again and result in reopening of SRVs, and SRVs will reclose when vessel pressure drops below their closing pressure setpoints. With no other interruption, this process SRV cycling will continues. However, when the temperature of the suppression pool reaches the Technical Specification limit of 48.9
°
C, the operator will take action to begin a controlled depressurization of the reactor vessel (at around 56
°
C/h), using manual operation of the SRVs. The reactor vessel is depressurized low enough to initiate flooding of the vessel by injecting water from low pressure ECCS pumps. The continued flooding of the reactor vessel will stop at any further pressurization of the reactor vessel and this will result in termination of the SBA event. The subsequent long-term pool temperature transient is essentially the same as that for large and intermediate break accidents.
3B.3 Safety Relief Valve Discharge Loads
During the actuation of a safety relief valve, the air initially contained inside the SRV discharge line is compressed and subsequently expelled into the suppression pool by the SRV blowdown steam entering the SRV discharge line. The air exits through holes drilled into an X-quencher device which is attached to the SRV discharge line. The X-quencher discharge device is utilized in the Lungmen NPS design to promote effective heat transfer and stable condensation of discharged steam in the suppression pool.
Containment Hydrodynamic Loads 3B-7
Preliminary Safety Analysis Report
LUNGMEN UNITS 1 & 2
3B.3.1 Quencher Description and Arrangement
The X-quencher discharge device used in the Lungmen NPS design is the same as that used in Mark III and Mark II designs. Reference 3B-1 contains a detailed description of design configuration features of the X-quencher discharge device. This discharge device (Figure 3B-2), is a diffuser device comprised of a short conical extension of the vertical terminus of the SRV discharge line and a capped cylindrical central section or plenum, from which four perforated, capped arms extend. The X-quencher, with four arms and many small holes in each arm, directs the air and steam over a broad area. Experimental data (References 3B-2 and 3B-3) have demonstrated the X-quencher characteristics of low air-clearing pressure loadings and no instability in the steam condensation process.
Figure 3B-3 shows the quencher azimuthal locations in the suppression pool. This arrangement distributes low, intermediate and high pressure-setpoint valves uniformly around the pool to preclude concurrent adjacent valves operation.
3B.3.2 Quencher Discharge Loads
3B.3.2.1 Load Definition Methodology
After the air exits into the suppression pool, during the actuation of SRV, the air bubbles coalesce and oscillate as Rayleigh bubbles while rising to the pool free surface. The oscillating air bubbles produce hydrodynamic loads on the pool boundary and drag loads on structures submerged in the pool. After the air has been expelled, steam exits and condenses in the pool. The condensing steam produces negligible (pressure) amplitude loads on the pool boundary, as observed from X-quencher discharge testing.
The methodology for defining the quencher discharge loads (due to initial and subsequent SRV actuations) on the pool boundary for the ABWR containment will be consistent with previously approved methodology for Mark II and Mark III containment designs (NUREG-0802). Reference 3B-4 provides a detailed description of the calculational methodology. This methodology is based directly on empirical correlations obtained from mini-scale, small-scale, and large-scale (including inplant tests) tests conducted to develop a load definition methodology for X-quencher discharge loads during the SRV actuation events.
The X-quencher test data were statistically correlated to calculate the magnitude of quencher air clearing pressure loads on pool boundary as a function of several key parameters. The correlation was developed for use in both Mark II and Mark III containment systems using X-quencher discharge devices for the SRV discharge lines. Detailed descriptions of (1) the database, (2) a quantitative assessment of the test data in terms of the physical phenomena, (3) the procedure for identification and justification of key parameters used in the statistical correlations, (4) the statistical analysis of the data, and the resulting correlation equations, are provided in Section A12 of Reference 3B-1.
3B-8 Containment Hydrodynamic Loads
Preliminary Safety Analysis Report
LUNGMEN UNITS 1 & 2
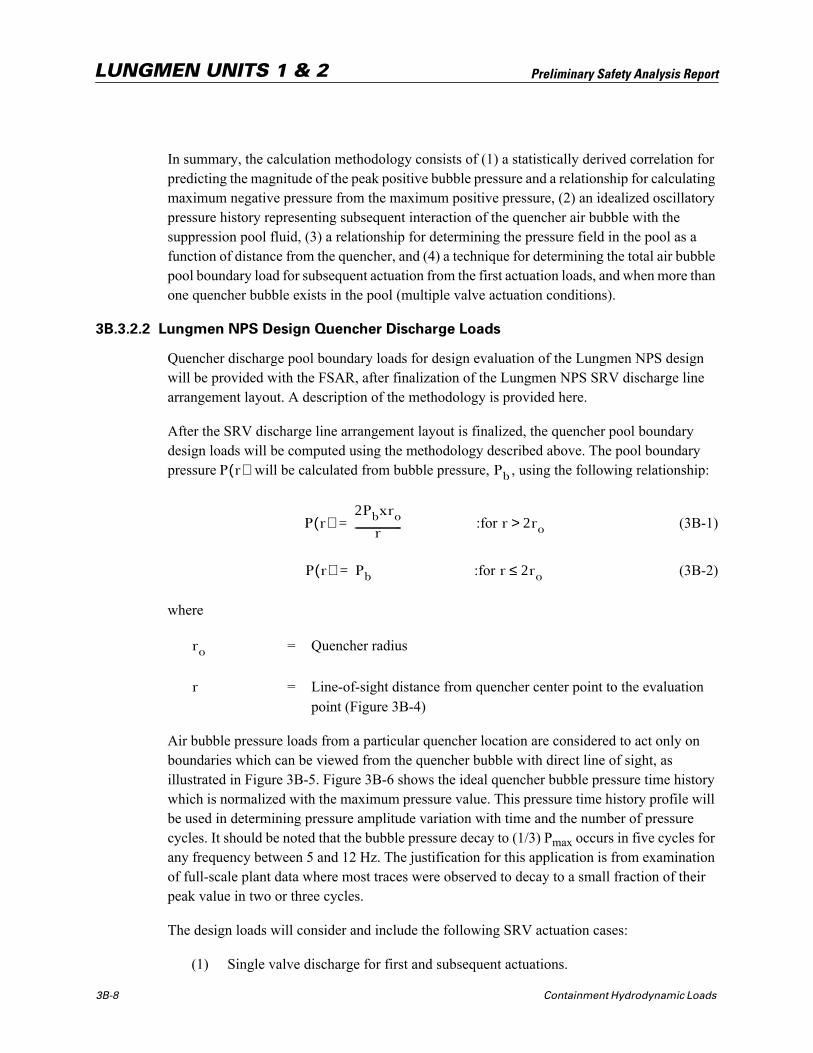
In summary, the calculation methodology consists of (1) a statistically derived correlation for predicting the magnitude of the peak positive bubble pressure and a relationship for calculating maximum negative pressure from the maximum positive pressure, (2) an idealized oscillatory pressure history representing subsequent interaction of the quencher air bubble with the suppression pool fluid, (3) a relationship for determining the pressure field in the pool as a function of distance from the quencher, and (4) a technique for determining the total air bubble pool boundary load for subsequent actuation from the first actuation loads, and when more than one quencher bubble exists in the pool (multiple valve actuation conditions).
3B.3.2.2 Lungmen NPS Design Quencher Discharge Loads
Quencher discharge pool boundary loads for design evaluation of the Lungmen NPS design will be provided with the FSAR, after finalization of the Lungmen NPS SRV discharge line arrangement layout. A description of the methodology is provided here.
After the SRV discharge line arrangement layout is finalized, the quencher pool boundary design loads will be computed using the methodology described above. The pool boundary pressure will be calculated from bubble pressure, , using the following relationship:
:for (3B-1)
:for (3B-2)
where
= Quencher radius
= Line-of-sight distance from quencher center point to the evaluation point (Figure 3B-4)
Air bubble pressure loads from a particular quencher location are considered to act only on boundaries which can be viewed from the quencher bubble with direct line of sight, as illustrated in Figure 3B-5. Figure 3B-6 shows the ideal quencher bubble pressure time history which is normalized with the maximum pressure value. This pressure time history profile will be used in determining pressure amplitude variation with time and the number of pressure cycles. It should be noted that the bubble pressure decay to (1/3) P
max
occurs in five cycles for any frequency between 5 and 12 Hz. The justification for this application is from examination of full-scale plant data where most traces were observed to decay to a small fraction of their peak value in two or three cycles.
The design loads will consider and include the following SRV actuation cases:
(1) Single valve discharge for first and subsequent actuations.
P r( ) Pb
P r( )2Pbxro
r--------------------------= r 2ro>
P r( ) Pb= r 2ro≤
ro
r
Containment Hydrodynamic Loads 3B-9
Preliminary Safety Analysis Report
LUNGMEN UNITS 1 & 2
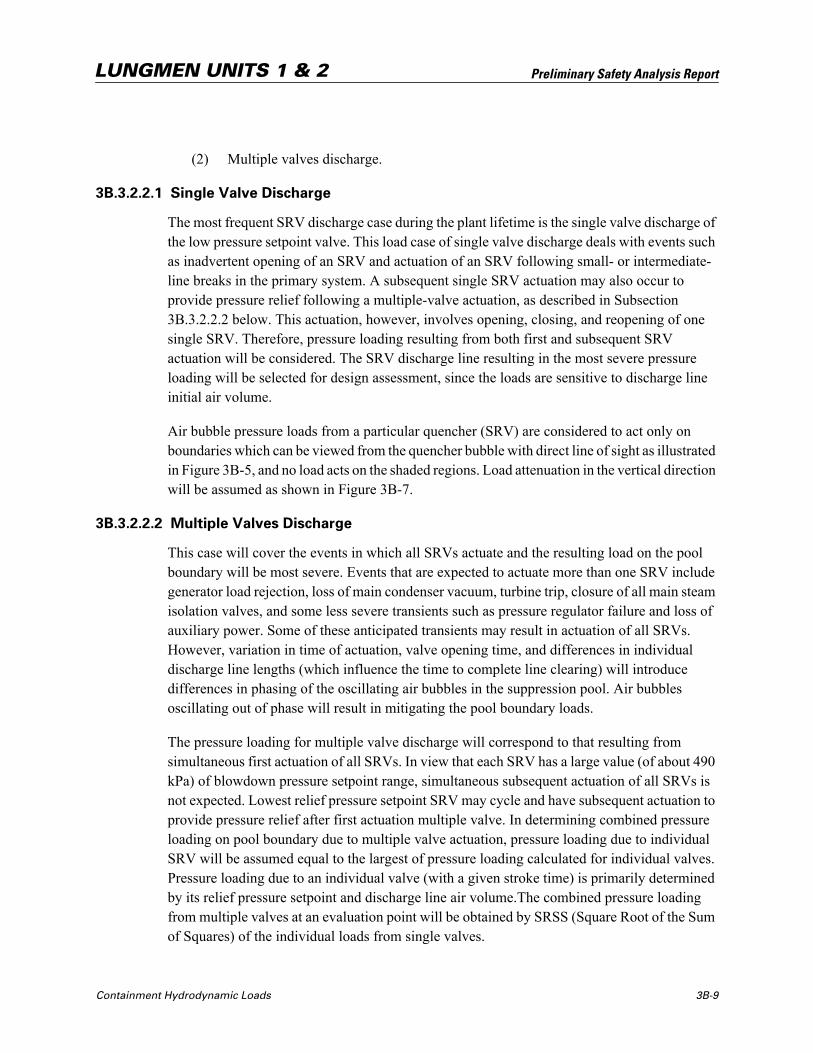
(2) Multiple valves discharge.
3B.3.2.2.1 Single Valve Discharge
The most frequent SRV discharge case during the plant lifetime is the single valve discharge of the low pressure setpoint valve. This load case of single valve discharge deals with events such as inadvertent opening of an SRV and actuation of an SRV following small- or intermediate-line breaks in the primary system. A subsequent single SRV actuation may also occur to provide pressure relief following a multiple-valve actuation, as described in Subsection 3B.3.2.2.2 below. This actuation, however, involves opening, closing, and reopening of one single SRV. Therefore, pressure loading resulting from both first and subsequent SRV actuation will be considered. The SRV discharge line resulting in the most severe pressure loading will be selected for design assessment, since the loads are sensitive to discharge line initial air volume.
Air bubble pressure loads from a particular quencher (SRV) are considered to act only on boundaries which can be viewed from the quencher bubble with direct line of sight as illustrated in Figure 3B-5, and no load acts on the shaded regions. Load attenuation in the vertical direction will be assumed as shown in Figure 3B-7.
3B.3.2.2.2 Multiple Valves Discharge
This case will cover the events in which all SRVs actuate and the resulting load on the pool boundary will be most severe. Events that are expected to actuate more than one SRV include generator load rejection, loss of main condenser vacuum, turbine trip, closure of all main steam isolation valves, and some less severe transients such as pressure regulator failure and loss of auxiliary power. Some of these anticipated transients may result in actuation of all SRVs. However, variation in time of actuation, valve opening time, and differences in individual discharge line lengths (which influence the time to complete line clearing) will introduce differences in phasing of the oscillating air bubbles in the suppression pool. Air bubbles oscillating out of phase will result in mitigating the pool boundary loads.
The pressure loading for multiple valve discharge will correspond to that resulting from simultaneous first actuation of all SRVs. In view that each SRV has a large value (of about 490 kPa) of blowdown pressure setpoint range, simultaneous subsequent actuation of all SRVs is not expected. Lowest relief pressure setpoint SRV may cycle and have subsequent actuation to provide pressure relief after first actuation multiple valve. In determining combined pressure loading on pool boundary due to multiple valve actuation, pressure loading due to individual SRV will be assumed equal to the largest of pressure loading calculated for individual valves. Pressure loading due to an individual valve (with a given stroke time) is primarily determined by its relief pressure setpoint and discharge line air volume.The combined pressure loading from multiple valves at an evaluation point will be obtained by SRSS (Square Root of the Sum of Squares) of the individual loads from single valves.
3B-10 Containment Hydrodynamic Loads
Preliminary Safety Analysis Report
LUNGMEN UNITS 1 & 2
As a bounding and conservative approach for structural evaluation, the multiple valves discharge case will consider and include most severe symmetric and asymmetric load cases. The most severe symmetric load case will assume oscillating air bubbles (from all valves) in phase, and the most severe asymmetric load case will assume one half of oscillating air bubbles 180
°
out of phase with the other half of oscillating air bubbles. These two load cases will bound all combinations of multiple valve actuation cases.
3B.3.3 Quencher Condensation Performance
After air discharge through the SRV line is completed, steady steam flow from the quencher will be established. Discharged steam condenses in the immediate vicinity of the discharge device. Thermal loads associated with steam jet contact on structures submerged in the pool can generally be avoided by appropriate orientation of the discharge device in the suppression pool.
Operating practice of early BWRs, in anticipation that extended SRV steady steam blowdown will heat the pool to a level where the condensation process may become unstable, a temperature limit for BWR suppression pools was established. This pool temperature limit, specified in NUREG-0783, was established because of concern that unstable steam condensation at high pool temperature could result in high loads on containment structure. Although quencher discharge devices (like the X-quencher) were found to produce smooth steam condensation process, at the time the pool temperature limit was established there were insufficient data available to confirm that quenchers were effective in mitigating loads due to unstable steam condensation process. NUREG-0783 currently specifies acceptance criteria related to the suppression pool temperature limits for steady state steam condensation condition for the quencher discharge devices.
Recent studies, subsequent to the issuance of NUREG-0783, conclude that steady steam flow through quencher devices (like the X-quencher) is expected to be a stable and smooth condensation process over the full range of pool temperature up to saturation. It is also concluded that the steam condensation loads from X-quencher are less than the loads from equivalent straight pipes. These recent studies are described and discussed in Reference 3B-5.
Subsequent to the studies reported in Reference 3B-5, there were additional test data from quencher discharge tests at high pool temperatures. These tests, reported in Reference 3B-15, showed a long, steady, turbulent, forced plume which consisted of a random two-phase mixture of entrained water and steam bubbles. This additional data, which showed formation of a long continuous steam plume at high pool temperatures, raised an additional concern. It was postulated that large continuous steam plumes may give rise to large bubbles that drift into a cooler region of the pool and suddenly collapse which could transmit significant loads to the pool boundary.
This additional concern was evaluated in a recent study, and it was determined that the continuous plume was not a transient flow shedding large coherent bubbles which might drift away and collapse in a cooler region of the pool. This recent study, described in detail in
Containment Hydrodynamic Loads 3B-11
Preliminary Safety Analysis Report
LUNGMEN UNITS 1 & 2
Reference 3B-16, concludes that the condensation process with SRV dischargers through quenchers (like the X-quencher) into the suppression pool would result in low amplitude loads for all suppression pool temperature.
In view of findings and conclusions from these recent studies discussed above, it is concluded that suppression pool temperature limits (specified in NUREG-0783) for SRV discharge with X-quenchers are no longer necessary. Therefore, given that the Lungmen NPS design utilizes X-quencher discharge devices, the pool temperature limit specified in NUREG-0783 are no longer applicable to Lungmen NPS. However, as an added margin, Lungmen NPS design retains the restrictions on the allowable operating temperature envelope of the suppression pool, similar to those in place for operating BWRs.
Further, the studies in Reference 3B-5 conclude that steam condensation loads with X-quenchers over the full range of pool temperature up to saturation condition are low compared to loads due to SRV discharge line air clearing and LOCA events. Therefore, considering that Lungmen NPS design considers SRV air clearing and LOCA steam condensation loads for containment design evaluation, dynamic loads during the X-quencher steady steam condensation process will not be defined and considered for containment design evaluation.
3B.4 Loss-of-Coolant Accident Loads
In this section, methodologies for calculating the dynamic loading conditions associated with the various LOCA phenomena are presented.
3B.4.1 Pressure and Temperature Transients
A LOCA causes a pressure and temperature transient in the drywell and wetwell due to mass and energy released to the drywell. The severity of this transient loading condition depends upon the type and size of LOCA. Section 6.2 provides pressure and temperature transient data in the drywell and wetwell for the most severe LOCA case [design basis accident(DBA)]. This transient data establish the structural loading conditions in the containment.
3B.4.2 Vent Clearing and Pool Swell Loads Methodology
Following a postulated DBA, the drywell pressurizes and the water initially contained in the vents is expelled out into the suppression pool. The water forms jets in the suppression pool which induce loads on structures near the vent exits. After the water is cleared from the vents, the air in the vents and the drywell flows into the suppression pool. Air bubbles form at the vent exits and expand to local pressure condition, and produce pressure loading on the suppression pool boundary and drag loads on structures initially submerged in the pool. The expansion of the air bubble forces the slug of water above the bubbles to accelerate upward (defined as pool swell phenomena), which causes both impact and drag loads on structures within the swell zone. Upon reaching the maximum swell height, the air bubbles that drive the water slug penetrates through the surface, resulting in bubble breakthrough leading to froth formation. This froth will impact structures located above the maximum bulk swell height. The froth
3B-12 Containment Hydrodynamic Loads
Preliminary Safety Analysis Report
LUNGMEN UNITS 1 & 2
created after breakthrough experiences gravity-induced phase separation and will fallback toward the pool bottom. During this fallback, structures will be subjected to fallback drag loads.
Consistent with the load definition methodology for Mark I, II and III containments, sonic and compression wave loadings, occurring immediately following the postulated instantaneous rupture of a large primary system pipe, will not be considered and defined for design evaluation of the containment structure. It was concluded that these waves would result in a negligible structural response.
3B.4.2.1 Pool Boundary Loads
Following a postulated LOCA and after the water is cleared from the vents, air/steam mixture from the drywell flows into the suppression pool creating a large bubble at vent exit as it exits into the pool. The bubble at vent exit expands to suppression pool hydrostatic pressure, as the air/steam mixture flow continues from the pressurized drywell. Water ligament above the expanding bubble is accelerated upward by the difference between the bubble pressure and the air space pressure above the pool. This acceleration of water ligament gives rise to pool swell phenomena, which, typically, lasts for a couple of seconds.
During this pool swell phase, wetwell region is subjected to the hydrodynamic loading conditions, and they are:
■
Loads on suppression pool boundary and drag loads on structures initially submerged in the pool, due to the pressurized and expanding bubble at vent exit
■
Loads on wetwell airspace boundary (including the diaphragm floor), due to rising pool which compresses the wetwell air space
■
Impact and drag loads on structures located above the initial pool surface, due to the rising pool surface
From a structural design standpoint, the most important aspects of the pool swell phenomena are peak pool swell height and peak pool swell velocity. The former determines a region of impact/drag loading condition, whereas the latter determines severity of the loading condition.
Lungmen NPS Pool Swell Loads
The pool swell response calculations to quantify pool swell loads were based on a simplified, one dimensional analytical model, same as that reviewed and accepted by the USNRC (NEDE-21544P/NUREG-0808) for application to Mark II plants. This analytical model was qualified against Mark II full-scale test data. The Lungmen NPS design utilizes a confined wetwell airspace similar to that in Mark II design, but its vent system design is quite different than that in Mark II design. The Lungmen NPS vent system design utilizes horizontal vents similar to that in Mark III design. Therefore, recognizing this difference in vent system design, additional studies comparing the analytical model against Mark III horizontal vent test data were performed to assure adequacy of the model for application to Lungmen NPS.
Containment Hydrodynamic Loads 3B-13
Preliminary Safety Analysis Report
LUNGMEN UNITS 1 & 2
Model Vs. Mark III Horizontal Vent Test Data
Model input/ assumptions used in predicting Mark III test data for model comparison were the same as prescribed in NEDE-21544P. Mark III horizontal vent system features were modeled in the following manner:
■
Pool swell water slug was approximated by a consistent thickness equal to top vent submergence
■
Drywell pressure transient and vent clearing times input based on test data
■
Vent flow area increased in order with the clearing of middle and bottom vents
Test data used for model comparison were taken from full-scale and sub-scale tests, and they are listed in Table 3B-8.
Comparison results, summarized in Table 3B-9 and sample results shown graphically in Figures 3B-9 and 3B-10, demonstrate that the analytical model over predicts the horizontal vent test data. These comparison results demonstrate and assure adequacy of the analytical model for calculating Lungmen NPS pool swell response.
Pool Swell Loads
Pool swell response calculations were done using the analytical model described above. Reference 3B-14 provides a detailed description of the model. The modeling scheme for calculations was consistent with that used for model vs. test data comparison. For an added conservatism in model predictions, water slug surface area occupied by the air bubble was taken as 80% of the total pool surface area in pool swell response calculations.
In modeling and simulating the pool swell phenomenon, the following assumptions were made:
(1) Noncondensable gases are assumed to behave as an ideal gas.
(2) After the vent clearing, only noncondensable gases flow through the vent system.
(3) The flow rate of noncondensable gases through the vent system is calculated assuming one-dimensional flow under adiabatic conditions and considering the pipe friction effects.
(4) The noncondensable gases contained initially in the drywell are compressed isentropically.
(5) The temperature of bubbles (noncondensable gas) in the pool is taken to be the same as that of the noncondensable gases in the drywell (from (4)).
(6) After the vent clearing, pool water of constant thickness above the top horizontal vent outlet is accelerated upward.
3B-14 Containment Hydrodynamic Loads
Preliminary Safety Analysis Report
LUNGMEN UNITS 1 & 2
(7) Friction between pool water and the pool boundary and fluid viscosity are neglected.
(8) Noncondensable gases present in the wetwell airspace are assumed to undergo a polytropic compression process during the pool swell phase.
(9) For conservative estimates, a polytropic index of 1.2 will be used for computing the pool swell height and pool swell velocity, and an index of 1.4 for computing pressurization of the wetwell airspace.
*
(10) For added conservatism, pool swell velocity obtained in (9) above will be multiplied uniformly by a factor of 1.1 in defining impact/drag loads.
*
The calculated pool swell loading conditions for the Lungmen NPS containment system obtained from the analytical model (identified above) and the above modeling assumptions are shown in Table 3B-1. Pool boundary pressure distribution is shown in Figure 3B-11.
Figure 3B-13 shows types of loading regions for structures located above the initial pool surface during the pool swell phase of LOCA. Key structures that will be subjected to these loads are: SRV discharge piping; catwalk structure; wetwell-to-drywell vacuum breakers.
Structures located between 0 and 7.6m above the initial surface will be subjected to impact load by an intact water ligament, where the 7.6m value corresponds to the calculated maximum pool swell height. The load calculation methodology will be based on that approved for Mark II and Mark III containments (NUREG-0487 and NUREG-0978).
Structures located at elevations between 7.6m and 10.9m will be subjected to froth impact loading. This is based on the assumption that bubble breakthrough (i.e., where the air bubbles penetrate the rising pool surface) occurs at 7.6m height, and the resulting froth swells to a height of 3.3m. This froth swell height is the same as that defined for Mark III containment design, and this is considered to be a conservative value for the Lungmen NPS containment design. Because of substantially smaller wetwell gas space volume (about 1/5th of the Mark III design), the Lungmen NPS containment is expected to experience a froth swell height substantially lower than that in Mark III design. The wetwell gas space is compressed by the rising liquid slug during pool swell, and the resulting increase in the wetwell gas space pressure will decelerate the liquid slug before the bubble break-through process begins. The load calculation methodology for defining such loads will be based on USNRC approved methodology in NUREG-0978.
As shown in Figure 3B-13 the gas space above the 10.9m elevation will be exposed to spray condition which is expected to induce no significant loads on structures in that region.
* Consistent with NUREG-0808 guidelines.
Containment Hydrodynamic Loads 3B-15
Preliminary Safety Analysis Report
LUNGMEN UNITS 1 & 2
As drywell air flow through the horizontal vent system decreases and the air/water suppression pool mixture experiences gravity-induced phase separation, pool upward movement stops and the ÒfallbackÓ process starts. During this process, structures between the bottom vent and the 10.9m elevation can experience loads as the mixture of air and water fall past the structure. The load calculation methodology for the defining such loads will be based on the USNRC approved methodology in NUREG-0978.
3B.4.2.2 Loads on Access Tunnel
The Lungmen NPS design provides two access tunnels through the wetwell for access from the reactor building to the lower drywell. These tunnels provide access for personnel and equipment, and the bottom of these two tunnels is partially submerged when suppression pool water is at its nominal level position. During pool swell, the access tunnel will be subjected to drag load only. Because of their initial partial submergence, the tunnels are not expected to experience any impact load due to pool swell.
The drag load imposed on the access tunnel due to pool swell will be calculated by the following equation:
(3B-3)
where
= Drag pressure load
= Drag coefficient
= Maximum pool swell velocity
= Density of water
= Conversion constant
The drag coefficient, , will be determined from Figure 3B-14. The maximum velocity, in the above equation will be 1.1 times the maximum vertical velocity calculated from the pool swell analytical model.
The pressure loading due to air bubble pressure will be calculated and added to the drag load. This pressure loading will consider and account for the wetwell airspace pressure as shown below:
(3B-4)
Pd 1 2⁄( )CdρVMax
2
gc-------------------=
Pd
Cd
VMax
ρ
gc
Cd VMax
Pb PB Pw w⁄–=
3B-16 Containment Hydrodynamic Loads
Preliminary Safety Analysis Report
LUNGMEN UNITS 1 & 2
where
= Net pressure loading due to air bubble pressure
= Air bubble pressure
= Wetwell airspace pressure
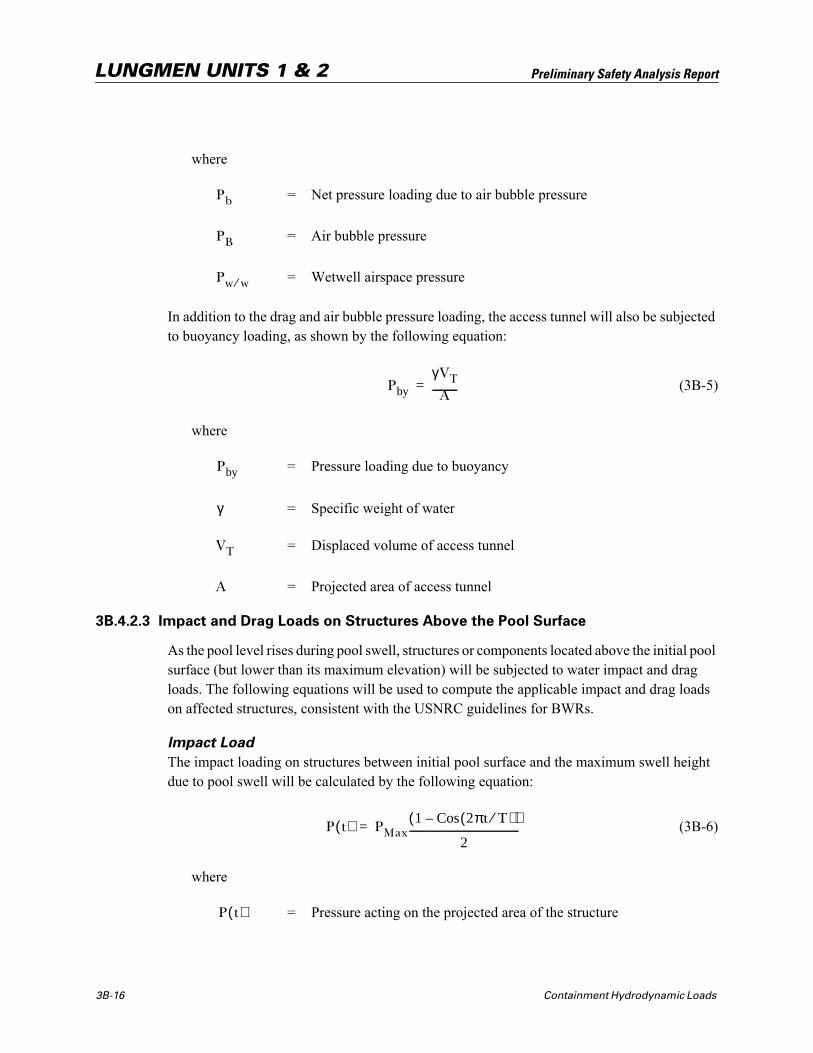
In addition to the drag and air bubble pressure loading, the access tunnel will also be subjected to buoyancy loading, as shown by the following equation:
(3B-5)
where
= Pressure loading due to buoyancy
= Specific weight of water
= Displaced volume of access tunnel
= Projected area of access tunnel
3B.4.2.3 Impact and Drag Loads on Structures Above the Pool Surface
As the pool level rises during pool swell, structures or components located above the initial pool surface (but lower than its maximum elevation) will be subjected to water impact and drag loads. The following equations will be used to compute the applicable impact and drag loads on affected structures, consistent with the USNRC guidelines for BWRs.
Impact Load
The impact loading on structures between initial pool surface and the maximum swell height due to pool swell will be calculated by the following equation:
(3B-6)
where
= Pressure acting on the projected area of the structure
Pb
PB
Pw w⁄
Pby
γVTA--------------=
Pby
γ
VT
A
P t( ) PMax1 Cos 2πt T⁄( )–( )
2--------------------------------------------------------------=
P t( )
Containment Hydrodynamic Loads 3B-17
Preliminary Safety Analysis ReportLUNGMEN UNITS 1 & 2
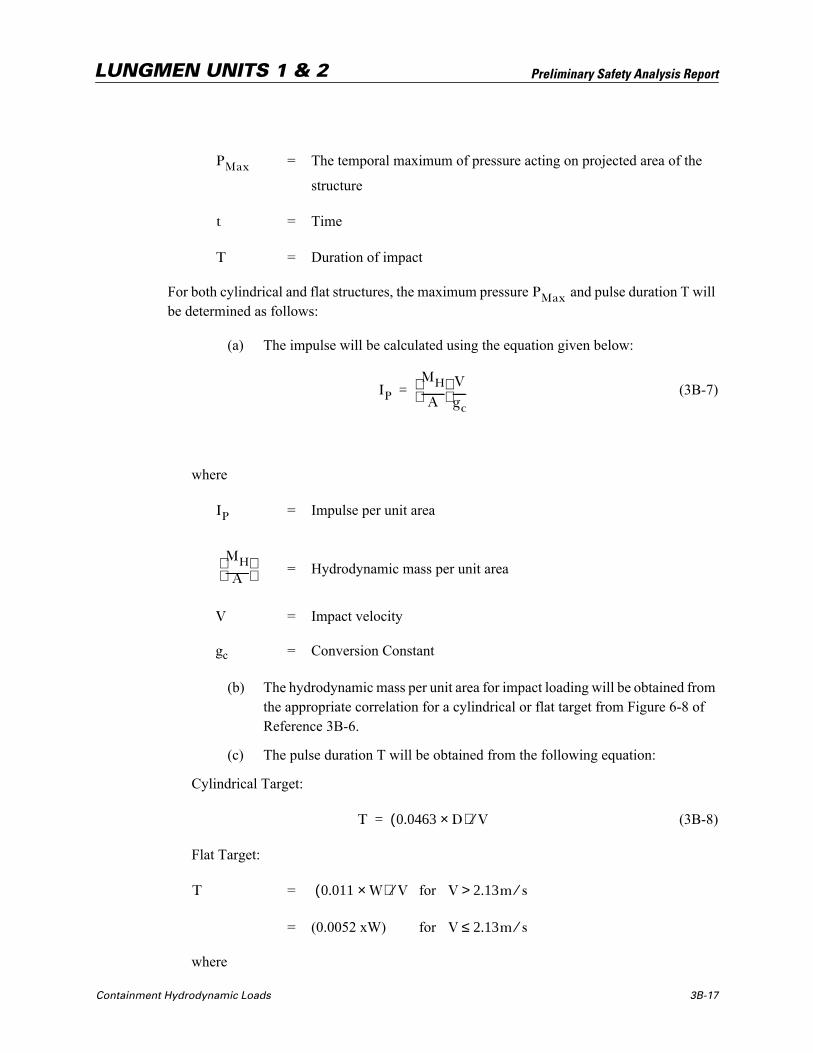
= The temporal maximum of pressure acting on projected area of the
structure
= Time
= Duration of impact
For both cylindrical and flat structures, the maximum pressure and pulse duration T will be determined as follows:
(a) The impulse will be calculated using the equation given below:
(3B-7)
where
= Impulse per unit area
= Hydrodynamic mass per unit area
= Impact velocity
gc = Conversion Constant
(b) The hydrodynamic mass per unit area for impact loading will be obtained from the appropriate correlation for a cylindrical or flat target from Figure 6-8 of Reference 3B-6.
(c) The pulse duration T will be obtained from the following equation:
Cylindrical Target:
(3B-8)
Flat Target:
= for
= (0.0052 xW) for
where
PMax
t
T
PMax
IP
MH
A-------------
Vgc-------=
IP
MHA-------------
V
T 0.0463 D×( ) V⁄=
T 0.011 W×( ) V⁄ V 2.13m s⁄>
V 2.13m s⁄≤
3B-18 Containment Hydrodynamic Loads
Preliminary Safety Analysis ReportLUNGMEN UNITS 1 & 2
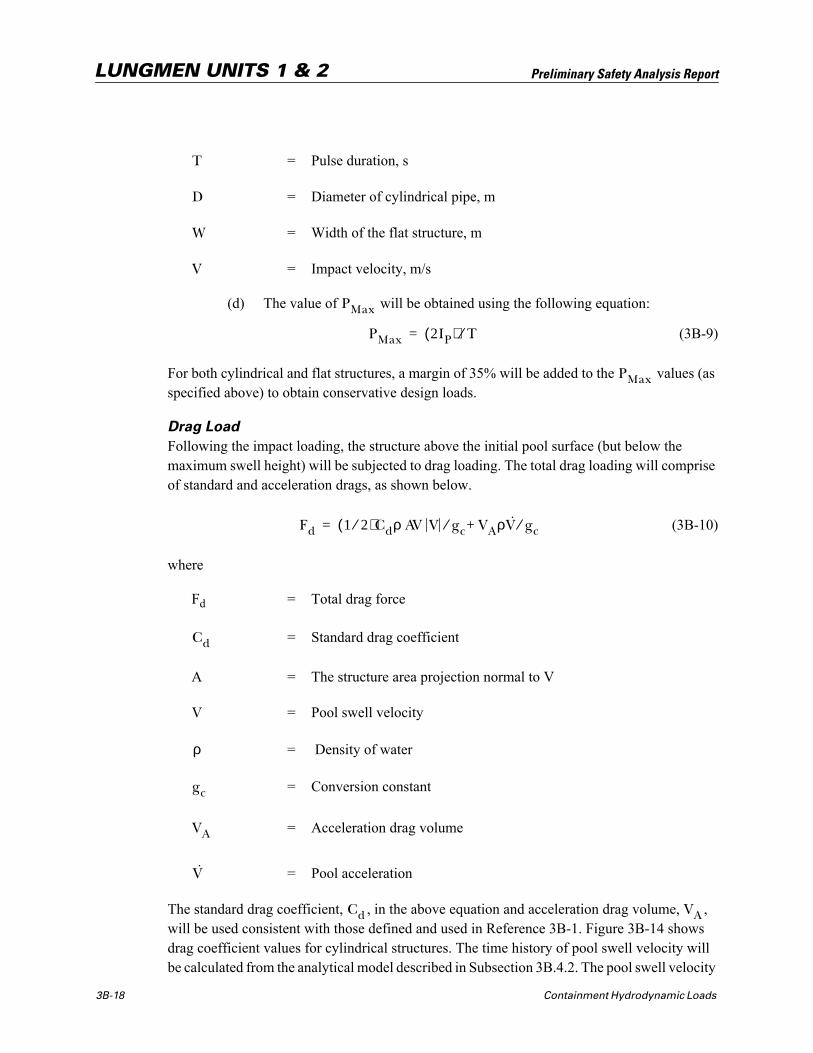
= Pulse duration, s
= Diameter of cylindrical pipe, m
= Width of the flat structure, m
= Impact velocity, m/s
(d) The value of will be obtained using the following equation:
(3B-9)
For both cylindrical and flat structures, a margin of 35% will be added to the values (as specified above) to obtain conservative design loads.
Drag Load
Following the impact loading, the structure above the initial pool surface (but below the maximum swell height) will be subjected to drag loading. The total drag loading will comprise of standard and acceleration drags, as shown below.
(3B-10)
where
Fd = Total drag force
= Standard drag coefficient
A = The structure area projection normal to V
= Pool swell velocity
= Density of water
= Conversion constant
= Acceleration drag volume
= Pool acceleration
The standard drag coefficient, , in the above equation and acceleration drag volume, , will be used consistent with those defined and used in Reference 3B-1. Figure 3B-14 shows drag coefficient values for cylindrical structures. The time history of pool swell velocity will be calculated from the analytical model described in Subsection 3B.4.2. The pool swell velocity
T
D
W
V
PMax
PMax 2IP( ) T⁄=
PMax
Fd 1 2⁄( )Cdρ AV V gc⁄ VAρV̇ gc⁄+=
Cd
V
ρ
gc
VA
V̇
Cd VA
Containment Hydrodynamic Loads 3B-19
Preliminary Safety Analysis ReportLUNGMEN UNITS 1 & 2
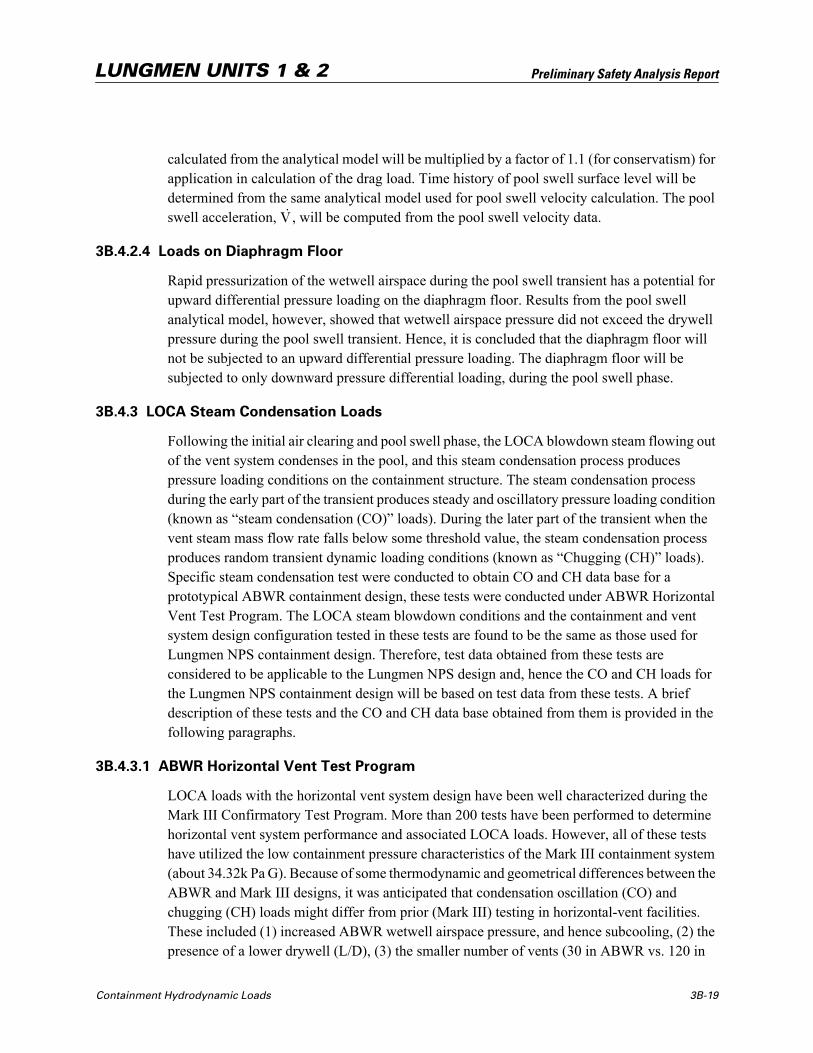
calculated from the analytical model will be multiplied by a factor of 1.1 (for conservatism) for application in calculation of the drag load. Time history of pool swell surface level will be determined from the same analytical model used for pool swell velocity calculation. The pool swell acceleration, , will be computed from the pool swell velocity data.
3B.4.2.4 Loads on Diaphragm Floor
Rapid pressurization of the wetwell airspace during the pool swell transient has a potential for upward differential pressure loading on the diaphragm floor. Results from the pool swell analytical model, however, showed that wetwell airspace pressure did not exceed the drywell pressure during the pool swell transient. Hence, it is concluded that the diaphragm floor will not be subjected to an upward differential pressure loading. The diaphragm floor will be subjected to only downward pressure differential loading, during the pool swell phase.
3B.4.3 LOCA Steam Condensation Loads
Following the initial air clearing and pool swell phase, the LOCA blowdown steam flowing out of the vent system condenses in the pool, and this steam condensation process produces pressure loading conditions on the containment structure. The steam condensation process during the early part of the transient produces steady and oscillatory pressure loading condition (known as Òsteam condensation (CO)Ó loads). During the later part of the transient when the vent steam mass flow rate falls below some threshold value, the steam condensation process produces random transient dynamic loading conditions (known as ÒChugging (CH)Ó loads). Specific steam condensation test were conducted to obtain CO and CH data base for a prototypical ABWR containment design, these tests were conducted under ABWR Horizontal Vent Test Program. The LOCA steam blowdown conditions and the containment and vent system design configuration tested in these tests are found to be the same as those used for Lungmen NPS containment design. Therefore, test data obtained from these tests are considered to be applicable to the Lungmen NPS design and, hence the CO and CH loads for the Lungmen NPS containment design will be based on test data from these tests. A brief description of these tests and the CO and CH data base obtained from them is provided in the following paragraphs.
3B.4.3.1 ABWR Horizontal Vent Test Program
LOCA loads with the horizontal vent system design have been well characterized during the Mark III Confirmatory Test Program. More than 200 tests have been performed to determine horizontal vent system performance and associated LOCA loads. However, all of these tests have utilized the low containment pressure characteristics of the Mark III containment system (about 34.32k Pa G). Because of some thermodynamic and geometrical differences between the ABWR and Mark III designs, it was anticipated that condensation oscillation (CO) and chugging (CH) loads might differ from prior (Mark III) testing in horizontal-vent facilities. These included (1) increased ABWR wetwell airspace pressure, and hence subcooling, (2) the presence of a lower drywell (L/D), (3) the smaller number of vents (30 in ABWR vs. 120 in
V̇
3B-20 Containment Hydrodynamic Loads
Preliminary Safety Analysis ReportLUNGMEN UNITS 1 & 2
Mark III), (4) extension of the vents in the pool, (5) vent submergence, and (6) suppression pool width.
Considering the existence of the above thermodynamic and geometrical differences, a test program was conducted to confirm the CO and CH loads which would occur in the event of a LOCA in an ABWR plant. The test program, test data, and interpretation of test data are documented in Reference 3B-7.
The test program consisted of 24 simulated blowdowns (Table 3B-2) in test facilities representing the horizontal-vent ABWR design. The tests were divided into two parts utilizing sub-scale (SS) and partial full-scale (FS*) test facilities shown in Figures 3B-15 and 3B-16, respectively. Figures 3B-17 and 3B-18 show test sensors common to FS* and SS tests, and unique to FS* and SS tests, respectively.
The SS facility had all linear dimensions reduced by a factor of 2.5 from prototypical dimensions. Thirteen SS tests were performed primarily for the purpose of obtaining CO data. A full-scale vertical and horizontal-vent configuration was installed for the FS* tests. The upper drywell (U/D) was enlarged but not to prototypical dimensions. Eleven FS* tests were performed primarily for the purpose of obtaining CH data. The test matrix for the 24 blowdowns (Table 3B-2) included variations in pool temperature, break size, wetwell backpressure, and type of break (steam or liquid). The test facilities were equipped adequately with the data sensors to obtain necessary data for understanding the phenomena and establishing a database for defining CO and CH loads for the ABWR containment. In addition to the geometrical considerations, the facility was designed to minimize the potential for fluid-structure interaction (FSI). Measurements were taken at seven locations on the wetted suppression pool boundary to record dynamic pressure oscillations. Structural instrumentation (strain gauges and accelerometers on the basemat, pedestal, and containment walls) was used to confirm that FSI effects were minimal. Pressure transducers in the vertical and horizontal vents recorded dynamic loads on the vent system.
Loads due to condensation oscillation and chugging are described and discussed in Subsections 3B.4.3.2 and 3B.4.3.3, respectively.
3B.4.3.2 Condensation Oscillation (CO) Loads
The condensation oscillation (CO) period of a postulated LOCA follows the pool swell transient. During the CO period, both the vent steam mass flux and vent air content are decreasing. The steam-water interface at the vent exit oscillates as the steam is condensed. The vent steam mass flux is sufficient to prevent water from flowing into the vent. The steam condensation process at the vent exit induces pressure loads on the containment system, including the suppression pool boundaries and structures submerged in the suppression pool.
3B.4.3.2.1 Description of CO Database
A detailed description, evaluation, and discussion of CO data are given in Reference 3B-7.
Containment Hydrodynamic Loads 3B-21
Preliminary Safety Analysis ReportLUNGMEN UNITS 1 & 2
The test program consisted of a total of 13 simulated blowdowns in sub-scaled test facility representing a one-cell (360°) sector of the horizontal vent design, which included a signal vertical/horizontal vent module. The subscaled (SS) test facility was geometrically (all liner dimensions scaled by a factor of 2.5) similar to the prototypical design, and the single vertical/horizontal vent module included all three horizontal vents. In these tests, full-scale thermodynamic conditions were employed. This approach is based on the belief that condensation phenomena at the vent exit are mainly governed by the thermodynamic properties of the liquid and vapor phases. In accordance with this scaling procedure, measured pressure amplitudes are equal to full-scale values at geometrically similar locations, whereas measured frequencies are 2.5 times higher than the corresponding full-scale frequencies.The technical basis for using this scaling approach was based on extensive review and evaluation of the available literature on CO scaling and scaled tests performed for Mark II and Mark III containments, as well as general consensus of technical experts in this field. The CO scaling studies, which have been performed independently by various technical experts, show that for tests in a geometrically scaled facility with full-scale thermodynamic conditions, the measured pressure amplitudes are the same as full-scale values at geometrically similar locations, and measured pressure frequencies are the scale factor times higher than the corresponding full-scale frequencies.
Therefore, CO frequencies for the full-scale prototypical design are obtained by scaling the frequencies measured in SS tests by a factor of 2.5. A similar technique is applicable to scaling adjustment in frequency for obtaining full-scale values. Thus, this scaling procedure made it possible to use the measured SS data (pressure time history) directly for load definition purpose after the time scale is compressed by a factor of 2.5.
Out of the 13 SS tests, the tests recommended for definition of the CO load are SST-1, 2, 3, 9, 11, and 12. These six tests, summarized in Table 3B-2, were run at prototypical conditions. Of the remaining tests, SST-4, 5, 6, 7, 8, and 14 were run with a prepurged vent system, and SST-10 was run with the L/D blocked off. These tests are valuable for understanding CO phenomena and the effects of system variables, but they are not considered to be an appropriate basis for the CO load definition.
3B.4.3.2.2 Evaluation of CO Database
Each of the CO load definition tests shows significant frequency peaks at 5 and 9 Hz. Figure 3B-16 illustrates this behavior at the basemat (019P) sensor location. The 9 Hz frequency corresponds to a full-scale CO driver frequency near 4 Hz, which is representative of diameter at vent exit. The lower frequency is associated with the vent acoustic frequency which is representative of drywell-to-wetwell connecting vent.
Further examination of the data shows that, in general, the largest amplitude loads occurred at transducer location 019P (on basemat, near pedestal wall). It was observed that the highest amplitude CO loads occurred during the first 30 seconds of tests SST-1 and 2 (large liquid breaks at 49°C pool temperature). Examination of the Power Spectral Density (PSD) data
3B-22 Containment Hydrodynamic Loads
Preliminary Safety Analysis ReportLUNGMEN UNITS 1 & 2
showed that the envelope PSD of the pressure at 019P from a 12-second segment in SST-1 and an 18-second segment in SST-2 matched the envelope PSD of the 019P pressure from the six-test database. Figure 3B-19 shows envelope PSD at 019P for SST-1, 2, 3, 9, 11 and 12. Figure 3B-20 shows a comparison of the two envelope PSDs (one envelope of SST-1 and SST-2, and the other envelope of the six-test database) at 019P are compared. The PSD from the SST-1 and 2 time segments is indistinguishable from the six-test envelope except for a small frequency interval near the origin.
3B.4.3.2.3 CO Load Definition
The load definition methodology for the design CO load for the Lungmen NPS containment uses a source load approach which is described in the following subsections.
3B.4.3.2.3.1 Source Load Approach
The CO load, termed as ÒSource Load ApproachÓ, is used to develop a source load. The source load is a series of pulses which simulate the oscillation of the steam/water interface at the horizontal vent exits. In this approach the CO source load would be applied to a coupled fluid-structure model of the prototypical containment as an excitation of the steam/water interface at the exits of the horizontal vents. It is the oscillatory motion of the steam/water interface which produces the characteristic oscillatory pressure loading on the wall. With a source load, it will be possible to account for the spatial distribution of the load and the variation of pool and vent fluid properties in a natural way. This approach avoids the problem of artificial resonant amplification at the system frequencies.
Figure 3B-21 describes the CO source load methodology. In order to develop a technically justified source loading function, the methodology includes the following elements:
(1) A comprehensive test database
(2) A coupled steam-water-structure interaction model of the test facility from which the data were obtained
(3) A procedure to develop a Òtest sourceÓ loading configuration
(4) A criteria to evaluate the test source loading configuration and test facility model
(5) A procedure to scale up the test source to a full-scale design source for the prototypical containment system
(6) A full-scale coupled steam-water-structure interaction model of the prototypical containment system
(7) A criteria to evaluate the design source loading condition for the prototypical containment system
Containment Hydrodynamic Loads 3B-23
Preliminary Safety Analysis ReportLUNGMEN UNITS 1 & 2
(8) Calculation of CO design (wall pressure) from the prototypical analysis using the design source
Criteria for CO Source Load
An acceptance criterion is specified in order to provide a basis for judging the acceptability of the source loading function with respect to prediction of wall pressure loadings and their frequency contents. The criteria include the following elements:
(1) Wall pressure histories for the SS test facility produced by the test source match with the pressures measured in the SS test facility.
(2) Frequency content of the predicted pressure histories, as defined by a power spectral density (PSD) and by an amplitude response spectrum (ARS), matches with the data obtained from the SS test facility.
(3) Spatial distribution of the root mean square (RMS) of the predicted loading matches with the data measured from the SS test facility.
(4) Wall pressures predicted by the design source for the prototypical Lungmen NPS match with the pressures measured in the SS test facility at geometrically similar locations. Note, this is required by the CO scaling laws (References 3B-8 and 3B-9).
Figure 3B-22 shows a typical pressure time history of prototypical CO load determined using the source load approach described above. Figure 3B-23 shows spatial distribution of CO loads normalized by time history shown in Figure 3B-22.
Load Application Methodology
For design evaluation of containment structure, the pool boundary pressure loads obtained from analysis of single-vent (36°) model of the prototypical design will be specified and applied over the full (360°) model of the Lungmen NPS configuration. This CO loading specification implies all vertical vents are in phase (i.e., no credit for phasing among vents), which is considered to be a conservative load definition approach.
3B.4.3.3 Chugging Loads
Chugging, a hydrodynamic phenomenon associated with a LOCA, follows the CO period and occurs during periods of low vent steam mass flux and, typically, produces a sharp pressure pulse followed by a damped oscillation. During chugging, rapid steam condensation causes the pool water to re-enter the vents. This is followed by a quiescent period until the steam-water interface is forced out into the pool. Thus, chugging, an intermittent event, is the result of unsteady condensation occurring in the last stages of the blowdown. As stated earlier, specific tests were conducted to obtain chugging data for defining the chugging loads for the ABWR containment system.
3B-24 Containment Hydrodynamic Loads
Preliminary Safety Analysis ReportLUNGMEN UNITS 1 & 2
3B.4.3.3.1 Description of Chugging Data
As shown in Table 3B-2 under the FS* part of the Horizontal Vent Test (HVT) matrix, 11 tests were performed primarily for the purpose of establishing a database for definition of the CH load for a prototypical design evaluation. The HVT facility for the FS* test series was run with a full-scale vertical vent and horizontal vent system and an enlarged U/D. The tests were run at prototypical mass flux and pool temperature and with the vent system purged of air. It is known from previous blowdown testing and observations that presence of air in the vent reduces CH loads, so running chugging tests at prepurged conditions is conservative.
3B.4.3.3.2 Evaluation of Chugging Data
A detailed description and discussion of chugging data are contained in Reference 3B-7.
A typical large chug from the full-scale database is shown in Figure 3B-24 and its PSD in Figure 3B-25. It is characterized by a small underpressure, followed by a positive pressure pulse, and a decaying ringout. These phenomena are associated with the initial contraction of the steam bubble, the rapid deceleration of pool water converging on the vent exit, and the excitation of an acoustic standing wave in the pool.
Mean and standard deviation values for peak overpressure (POP) and pressure root-mean-square (PRMS) are shown in Table 3B-3. This amplitude data clearly show that the most severe chugging occurs for the steam breaks with an initial pool temperature of 21°C. Both POP and PRMS decrease significantly as the pool temperature is raised to 49°C. The variation is much less significant between 49 and 68°C. In general, the data support the understanding (observed from prior tests) that chugging has some dependence on system parameters, such as mass flux and pool temperature, along with a substantial degree of randomness.
Tables 3B-4 to 3B-6 show the average periods by 10-second segment for the steam breaks at 21, 49, and 68°C, respectively. Table 3B-7 presents the weighted average of the chug periods within each 10-second segment for all the tests at a given temperature.
3B.4.3.3.3 Chugging Load Definition
Figure 3B-26 shows various elements of the source load methodology for defining the chugging load on the pool boundary. The database consisted of 11 tests conducted in the HVT facility with the full-scale vent system. From this database, key chugs were selected which serve as criteria for the development of the source load. The key-chug approach was used successfully for the definition of the chugging load for Mark II containment design (Reference 3B-10).
Key chug selection was determined by requiring that the PSD envelope of the selected key chugs matches the PSD envelope of the FS* chugging database. The criterion for a technically justifiable chug design source is that the design source load, when applied to an analytical
Containment Hydrodynamic Loads 3B-25
Preliminary Safety Analysis ReportLUNGMEN UNITS 1 & 2
model of the HVT facility, produces a wall pressure which matches the selected data and a PSD envelope which envelopes the PSD envelope of the selected data.
3B.4.3.3.3.1 Pool Boundary Loads
Eight different chugging design sources, represented by a single pulse acting at the exit of top vent in a full-scale model, were defined. The design sources were determined by imposing a requirement that the PSD envelope generated by these design sources bounds the PSD envelope from the selected chugging data. A comparison of PSD results from analysis and test data (for sensor location 019P) is shown in Figure 3B-27. Figure 3B-28 shows spatial distribution of maximum pool boundary pressure. For design evaluation of affected structures, a total of eight pressure time histories, corresponding to eight design sources, will be computed and specified. A typical pressure time history at the bottom pool boundary is shown in Figure 3B-29 which will form the basis for the spatial distribution shown in Figure 3B-28.
Load Application Methodology
The pool boundary pressure loads obtained from analysis of a single-vent (36°) sector model of the prototypical design will be specified for application over the full (360°) model of the Lungmen NPS configuration. To bound symmetric and asymmetric loading conditions, two load cases will be defined.
Case 1: All vents chugging in phase.
Case 2: Vents in one half chugging 180° out of phase with the other half vents
3B.4.3.3.3.2 Loads on Access Tunnel
The containment design provides two lower drywell access tunnels, one for personnel access and the other for equipment transport. These tunnels are circular in cross section and they traverse the pool and they are partially submerged in the suppression pool, and Figure 3B-30 shows a typical submerged position of the tunnels. During CO and CH phase of LOCA, the CO and CH steam condensation phenomena occurring at a horizontal vent exit will induce attenuated pressure loading condition of the submerged portion of the tunnels. The pressure attenuated along the axis of the tunnels will be assumed to vary linearly from the pedestal to the opposite containment wall, and the circumferential attenuation on the tunnel perimeter will be assumed to vary with the submergence height of the tunnels. The normalizing pressure amplitude will be consistent with that used for defining spatial distribution of CO and CH loads on the pool boundary.
3B.4.3.3.3.3 Loads on Horizontal Vent
The HVT FS* facility was instrumented with two load cells on the top horizontal vent to measure the vertical force and bending moment experienced by the vent during chugging. Steam bubble collapsing inside the vent has a potential to induce significant loading on the horizontal vent. With the prototypical vent system design, in which the horizontal vents project
3B-26 Containment Hydrodynamic Loads
Preliminary Safety Analysis ReportLUNGMEN UNITS 1 & 2
into the pool, it is anticipated that these anticipated loads may be of significance to containment structure design.
Typical test results showing the measured loading conditions are exhibited in Figures 3B-31 and 3B-32. The maximum upward load and maximum moment values were not observed to occur simultaneously on the horizontal vent.
For structure evaluation of the Lungmen NPS containment horizontal vent pipe and pedestal, an upward load, based on the HVT data, is conservatively defined as shown in Figure 3B-33.
For building structure response analysis and for the evaluation of RPV and its internals, the horizontal vent upward load is specified as shown in Figure 3B-34. To bound symmetrical and asymmetrical loading conditions, the following two load cases will be considered and analyzed.
(1) Upward load on the pedestal wall simultaneously at all top 10 horizontal vents
(2) Upward load on the pedestal wall simultaneously at top five vents in one-half side of pedestal
3B.5 Submerged Structure Loads
Structures submerged in the suppression pool can be subjected to flow-induced hydrodynamic loads due to LOCA and SRV actuations.
During a LOCA, steam/water mixture rapidly escapes from the break, and the drywell is rapidly pressurized. The water initially in the vent system is expelled out into the suppression pool. A highly localized induced flow field is created in the pool and a dynamic loading is induced on submerged structures. After the water is expelled from the vent system, the air initially in the drywell is forced out through the horizontal vents into the suppression pool. The air exiting from the vents forms expanding bubbles which create moderate dynamic loads on structures submerged in the pool. The air bubbles cause the pool water surface to rise until they break through the pool water surface. The pool surface water slug decelerates and falls back to the original pool level. Steam/water mixture from the break soon fills the drywell space and is channeled to the pool via the vent system. Steam condensation starts and the vibratory nature of pool water motion causes an oscillatory load on submerged structures. This loading condition (CO) continues until the pressure in the drywell decreases. It is then followed by a somewhat regular but less frequent vibration called chugging (CH). During the CH period, a high frequency spike is propagated, which causes an acoustic loading on submerged structures.
During SRV actuations, the dynamic process of the steam blowdown is quite similar to LOCA steam blowdown but the induced load is mitigated by the X-quencher device attached at the end of each discharge device. Two types of loads are important. One is due to the water jet formed at the confluence of the X-Quencher arms and another is due to the four air bubbles formed between the arms of the X-Quencher. These air bubbles are smaller in size than the LOCA air bubbles, reside longer in the pool, and oscillate as they rise to the free surface of the pool.
Containment Hydrodynamic Loads 3B-27
Preliminary Safety Analysis ReportLUNGMEN UNITS 1 & 2
Key submerged structures that will be subjected to significant loads due to LOCA (pool swell, CO, CH) and SRV actuation events are:
■ Submerged portion of SRV discharge lines
■ SRV discharge line X-quencher discharge device and its support structure
■ Personnel and equipment access tunnels (partially submerged)
■ ECCS suction and return lines and strainers at suction point.
3B.5.1 Pool Swell Submerged Structure Loads
During the initial phase of the DBA, the drywell airspace is pressurized and the water in the vents is expelled out into the suppression pool and induces a flow field throughout the suppression pool. This induced flow field is not limited to direct jet contact and creates a dynamic load on structures submerged in the pool.
However, since none of the submerged structures in the Lungmen NPS containment is expected to be in the near direct path of these jets, the dynamic load on these structures is less than the load induced by the LOCA air bubble that forms after the water is expelled out. Since the air bubble induced dynamic load is bounding, this load is conservatively used in place of water jet load.
After the vents are cleared of initially contained water, pressurized drywell air is purged into the suppression pool, and a single bubble is formed around each vent exit. It is during the bubble growth period that unsteady fluid motion is created within the suppression pool. During this period, all submerged structures below the pool surface will be exposed to transient hydrodynamic loads.
The load definition methodology for defining the LOCA bubble-induced loads on submerged structures will be consistent with the methodology described in Reference 3B-11.
3B.5.2 Condensation Oscillation Submerged Structure Loads
During a LOCA, after the vent is cleared of water and the drywell air has been carried over into the wetwell, steam condensation begins. This condensation oscillation phase induces bulk water motion and, therefore, creates drag loads on structures submerged in the pool.
The load definition methodology for defining the LOCA steam condensation oscillation loads on submerged structures will be consistent with the methodology.
3B-28 Containment Hydrodynamic Loads
Preliminary Safety Analysis ReportLUNGMEN UNITS 1 & 2
3B.5.3 Chugging Submerged Structure Loads
Chugging occurs after drywell air has been purged and carried over into the wetwell, and the vent steam mass flux falls below some threshold value. Chugging induces acoustic pressure loads on structures submerged in the pool.
The load definition methodology for defining the LOCA chugging loads on submerged structures will be consistent with methodology.
3B.5.4 SRV Submerged Structure Loads
Following the actuation of a SRV, water contained initially in the discharge line is rapidly discharged through the X-Quencher discharge device attached at the end of the SRV discharge line. A highly localized water jet is formed around the X-Quencher arms. The hydrodynamic load induced outside a sphere circumscribed around the quencher arms by the quencher water jet is expected to be of no significance. No submerged structures are expected to be located within the sphere mentioned above in the Lungmen NPS arrangement. The water jet load for submerged structures located outside the circumscribed sphere by the quencher arm are expected to be negligible and of no significance to structure design.
After the water discharge, the air initially contained in the discharge line is forced out into the suppression pool in the form of high pressure bubbles. The air bubbles formed interact with the surrounding water and produce oscillating pressure and velocity fields in the suppression pool. This pool disturbance gives rise to hydrodynamic loads on submerged structures in the pool.
The load definition methodology for defining the SRV air bubble loads on submerged structures will be consistent with that is described in References 3B-11 and 3B-13.
3B.6 Loads Combination
Under certain plant conditions, the containment structures can be subjected simultaneously to hydrodynamic loads due to LOCA and SRV actuations. Event-time relationships showing load combination histories for design assessment of the Lungmen NPS containment system will be specified.
3B.7 References
3B-1 Containment Loads Report (CLR), Mark III, Containment, 22A4365AB, Rev. 4, January 1980 (Proprietary).
3B-2 Caorso SRV Discharge Tests Phase I Test Report, NEDE-25100-P, May 1979 (Proprietary).
3B-3 Caorso SRV Discharge Tests Phase II ATR, NEDE - 25118, August 1979.
Containment Hydrodynamic Loads 3B-29
Preliminary Safety Analysis ReportLUNGMEN UNITS 1 & 2
3B-4 GESSAR II, 238 Nuclear Island, General Electric Company, Docket No. STN 50-447, Amendments 1 through 21, Appendix 3B (Attachment A).
3B-5 J.E. Torback, Elimination of Limit on BWR Suppression Pool Temperature For SRV Discharge With Quenchers, NEDO - 30832, December 1984.
3B-6 McIntyre, T. R. et al., Mark III Confirmatory Test Program One-Third Scale Pool Swell Impact Tests - Test Series 5805, General Electric Company, NEDE - 13426P, August 1975 (Proprietary).
3B-7 ABWR Containment Horizontal Vent Confirmatory Test, Part I, NEDC - 31393, March 1987 (Proprietary).
3B-8 Sonin A. A., Scaling Laws In Small-Scale Modeling of Steam Relief Into Water Pool, ASME Winter Meeting, Chicago, November 1980.
3B-9 Dodge, F. T., Scaling Study of the GE PSTF Mark III Long Range Program, Task 2.2.1, SwRI, NEDE - 25273, March 1980 (Proprietary).
3B-10 Mark II Containment Program, Generic Chugging Load Definition Report, NEDE-24302-P, April 1981 (Proprietary).
3B-11 F. J. Moody et al, Analytical Model for Estimating Drag Forces on Rigid Submerged Structures Caused by LOCA and Safety Relief Valve Ramshead Air Discharges, NEDE-21471; September 1977.
3B-12 L. E. Lasher, Analytical Model for Estimating Drag Forces on Rigid Submerged Structures Caused by Steam Condensation and Chugging, NEDO-25153, July 1978.
3B-13 L. E. Lasher, Analytical Model for Estimating Drag Forces on Rigid Submerged Structures Caused by LOCA and Safety Relief Valve Ramshead Air Discharges, Supplement for X-Quencher Air Discharges, NEDO - 21471-1, Supplement 1, October 1979.
3B-14 R.J. Ernst et al, Mark II Pressure Suppression Containment Systems: An Analytical Model of the Pool Swell Phenomenon, NEDE - 21544-P, December 1976 (Proprietary).
3B-15 J-H, Chun and A.A. Sonin, Small-scale Simulation of Vapor Discharge into Subcooled Liquid Pools, Nuclear Engineering and Design 85(1985) pp 353-362.
3B-16 Letter, January 20, 1994, General Electric (Jack Fox) to the Staff (Chet Poslusny), Containment Emergency Procedure Guidelines Issue on Heat Capacity Temperature Limit (HCTL), Docket No. 52-001.
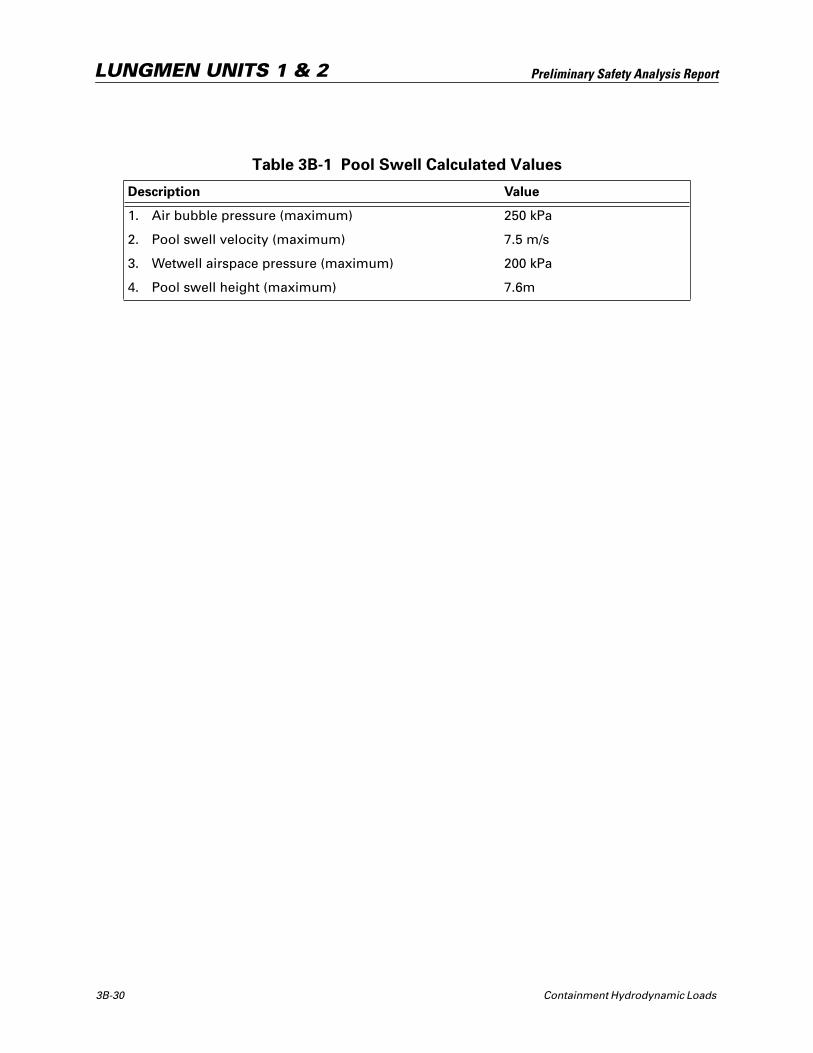
3B-30 Containment Hydrodynamic Loads
Preliminary Safety Analysis ReportLUNGMEN UNITS 1 & 2
Table 3B-1 Pool Swell Calculated Values
Description Value
1. Air bubble pressure (maximum) 250 kPa
2. Pool swell velocity (maximum) 7.5 m/s
3. Wetwell airspace pressure (maximum) 200 kPa
4. Pool swell height (maximum) 7.6m
Containm
ent Hydrodynam
ic Loads 3B
-31
Preliminary Safety Analysis Report
LUN
GM
EN
UN
ITS
1 &
2Table 3B-2 Final ABWR HVT Test Matrix
(Proprietary information provided in a separate proprietary volume.)
3B-32
Containm
ent Hydrodynam
ic Loads
Preliminary Safety Analysis Report
LUN
GM
EN
UN
ITS
1 &
2Table 3B-2 Final ABWR HVT Test Matrix (Continued)
(Proprietary information provided in a separate proprietary volume.)
Containment Hydrodynamic Loads 3B-33
Preliminary Safety Analysis ReportLUNGMEN UNITS 1 & 2
Table 3B-3 Mean and Standard Deviation of CH POP and PRMS by Test
(Proprietary information provided in a separate proprietary volume.)
Table 3B-4 Average Chug Period by 10-second Segment for Steam Breaks at 21°C(Proprietary information provided in a separate proprietary volume.)
3B-34 Containment Hydrodynamic Loads
Preliminary Safety Analysis ReportLUNGMEN UNITS 1 & 2
Table 3B-5 Average Chug Period by 10-Second Segment for Steam Breaks at 49°C(Proprietary information provided in a separate proprietary volume.)
Table 3B-6 Average Chug Period by 10-Second Segment for Steam Breaks at 68°C(Proprietary information provided in a separate proprietary volume.)
Containment Hydrodynamic Loads 3B-35
Preliminary Safety Analysis ReportLUNGMEN UNITS 1 & 2
Table 3B-7 Average Chug Period by 10-Second Segment for Steam Breaks at
21°C, 49°C, and 68°C(Proprietary information provided in a separate proprietary volume.)
Table 3B-8 Pool Swell Model Comparison with PSTF Test Data
(Proprietary information provided in a separate proprietary volume.)
3B-36
Containm
ent Hydrodynam
ic Loads
Preliminary Safety Analysis Report
LUN
GM
EN
UN
ITS
1 &
2Table 3B-9 Model vs PSTF Test Data Comparison Results Summary at Selected Time
(Proprietary information provided in a separate proprietary volume.)
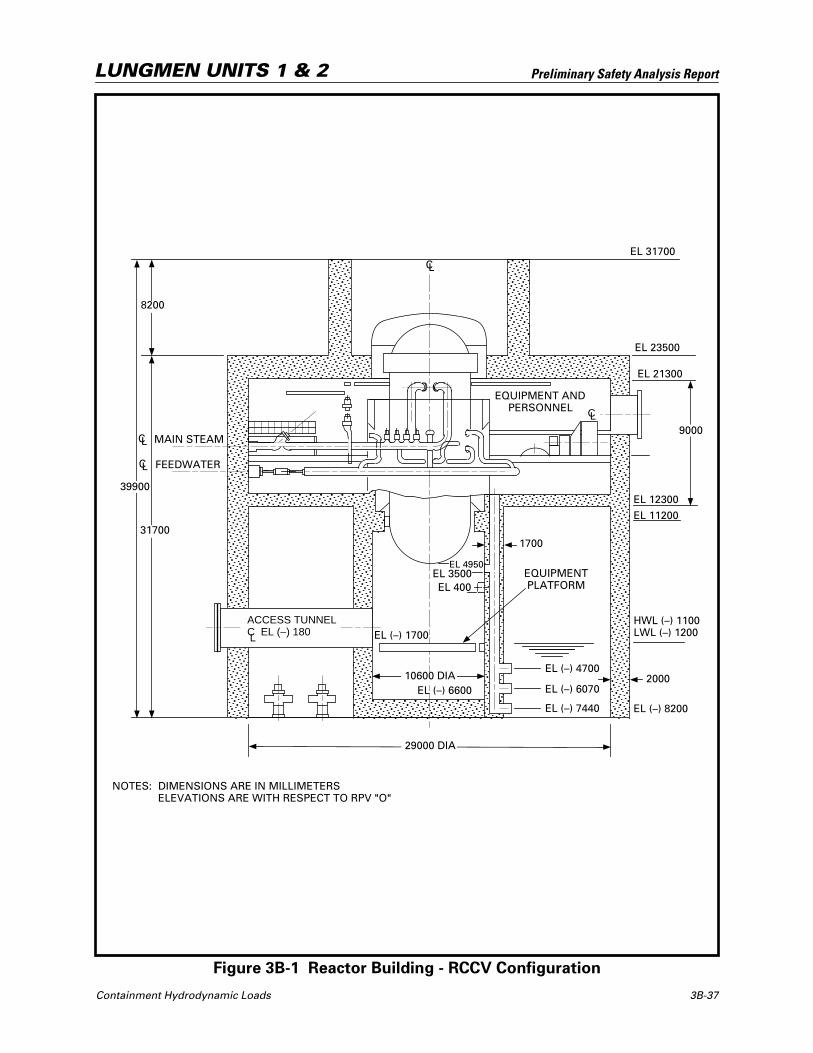
Containment Hydrodynamic Loads 3B-37
Preliminary Safety Analysis ReportLUNGMEN UNITS 1 & 2
Figure 3B-1 Reactor Building - RCCV Configuration
8200
ACCESS TUNNELC EL (–) 180L
EQUIPMENTPLATFORM
10600 DIAEL (–) 6600
EL (–) 7440
EL (–) 6070
EL (–) 4700
EL 4950
1700
2000
EL (–) 8200
HWL (–) 1100LWL (–) 1200
EL 11200
EL 12300
EL 21300
EL 23500
EQUIPMENT ANDPERSONNEL
EL 31700
29000 DIA
CL
MAIN STEAMCL
FEEDWATERCL
DIMENSIONS ARE IN MILLIMETERSELEVATIONS ARE WITH RESPECT TO RPV "O"
EL 3500
39900
31700
CL
EL 400
NOTES:
EL (–) 1700
9000
3B-38 Containment Hydrodynamic Loads
Preliminary Safety Analysis ReportLUNGMEN UNITS 1 & 2
Figure 3B-2 X-Quencher Schematic
(Proprietary information provided in a separate proprietary volume.)
Containment Hydrodynamic Loads 3B-39
Preliminary Safety Analysis ReportLUNGMEN UNITS 1 & 2
Figure 3B-3 X-Quencher Azimuthal Locations in the ABWR Suppression Pool
(Proprietary information provided in a separate proprietary volume.)
3B-40 Containment Hydrodynamic Loads
Preliminary Safety Analysis ReportLUNGMEN UNITS 1 & 2
Figure 3B-4 Dimensions for P(r) Calculation
PEDESTAL
WALL
RCCVWALL
RoR
P
= R - Ro
= √ R2 + Ro2 - 2RRo cos : for 2
: for 2
Containment Hydrodynamic Loads 3B-41
Preliminary Safety Analysis ReportLUNGMEN UNITS 1 & 2
Figure 3B-5 Circumferential Distribution
TANGENTS TO QUENCHER
AND PEDESTAL
CONTAINMENT
PEDESTAL
REGION INWHICH QUENCHERLOADS ARECONSIDEREDNEGLIGIBLE
3B-42
Containm
ent Hydrodynam
ic Loads
Preliminary Safety Analysis Report
LUN
GM
EN
UN
ITS
1 &
2
Figure 3B-6 Quencher Bubble Pressure Time History
–0.400
–0.800
TIME (s)0
NO
RM
ALI
ZED
PR
ES
SU
RE
0
0.400
0.800
1.200
Pmax
0.75 Pmax
Pmin
0.125 s(TYP)
0.05 s(TYP)
0.075 s(TYP)
0.33 Pmax
0.33 Pmin
NORMALIZED PRESSUREFREQUENCY: 8 Hz
Pmax 1.0
0.100 0.200 0.300 0.400 0.500 0.600 0.700 0.800 0.900
Containment Hydrodynamic Loads 3B-43
Preliminary Safety Analysis ReportLUNGMEN UNITS 1 & 2
Figure 3B-7 Spatial Load Distribution for SRV Loads
POOL SURFACE
RCCV
1.01.0
0.25 h
1.0
PEDESTAL
h
3B-44
Containm
ent Hydrodynam
ic Loads
Preliminary Safety Analysis Report
LUN
GM
EN
UN
ITS
1 &
2
Figure 3B-8 Not Used
Containm
ent Hydrodynam
ic Loads 3B
-45
Preliminary Safety Analysis Report
LUN
GM
EN
UN
ITS
1 &
2
Figure 3B-9 PSTF Test Data vs PICSM Prediction: Test 5702-11
(Proprietary information provided in a separate proprietary volume.)
3B-46
Containm
ent Hydrodynam
ic Loads
Preliminary Safety Analysis Report
LUN
GM
EN
UN
ITS
1 &
2
Figure 3B-10 PSTF Test Data vs Model Prediction: Test 5806-4
(Proprietary information provided in a separate proprietary volume.)
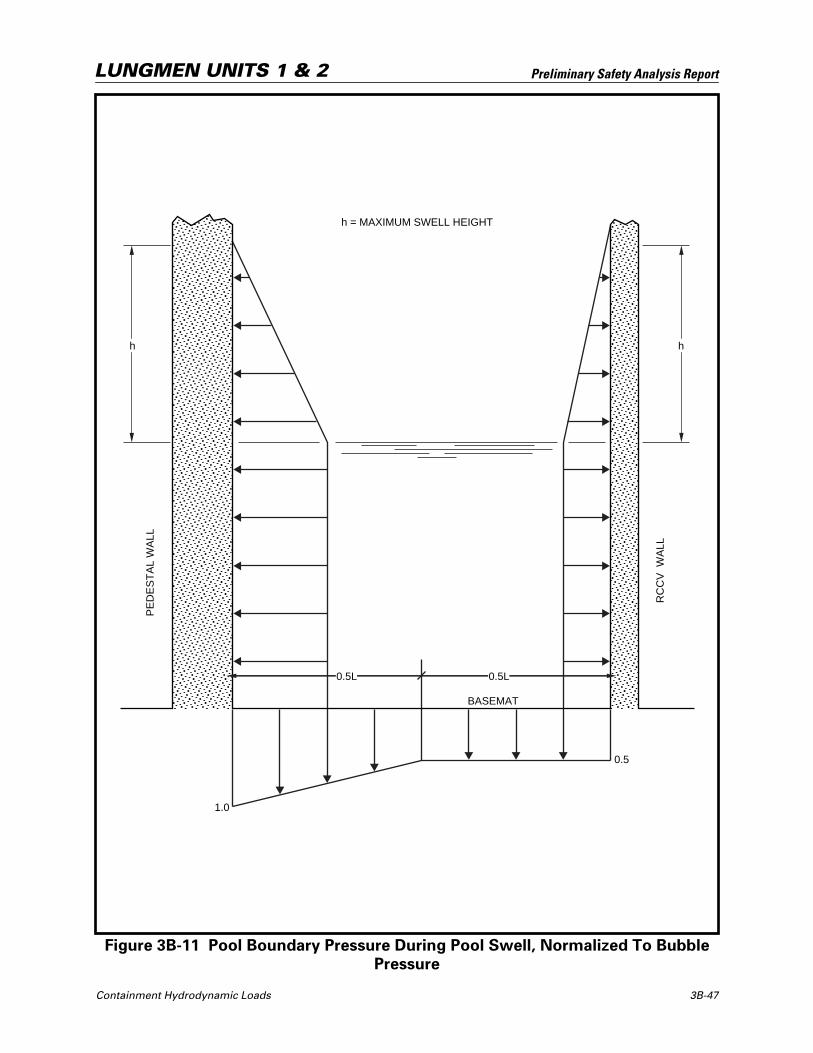
Containment Hydrodynamic Loads 3B-47
Preliminary Safety Analysis ReportLUNGMEN UNITS 1 & 2
Figure 3B-11 Pool Boundary Pressure During Pool Swell, Normalized To Bubble
Pressure
h = MAXIMUM SWELL HEIGHT
h h
0.5L 0.5L
BASEMAT
0.5
1.0
PE
DE
ST
AL
WA
LL
RC
CV
WA
LL
3B-48 Containment Hydrodynamic Loads
Preliminary Safety Analysis ReportLUNGMEN UNITS 1 & 2
Figure 3B-12 Not Used
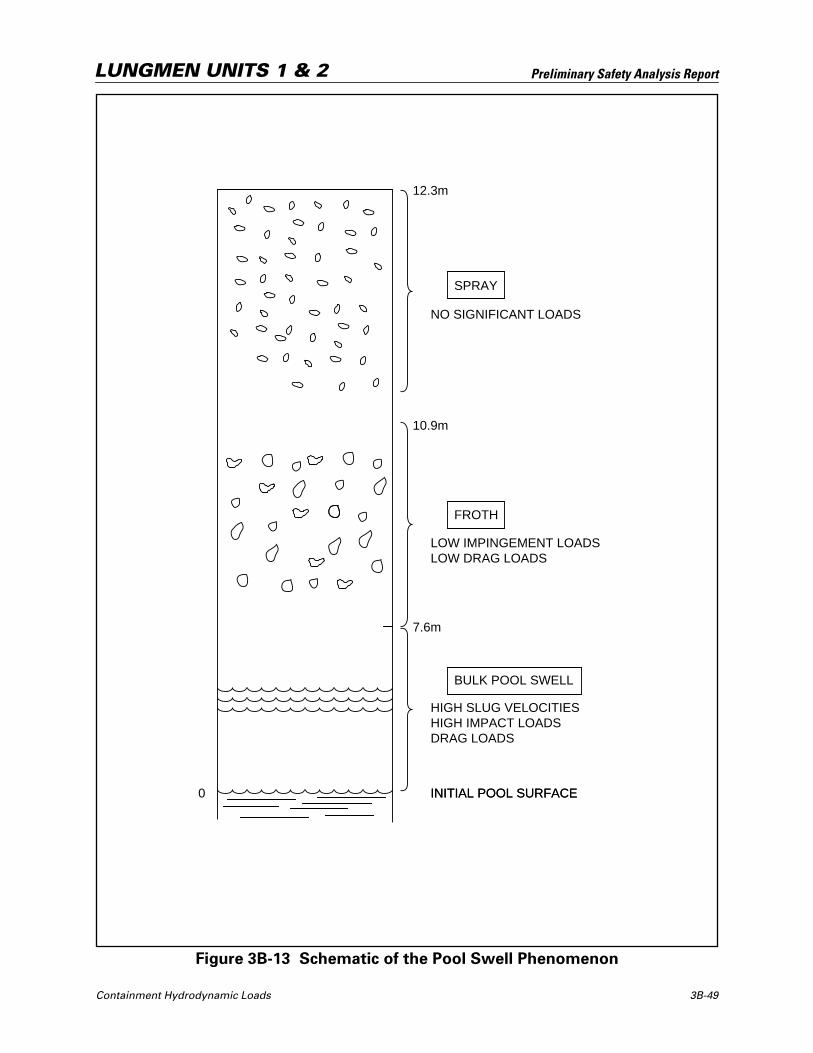
Containment Hydrodynamic Loads 3B-49
Preliminary Safety Analysis ReportLUNGMEN UNITS 1 & 2
Figure 3B-13 Schematic of the Pool Swell Phenomenon
INITIAL POOL SURFACE
HIGH SLUG VELOCITIESHIGH IMPACT LOADSDRAG LOADS
BULK POOL SWELL
7.6m
10.9m
FROTH
LOW IMPINGEMENT LOADSLOW DRAG LOADS
NO SIGNIFICANT LOADS
SPRAY
12.3m
INITIAL POOL SURFACE0
3B-50 Containment Hydrodynamic Loads
Preliminary Safety Analysis ReportLUNGMEN UNITS 1 & 2
Figure 3B-14 Drag Coefficient for Cylinders Following Impact
(Proprietary information provided in a separate proprietary volume.)
Containm
ent Hydrodynam
ic Loads 3B
-51
Preliminary Safety Analysis Report
LUN
GM
EN
UN
ITS
1 &
2
Figure 3B-15 SS Test Facility
(Proprietary information provided in a separate proprietary volume.)
3B-52
Containm
ent Hydrodynam
ic Loads
Preliminary Safety Analysis Report
LUN
GM
EN
UN
ITS
1 &
2
Figure 3B-16 FS* Test Facility
(Proprietary information provided in a separate proprietary volume.)
Containm
ent Hydrodynam
ic Loads 3B
-53
Preliminary Safety Analysis Report
LUN
GM
EN
UN
ITS
1 &
2
Figure 3B-17 Test Sensors Common to FS* and SS Tests
(Proprietary information provided in a separate proprietary volume.)
3B-54
Containm
ent Hydrodynam
ic Loads
Preliminary Safety Analysis Report
LUN
GM
EN
UN
ITS
1 &
2
Figure 3B-18 Test Sensors Unique to FS* and SS Tests
(Proprietary information provided in a separate proprietary volume.)
Containm
ent Hydrodynam
ic Loads 3B
-55
Preliminary Safety Analysis Report
LUN
GM
EN
UN
ITS
1 &
2
Figure 3B-19 Envelope PSD at 019P for SST-1, 2, 3, 9, 11, and 12
(Proprietary information provided in a separate proprietary volume.)
3B-56
Containm
ent Hydrodynam
ic Loads
Preliminary Safety Analysis Report
LUN
GM
EN
UN
ITS
1 &
2
Figure 3B-20 Six-Test and Key-Segment Evelope PSDs and 019P
(Proprietary information provided in a separate proprietary volume.)
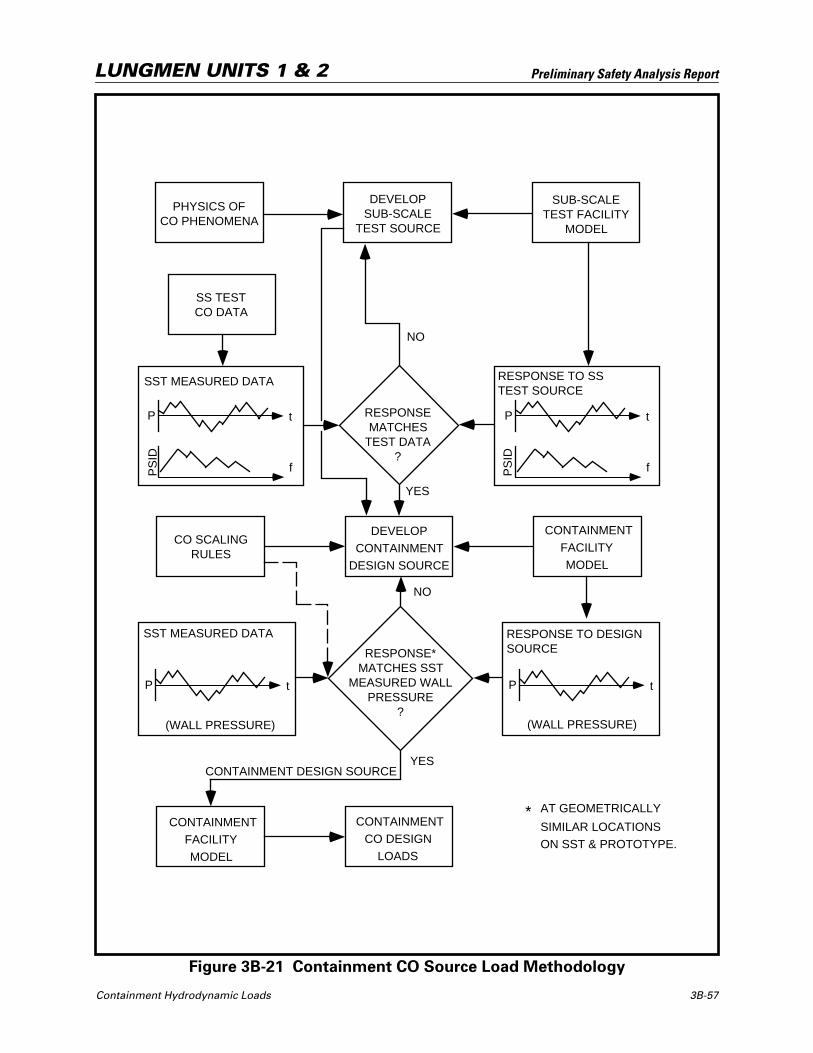
Containment Hydrodynamic Loads 3B-57
Preliminary Safety Analysis ReportLUNGMEN UNITS 1 & 2
Figure 3B-21 Containment CO Source Load Methodology
RESPONSEMATCHES
TEST DATA?
DEVELOPSUB-SCALE
TEST SOURCE
SUB-SCALETEST FACILITY
MODEL
CONTAINMENTFACILITYMODEL
CONTAINMENTCO DESIGN
LOADS
RESPONSE*MATCHES SST
MEASURED WALLPRESSURE
?
CONTAINMENTFACILITYMODEL
CO SCALINGRULES
DEVELOPCONTAINMENT
DESIGN SOURCE
SST MEASURED DATA
(WALL PRESSURE)
RESPONSE TO DESIGNSOURCE
(WALL PRESSURE)
PHYSICS OFCO PHENOMENA
SS TESTCO DATA
RESPONSE TO SSTEST SOURCE
SST MEASURED DATA
P t
f
P t
f
P t P t
YES
NO
CONTAINMENT DESIGN SOURCE
AT GEOMETRICALLY
SIMILAR LOCATIONSON SST & PROTOTYPE.
*
NO
PS
ID
PS
ID
YES

3B-58
Containm
ent Hydrodynam
ic Loads
Preliminary Safety Analysis Report
LUN
GM
EN
UN
ITS
1 &
2
Figure 3B-22 ABWR Typical Pressure Fluctuation Due to CO
(Proprietary information provided in a separate proprietary volume.)
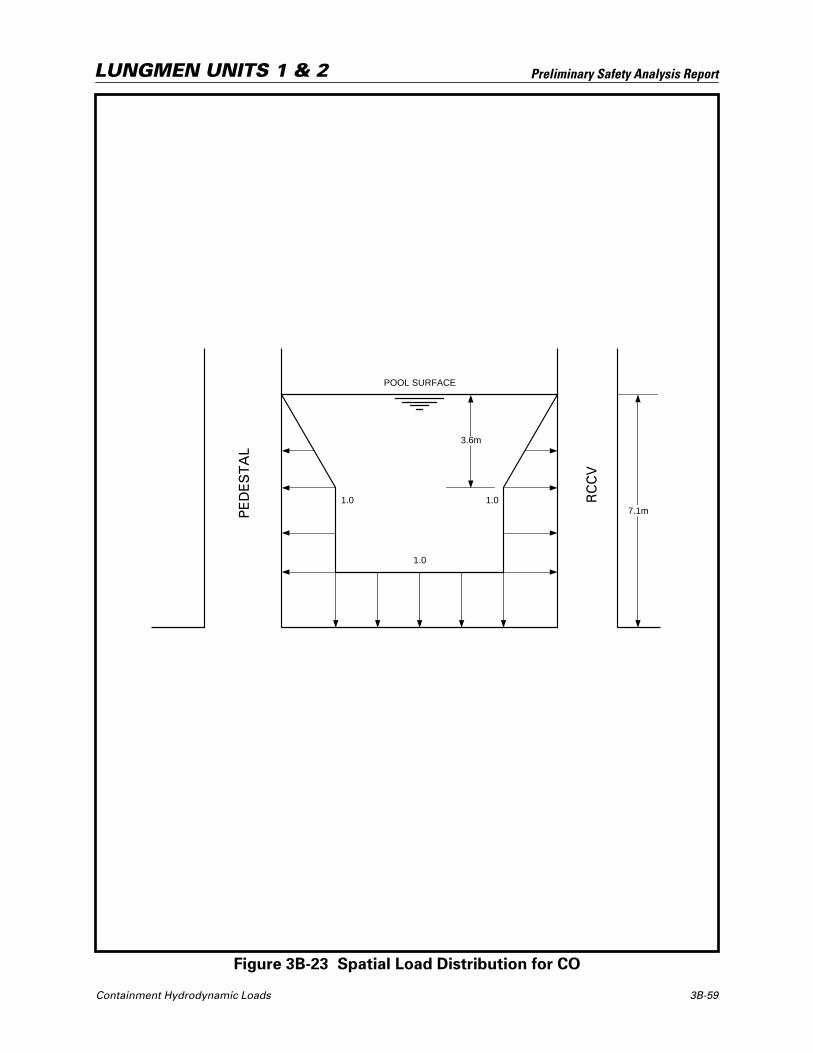
Containment Hydrodynamic Loads 3B-59
Preliminary Safety Analysis ReportLUNGMEN UNITS 1 & 2
Figure 3B-23 Spatial Load Distribution for CO
3.6m
1.0 1.0
1.0
POOL SURFACE
RC
CV
PE
DE
ST
AL
7.1m
3B-60
Containm
ent Hydrodynam
ic Loads
Preliminary Safety Analysis Report
LUN
GM
EN
UN
ITS
1 &
2
Figure 3B-24 Typical Large Chug (025P)
(Proprietary information provided in a separate proprietary volume.)

Containm
ent Hydrodynam
ic Loads 3B
-61
Preliminary Safety Analysis Report
LUN
GM
EN
UN
ITS
1 &
2
Figure 3B-25 PSD of Typical Large Chug (025P)
(Proprietary information provided in a separate proprietary volume.)
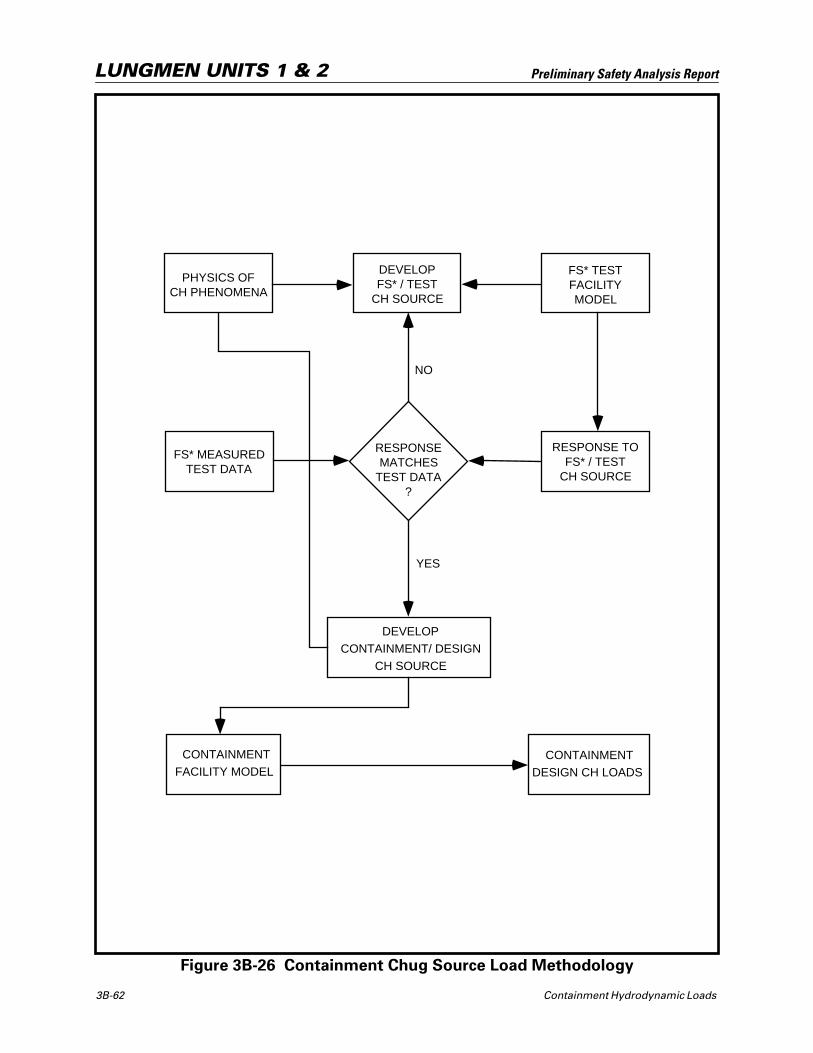
3B-62 Containment Hydrodynamic Loads
Preliminary Safety Analysis ReportLUNGMEN UNITS 1 & 2
Figure 3B-26 Containment Chug Source Load Methodology
RESPONSEMATCHES
TEST DATA?
DEVELOPFS* / TEST
CH SOURCE
FS* TESTFACILITYMODEL
DEVELOPCONTAINMENT/ DESIGN
CH SOURCE
CONTAINMENTFACILITY MODEL
CONTAINMENTDESIGN CH LOADS
PHYSICS OFCH PHENOMENA
FS* MEASUREDTEST DATA
RESPONSE TOFS* / TEST
CH SOURCE
YES
NO
Containment Hydrodynamic Loads 3B-63
Preliminary Safety Analysis ReportLUNGMEN UNITS 1 & 2
Figure 3B-27 Comparison of PSDs Between Analysis and Test
(Proprietary information provided in a separate proprietary volume.)
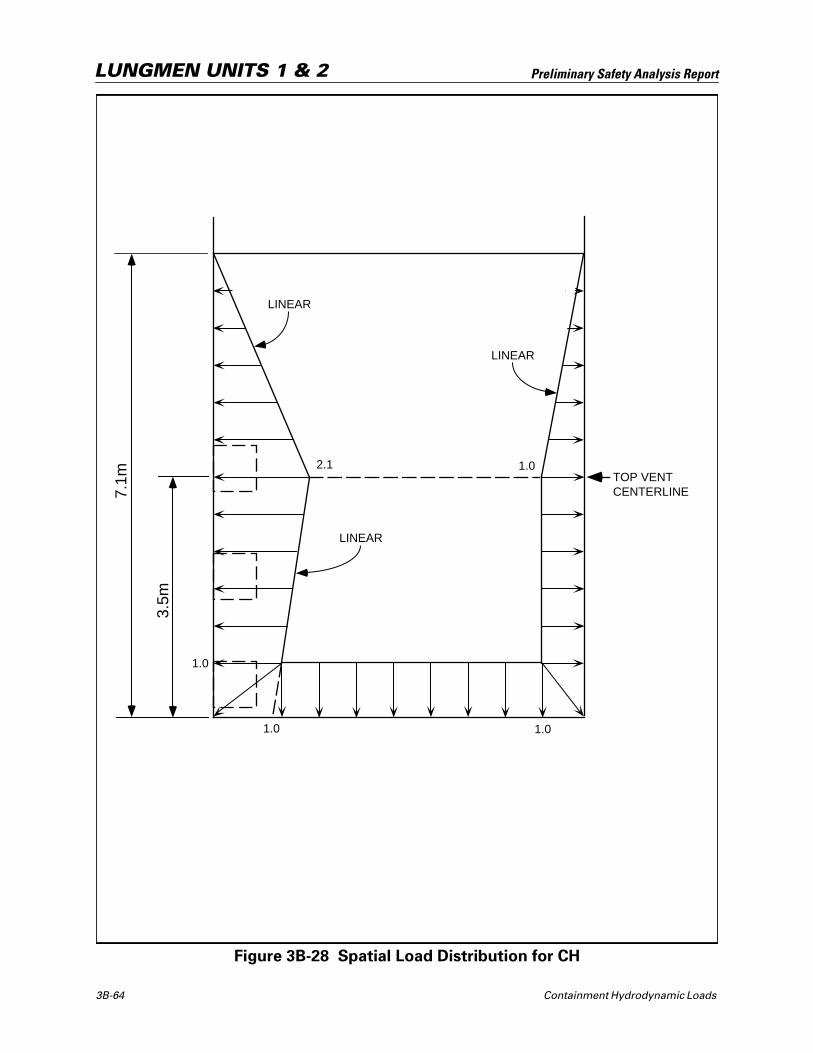
3B-64 Containment Hydrodynamic Loads
Preliminary Safety Analysis ReportLUNGMEN UNITS 1 & 2
Figure 3B-28 Spatial Load Distribution for CH
1.01.0
LINEAR
7.1m
3.5m
TOP VENTCENTERLINE
1.0
LINEAR
LINEAR
2.1 1.0

Containm
ent Hydrodynam
ic Loads 3B
-65
Preliminary Safety Analysis Report
LUN
GM
EN
UN
ITS
1 &
2
Figure 3B-29 Typical Wall Pressure Time History Due to CH
(Proprietary information provided in a separate proprietary volume.)
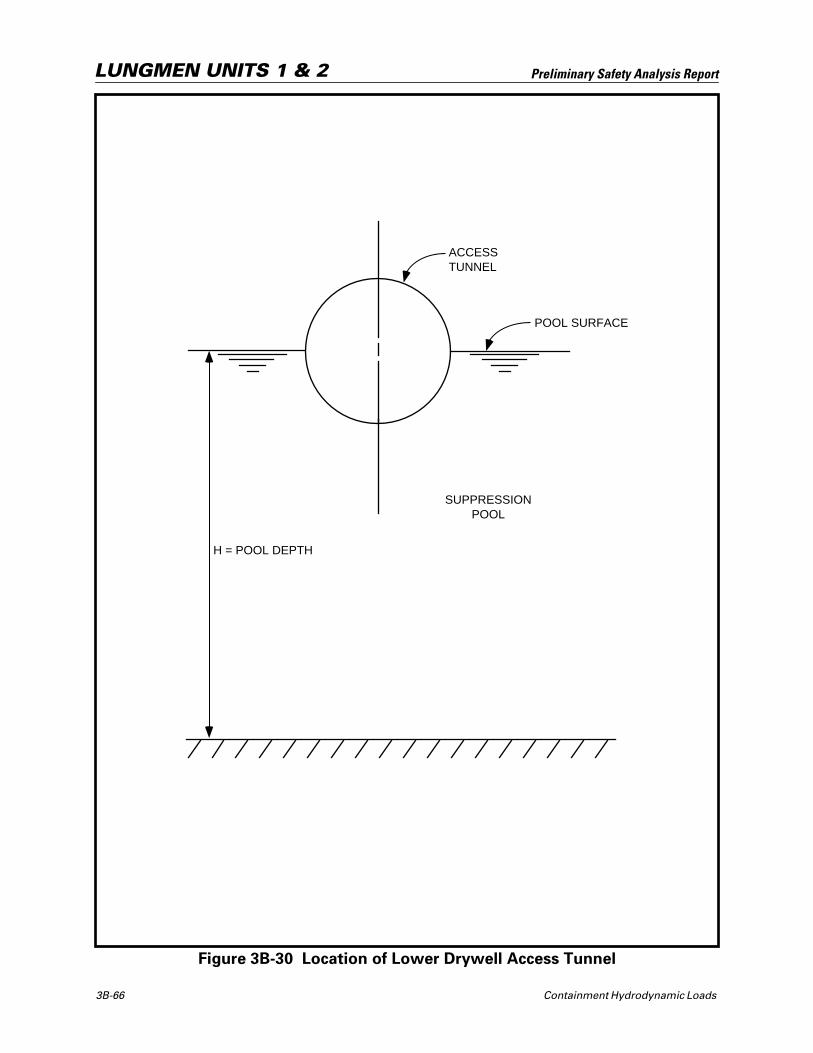
3B-66 Containment Hydrodynamic Loads
Preliminary Safety Analysis ReportLUNGMEN UNITS 1 & 2
Figure 3B-30 Location of Lower Drywell Access Tunnel
H = POOL DEPTH
ACCESSTUNNEL
POOL SURFACE
SUPPRESSIONPOOL
Containm
ent Hydrodynam
ic Loads 3B
-67
Preliminary Safety Analysis Report
LUN
GM
EN
UN
ITS
1 &
2
Figure 3B-31 Typical Test Result of Upward Load on Horizontal Vent Due to CH
(Proprietary information provided in a separate proprietary volume.)
3B-68
Containm
ent Hydrodynam
ic Loads
Preliminary Safety Analysis Report
LUN
GM
EN
UN
ITS
1 &
2
Figure 3B-32 Typical Test Result of Moment Due on Horizontal Vent to CH
(Proprietary information provided in a separate proprietary volume.)

Containment Hydrodynamic Loads 3B-69
Preliminary Safety Analysis ReportLUNGMEN UNITS 1 & 2
Figure 3B-33 Horizontal Vent Upward Loading for Vent Pipe and Pedestal
(Proprietary information provided in a separate proprietary volume.)
3B-70 Containment Hydrodynamic Loads
Preliminary Safety Analysis ReportLUNGMEN UNITS 1 & 2
Figure 3B-34 Horizontal Vent Upward Loading for Structure Response Analysis
(Proprietary information provided in a separate proprietary volume.)