Embed Size (px)
Citation preview
Abstract- This paper examined the application of Machine
Learning techniques for famine prediction. Early detection of
famine reduces vulnerability of the society at risk. The dataset
used in the study was collected between 2004 to 2005 across
households in the different regions of Uganda. Dataset from the
northern region was found to be most suitable to training
datasets of other regions. Classification performance of four
methods as Support Vector Machine, K- Nearest Neighbours,
Naïve Bayes and Decision tree in prediction of famine were
evaluated. Support Vector Machine and K- Nearest Neighbours
performed better than the rest of the methods however Support
Vector Machine produced the best ROC which can be used by
policy makers to determine the cut-off for determining famine
prone households. It is recommended in this study that satellite
data could be used in combination to show the relationship in
prediction of food security as this may increase the specificity of
those households at risk.
Index Terms— Classification, Disaster, Famine, Machine
Learning, Prediction
I. INTRODUCTION
Famine is a disaster that affects many households in
developing countries, Uganda inclusive [1],[2]. It is caused
by a combination of many factors such as drought, poverty
and armed conflict. Early prediction of famine ensures its
avoidance or control. Machine Learning (ML) technique
which extracts information automatically by computational
and statistical methods is useful in this kind of prediction
because of its ability to improve classification performance
based on previous results of labeled training examples from a
problem domain. In this study the application of Machine
Learning in structured data mining for purpose of risk
classification in a disaster like famine is explored.
Structured data mining is search for interesting information
in given structures like relational databases. It is applied in
the representation of „real-world‟ data like famine disaster
since they do not have natural representation as a single table.
The relationship between the different famine indicators such
as agricultural production, agricultural shocks, household Manuscript received October 04, 2010; revised January 22, 2011
W. Okori is with Department of Computer Science, Faculty of
Computing and Information Technology, Makerere University. (phone: +256-790790185; e-mail: [email protected]).
J. Obua is with The Inter-University Council for East Africa (e-mail:
income and labour input is important in establishing the link
between different variables used to detect famine [3].
Relationship of this nature is helpful in designing entry points
in intervention during and before famine disaster occurs.
Non parametric techniques like classification and regression
(CART), and parametric techniques like logistic regression,
have been used in vulnerability studies like famine [4].
Classification techniques with non parametric nature have the
advantage of enabling modeling of irregularities such as data
sparsity in the risk function over the feature spaces which is
an abstract space where each pattern sample is represented as
a point in n-dimensional space[5],[6]. Support Vector
Machine (SVM), K-Nearest Neighbour (KNN), Naïve Bayes
(NB), and Decision Tree (DT) used in this study are
nonparametric in nature and have advantages over methods
like CART since they show probability levels of predictions.
Causal structure learning algorithms that determine causal
relationship between the different variables have been
applied in studying the relationships between the different
variables that cause famine [3].
Supervised learning has been applied in this study because
the features are known and the dataset is split into training
and validation sub-sets in order to enhance classifier
accuracy [7]. However, one of the challenges of using
Machine Learning techniques is the need for ground truthing
and an accurately labeled data set that can be used for
training and testing of classification accuracy. Due to
stability and better generalization, pattern recognition
technique that proved to be suitable for this dataset for
identification and classification of households prone to
famine were Support Vector Machine and K-Nearest
Neighbour. Support Vector Machine has best generalization
performance as it depends on the support vectors which
provide a hyperplane with a maximal separation between
classes. This provide least chance of causing
misclassification if an error is made in the location of the
boundary. The maximum margin of the liner classifier is
identified by the plus and minus planes [8],[9] as represented
below:
Plus-plane = { x : w . x + b = +1 } (1)
Minus-plane = { x : w . x + b = -1 } (2)
where w is vector perpendicular to the planes and b is the
bias.
Machine Learning Classification Technique for
Famine Prediction
Washington Okori and Joseph Obua
ori, John Quinn and Joseph Obua
Proceedings of the World Congress on Engineering 2011 Vol II WCE 2011, July 6 - 8, 2011, London, U.K.
ISBN: 978-988-19251-4-5 ISSN: 2078-0958 (Print); ISSN: 2078-0966 (Online)
WCE 2011
Maximum margin separating the planes is therefore
represented as:
M=2/ √M.M (3)
where M is the maximum margin
For K-Nearest Neighbour [10] it assumes in a feature space
arbitrary instances represented as:
(a1(x), a2(x),…,a n(x)) (4)
where ai(x) are features
The nearest neighbour of an instance based on the k-th
minimum distance between the instances used in
classification is defined interms of Euclidean distance
represented as:
n
d(xi, xj) = √ ∑(ar (xi)-a r(xj))2 (5)
r=1
This method classifies objects based on close training
examples in the future space with the object being assigned
to the class most common amongst its k-nearest neighbours.
The training set for the KNN algorithm is taken from a set of
objects for which the correct classification is known. In this
study the vector in the multidimensional feature space used
had class label for households with food security status
categorized as food secure and insecure.
The overall objective of the study was to accurately classify
households prone to famine using ML techniques. The
specific objectives were to (i) train dataset that can be used
in household food insecurity prediction (ii) show levels of
prediction accuracy using different measurements (iii)
evaluate prediction accuracy using Receiver Operating
Characteristics (ROC)/Area Under the Curve (AUC).
II. CONCEPTUAL SUPERVISED LEARNING
FRAMEWORK
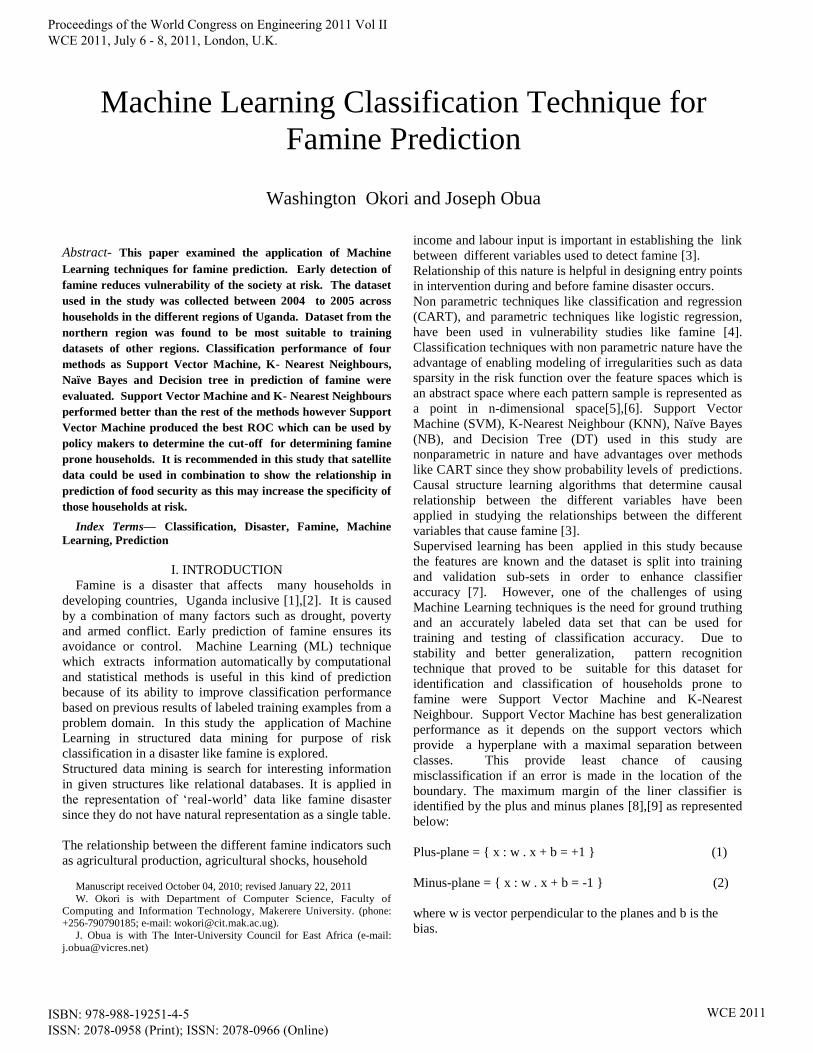
The supervised learning process of classification examined
for prediction of famine prone households is shown in Figure
1.
Figure 1. Conceptual supervised learning framework (Adopted from
Kotsiantis, 2007).
It was adopted from the work of Kotsiantis [11] and is
applicable since famine is a real world problem.
In this study possibility of noise and missing features were
reduced by identification of required data using the domain
knowledge gained during this study.
III. MATERIALS AND METHODS
A. Study Area
Secondary data for two agricultural seasons: July–December
2004 and January–June 2005 on agricultural households in
northern, central, eastern and southern parts of Uganda were
obtained from Uganda Bureau of Statistics (UBOS). Uganda
is located between 4012‟N and 1
0 29‟S, 29
034‟E and 35
0E
with a total area of 241,500 km2. The projected population is
31,135,292 growing at an average 3.2% per annum. Uganda
is bordered to the west by the Democratic Republic of
Congo, to the north by Sudan, to the east by Kenya, to the
south by Tanzania, and to the southwest by Rwanda.
Uganda‟s main economic activity is subsistence agriculture
and the major crops are maize, millet, sorghum, rice, beans,
groundnuts, simsim, cassava, sweet potato, Irish potatoes,
and bananas [12].
B. Data Description
Data on agricultural crop production collected during the
survey were not standardized because it was easier to use
measurement units such as tins which is known to
subsistence farmers.. Maize, beans and groundnuts were wet
or dry and the units of measurements were tins, kilogram and
baskets were not uniform. Feature
transformation/construction was performed on crop condition
state and measurements to standardize them by applying
predetermined conversion factors[12]. The data contained
5,040 cases but 3,030 cases remained after deleting missing
cases.
Twenty four features including household identity, region,
district, gender, marital status, education, occupation, sex,
agricultural shock, size of land holding, size of household,
labour input, livestock number owned, distance – home to
main road, distance – home to main gardens, household
income, age of household head, crop name, crop quantity
harvested, crop state, crop quantity used to produce
processed food products, crop quantity given to land lords,
crop quantity in store and crop quantity lost or wasted were
identified in the survey and provided useful information
about household food security. Nine features out of 24
(household identity, crop name, crop quantity harvested, crop
state, crop quantity used to produce processed food products,
crop quantity given to land lords, crop quantity in store, crop
quantity lost or wasted and districts) were not included in the
classification because they were either
transformed/reconstructed into other variable. This was to
reduce dimensionality of the data, noise on classification and
enable data mining algorithms to operate faster and more
effectively [11]. Since diet is an important indicator of food
security, dietary energy intake was computed for each
household based on their food balance sheet and those below
the threshold of 1800 Kcl/per person/day were classified as
Proceedings of the World Congress on Engineering 2011 Vol II WCE 2011, July 6 - 8, 2011, London, U.K.
ISBN: 978-988-19251-4-5 ISSN: 2078-0958 (Print); ISSN: 2078-0966 (Online)
WCE 2011

food insecure [1]. After feature transformation/construction
fifteen variables were used for classification of household
food security status.
C. Classification of Households and Performance Evaluation
of Classification Methods
Classification of Households
Data from the four regions of Uganda were classified using
Support Vector Machine , k-nearest neighbor, Naïve Bayes,
and Decision Tree to establish the influence of regional
disparity. Sensitivity, specificity, accuracy and area under
the curve were used to evaluate prediction performance of
the four classification methods. Multi label classification was
applied using KNN to show whether prediction could be
done based on regional class labels.
Prediction Performance Evaluation of Classification
Methods
Prediction accuracy, error rate, sensitivity, specificity and
receiver operating characteristics (ROC) were used to
evaluate the prediction performances of classification
methods. The tradeoff between sensitivity and specificity
(ROC) was plotted and area under the curve (AUC)
calculated to show the accuracy of the predictions [13]. For
k- nearest neighbor, the numbers of neighbors were varied
until the highest value of ROC was obtained.
D. Visualization of Classification
Classification was visualized in 2-d to display the training
and testing data on selected features like dietary energy
intake and size of household with the class having two labels
as food insecure and food secure and the values normalized
using z-score. Visualization demonstrated how the training
and testing datasets can be separated into feature space with
corresponding known and predicted classes to establish
interesting patterns [14].
IV. RESULTS
A. Prediction Evaluation
Results of prediction measures for the four regions of Uganda
performed using SVM, KNN, NB, and DT is given in Figure
2. Overall, there appears to be more famine in northern
region than the rest of the country.
Variation in average prediction performance of the different
methods applied to the dataset for the four regions is shown
in Figure 3. It is clear that KNN had the highest average
sensitivity ( 80.63%) while SVM, NB and DT had between
65% to 70%. The error bar indicates possible statistical
significant difference between the mean of KNN and the rest
of the methods and higher preference for KNN for
sensitivity measurement, while Support Vector Machine
(96.25%) is preferred for ROC measurement because of its
ability to minimize the probability of misclassification of the
future patterns for unknown probability distribution of the
dataset.
Figure 2. Performance comparision of data from the four regions using
KNN (K), NB (N) , SVM (S) and DT (D).
Figure 3. Comparison of prediction performance of different classification methods.
All the four methods had similar average error rates (less
than 35%) which is good since they are below 50%. Since
data from northern region performed better than data from
the other regions, it was used to train data from other regions
using different classification methods such as SVM and the
prediction results are presented in Table 1.
Support vector machine and KNN exhibited appreciable
boost in sensitivity for the regions like western region that
had performed poorly before using data from north for
training. K nearest neighbor showed, on average, good
performance on these datasets in-terms of sensitivity since it
was able to improve prediction of data from western region
by about 30% unlike NB which decreased the prediction
measurement by about 26%.
Proceedings of the World Congress on Engineering 2011 Vol II WCE 2011, July 6 - 8, 2011, London, U.K.
ISBN: 978-988-19251-4-5 ISSN: 2078-0958 (Print); ISSN: 2078-0966 (Online)
WCE 2011
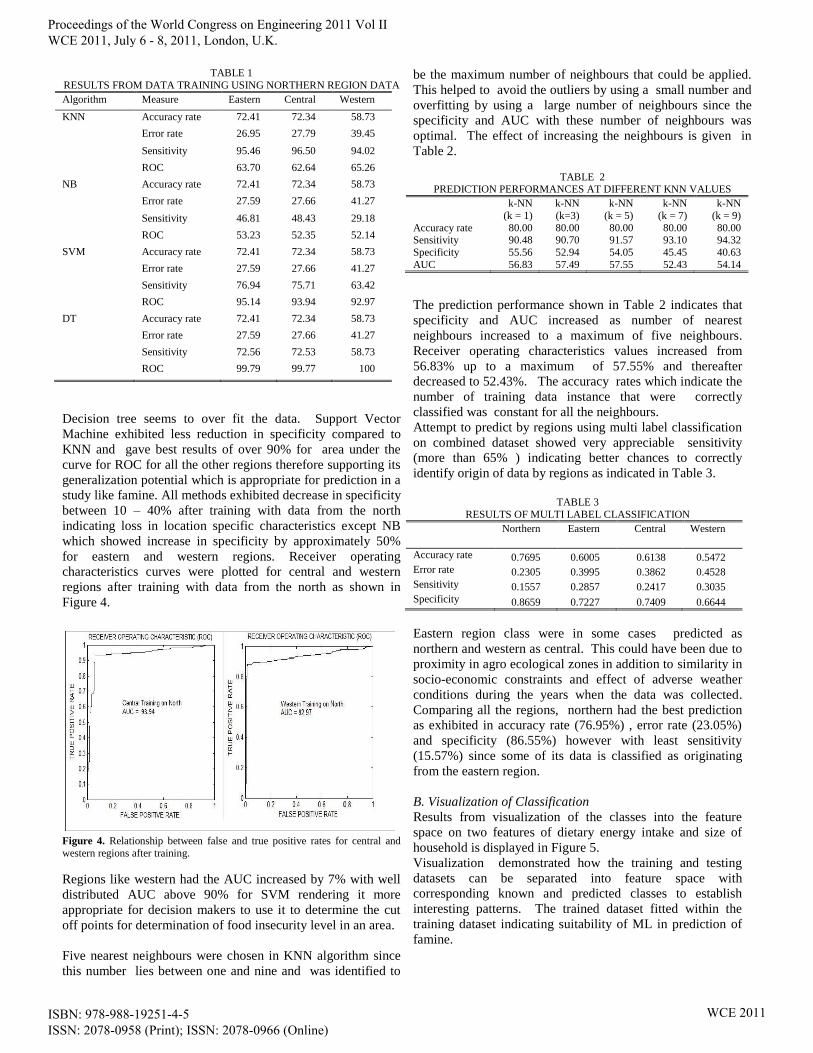
TABLE 1
RESULTS FROM DATA TRAINING USING NORTHERN REGION DATA Algorithm Measure Eastern Central Western
KNN Accuracy rate 72.41 72.34 58.73
Error rate 26.95 27.79 39.45
Sensitivity 95.46 96.50 94.02
ROC 63.70 62.64 65.26
NB Accuracy rate 72.41 72.34 58.73
Error rate 27.59 27.66 41.27
Sensitivity 46.81 48.43 29.18
ROC 53.23 52.35 52.14
SVM Accuracy rate 72.41 72.34 58.73
Error rate 27.59 27.66 41.27
Sensitivity 76.94 75.71 63.42
ROC 95.14 93.94 92.97
DT Accuracy rate 72.41 72.34 58.73
Error rate 27.59 27.66 41.27
Sensitivity 72.56 72.53 58.73
ROC 99.79 99.77 100
Decision tree seems to over fit the data. Support Vector
Machine exhibited less reduction in specificity compared to
KNN and gave best results of over 90% for area under the
curve for ROC for all the other regions therefore supporting its
generalization potential which is appropriate for prediction in a
study like famine. All methods exhibited decrease in specificity
between 10 – 40% after training with data from the north
indicating loss in location specific characteristics except NB
which showed increase in specificity by approximately 50%
for eastern and western regions. Receiver operating
characteristics curves were plotted for central and western
regions after training with data from the north as shown in
Figure 4.
Figure 4. Relationship between false and true positive rates for central and
western regions after training.
Regions like western had the AUC increased by 7% with well
distributed AUC above 90% for SVM rendering it more
appropriate for decision makers to use it to determine the cut
off points for determination of food insecurity level in an area.
Five nearest neighbours were chosen in KNN algorithm since
this number lies between one and nine and was identified to
be the maximum number of neighbours that could be applied.
This helped to avoid the outliers by using a small number and
overfitting by using a large number of neighbours since the
specificity and AUC with these number of neighbours was
optimal. The effect of increasing the neighbours is given in
Table 2.
TABLE 2 PREDICTION PERFORMANCES AT DIFFERENT KNN VALUES
k-NN
(k = 1)
k-NN
(k=3)
k-NN
(k = 5)
k-NN
(k = 7)
k-NN
(k = 9)
Accuracy rate 80.00 80.00 80.00 80.00 80.00 Sensitivity 90.48 90.70 91.57 93.10 94.32
Specificity 55.56 52.94 54.05 45.45 40.63
AUC 56.83 57.49 57.55 52.43 54.14
The prediction performance shown in Table 2 indicates that
specificity and AUC increased as number of nearest
neighbours increased to a maximum of five neighbours.
Receiver operating characteristics values increased from
56.83% up to a maximum of 57.55% and thereafter
decreased to 52.43%. The accuracy rates which indicate the
number of training data instance that were correctly
classified was constant for all the neighbours.
Attempt to predict by regions using multi label classification
on combined dataset showed very appreciable sensitivity
(more than 65% ) indicating better chances to correctly
identify origin of data by regions as indicated in Table 3.
TABLE 3
RESULTS OF MULTI LABEL CLASSIFICATION
Northern Eastern Central Western
Accuracy rate 0.7695 0.6005 0.6138 0.5472 Error rate 0.2305 0.3995 0.3862 0.4528
Sensitivity 0.1557 0.2857 0.2417 0.3035 Specificity 0.8659 0.7227 0.7409 0.6644
Eastern region class were in some cases predicted as
northern and western as central. This could have been due to
proximity in agro ecological zones in addition to similarity in
socio-economic constraints and effect of adverse weather
conditions during the years when the data was collected.
Comparing all the regions, northern had the best prediction
as exhibited in accuracy rate (76.95%) , error rate (23.05%)
and specificity (86.55%) however with least sensitivity
(15.57%) since some of its data is classified as originating
from the eastern region.
B. Visualization of Classification
Results from visualization of the classes into the feature
space on two features of dietary energy intake and size of
household is displayed in Figure 5.
Visualization demonstrated how the training and testing
datasets can be separated into feature space with
corresponding known and predicted classes to establish
interesting patterns. The trained dataset fitted within the
training dataset indicating suitability of ML in prediction of
famine.
Proceedings of the World Congress on Engineering 2011 Vol II WCE 2011, July 6 - 8, 2011, London, U.K.
ISBN: 978-988-19251-4-5 ISSN: 2078-0958 (Print); ISSN: 2078-0966 (Online)
WCE 2011
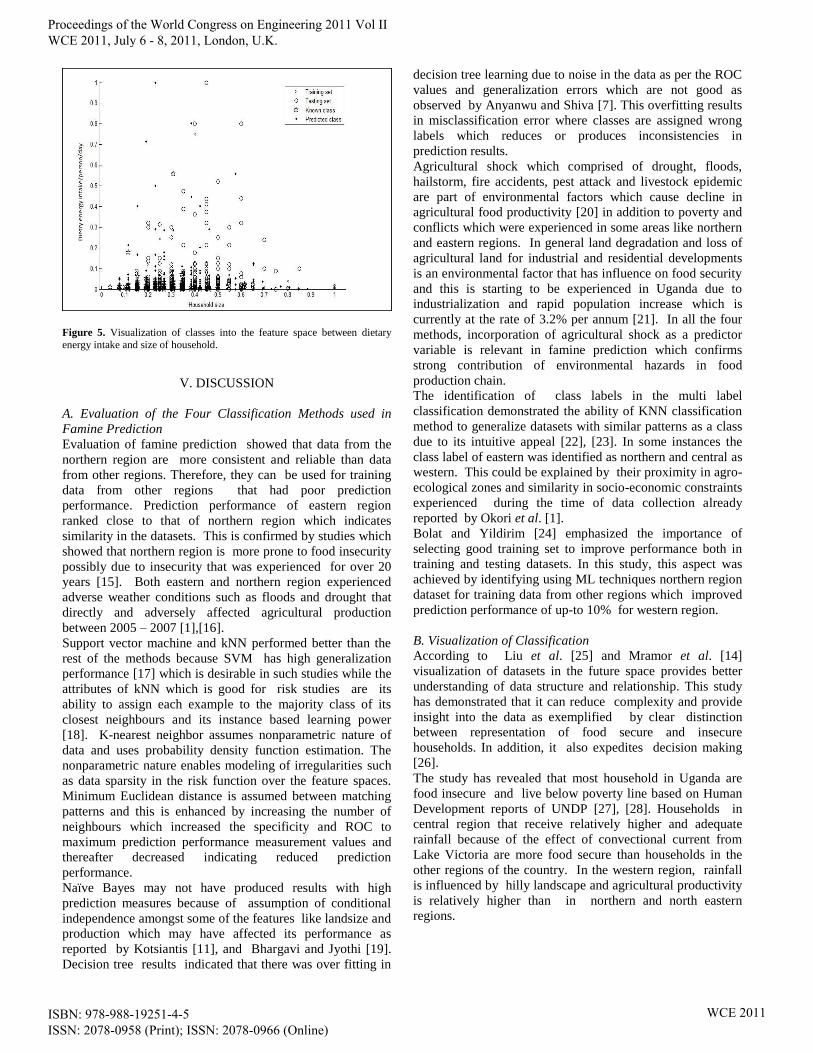
Figure 5. Visualization of classes into the feature space between dietary
energy intake and size of household.
V. DISCUSSION
A. Evaluation of the Four Classification Methods used in
Famine Prediction
Evaluation of famine prediction showed that data from the
northern region are more consistent and reliable than data
from other regions. Therefore, they can be used for training
data from other regions that had poor prediction
performance. Prediction performance of eastern region
ranked close to that of northern region which indicates
similarity in the datasets. This is confirmed by studies which
showed that northern region is more prone to food insecurity
possibly due to insecurity that was experienced for over 20
years [15]. Both eastern and northern region experienced
adverse weather conditions such as floods and drought that
directly and adversely affected agricultural production
between 2005 – 2007 [1],[16].
Support vector machine and kNN performed better than the
rest of the methods because SVM has high generalization
performance [17] which is desirable in such studies while the
attributes of kNN which is good for risk studies are its
ability to assign each example to the majority class of its
closest neighbours and its instance based learning power
[18]. K-nearest neighbor assumes nonparametric nature of
data and uses probability density function estimation. The
nonparametric nature enables modeling of irregularities such
as data sparsity in the risk function over the feature spaces.
Minimum Euclidean distance is assumed between matching
patterns and this is enhanced by increasing the number of
neighbours which increased the specificity and ROC to
maximum prediction performance measurement values and
thereafter decreased indicating reduced prediction
performance.
Naïve Bayes may not have produced results with high
prediction measures because of assumption of conditional
independence amongst some of the features like landsize and
production which may have affected its performance as
reported by Kotsiantis [11], and Bhargavi and Jyothi [19].
Decision tree results indicated that there was over fitting in
decision tree learning due to noise in the data as per the ROC
values and generalization errors which are not good as
observed by Anyanwu and Shiva [7]. This overfitting results
in misclassification error where classes are assigned wrong
labels which reduces or produces inconsistencies in
prediction results.
Agricultural shock which comprised of drought, floods,
hailstorm, fire accidents, pest attack and livestock epidemic
are part of environmental factors which cause decline in
agricultural food productivity [20] in addition to poverty and
conflicts which were experienced in some areas like northern
and eastern regions. In general land degradation and loss of
agricultural land for industrial and residential developments
is an environmental factor that has influence on food security
and this is starting to be experienced in Uganda due to
industrialization and rapid population increase which is
currently at the rate of 3.2% per annum [21]. In all the four
methods, incorporation of agricultural shock as a predictor
variable is relevant in famine prediction which confirms
strong contribution of environmental hazards in food
production chain.
The identification of class labels in the multi label
classification demonstrated the ability of KNN classification
method to generalize datasets with similar patterns as a class
due to its intuitive appeal [22], [23]. In some instances the
class label of eastern was identified as northern and central as
western. This could be explained by their proximity in agro-
ecological zones and similarity in socio-economic constraints
experienced during the time of data collection already
reported by Okori et al. [1].
Bolat and Yildirim [24] emphasized the importance of
selecting good training set to improve performance both in
training and testing datasets. In this study, this aspect was
achieved by identifying using ML techniques northern region
dataset for training data from other regions which improved
prediction performance of up-to 10% for western region.
B. Visualization of Classification
According to Liu et al. [25] and Mramor et al. [14]
visualization of datasets in the future space provides better
understanding of data structure and relationship. This study
has demonstrated that it can reduce complexity and provide
insight into the data as exemplified by clear distinction
between representation of food secure and insecure
households. In addition, it also expedites decision making
[26].
The study has revealed that most household in Uganda are
food insecure and live below poverty line based on Human
Development reports of UNDP [27], [28]. Households in
central region that receive relatively higher and adequate
rainfall because of the effect of convectional current from
Lake Victoria are more food secure than households in the
other regions of the country. In the western region, rainfall
is influenced by hilly landscape and agricultural productivity
is relatively higher than in northern and north eastern
regions.
Proceedings of the World Congress on Engineering 2011 Vol II WCE 2011, July 6 - 8, 2011, London, U.K.
ISBN: 978-988-19251-4-5 ISSN: 2078-0958 (Print); ISSN: 2078-0966 (Online)
WCE 2011
VI. CONCLUSIONS AND RECOMMENDATIONS
The following conclusions and recommendations were
drawn.
A. Conclusions
Machine Learning techniques are well suited for prediction
of risks like famine since they can enhance classification
accuracy. Suitable training dataset is important in improving
prediction measurements while different classification
methods may perform differently on the same dataset.
B. Recommendations
We recommend that:
(i) The best dataset for training for famine prediction in
Uganda is from the northern and eastern
regions.
(ii) Satellite image and socio-economic data for specific
areas and periods need to be used in
combination to show the relationship in
prediction of food security.
(iii) Transfer learning techniques need to be explored for
prediction of famine and to determine its
contribution to improvement of classification
accuracy.
REFERENCES (1) W. Okori, J. Obua. and V. Baryamureeba, “Logit Analysis of Socio
Economic Factors Affecting Famine in Uganda,” Journal of Disaster
Research vol. 5, no. 2, pp 208 – 215, 2010. (2) Food and Agriculture Organization of the United Nations.
“Assessement of the World Food Security Situation,” Committee on
World Food Security, Rome, 2007. (3) E. Mwebaze, W. Okori and J. Quinn, “Causal Structure Learning for
Famine Prediction,” In Proc. of the Association for the Advancement
Artificial Intelligence (AAAI) Spring Symposium on Artificial Intelligence for Development, Technical Report SS-10-01, 2010.
(4) Y. Yohannes and P. Webb, “Classification and regression trees: A user
manual for identifying indicators of vulnerability to famine and chronic food insecurity,” International Food Policy Research Institute,
Washington, D.C. Mimeo, 1998.
(5) J. Zurada and R.M. Barker, “Using Memory-Based Reasoning For Predicting Default Rates On Consumer Loans,” Review of Business
Information Systems – Second Quarter, vol. 11, no. 1, 2007.
(6) W. Hand and V. Vinciotti, V., “Choosing k for Two-Class Nearest Neighbor Classifiers with Unbalanced Classes,” Pattern Recognition
Letters, Vol. 24, pp. 1555-1562, 2003. (7) M.N. Anyanwu and S. G. Shiva, “Comparative Analysis of Serial
Decision Tree Classification Algorithms,” International Journal of
Computer Science and Network Security, vol. 3, no. 3, pp. 230 – 240,
2009.
(8) Y. Cai, X. Liu, X. Xu and K. Chou, “Support vector machines for
predicting the specificity of GalNAc-transferase,” Elsevier- Peptides, vol. 23, pp. 205–208, 2002.
(9) V. Vapnik, The nature of statistical learning theory, New York:
Springer-Verlag, 1995. (10) M. Moradian and A. Baraani, “KNNBA: K-NEAREST-NEIGHBOR-
BASED-ASSOCIATION ALGORITHM”, Journal of Theoretical and
Applied Information Technology, vol. 6, no. 1, pp. 123-129, 2009. (11) S. B. Kotsiantis, “Supervised Machine Learning: A Review of
Classification Techniques,” Informatica, vol. 31, pp. 249 -268, 2007.
(12) Uganda Bureau of Statistics. Uganda National Household Survey 2005/2006, Report on the Agricultural Module, 2007.
(13) M. Ramaswami and M. Bhaskaran, “A study on feature selection
techniques in educational data mining,” Journal of Computing vol. no. 11, pp. 7-11, 2009.
(14) M. Mramor, G. Leban, J. Demsar and B. Zupan, “Visualization-based
cancer microarray data classification analysis,” Bioinformatics, vol. 23, no. 16, pp. 2147-2154, 2007.
(15) W. Okori, J. Obua and V. Baryamureeba, “Famine Disaster Causes and
Management Based on Local Community‟s Perception in Northern Uganda,” Journal of Social Sciences, vol. 4, pp. 21 -32, 2009.
(16) National Environment Management Authority, State of the
environment report for Uganda, 2007. (17) S. S. Keerthi, O. Chapelle and D. DeCoste, “Building Support Vector
Machines with Reduced Classifier Complexity,” Journal of Machine
Learning Research, vol. 7, pp. 1493–1515, 2006. (18) B. Zhang and W. Zuo, “ Reliable Negative Extracting Based on kNN
for Leraning from Positive and Unlabeled Examples,” Journal of
Computers, vol. 4, no. 1, pp. 94-101, 2009. (19) P. Bhargavi and S. Jyothi, “Applying Naive Bayes Data Mining
Technique for Classification ofAgricultural Land Soils,” International
Journal of Computer Science and Network Security vol. 9, no. 8, pp. 117 – 122, 2009.
(20) Food and Agriculture Organization of the United Nations. Food
insecurity in the Horn of Africa, Rome, Italy, 2010. (21) World Bank, “Republic of Uganda - Annual progress report of poverty
reduction strategy and joint IDA-IMF staff advisory note,” World
Bank Publication, Washington, 2008. (22) M. R. Hassan, M. M. Hossain, J. Bailey and K. Ramamohanarao,
“Improving k-Nearest Neighbour Classification with Distance
Functions Based on Receiver Operating Characteristics,” in Lecture Notes In Artificial Intelligence - Springer-Verlag , vol. 5211, pp. 489 –
504, 2008. (23) T. M. Cover and P.E. Hart, ``Nearest neighbor pattern classification,''
IEEE Transactions on Information Theory, vol. IT-13, pp. 21-27,
1967. (24) B. Bolat and T. Yildirim, “A Data Selection Method for Probabilistic
Neural Networks,” Journal of Electrical and Electronics Engineering,
vol. 4, no. 2, pp. 1137-1140, 2004. (25) K. Liu, D. Zhou and X. Zhou, “Clustering by Ordering Density-Based
Subspaces,” In Proc. of International Workshop on Visual Data
Mining, pp. 1-9, 2002. (26) A. Heijs, “Visualization of Statistical and Text Mining Results from
Large Document Collections,” In Proc. of ICIC Conference, 2009.
(27) United Nations Development Program, UNDP Uganda Newsletters, Quarterly Report, pp. 1 -20, 2008.
(28) United Nations Development Program, Human Development Report .
14-118, 2009.
Proceedings of the World Congress on Engineering 2011 Vol II WCE 2011, July 6 - 8, 2011, London, U.K.
ISBN: 978-988-19251-4-5 ISSN: 2078-0958 (Print); ISSN: 2078-0966 (Online)
WCE 2011