Embed Size (px)
Citation preview
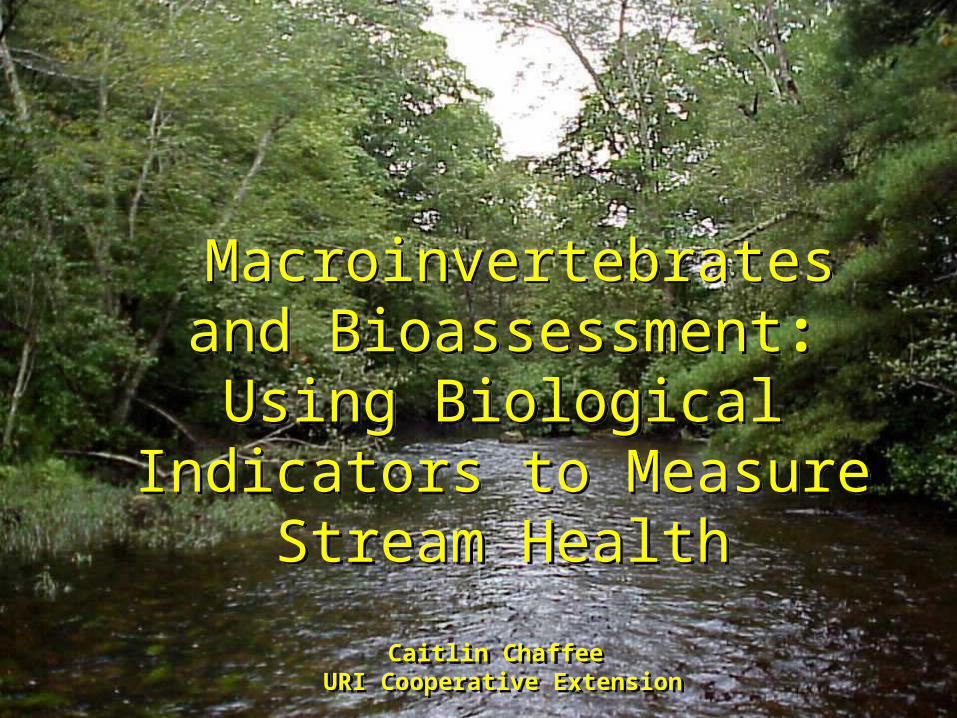
Macroinvertebrates and Bioassessment: Using Biological Indicators to Measure Stream Health
Caitlin Chaffee URI Cooperative Extension
Macroinvertebrates and Bioassessment: Using Biological Indicators to Measure Stream Health
Caitlin Chaffee URI Cooperative Extension
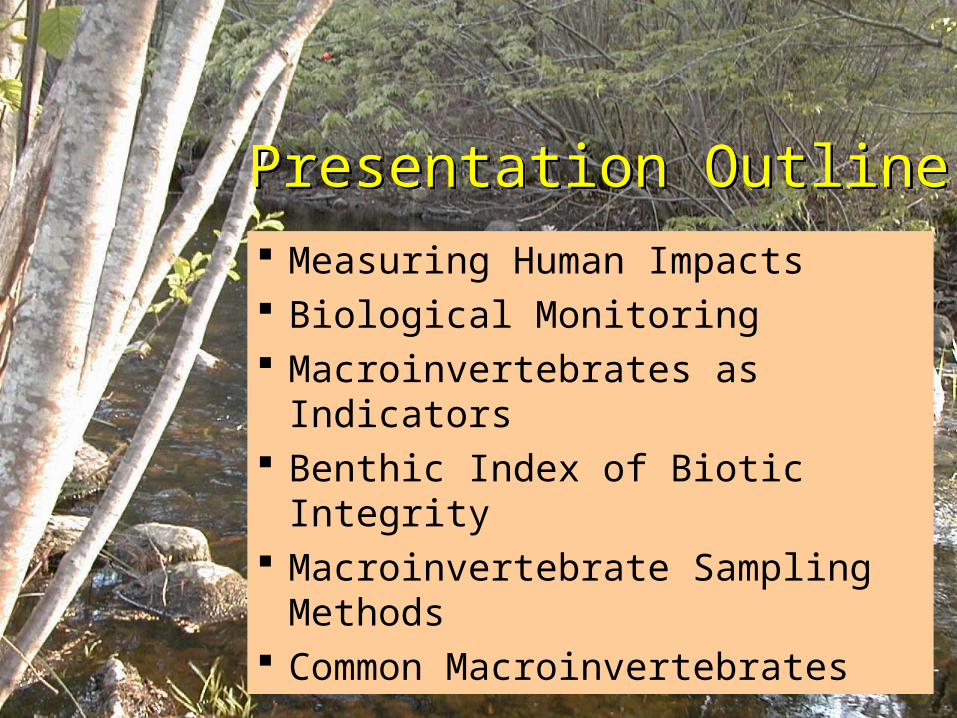
Presentation OutlinePresentation Outline Measuring Human Impacts Biological Monitoring Macroinvertebrates as
Indicators Benthic Index of Biotic Integrity Macroinvertebrate Sampling
Methods Common Macroinvertebrates
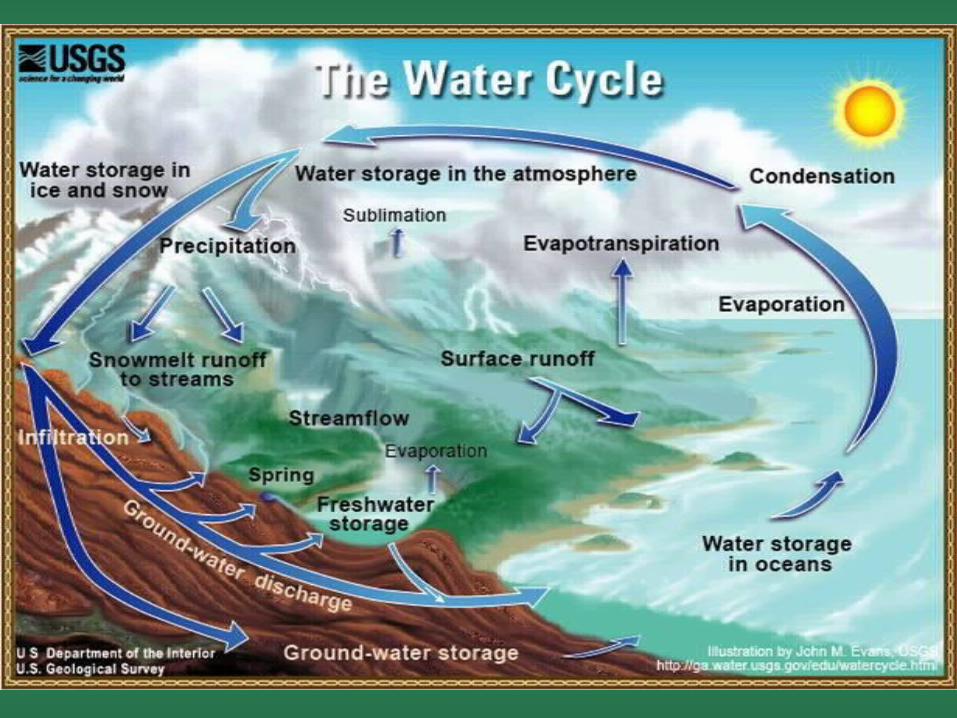
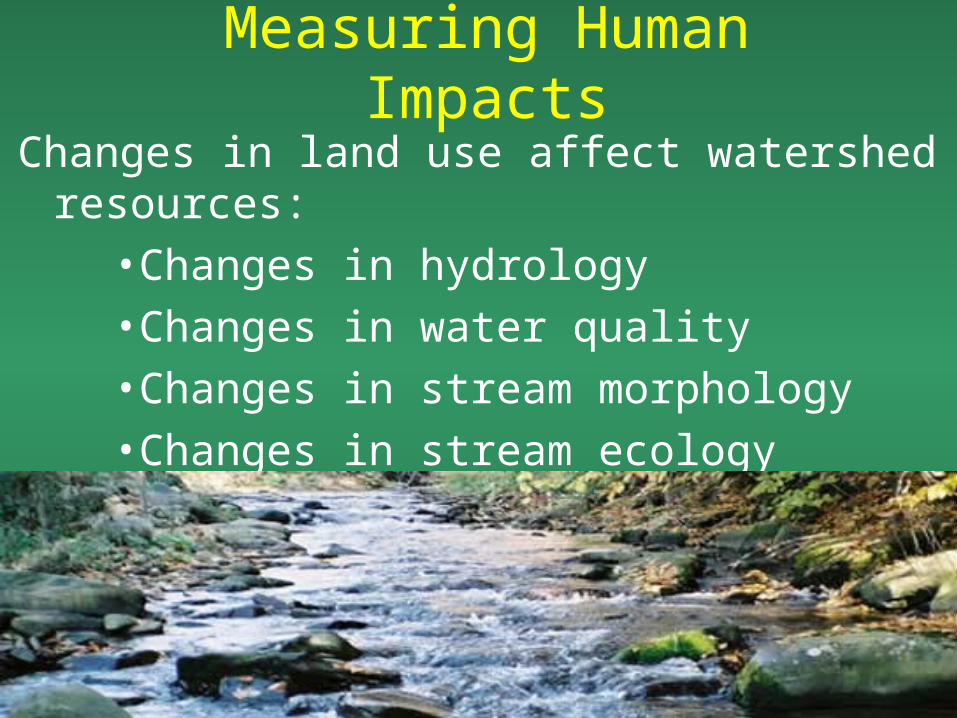
Measuring Human ImpactsChanges in land use affect watershed
resources:•Changes in hydrology•Changes in water quality •Changes in stream morphology•Changes in stream ecology
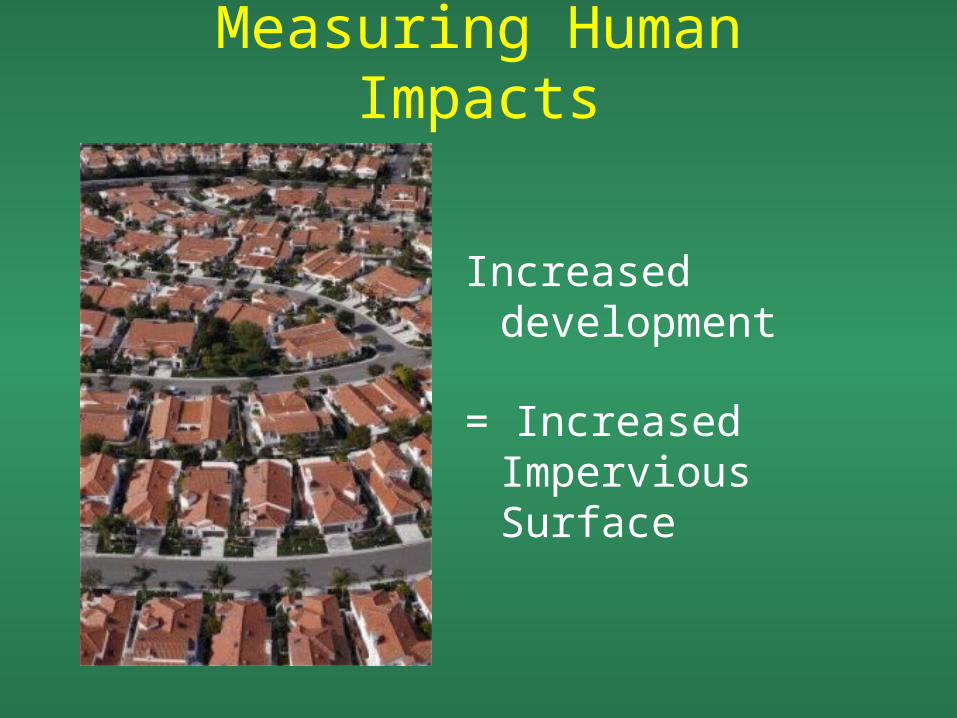
Measuring Human Impacts
Increased development
= Increased Impervious Surface
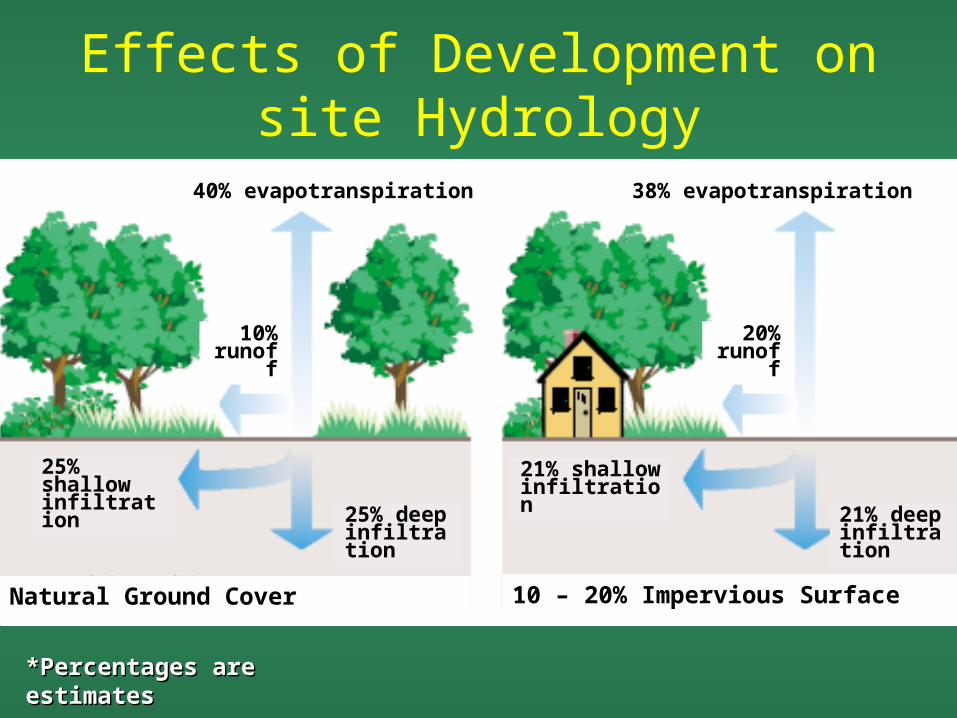
40% evapotranspiration 38% evapotranspiration
10% runoff
20% runoff
25% shallow infiltration
21% shallow infiltration
25% deep infiltration
21% deep infiltration
Natural Ground Cover 10 – 20% Impervious Surface
Effects of Development on site Hydrology
*Percentages are estimates*Percentages are estimates
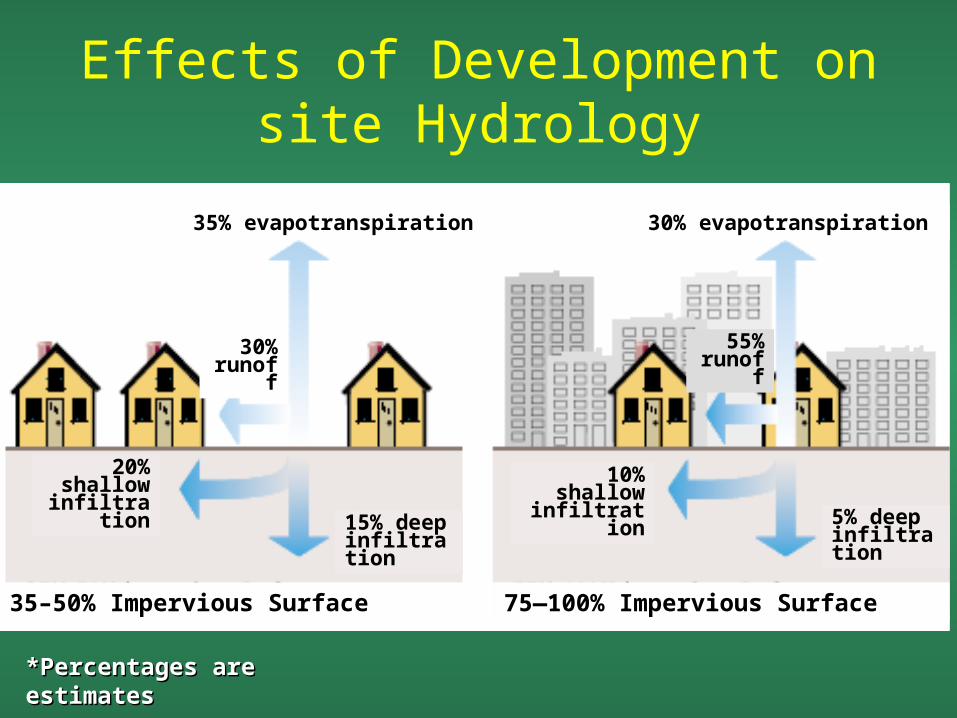
35% evapotranspiration 30% evapotranspiration
30% runoff
55% runoff
20% shallow
infiltration10%
shallow infiltration
15% deep infiltration
5% deep infiltration
35–50% Impervious Surface 75—100% Impervious Surface
Effects of Development on site Hydrology
*Percentages are estimates*Percentages are estimates
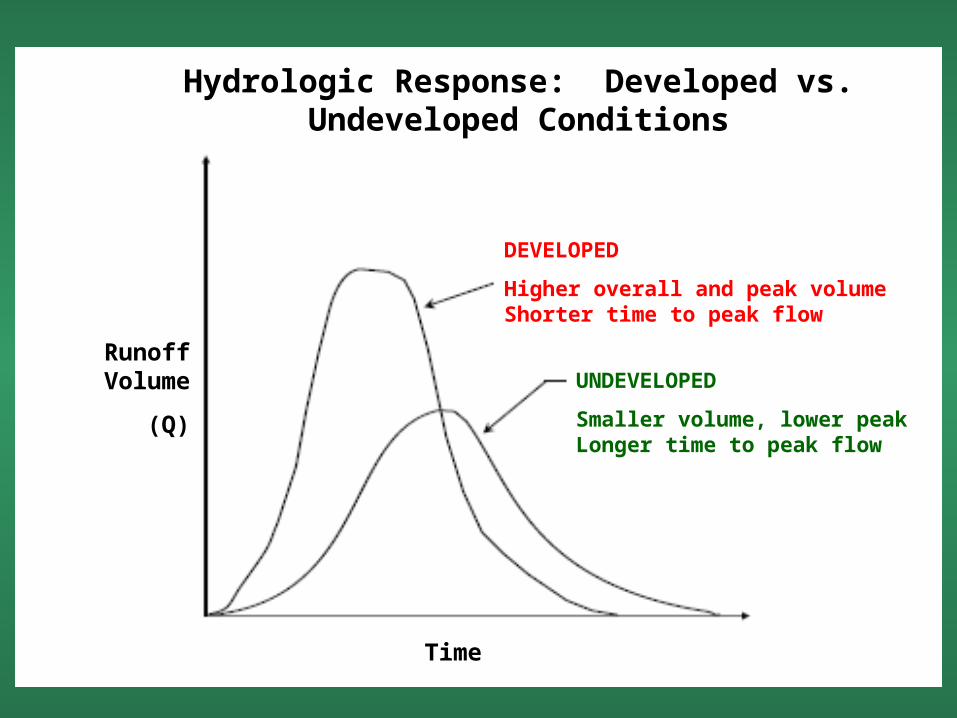
WHAT DOES THIS WHAT DOES THIS MEAN???MEAN???
More runoff in a shorter More runoff in a shorter amount of timeamount of time
DEVELOPED
Higher overall and peak volumeShorter time to peak flow
UNDEVELOPED
Smaller volume, lower peakLonger time to peak flow
Hydrologic Response: Developed vs. Undeveloped Conditions
Runoff Volume
(Q)
Time
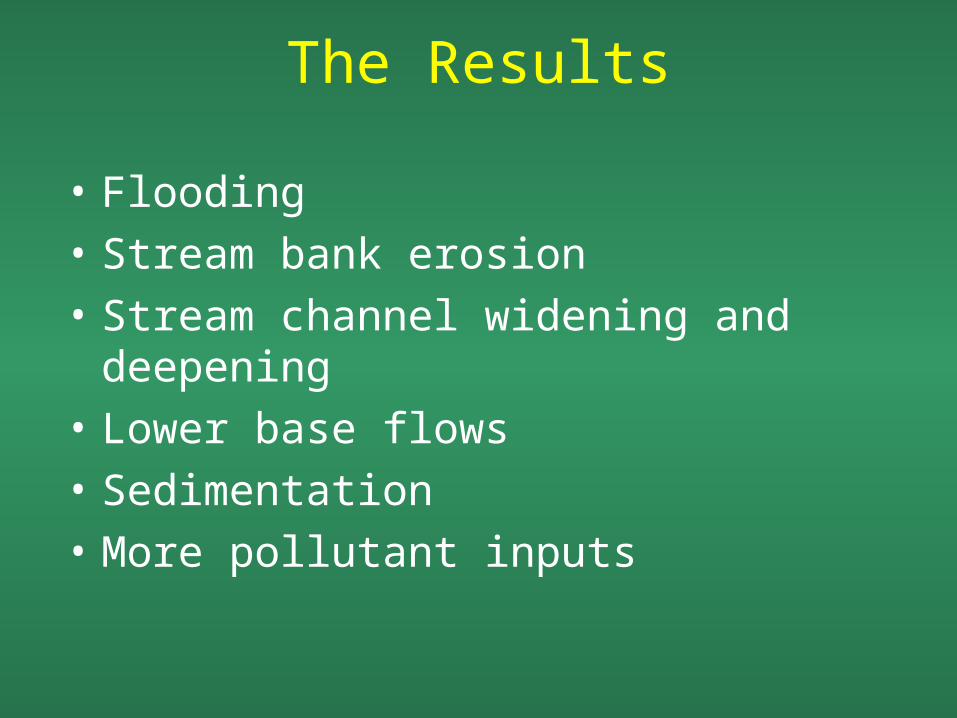
The Results
• Flooding• Stream bank erosion• Stream channel widening and
deepening• Lower base flows • Sedimentation• More pollutant inputs
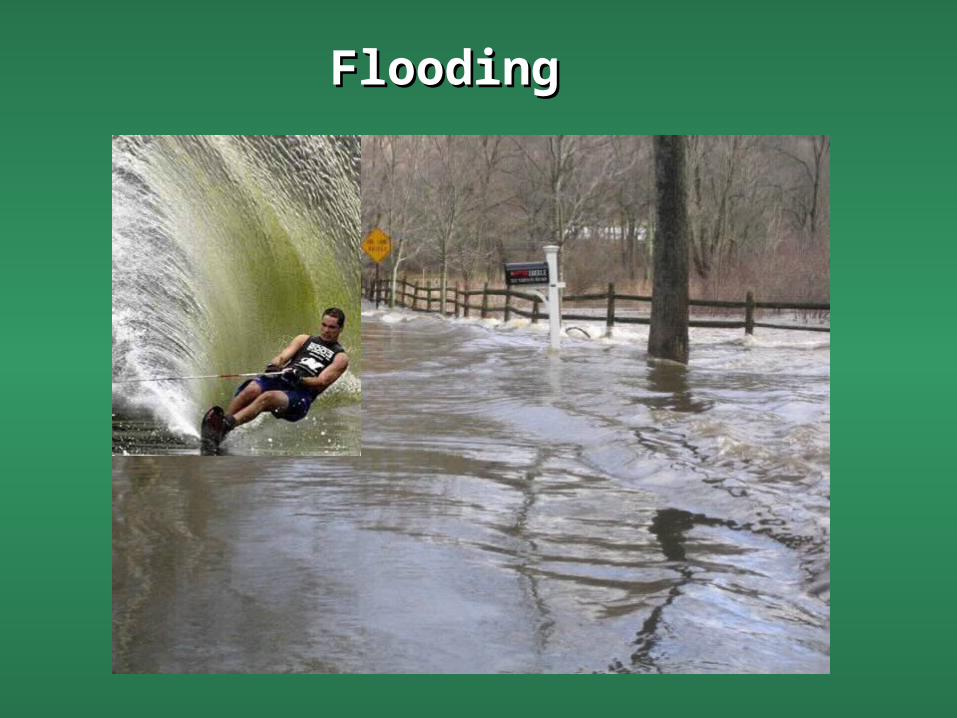
Flooding Flooding
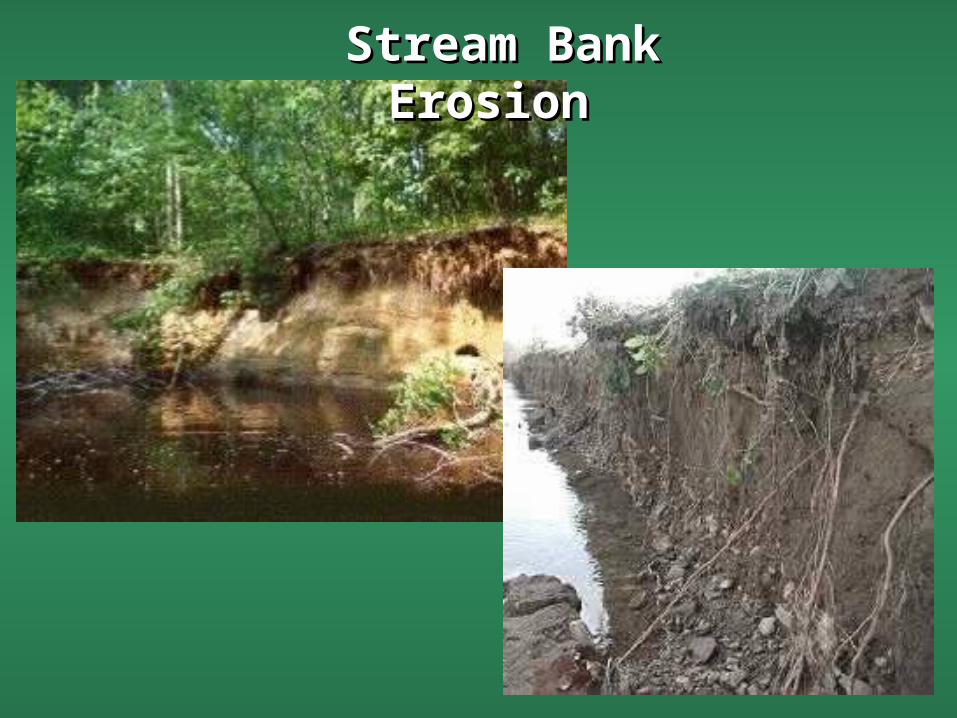
Stream Bank Erosion Stream Bank Erosion
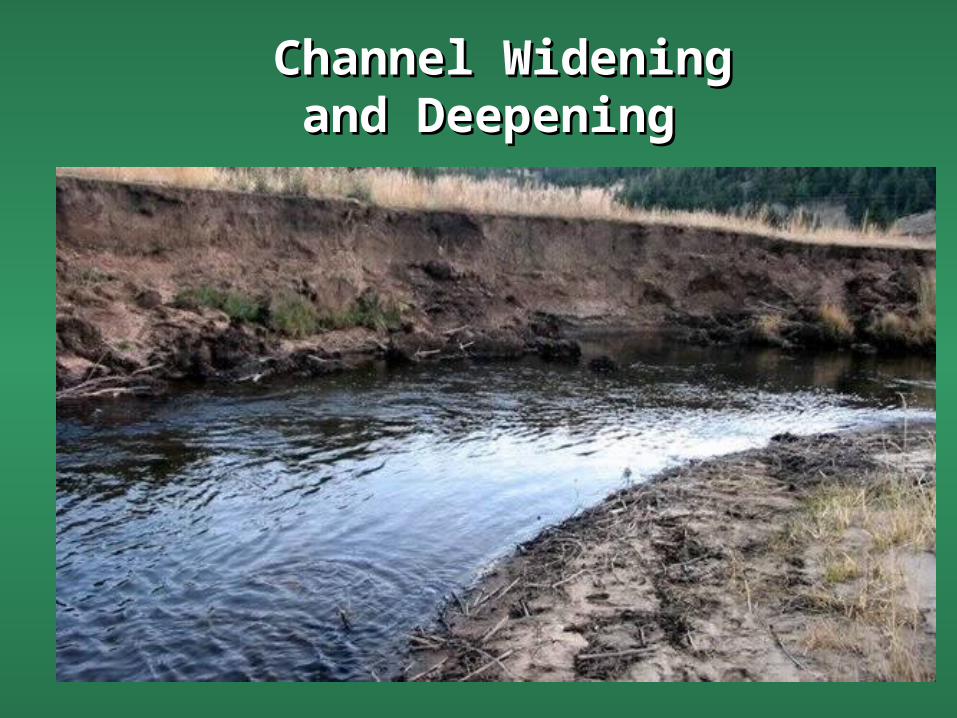
Channel Widening Channel Widening and Deepening and Deepening
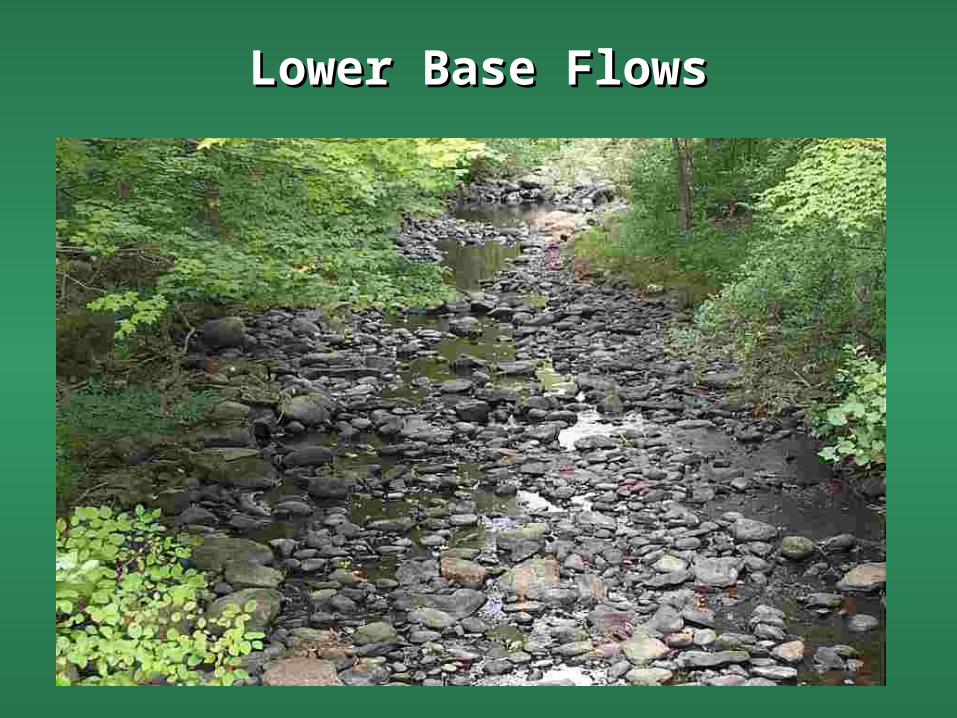
Lower Base FlowsLower Base Flows
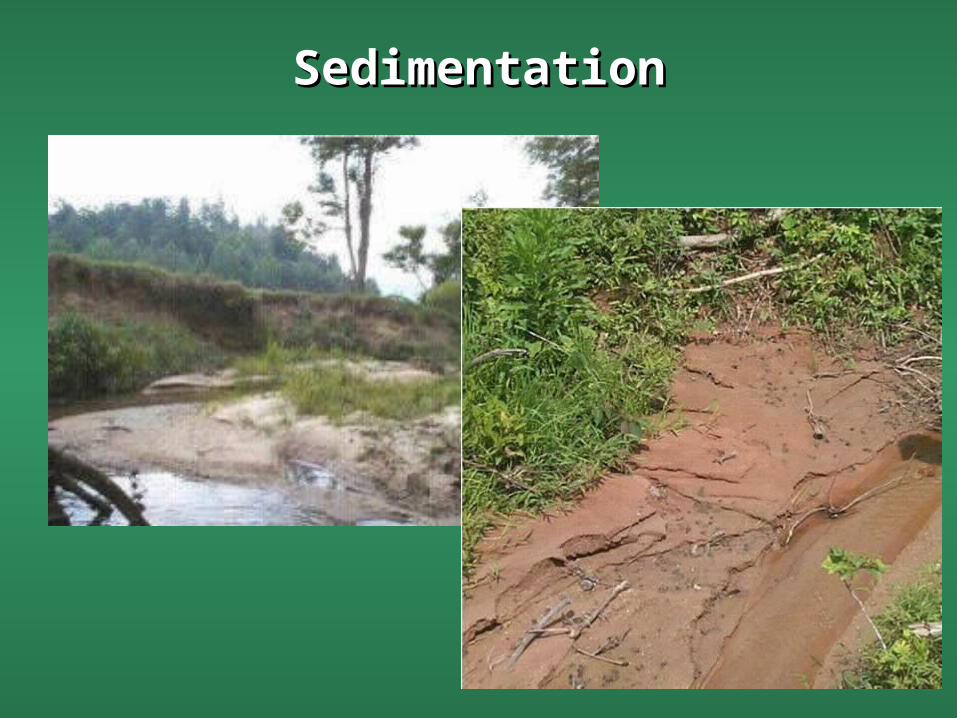
SedimentationSedimentation
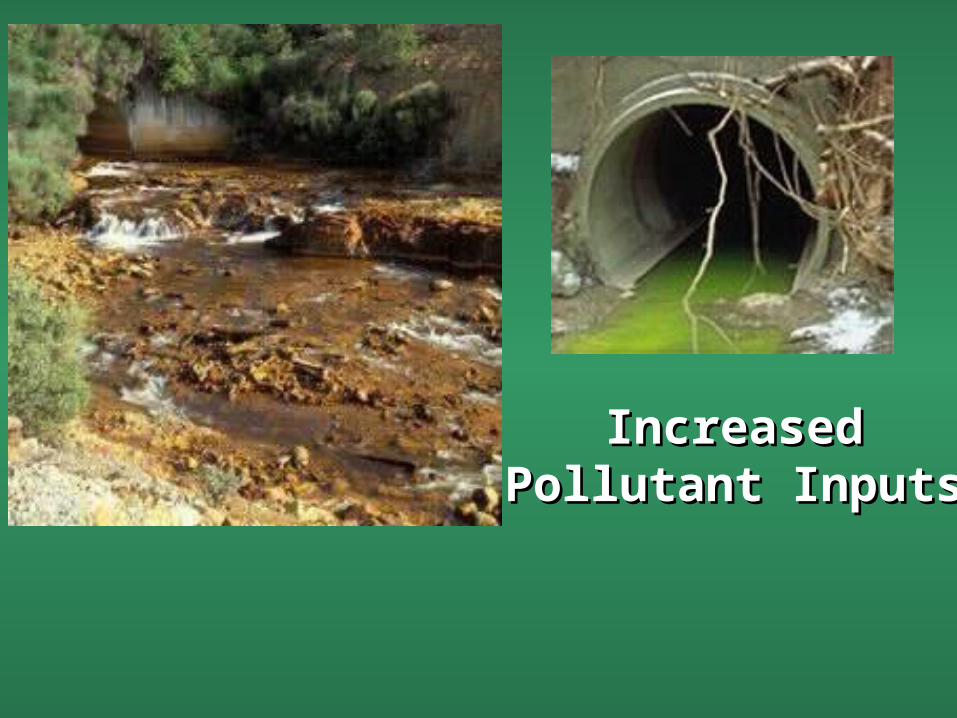
Increased Pollutant Increased Pollutant InputsInputs
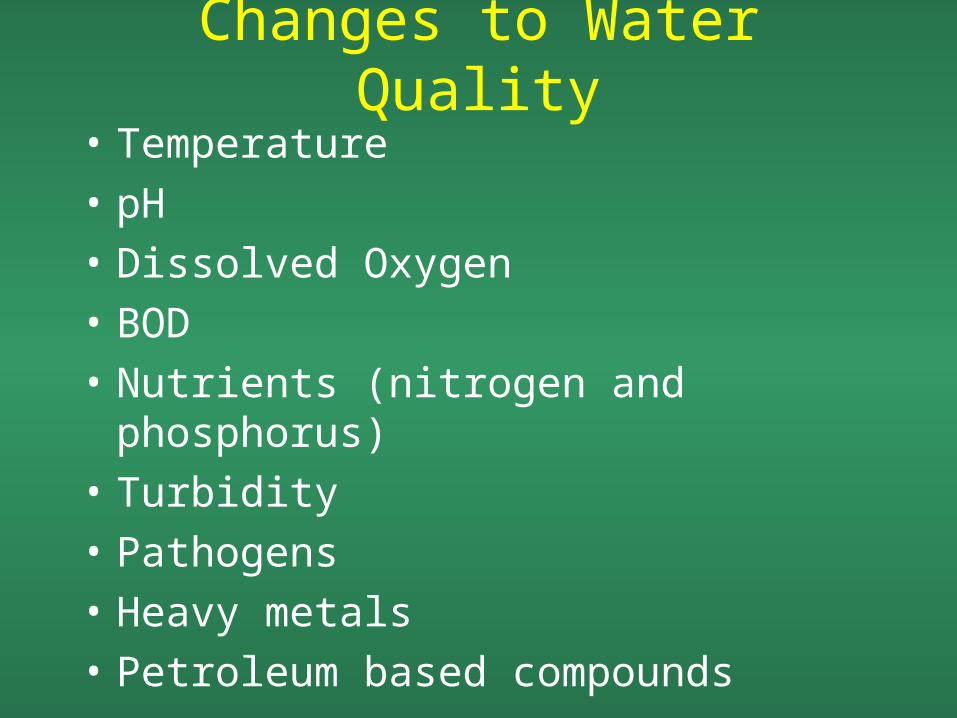
Changes to Water Quality• Temperature• pH• Dissolved Oxygen• BOD • Nutrients (nitrogen and
phosphorus)• Turbidity• Pathogens• Heavy metals• Petroleum based compounds
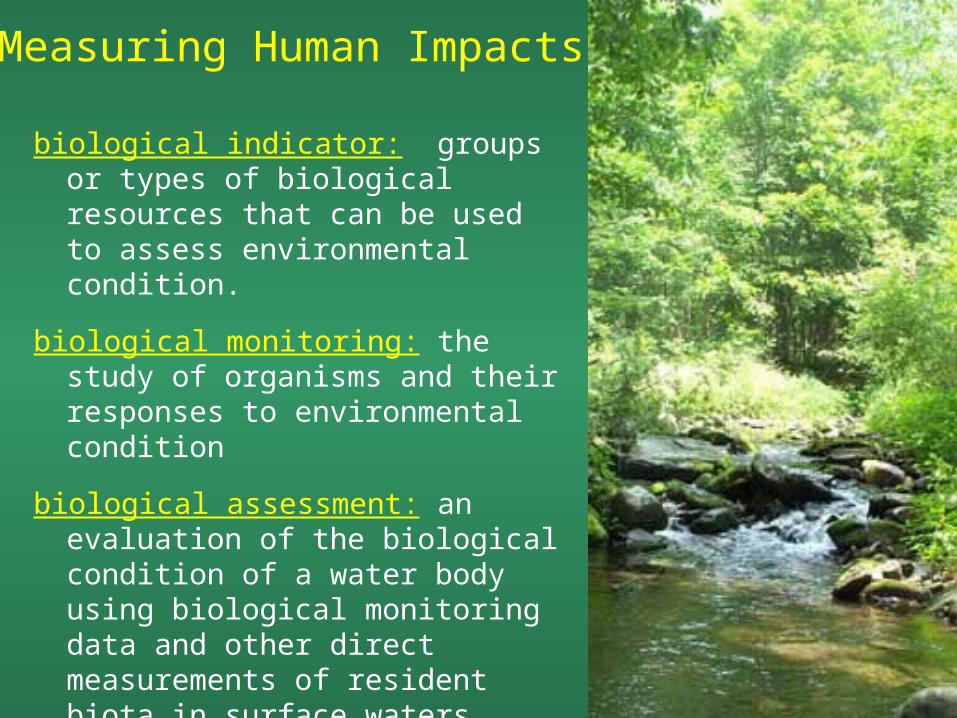
biological indicator: groups or types of biological resources that can be used to assess environmental condition.
biological monitoring: the study of organisms and their responses to environmental condition
biological assessment: an evaluation of the biological condition of a water body using biological monitoring data and other direct measurements of resident biota in surface waters
Measuring Human Impacts
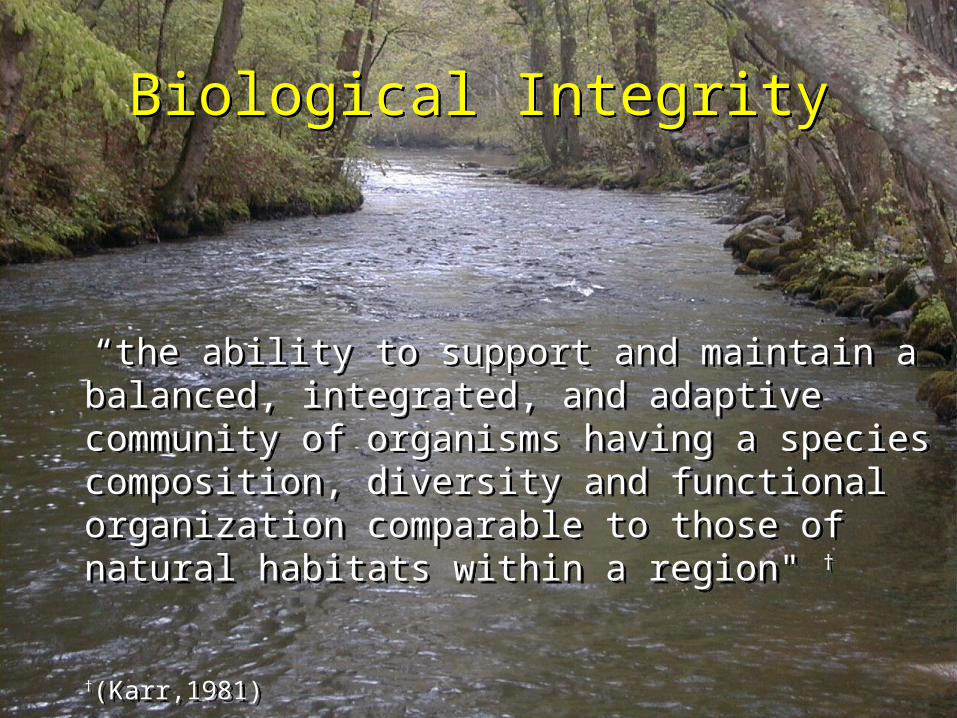
Biological IntegrityBiological Integrity
“the ability to support and maintain a balanced, integrated, and adaptive community of organisms having a species composition, diversity and functional organization comparable to those of natural habitats within a region" †
†(Karr,1981)
“the ability to support and maintain a balanced, integrated, and adaptive community of organisms having a species composition, diversity and functional organization comparable to those of natural habitats within a region" †
†(Karr,1981)
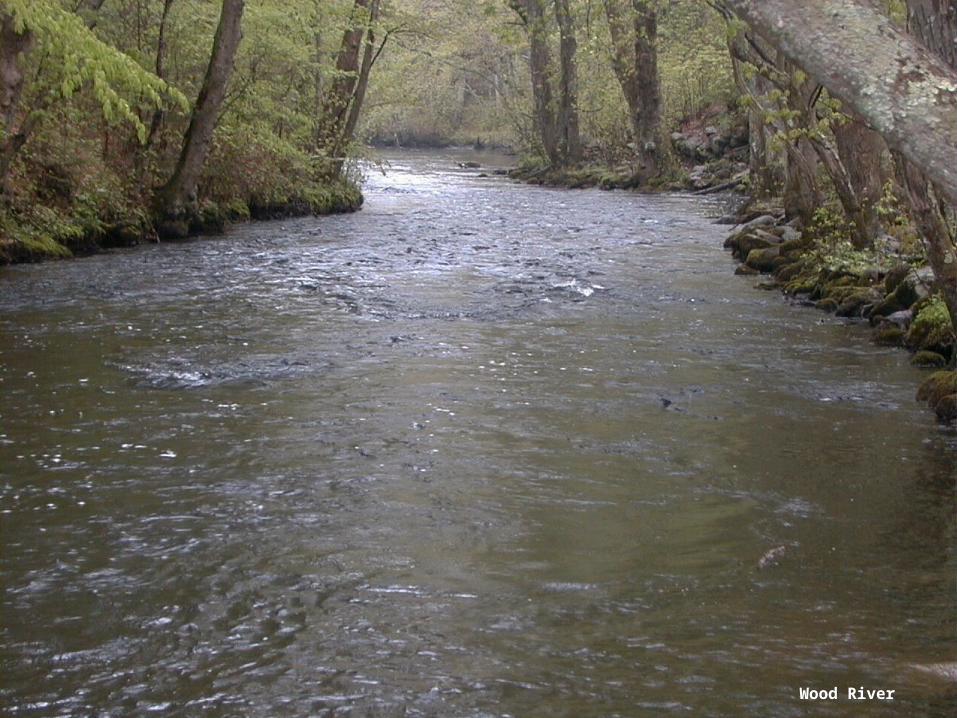
Wood River
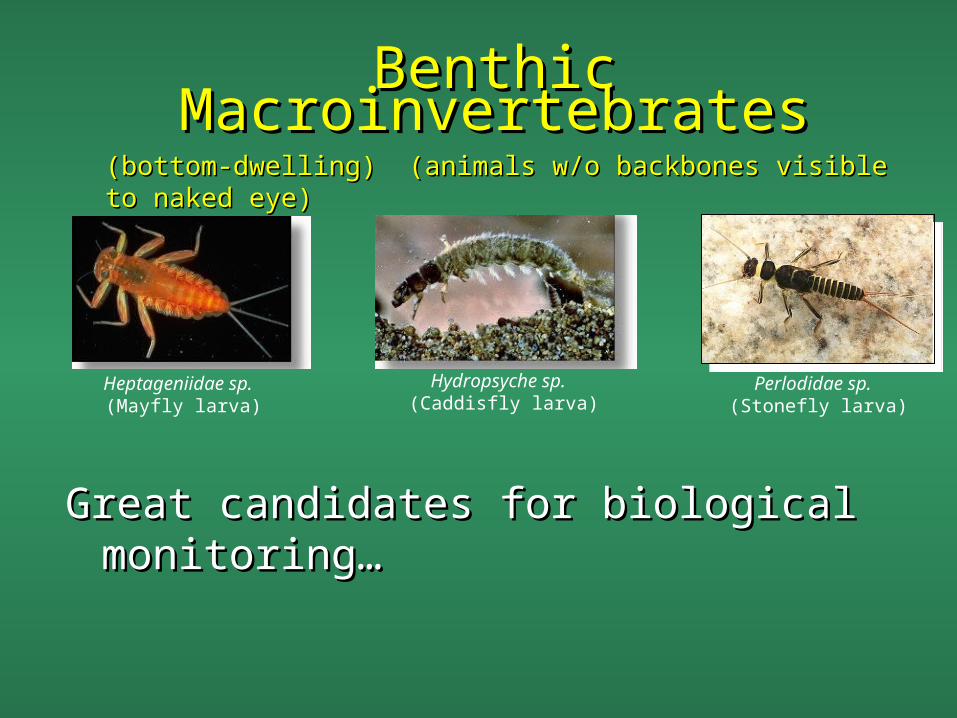
Great candidates for biological Great candidates for biological monitoring…monitoring…
Benthic Benthic MacroinvertebratesMacroinvertebrates
Heptageniidae sp. (Mayfly larva)
Hydropsyche sp. (Caddisfly larva)
Perlodidae sp. (Stonefly larva)
(bottom-dwelling)(bottom-dwelling) (animals w/o backbones visible to naked (animals w/o backbones visible to naked eye)eye)
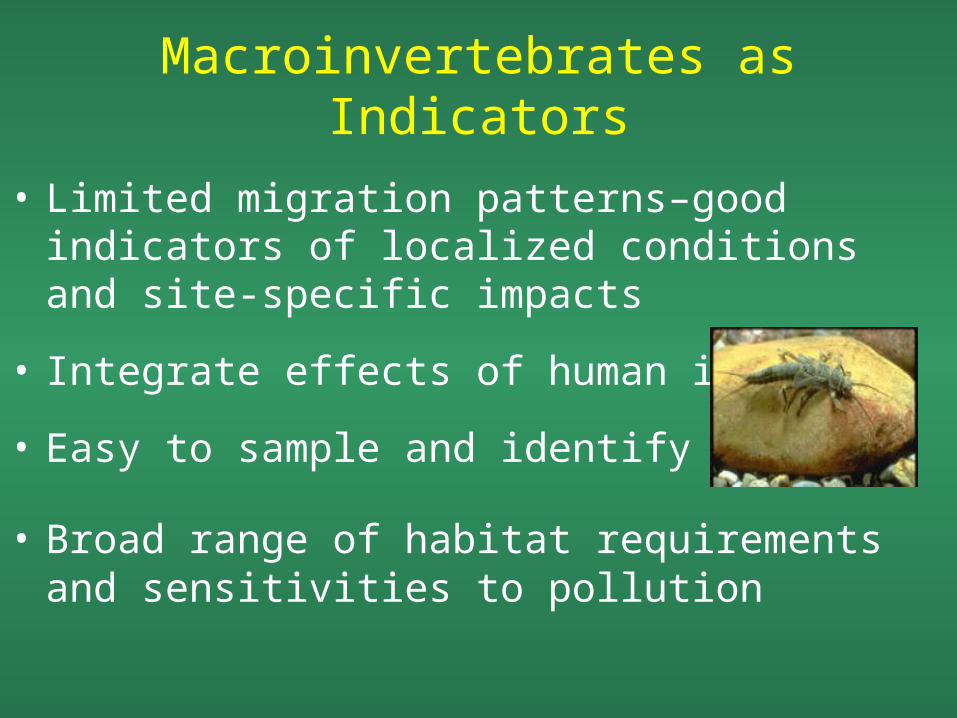
Macroinvertebrates as Indicators
• Limited migration patterns–good indicators of localized conditions and site-specific impacts
• Integrate effects of human impacts
• Easy to sample and identify
• Broad range of habitat requirements and sensitivities to pollution
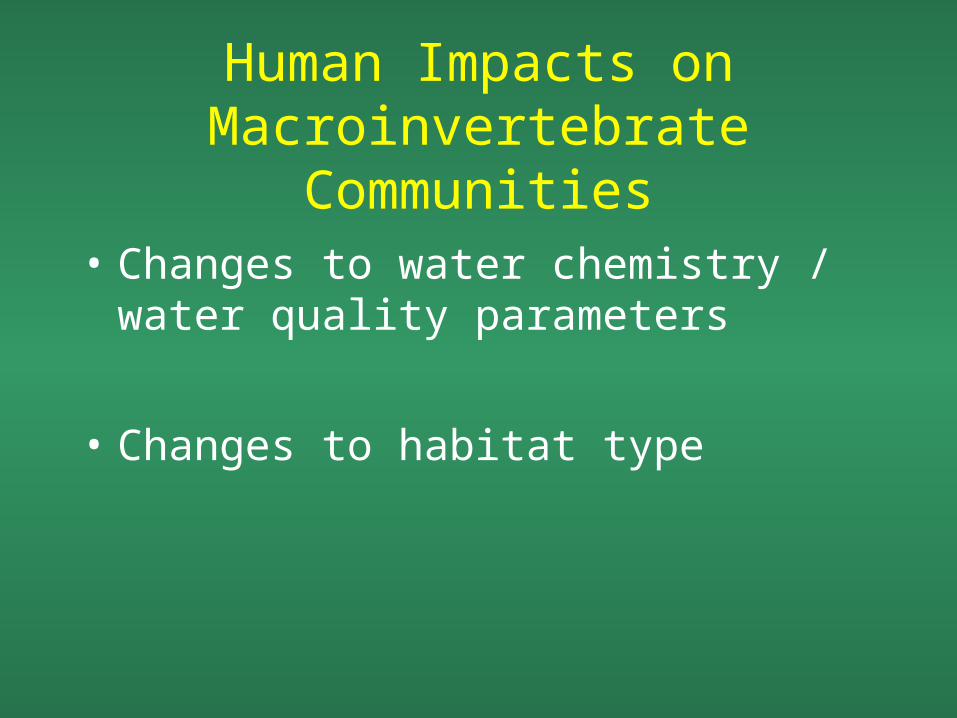
Human Impacts on Macroinvertebrate
Communities• Changes to water chemistry /
water quality parameters
• Changes to habitat type
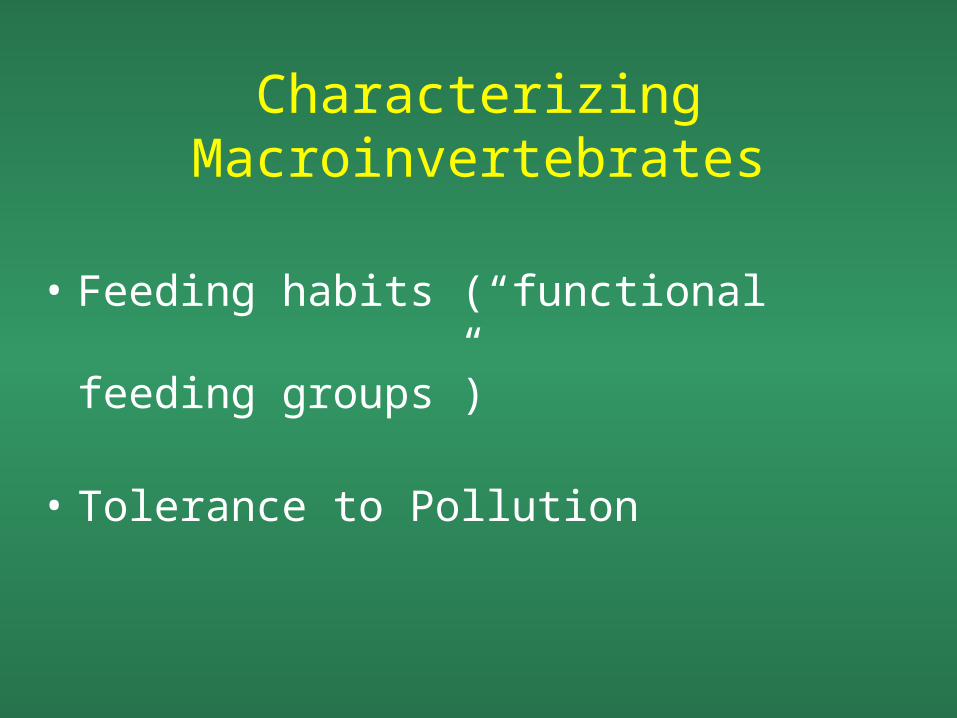
Characterizing Macroinvertebrates
• Feeding habits (“functional feeding
groups”)
• Tolerance to Pollution
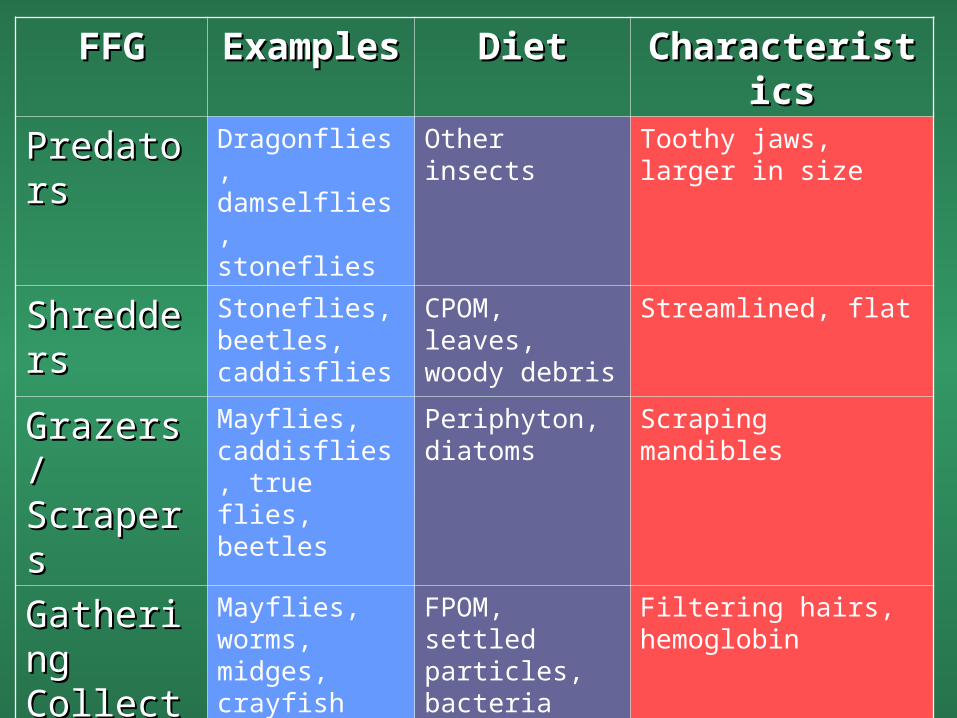
FFGFFG ExampleExampless
DietDiet CharacteristiCharacteristicscs
PredatorPredatorss
Dragonflies, damselflies, stoneflies
Other insects Toothy jaws, larger in size
ShredderShredderss
Stoneflies, beetles, caddisflies
CPOM, leaves, woody debris
Streamlined, flat
Grazers / Grazers / ScrapersScrapers
Mayflies, caddisflies, true flies, beetles
Periphyton, diatoms
Scraping mandibles
GatherinGathering g CollectorCollectorss
Mayflies, worms, midges, crayfish
FPOM, settled particles, bacteria
Filtering hairs, hemoglobin
Filtering Filtering CollectorCollectorss
Black flies, net-spinning caddisflies, mayflies
FPOM, phytoplankton, floating particles
Some build cases (caddisflies)
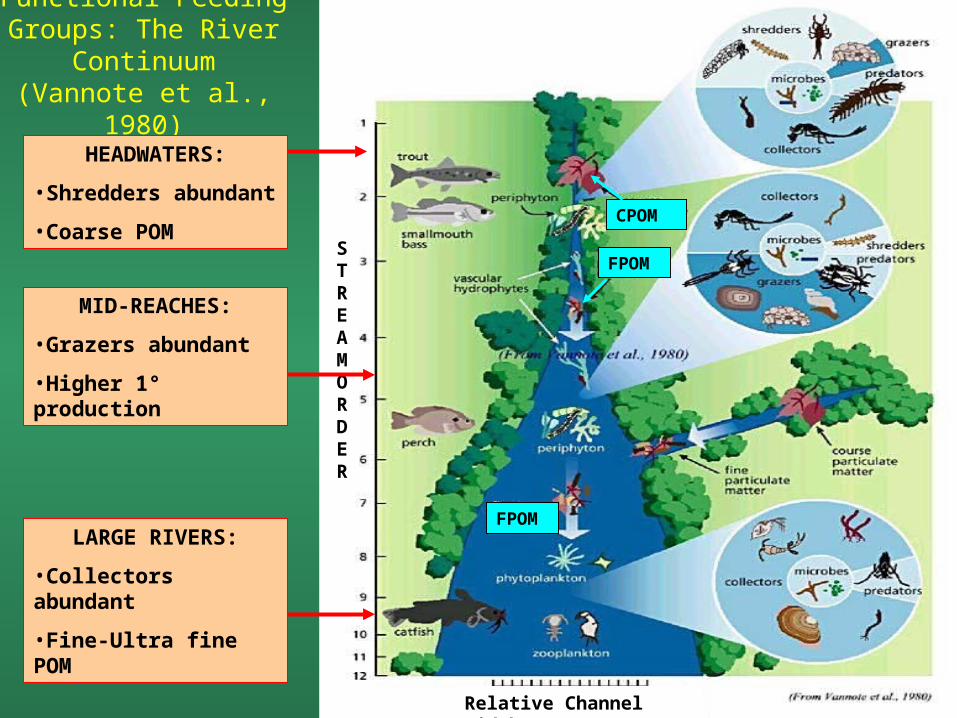
Functional Feeding Groups: The River
Continuum(Vannote et al., 1980)
CPOM
FPOM
FPOM
STREAM ORDER
Relative Channel Width
HEADWATERS:
•Shredders abundant
•Coarse POM
MID-REACHES:
•Grazers abundant
•Higher 1° production
LARGE RIVERS:
•Collectors abundant
•Fine-Ultra fine POM
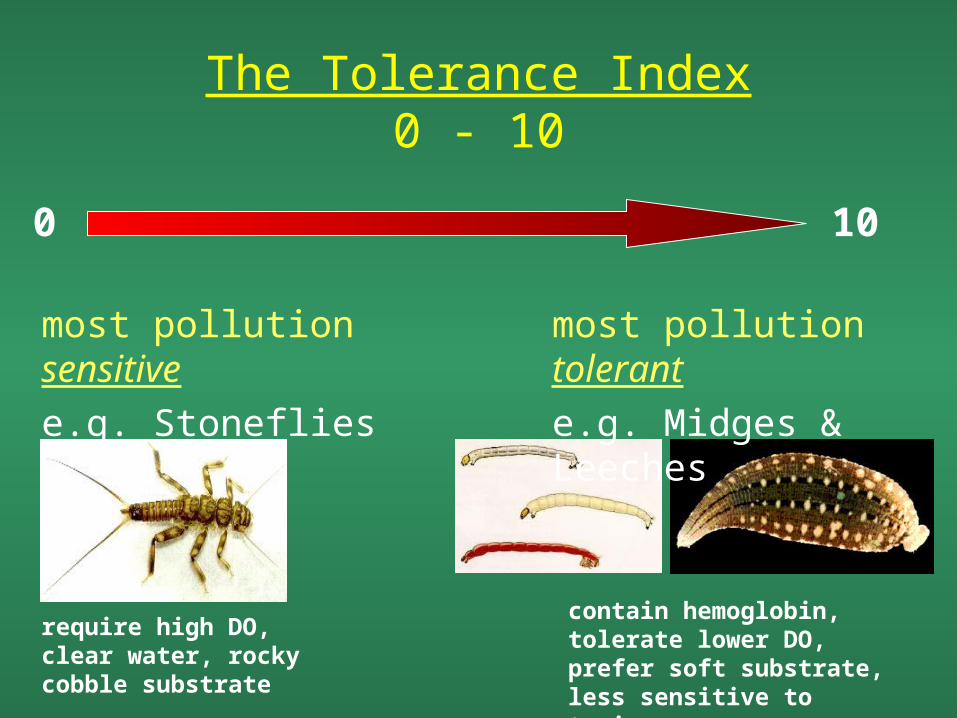
The Tolerance Index0 - 10
most pollution sensitive
e.g. Stoneflies
0 10
most pollution tolerant
e.g. Midges & Leeches
require high DO, clear water, rocky cobble substrate
contain hemoglobin, tolerate lower DO, prefer soft substrate, less sensitive to toxins
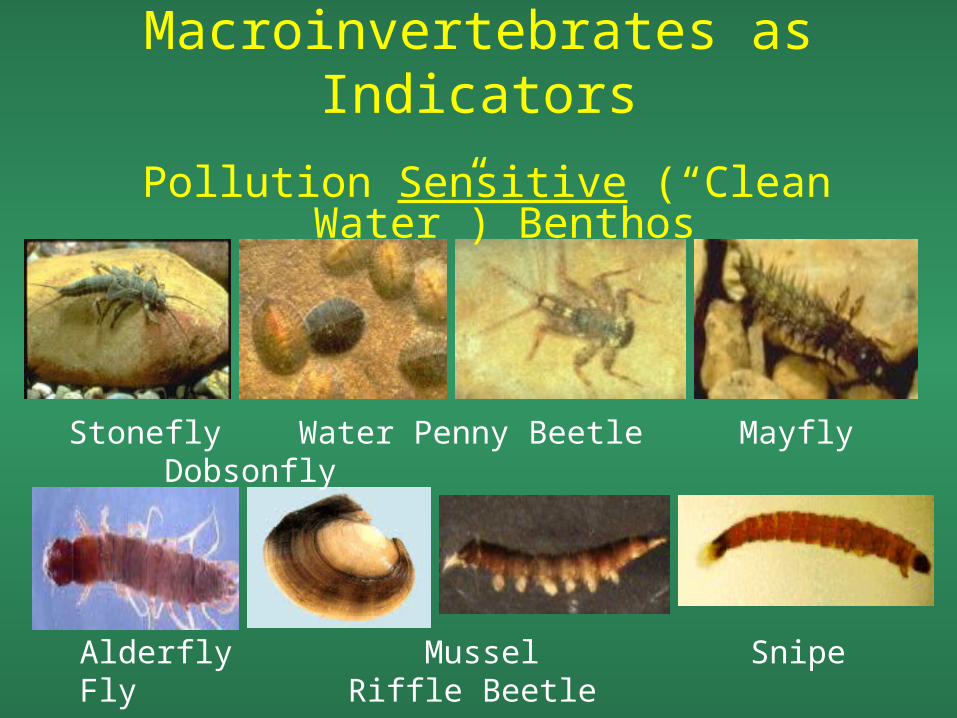
Stonefly Water Penny Beetle Mayfly Dobsonfly
Alderfly Mussel Snipe Fly Riffle Beetle
Macroinvertebrates as Indicators
Pollution Sensitive (“Clean Water”) Benthos
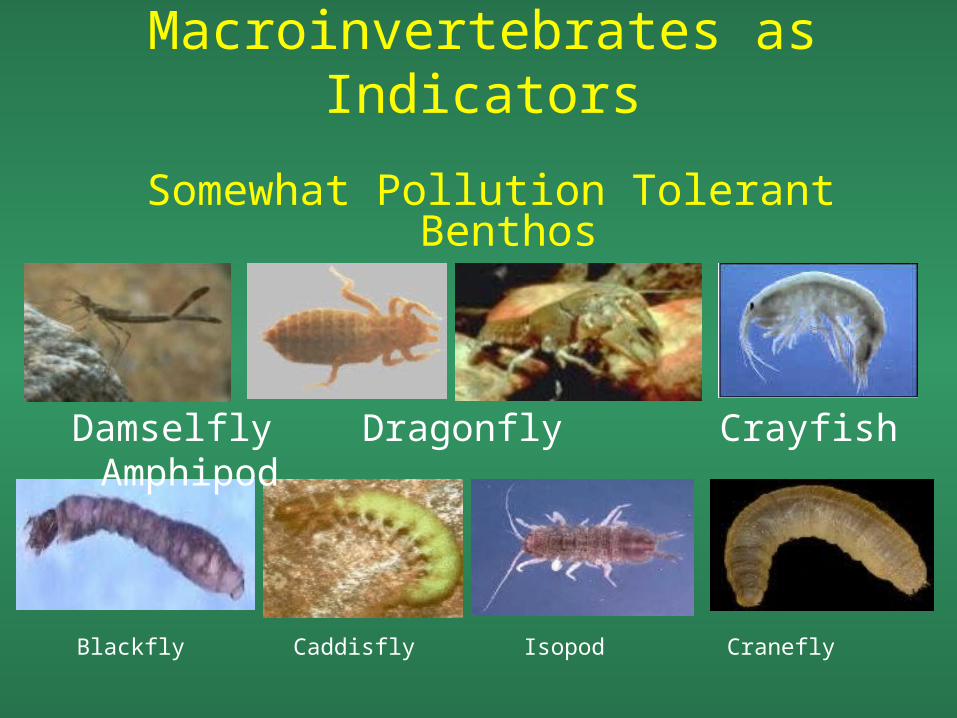
Macroinvertebrates as Indicators
Blackfly Caddisfly Isopod Cranefly
Damselfly Dragonfly Crayfish Amphipod
Somewhat Pollution Tolerant Benthos
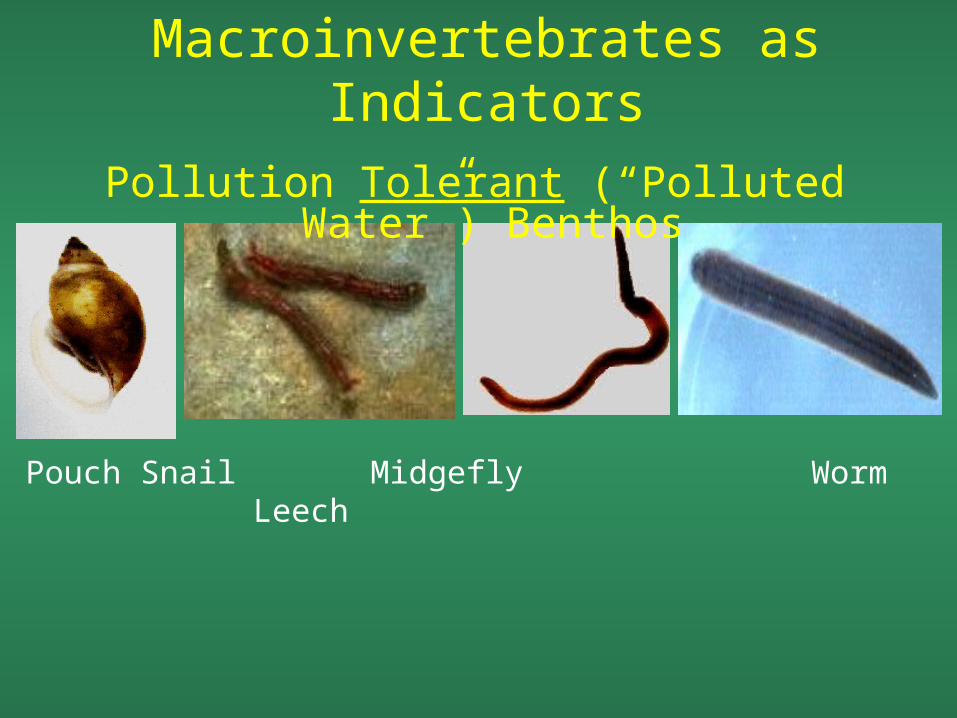
Macroinvertebrates as Indicators
Pouch Snail Midgefly Worm Leech
Pollution Tolerant (“Polluted Water”) Benthos
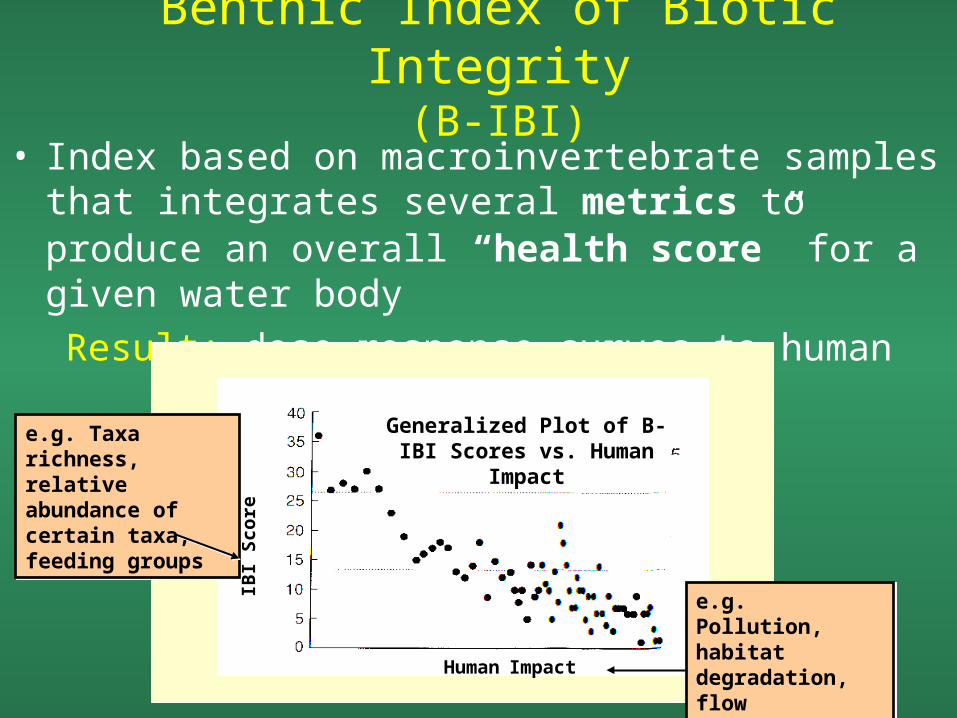
Benthic Index of Biotic Integrity(B-IBI)
• Index based on macroinvertebrate samples that integrates several metrics to produce an overall “health score” for a given water body
Result: dose-response curves to human impact
Human Impact
IBI
Sco
re
e.g. Taxa richness, relative abundance of certain taxa, feeding groups
e.g. Taxa richness, relative abundance of certain taxa, feeding groups
e.g. Pollution, habitat degradation, flow alteration
e.g. Pollution, habitat degradation, flow alteration
Generalized Plot of B-IBI Scores vs. Human Impact
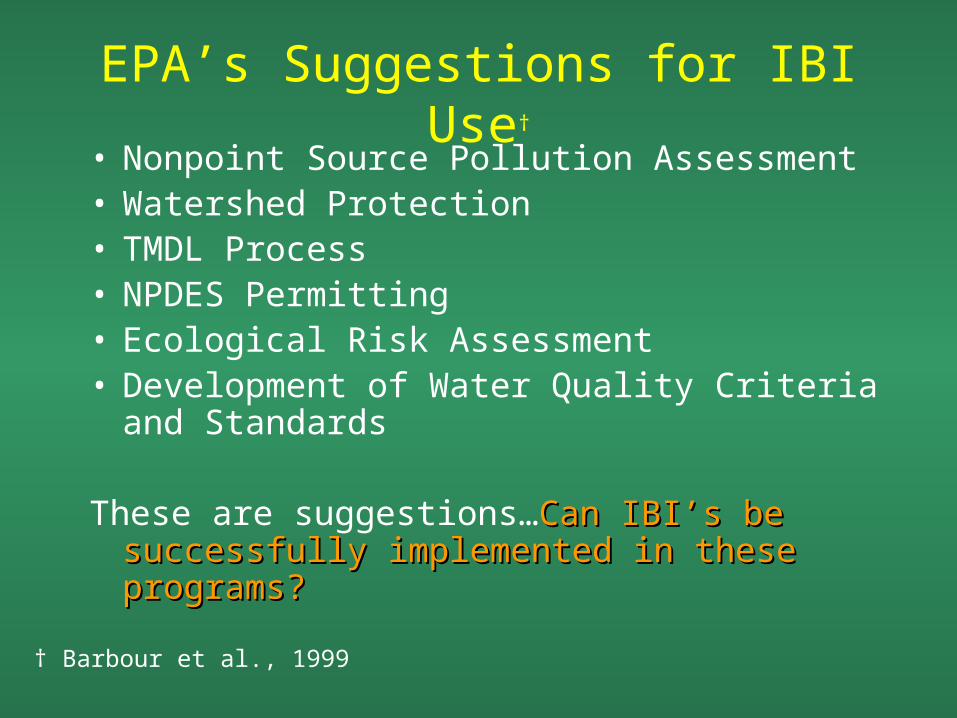
EPA’s Suggestions for IBI Use†
• Nonpoint Source Pollution Assessment• Watershed Protection• TMDL Process• NPDES Permitting• Ecological Risk Assessment• Development of Water Quality Criteria
and Standards
These are suggestions…Can IBI’s be Can IBI’s be successfully implemented in these successfully implemented in these programs?programs?
† Barbour et al., 1999
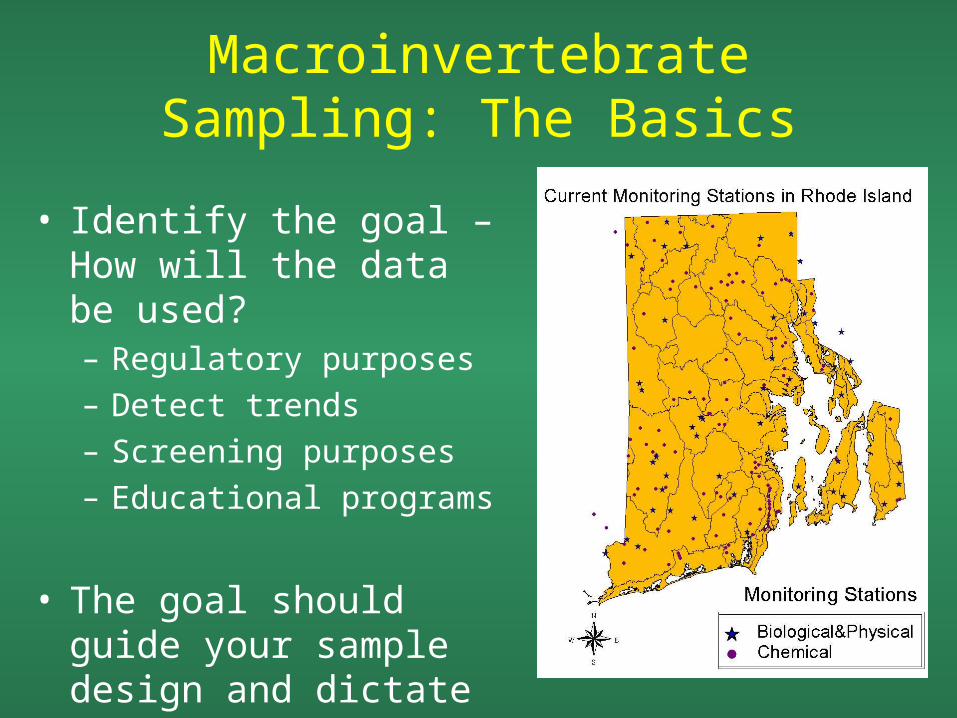
Macroinvertebrate Sampling: The Basics
• Identify the goal – How will the data be used?– Regulatory purposes– Detect trends– Screening purposes– Educational programs
• The goal should guide your sample design and dictate your methods
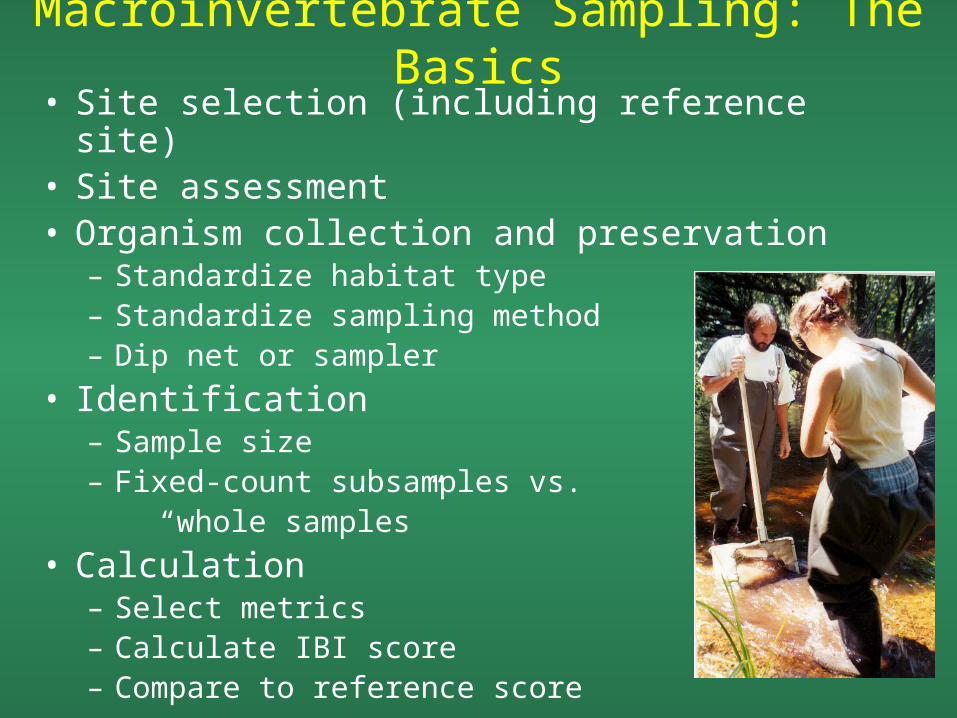
Macroinvertebrate Sampling: The Basics
• Site selection (including reference site)• Site assessment• Organism collection and preservation
– Standardize habitat type– Standardize sampling method– Dip net or sampler
• Identification– Sample size– Fixed-count subsamples vs. “whole samples”
• Calculation– Select metrics– Calculate IBI score– Compare to reference score
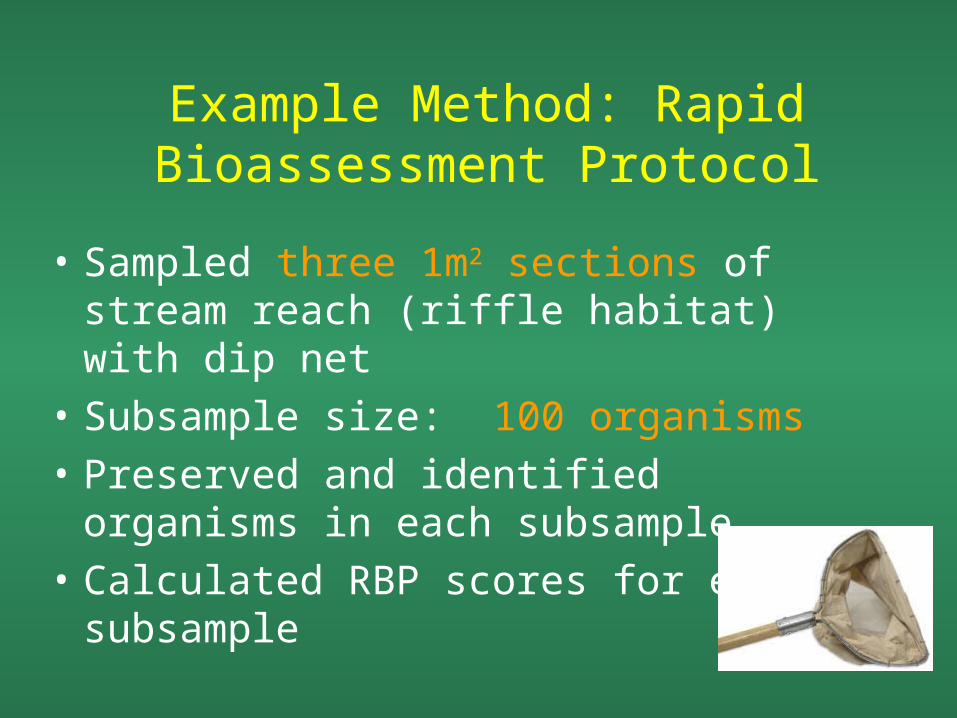
Example Method: Rapid Bioassessment Protocol
• Sampled three 1m2 sections of stream reach (riffle habitat) with dip net
• Subsample size: 100 organisms• Preserved and identified organisms
in each subsample• Calculated RBP scores for each
subsample
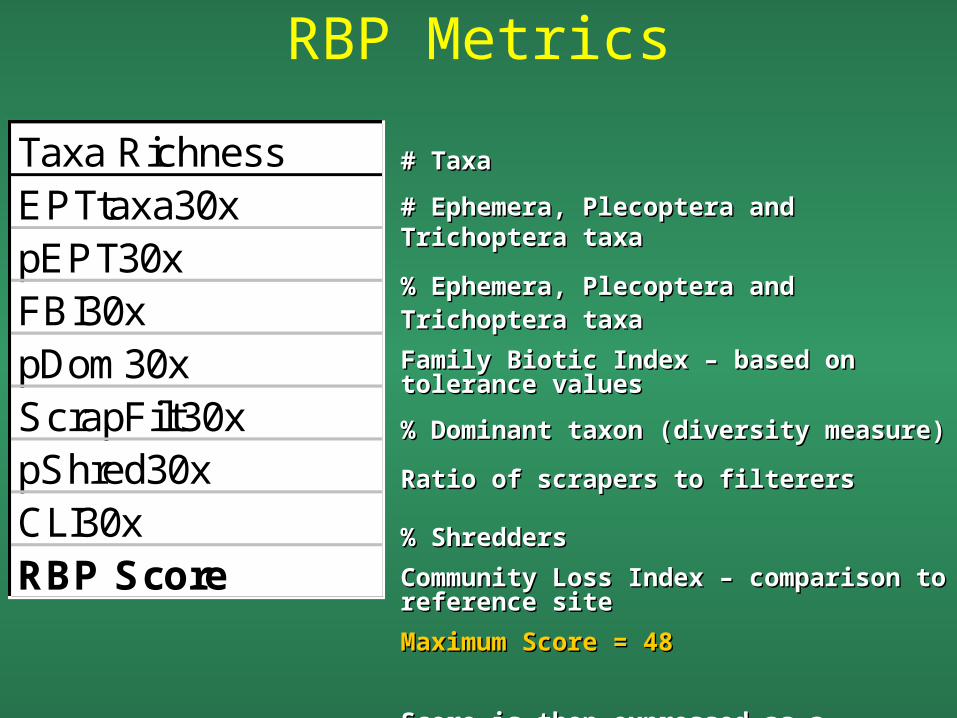
RBP Metrics
Taxa RichnessEPTtaxa30xpEPT30xFBI30xpDom30xScrapFilt30xpShred30xCLI30xRBP Score
# Taxa# Taxa
# Ephemera, Plecoptera and Trichoptera taxa# Ephemera, Plecoptera and Trichoptera taxa
% Ephemera, Plecoptera and Trichoptera taxa% Ephemera, Plecoptera and Trichoptera taxa
Family Biotic Index – based on tolerance Family Biotic Index – based on tolerance valuesvalues
% Dominant taxon (diversity measure)% Dominant taxon (diversity measure)
Ratio of scrapers to filterersRatio of scrapers to filterers
% Shredders% Shredders
Community Loss Index – comparison to Community Loss Index – comparison to reference sitereference site
Maximum Score = 48Maximum Score = 48
Score is then expressed as a percentage of Score is then expressed as a percentage of reference site score.reference site score.
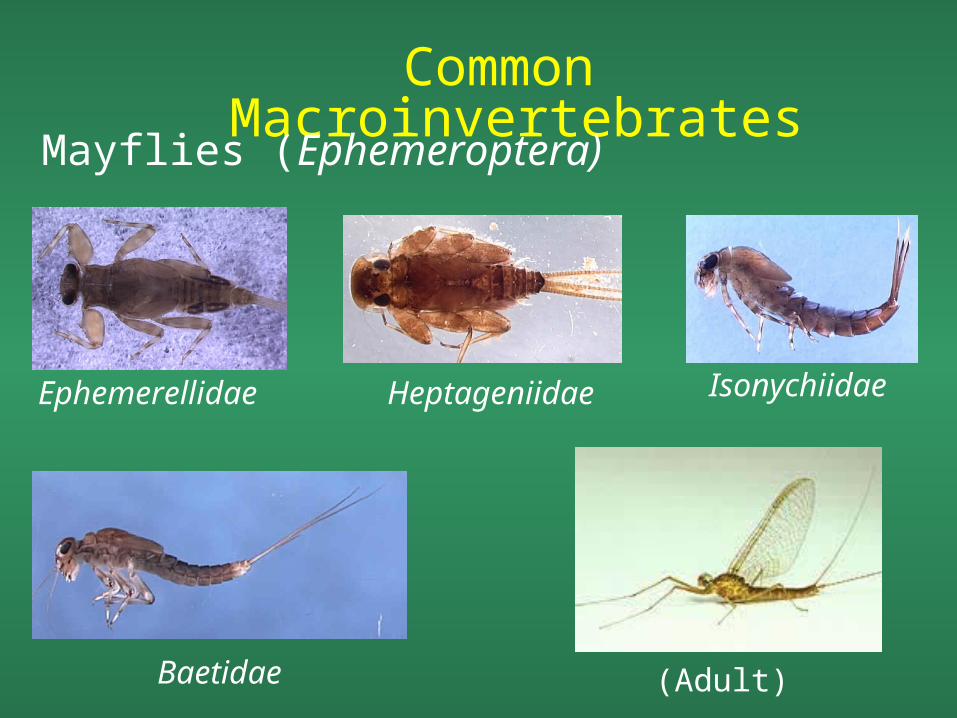
Common Macroinvertebrates
Mayflies (Ephemeroptera)
Baetidae
Ephemerellidae Heptageniidae Isonychiidae
(Adult)
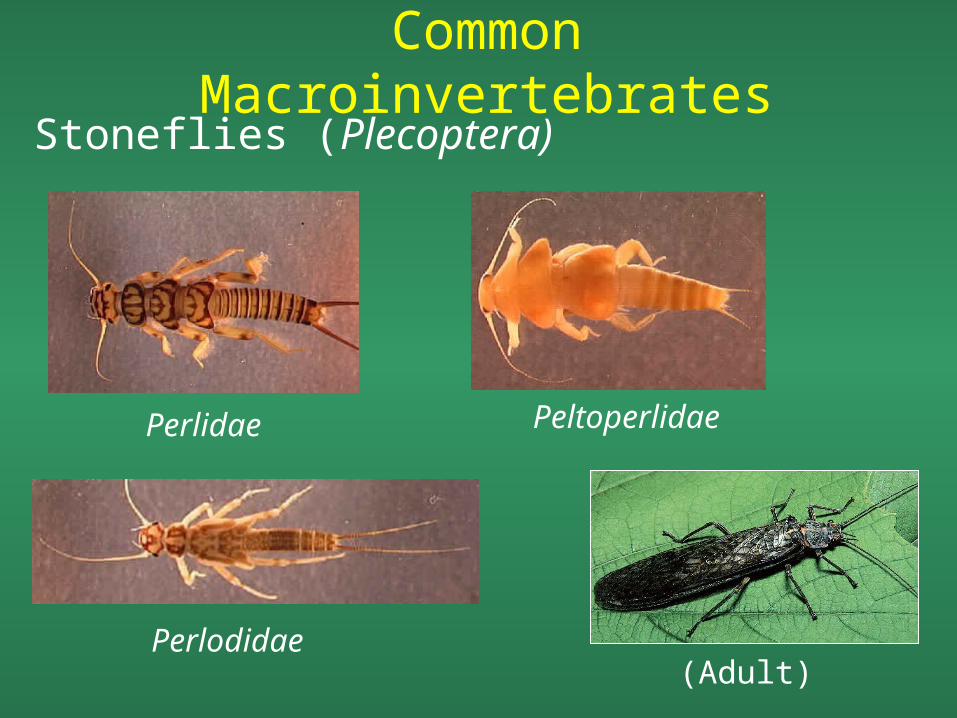
Common MacroinvertebratesStoneflies (Plecoptera)
Perlidae Peltoperlidae
Perlodidae(Adult)
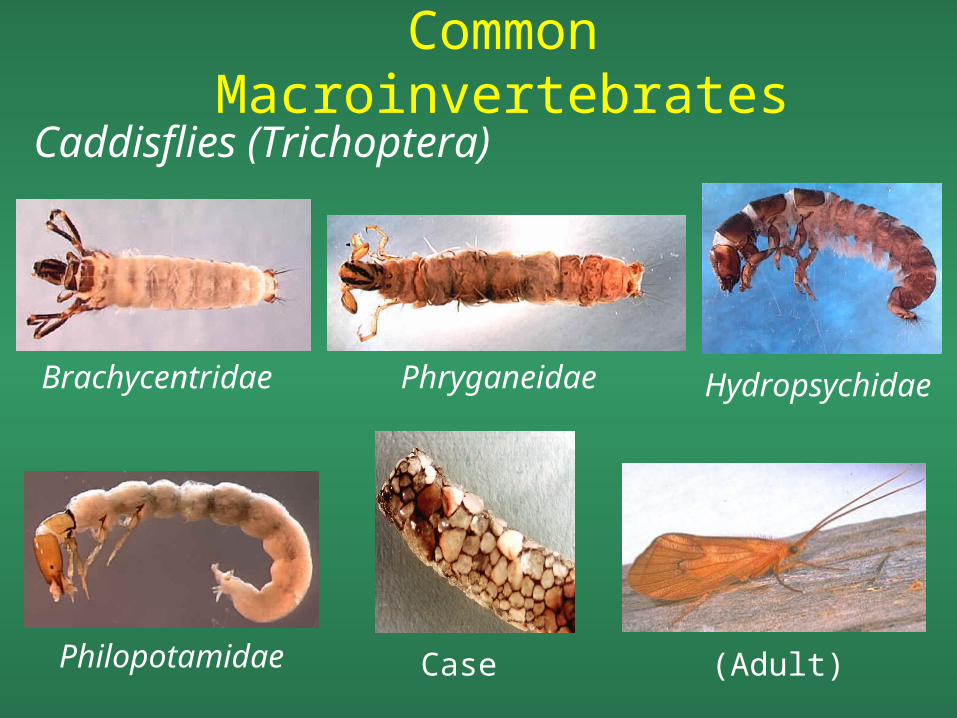
Common Macroinvertebrates
Brachycentridae
Phryganeidae Hydropsychidae
Philopotamidae
Caddisflies (Trichoptera)
Case (Adult)
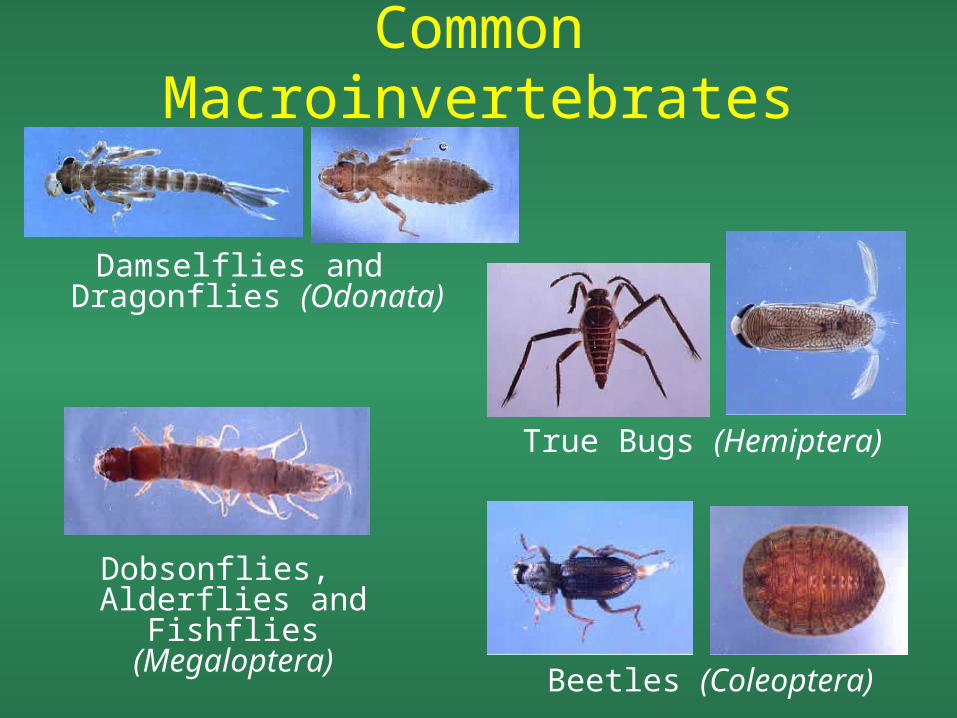
Common Macroinvertebrates
Damselflies and Dragonflies (Odonata)
True Bugs (Hemiptera)
Dobsonflies, Alderflies and Fishflies
(Megaloptera)
Beetles (Coleoptera)
Field Day: Streamside Biosurvey
• Simple method for macroinvertebrate collection and analysis
• Includes macroinvertebrate collection and habitat characterization procedures
• Practice identifying macroinvertebrates with keys
AcknowledgementsAcknowledgements
USDA CSREES New England USDA CSREES New England Water Quality ProgramWater Quality Program
Dr. Art GoldDr. Art Gold Dr. Patrick LoganDr. Patrick Logan Maria AlibertiMaria Aliberti Sara daSilvaSara daSilva
THANKS!
BENTHOS ARE COOL