Embed Size (px)
Citation preview

Malta Tourism Authority
Edition 2015

Cover: Mario Galea / www.viewingmalta.com
3
This publication summarises the key tourism figures for Malta and gives an overview of Malta’s tourism performance in 2014. The report is based on official tourism figures published by UNWTO, Eurostat and NSO, and surveys carried out by Malta Tourism Authority’s Research Unit.
Introduction
Contents
4 International Tourist Arrivals Facts & Figures about Malta Economic Importance of Tourism in Malta 5 Summary of Main Tourism Indicators Inbound Tourism Outbound Tourism Inbound Tourism By Month Inbound Tourists & Guestnights 6 Main Source Markets 7 Tourist Accommodation Accommodation Capacity Accommodation Usage by Guestnights Arrivals & Guestnights in Collective Accommodation 8 Occupancy Rates in Malta & Gozo 9 Tourist Expenditure 10 ProfileofIncomingTourists Socio-Demographic Profile Mode of Travel Passenger Movements by Airline 11 ProfileofIncomingTourists Information Sources Purpose of Visit Main Tourism Segments Factors Influencing Destination Choice 12 Segments Culture Sport & Outdoor English Language Learning 13 Segments Business Travel Cruise Tourism 14 ImageofMalta Overall Tourist Experience
4
4.4%
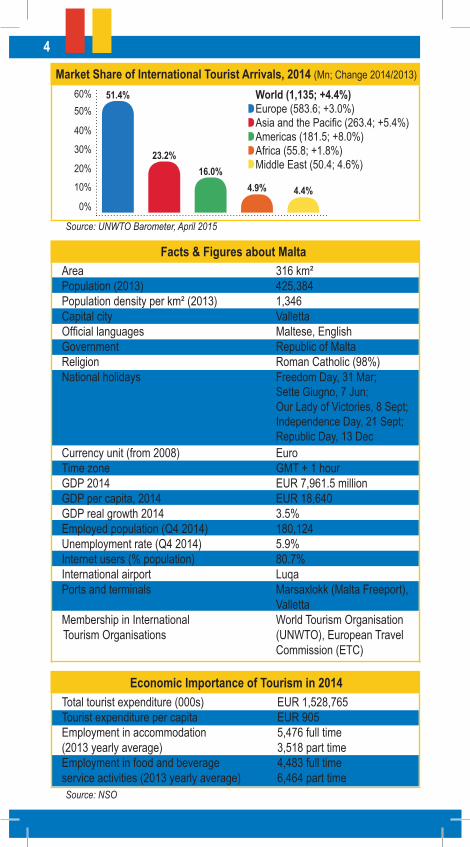
Area 316 km² Population (2013) 425,384 Population density per km² (2013) 1,346 Capital city Valletta Official languages Maltese, English Government Republic of Malta Religion Roman Catholic (98%) National holidays Freedom Day, 31 Mar; Sette Giugno, 7 Jun; Our Lady of Victories, 8 Sept; Independence Day, 21 Sept; Republic Day, 13 DecCurrency unit (from 2008) Euro Time zone GMT + 1 hour GDP 2014 EUR 7,961.5 million GDP per capita, 2014 EUR 18,640 GDP real growth 2014 3.5% Employed population (Q4 2014) 180,124Unemployment rate (Q4 2014) 5.9% Internet users (% population) 80.7% International airport Luqa Ports and terminals Marsaxlokk (Malta Freeport), Valletta Membership in International World Tourism Organisation Tourism Organisations (UNWTO), European Travel Commission (ETC)
Market Share of International Tourist Arrivals, 2014 (Mn; Change 2014/2013)
World (1,135; +4.4%)Europe (583.6; +3.0%)Asia and the Pacific (263.4; +5.4%)Americas (181.5; +8.0%)Africa (55.8; +1.8%)Middle East (50.4; 4.6%)
Facts&FiguresaboutMalta
Total tourist expenditure (000s) EUR 1,528,765 Tourist expenditure per capita EUR 905 Employment in accommodation 5,476 full time(2013 yearly average) 3,518 part time Employment in food and beverage 4,483 full timeservice activities (2013 yearly average) 6,464 part time Source: NSO
Economic Importance of Tourism in 2014
50%
40%
30%
20%
10%
0%
4.9%16.0%
23.2%
51.4%
Source: UNWTO Barometer, April 2015
InboundTourists&Guestnights,2014
60%
5
Market Share of International Tourist Arrivals, 2014 (Mn; Change 2014/2013)
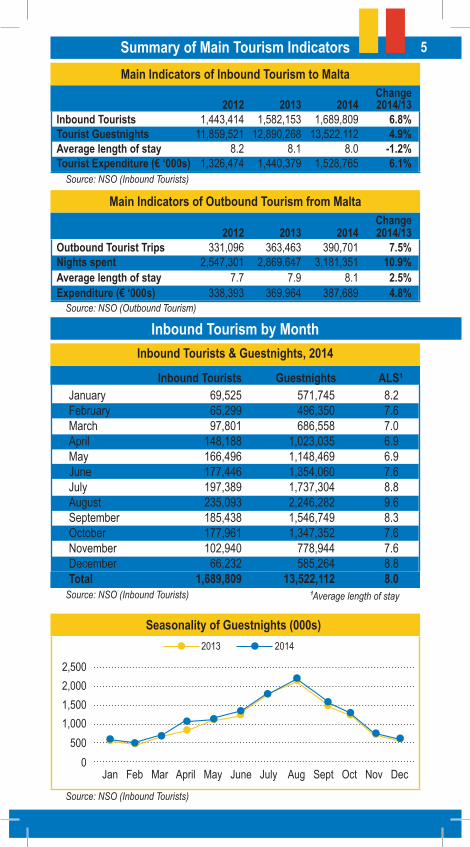
Summary of Main Tourism Indicators
Change 2012 2013 2014 2014/13Inbound Tourists 1,443,414 1,582,153 1,689,809 6.8%TouristGuestnights 11,859,521 12,890,268 13,522,112 4.9%Averagelengthofstay 8.2 8.1 8.0 -1.2%Tourist Expenditure (€ ‘000s) 1,326,474 1,440,379 1,528,765 6.1%
Source: NSO (Inbound Tourists)
Main Indicators of Inbound Tourism to Malta
Change 2012 2013 2014 2014/13Outbound Tourist Trips 331,096 363,463 390,701 7.5%Nightsspent 2,547,301 2,869,647 3,181,351 10.9%Averagelengthofstay 7.7 7.9 8.1 2.5%Expenditure (€ ‘000s) 338,393 369,964 387,689 4.8%
Source: NSO (Outbound Tourism)
Main Indicators of Outbound Tourism from Malta
Source: NSO
InboundTourists&Guestnights,2014
Source: NSO (Inbound Tourists)
InboundTourists Guestnights ALS¹January 69,525 571,745 8.2February 65,299 496,350 7.6March 97,801 686,558 7.0April 148,188 1,023,035 6.9May 166,496 1,148,469 6.9June 177,446 1,354,060 7.6July 197,389 1,737,304 8.8August 235,093 2,246,282 9.6September 185,438 1,546,749 8.3October 177,961 1,347,352 7.6November 102,940 778,944 7.6December 66,232 585,264 8.8Total 1,689,809 13,522,112 8.0
¹Average length of stay
Inbound Tourism by Month
Jan Feb Mar April May June July Aug Sept Oct Nov Dec
2,000
1,000500
0
SeasonalityofGuestnights(000s)
Source: NSO (Inbound Tourists)
20142013
2,500
1,500
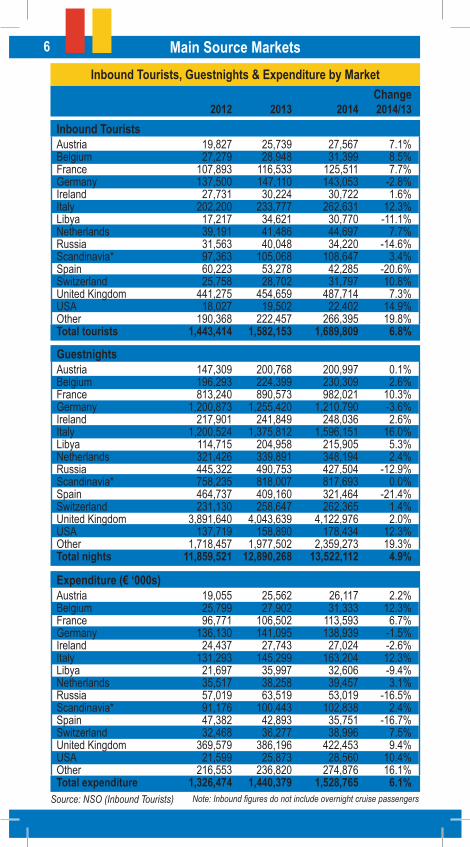
Main Source Markets6
Source: NSO (Inbound Tourists)
InboundTourists,Guestnights&ExpenditurebyMarket Change 2012 2013 2014 2014/13Inbound TouristsAustria 19,827 25,739 27,567 7.1%Belgium 27,279 28,948 31,399 8.5%France 107,893 116,533 125,511 7.7%Germany 137,500 147,110 143,053 -2.8%Ireland 27,731 30,224 30,722 1.6%Italy 202,200 233,777 262,631 12.3%Libya 17,217 34,621 30,770 -11.1%Netherlands 39,191 41,486 44,697 7.7%Russia 31,563 40,048 34,220 -14.6%Scandinavia* 97,363 105,068 108,647 3.4%Spain 60,223 53,278 42,285 -20.6%Switzerland 25,758 28,702 31,797 10.8%United Kingdom 441,275 454,659 487,714 7.3%USA 18,027 19,502 22,402 14.9%Other 190,368 222,457 266,395 19.8%Total tourists 1,443,414 1,582,153 1,689,809 6.8%
GuestnightsAustria 147,309 200,768 200,997 0.1%Belgium 196,293 224,399 230,309 2.6%France 813,240 890,573 982,021 10.3%Germany 1,200,873 1,255,420 1,210,790 -3.6%Ireland 217,901 241,849 248,036 2.6%Italy 1,200,524 1,375,812 1,596,151 16.0%Libya 114,715 204,958 215,905 5.3%Netherlands 321,426 339,891 348,194 2.4%Russia 445,322 490,753 427,504 -12.9%Scandinavia* 758,235 818,007 817,693 0.0%Spain 464,737 409,160 321,464 -21.4%Switzerland 231,130 258,647 262,365 1.4%United Kingdom 3,891,640 4,043,639 4,122,976 2.0%USA 137,719 158,890 178,434 12.3%Other 1,718,457 1,977,502 2,359,273 19.3%Totalnights 11,859,521 12,890,268 13,522,112 4.9%
Expenditure (€ ‘000s)Austria 19,055 25,562 26,117 2.2%Belgium 25,799 27,902 31,333 12.3%France 96,771 106,502 113,593 6.7%Germany 136,130 141,095 138,939 -1.5%Ireland 24,437 27,743 27,024 -2.6%Italy 131,293 145,299 163,204 12.3%Libya 21,697 35,997 32,606 -9.4%Netherlands 35,517 38,258 39,457 3.1%Russia 57,019 63,519 53,019 -16.5%Scandinavia* 91,176 100,443 102,838 2.4%Spain 47,382 42,893 35,751 -16.7%Switzerland 32,468 36,277 38,996 7.5%United Kingdom 369,579 386,196 422,453 9.4%USA 21,599 25,873 28,560 10.4%Other 216,553 236,820 274,876 16.1%Total expenditure 1,326,474 1,440,379 1,528,765 6.1%
Note: Inbound figures do not include overnight cruise passengers
Source: NSO (Collective Accommodation Establishments)
ArrivalsandGuestnightsinCollectiveAccommodation,2014
2Average length of stay
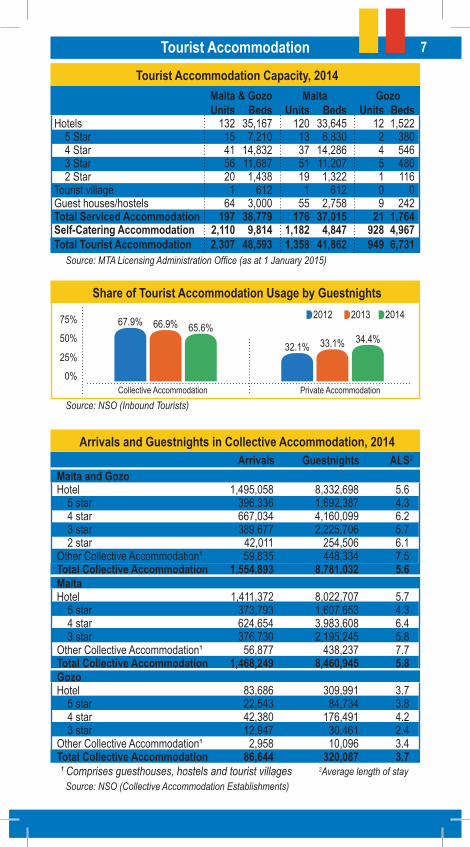
Tourist Accommodation Capacity, 2014
7Tourist Accommodation
¹ Comprises guesthouses, hostels and tourist villages
Source: MTA Licensing Administration Office (as at 1 January 2015)
Malta & Gozo Malta Gozo Units Beds Units Beds Units BedsHotels 132 35,167 120 33,645 12 1,522 5 Star 15 7,210 13 6,830 2 380 4 Star 41 14,832 37 14,286 4 546 3 Star 56 11,687 51 11,207 5 480 2 Star 20 1,438 19 1,322 1 116Tourist village 1 612 1 612 0 0Guest houses/hostels 64 3,000 55 2,758 9 242Total Serviced Accommodation 197 38,779 176 37,015 21 1,764Self-CateringAccommodation 2,110 9,814 1,182 4,847 928 4,967Total Tourist Accommodation 2,307 48,593 1,358 41,862 949 6,731
Arrivals Guestnights ALS2
Malta and Gozo Hotel 1,495,058 8,332,698 5.6 5 star 396,336 1,692,387 4.3 4 star 667,034 4,160,099 6.2 3 star 389,677 2,225,706 5.7 2 star 42,011 254,506 6.1Other Collective Accommodation¹ 59,835 448,334 7.5Total Collective Accommodation 1,554,893 8,781,032 5.6Malta Hotel 1,411,372 8,022,707 5.7 5 star 373,793 1,607,653 4.3 4 star 624,654 3,983,608 6.4 3 star 376,730 2,195,245 5.8Other Collective Accommodation¹ 56,877 438,237 7.7Total Collective Accommodation 1,468,249 8,460,945 5.8Gozo Hotel 83,686 309,991 3.7 5 star 22,543 84,734 3.8 4 star 42,380 176,491 4.2 3 star 12,947 30,461 2.4Other Collective Accommodation¹ 2,958 10,096 3.4Total Collective Accommodation 86,644 320,087 3.7
ShareofTouristAccommodationUsagebyGuestnights
Source: NSO (Inbound Tourists)Collective Accommodation Private Accommodation
32.1% 33.1% 34.4%67.9% 66.9% 65.6%
2012 2013 2014
Note: Inbound figures do not include overnight cruise passengers
2641
526267
75768485
2944
2335
4665
3751
6572
4968
7487
8
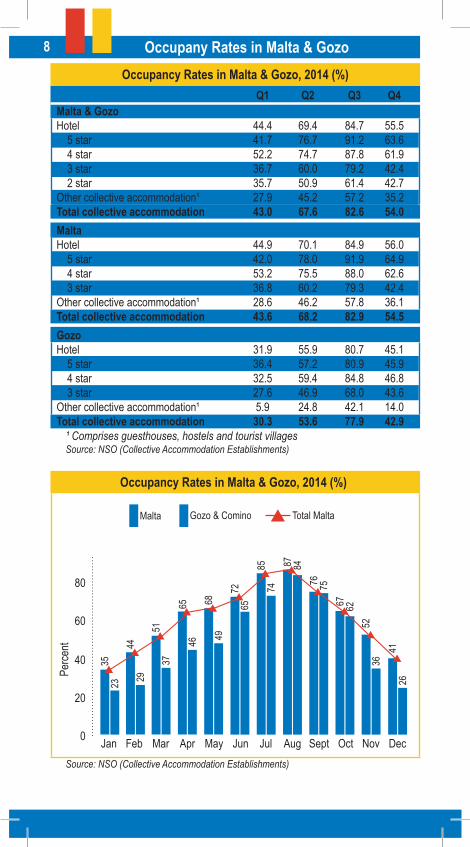
Occupancy Rates in Malta & Gozo, 2014 (%)
Source: NSO (Collective Accommodation Establishments)¹ Comprises guesthouses, hostels and tourist villages
Jan Feb Mar Apr May Jun Jul Aug Sept Oct Nov Dec
60
Occupancy Rates in Malta & Gozo, 2014 (%)
Source: NSO (Collective Accommodation Establishments)
40
20
80
0
Occupany Rates in Malta & Gozo
Q1 Q2 Q3 Q4Malta & Gozo Hotel 44.4 69.4 84.7 55.5 5 star 41.7 76.7 91.2 63.6 4 star 52.2 74.7 87.8 61.9 3 star 36.7 60.0 79.2 42.4 2 star 35.7 50.9 61.4 42.7Other collective accommodation¹ 27.9 45.2 57.2 35.2Total collective accommodation 43.0 67.6 82.6 54.0Malta Hotel 44.9 70.1 84.9 56.0 5 star 42.0 78.0 91.9 64.9 4 star 53.2 75.5 88.0 62.6 3 star 36.8 60.2 79.3 42.4Other collective accommodation¹ 28.6 46.2 57.8 36.1Total collective accommodation 43.6 68.2 82.9 54.5Gozo Hotel 31.9 55.9 80.7 45.1 5 star 36.4 57.2 80.9 45.9 4 star 32.5 59.4 84.8 46.8 3 star 27.6 46.9 68.0 43.6Other collective accommodation¹ 5.9 24.8 42.1 14.0Total collective accommodation 30.3 53.6 77.9 42.9
36
Gozo & CominoMalta Total Malta
Perce
nt

Total Tourist Expenditure (€000s)
9
Change 2012 2013 2014 2014/13Package expenditure 457,154 486,168 516,339 6.2%Non-package Air/sea fares 197,544 211,058 217,255 2.9%expenditure Accommodation 160,329 185,982 208,216 12.0%Other expenditure 511,444 557,172 586,956 5.3%Total 1,326,474 1,440,379 1,528,765 6.1%
Source: NSO (Inbound Tourists)
Source: NSO (Inbound Tourists)
Source: MTA Expenditure Survey, 2014
Tourist Expenditure per Capita (€) Change 2012 2013 2014 2014/13Package expenditure 670 660 665 0.8%Non-package Air/sea fares 260 250 238 -4.8%expenditure Accommodation 287 287 300 4.5%Other expenditure 354 352 347 -1.4%Total 919 910 905 -0.5%
Tourist Expenditure
ShareofExpenditureDuringStay(ExcludingAccommodation),2014
Food & Drinks 53.5% of which: Restaurants (30.4%)
Shopping16.2% of which: Souvenirs & Clothing (11.5%)
Recreation 15.8% of which: Excursions / Site Visits (10.6%)
Transport 7.9% of which: Public Transport (2.2%)
Other 6.5% of which: Tobacco Products (1.7%)

10
Socio-DemographicProfile Change 2012 2013 2014 2014/13Gender Males 753,538 825,709 884,292 7.1%Females 689,876 756,444 805,517 6.5% Agegroup 0-24 287,426 322,257 335,467 4.1%25-44 451,336 504,461 570,271 13.0%45-64 504,934 528,943 553,400 4.6%65+ 199,718 226,492 230,672 1.8% Organisationofstay Package 682,505 737,000 776,192 5.3%Non-package 760,909 845,153 913,618 8.1% Frequency First time tourists 992,138 1,085,403 1,158,649 6.7%Repeat tourists 451,276 496,750 531,161 6.9%
Travel by Air 97.1% Travel by Sea 2.9%
Mode of Travel, 2014
ShareofPassengerMovementsbyAirlines,2014
Source: NSO (Inbound Tourists)
Source: MIA Annual Statistical Summary, 2014
ProfileofIncomingTourists
Source: NSO (Inbound Tourists)
2.2%5.2%
7.6%
25.6%
40.6%
18.8%
Business
Sun/Culture
Culture
Sun
Purely novelty
Purely familiarity
Diving
English language
Air Malta Lufthansa Alitalia OthersEasyjetRyanair
11
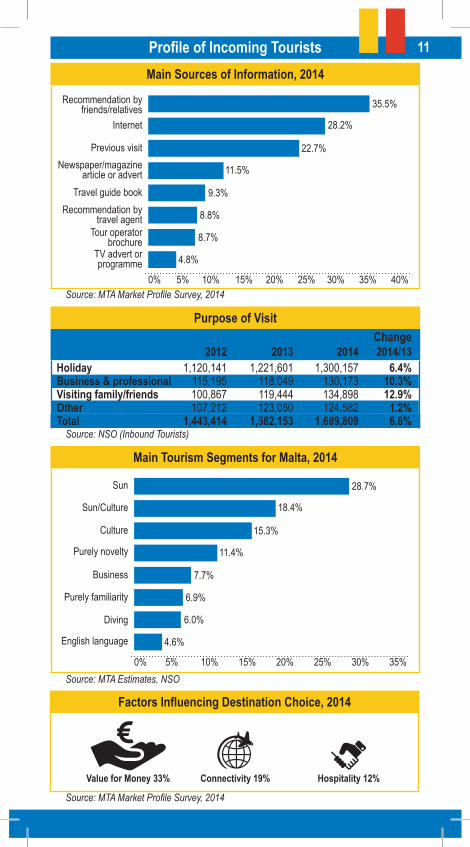
Purpose of Visit
Main Sources of Information, 2014
MainTourismSegmentsforMalta,2014
Source: MTA Estimates, NSO
0% 5% 10% 15% 20% 25% 30% 35% 40%Source: MTA Market Profile Survey, 2014
Tour operatorbrochure
Travel guide book
Internet
Previous visit
Recommendation by friends/relatives
Recommendation by travel agent
TV advert orprogramme
ProfileofIncomingTourists
Source: NSO (Inbound Tourists)
Newspaper/magazine article or advert
35.5%
28.2%
22.7%
11.5%
9.3%
8.8%
8.7%
4.8%
Change 2012 2013 2014 2014/13Holiday 1,120,141 1,221,601 1,300,157 6.4%Business & professional 115,195 118,049 130,173 10.3%Visitingfamily/friends 100,867 119,444 134,898 12.9%Other 107,212 123,060 124,582 1.2%Total 1,443,414 1,582,153 1,689,809 6.8%
0% 5% 10% 15% 20% 25% 30% 35%
Business
Sun/Culture
Culture
28.7%
18.4%
15.3%
11.4%
7.7%
6.9%
6.0%
4.6%
Sun
Purely novelty
Purely familiarity
Diving
English language
FactorsInfluencingDestinationChoice,2014
Source: MTA Market Profile Survey, 2014
Value for Money 33% Connectivity 19% Hospitality 12%
12
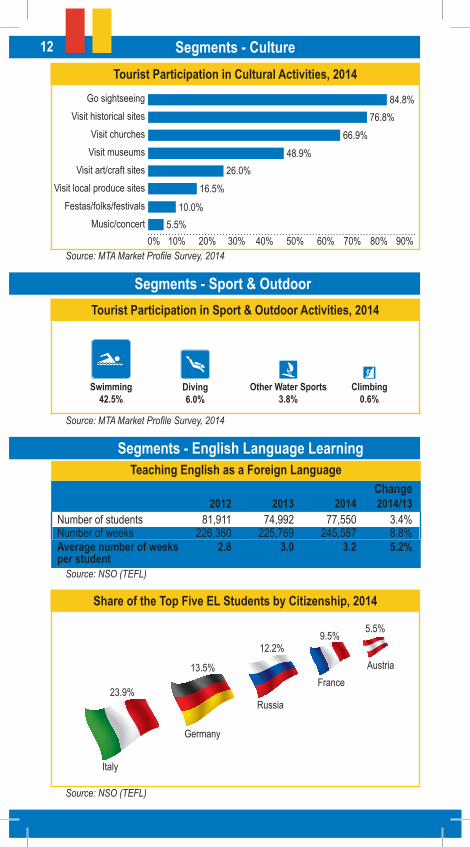
ShareoftheTopFiveELStudentsbyCitizenship,2014
Go sightseeingVisit historical sites
Visit churchesVisit museums
Visit art/craft sitesVisit local produce sites
Festas/folks/festivalsMusic/concert
0% 10% 20% 30% 40% 50% 60% 70% 80% 90%
Tourist Participation in Cultural Activities, 2014
Source: MTA Market Profile Survey, 2014
Segments-Culture
Source: NSO (TEFL)
Segments-EnglishLanguageLearning
Other Water Sports3.8%
Swimming42.5%
Diving6.0%
Source: MTA Market Profile Survey, 2014
Segments-Sport&OutdoorTourist Participation in Sport & Outdoor Activities, 2014
Source: NSO (TEFL)
TeachingEnglishasaForeignLanguage Change 2012 2013 2014 2014/13Number of students 81,911 74,992 77,550 3.4%Number of weeks 226,360 225,769 245,587 8.8%Averagenumberofweeks 2.8 3.0 3.2 5.2%per student
48.9%
5.5%
84.8%76.8%
66.9%
10.0%
16.5%26.0%
Climbing0.6%
23.9%
13.5%
12.2%9.5%
5.5%
13
0% 10% 20% 30% 40% 50% 60% 70% 80% 90%
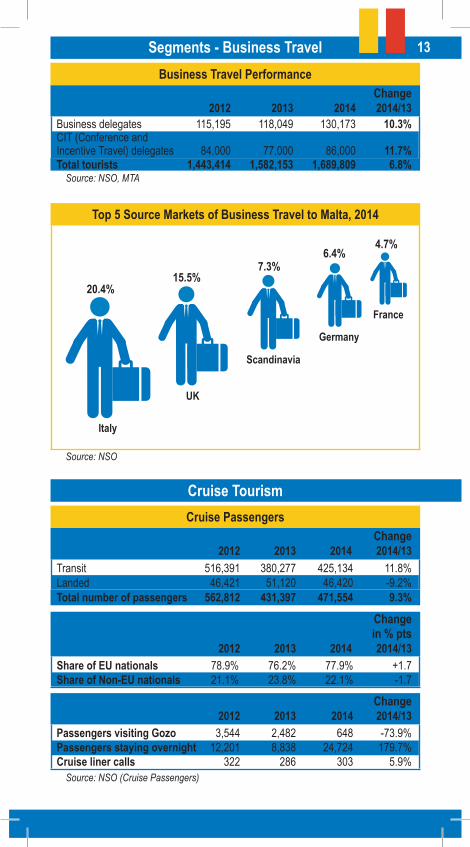
Top 5 Source Markets of Business Travel to Malta, 2014
Business Travel Performance
Source: NSO, MTA
Source: NSO
CruisePassengers
Change 2012 2013 2014 2014/13PassengersvisitingGozo 3,544 2,482 648 -73.9%Passengersstayingovernight 12,201 8,838 24,724 179.7%Cruise liner calls 322 286 303 5.9%
Change in % pts 2012 2013 2014 2014/13Share of EU nationals 78.9% 76.2% 77.9% +1.7Share of Non-EU nationals 21.1% 23.8% 22.1% -1.7
Source: NSO (Cruise Passengers)
Segments-BusinessTravel
Cruise Tourism
Change 2012 2013 2014 2014/13Business delegates 115,195 118,049 130,173 10.3%CIT (Conference and Incentive Travel) delegates 84,000 77,000 86,000 11.7%Total tourists 1,443,414 1,582,153 1,689,809 6.8%
15.5%20.4%
7.3%6.4%
4.7%
Change 2012 2013 2014 2014/13Transit 516,391 380,277 425,134 11.8%Landed 46,421 51,120 46,420 -9.2%Totalnumberofpassengers 562,812 431,397 471,554 9.3%
14
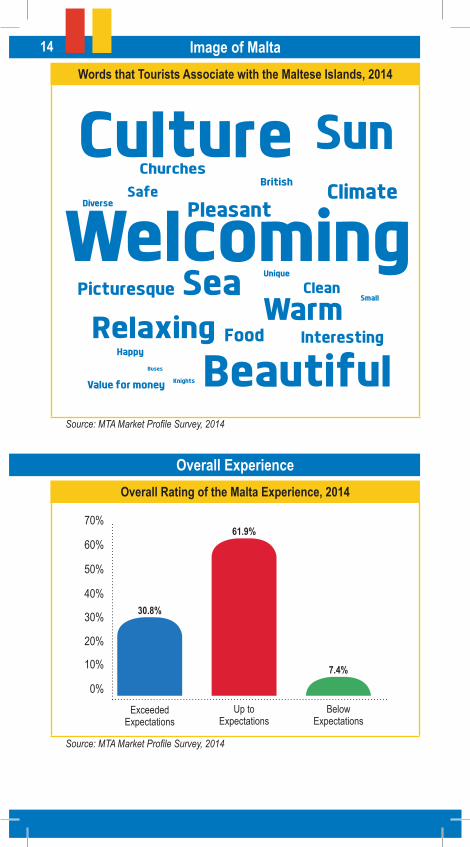
Words that Tourists Associate with the Maltese Islands, 2014
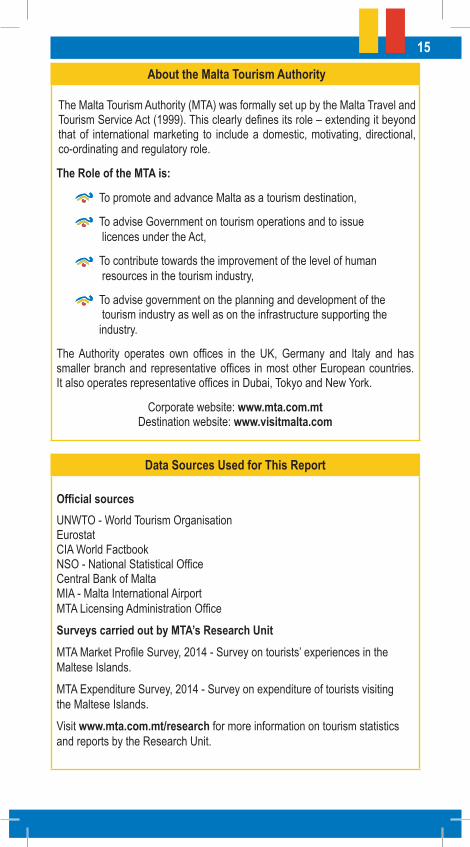
OverallRatingoftheMaltaExperience,2014
Source: MTA Market Profile Survey, 2014
ImageofMalta
Source: MTA Market Profile Survey, 2014
Overall Experience
Up to Expectations
BelowExpectations
ExceededExpectations
7.4%
30.8%
61.9%70%
60%
50%
40%
30%
20%
10%
0%
15
About the Malta Tourism Authority
The Role of the MTA is: To promote and advance Malta as a tourism destination, To advise Government on tourism operations and to issue licences under the Act, To contribute towards the improvement of the level of human resources in the tourism industry, To advise government on the planning and development of the tourism industry as well as on the infrastructure supporting the industry. The Authority operates own offices in the UK, Germany and Italy and has smaller branch and representative offices in most other European countries. It also operates representative offices in Dubai, Tokyo and New York.
Data Sources Used for This Report
Corporate website: www.mta.com.mtDestination website: www.visitmalta.com
Officialsources UNWTO - World Tourism Organisation Eurostat CIA World Factbook NSO - National Statistical Office Central Bank of Malta MIA - Malta International Airport MTA Licensing Administration Office Surveys carried out by MTA’s Research Unit MTA Market Profile Survey, 2014 - Survey on tourists’ experiences in the Maltese Islands. MTA Expenditure Survey, 2014 - Survey on expenditure of tourists visiting the Maltese Islands.Visit www.mta.com.mt/research for more information on tourism statistics and reports by the Research Unit.
The Malta Tourism Authority (MTA) was formally set up by the Malta Travel and Tourism Service Act (1999). This clearly defines its role – extending it beyond that of international marketing to include a domestic, motivating, directional, co-ordinating and regulatory role.
www.mta.com.mt
Produced and Published by:Malta Tourism Authority