Embed Size (px)
Citation preview
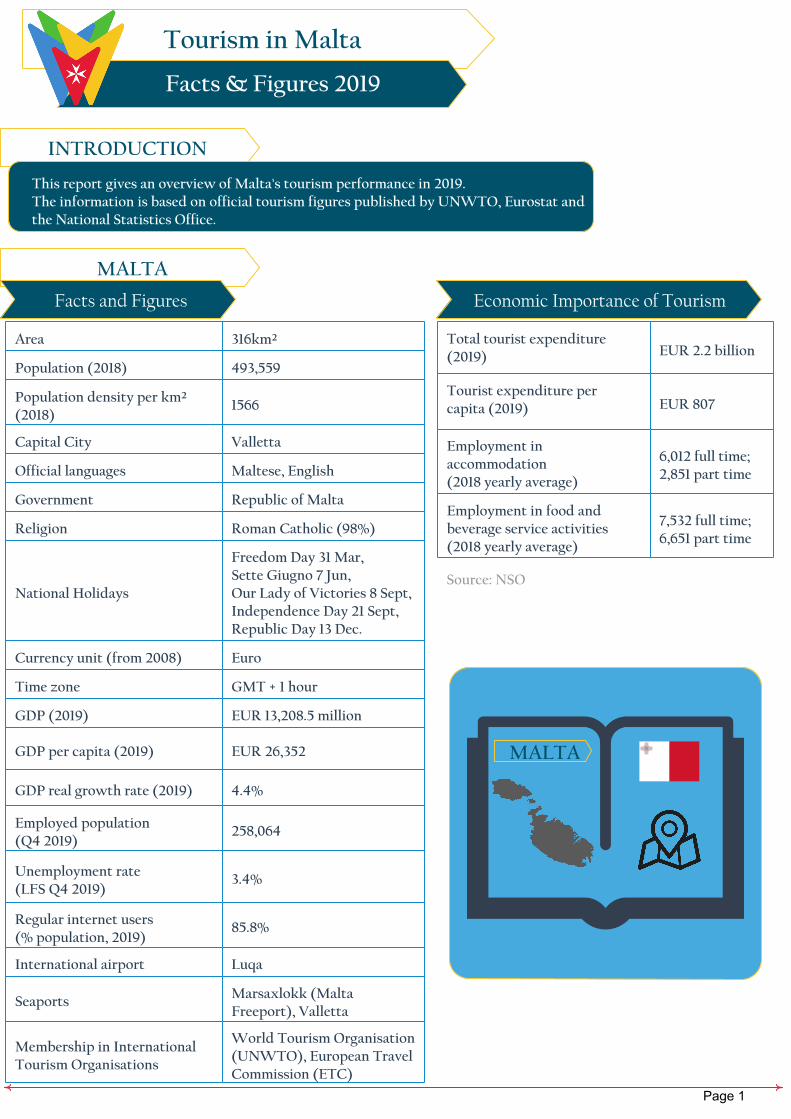
Tourism in Malta
Facts & Figures 2019
INTRODUCTION
This report gives an overview of Malta's tourism performance in 2019. The information is based on official tourism figures published by UNWTO, Eurostat and the National Statistics Office.
MALTA
Facts and Figures
Area 316km²
Population (2018) 493,559
Population density per km² (2018)
1566
Capital City Valletta
Official languages Maltese, English
Government Republic of Malta
Religion Roman Catholic (98%)
National Holidays
Freedom Day 31 Mar, Sette Giugno 7 Jun,Our Lady of Victories 8 Sept, Independence Day 21 Sept, Republic Day 13 Dec.
Currency unit (from 2008) Euro
Time zone GMT + 1 hour
GDP (2019) EUR 13,208.5 million
GDP per capita (2019) EUR 26,352
GDP real growth rate (2019) 4.4%
Employed population (Q4 2019)
258,064
Unemployment rate (LFS Q4 2019)
3.4%
Regular internet users (% population, 2019)
85.8%
International airport Luqa
SeaportsMarsaxlokk (Malta Freeport), Valletta
Membership in International Tourism Organisations
World Tourism Organisation (UNWTO), European Travel Commission (ETC)
Economic Importance of Tourism
Total tourist expenditure (2019) EUR 2.2 billion
Tourist expenditure per capita (2019) EUR 807
Employment in accommodation (2018 yearly average)
6,012 full time; 2,851 part time
Employment in food and beverage service activities (2018 yearly average)
7,532 full time; 6,651 part time
Source: NSO
MALTA
Page 1
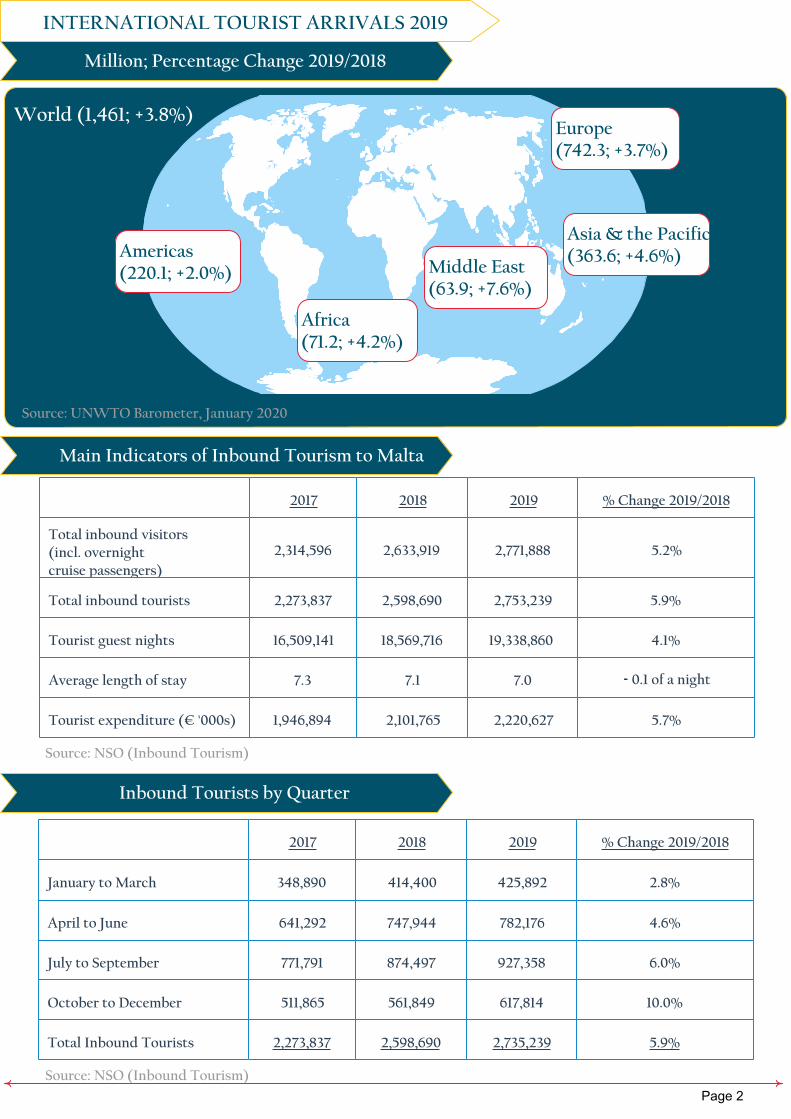
Million; Percentage Change 2019/2018
INTERNATIONAL TOURIST ARRIVALS 2019
World (1,461; +3.8%)
Americas(220.1; +2.0%)
Europe(742.3; +3.7%)
Asia & the Pacific(363.6; +4.6%)
Middle East(63.9; +7.6%)
Africa(71.2; +4.2%)
Source: UNWTO Barometer, January 2020
Main Indicators of Inbound Tourism to Malta
2017 2018 2019 % Change 2019/2018
Total inbound visitors(incl. overnightcruise passengers)
2,314,596 2,633,919 2,771,888 5.2%
Total inbound tourists 2,273,837 2,598,690 2,753,239 5.9%
Tourist guest nights 16,509,141 18,569,716 19,338,860 4.1%
Average length of stay 7.3 7.1 7.0 - 0.1 of a night
Tourist expenditure (€ '000s) 1,946,894 2,101,765 2,220,627 5.7%
Inbound Tourists by Quarter
2017 2018 2019 % Change 2019/2018
January to March 348,890 414,400 425,892 2.8%
April to June 641,292 747,944 782,176 4.6%
July to September 771,791 874,497 927,358 6.0%
October to December 511,865 561,849 617,814 10.0%
Total Inbound Tourists 2,273,837 2,598,690 2,735,239 5.9%
Source: NSO (Inbound Tourism)
Source: NSO (Inbound Tourism)
Page 2
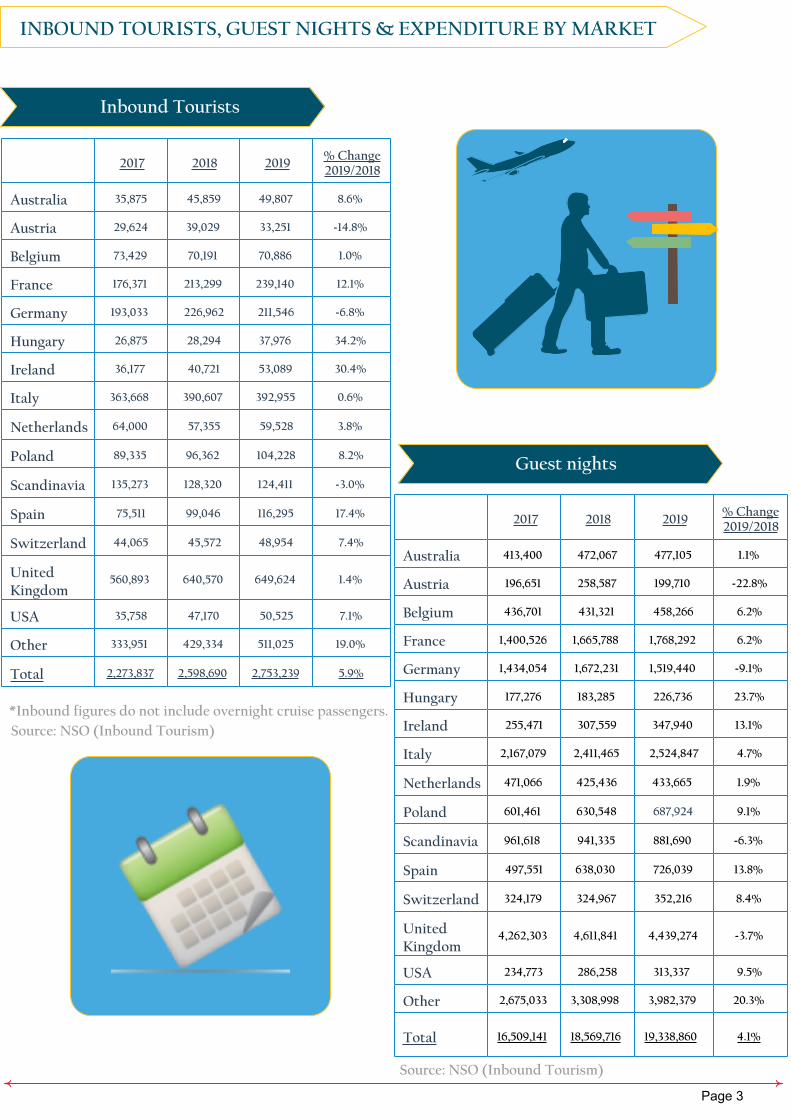
Inbound Tourists
INBOUND TOURISTS, GUEST NIGHTS & EXPENDITURE BY MARKET
2017 2018 2019% Change 2019/2018
Australia 35,875 45,859 49,807 8.6%
Austria 29,624 39,029 33,251 -14.8%
Belgium 73,429 70,191 70,886 1.0%
France 176,371 213,299 239,140 12.1%
Germany 193,033 226,962 211,546 -6.8%
Hungary 26,875 28,294 37,976 34.2%
Ireland 36,177 40,721 53,089 30.4%
Italy 363,668 390,607 392,955 0.6%
Netherlands 64,000 57,355 59,528 3.8%
Poland 89,335 96,362 104,228 8.2%
Scandinavia 135,273 128,320 124,411 -3.0%
Spain 75,511 99,046 116,295 17.4%
Switzerland 44,065 45,572 48,954 7.4%
United Kingdom
560,893 640,570 649,624 1.4%
USA 35,758 47,170 50,525 7.1%
Other 333,951 429,334 511,025 19.0%
Total 2,273,837 2,598,690 2,753,239 5.9%
2017 2018 2019% Change 2019/2018
Australia 413,400 472,067 477,105 1.1%
Austria 196,651 258,587 199,710 -22.8%
Belgium 436,701 431,321 458,266 6.2%
France 1,400,526 1,665,788 1,768,292 6.2%
Germany 1,434,054 1,672,231 1,519,440 -9.1%
Hungary 177,276 183,285 226,736 23.7%
Ireland 255,471 307,559 347,940 13.1%
Italy 2,167,079 2,411,465 2,524,847 4.7%
Netherlands 471,066 425,436 433,665 1.9%
Poland 601,461 630,548 687,924 9.1%
Scandinavia 961,618 941,335 881,690 -6.3%
Spain 497,551 638,030 726,039 13.8%
Switzerland 324,179 324,967 352,216 8.4%
United Kingdom
4,262,303 4,611,841 4,439,274 -3.7%
USA 234,773 286,258 313,337 9.5%
Other 2,675,033 3,308,998 3,982,379 20.3%
Total 16,509,141 18,569,716 19,338,860 4.1%
Guest nights
*Inbound figures do not include overnight cruise passengers.
Source: NSO (Inbound Tourism)
Source: NSO (Inbound Tourism)
Page 3
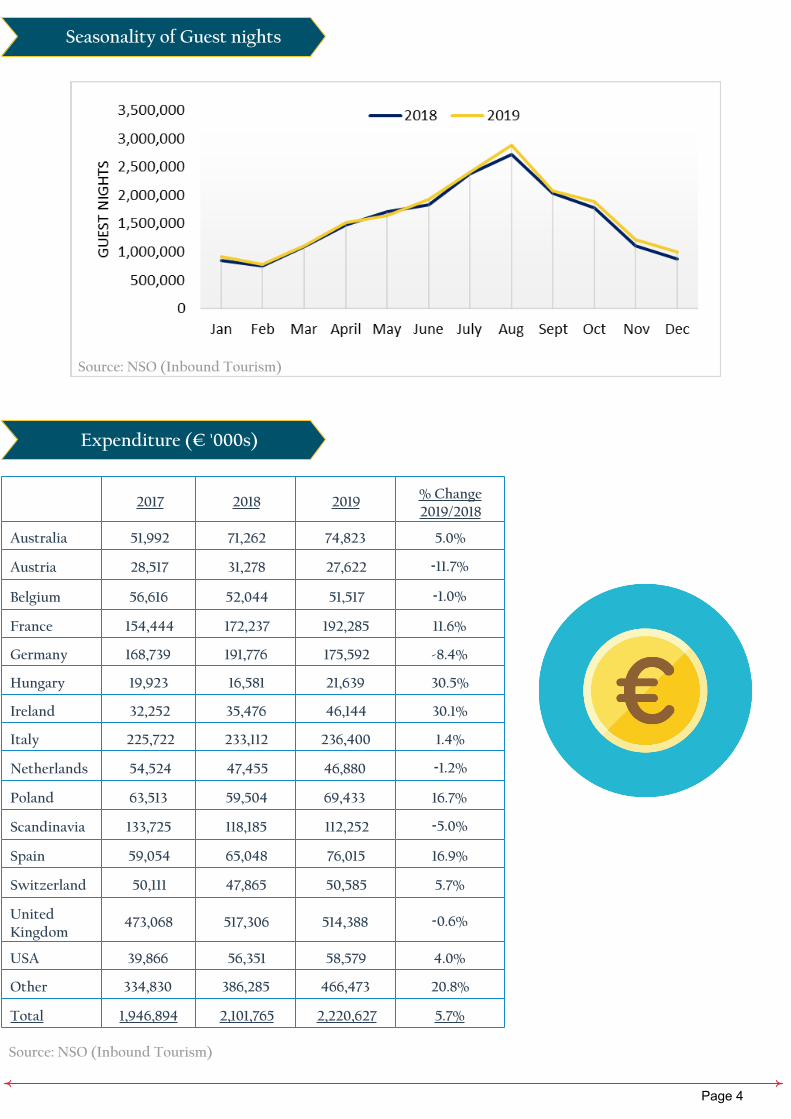
Expenditure (€ '000s)
2017 2018 2019% Change 2019/2018
Australia 51,992 71,262 74,823 5.0%
Austria 28,517 31,278 27,622 -11.7%
Belgium 56,616 52,044 51,517 -1.0%
France 154,444 172,237 192,285 11.6%
Germany 168,739 191,776 175,592 -8.4%
Hungary 19,923 16,581 21,639 30.5%
Ireland 32,252 35,476 46,144 30.1%
Italy 225,722 233,112 236,400 1.4%
Netherlands 54,524 47,455 46,880 -1.2%
Poland 63,513 59,504 69,433 16.7%
Scandinavia 133,725 118,185 112,252 -5.0%
Spain 59,054 65,048 76,015 16.9%
Switzerland 50,111 47,865 50,585 5.7%
United Kingdom
473,068 517,306 514,388 -0.6%
USA 39,866 56,351 58,579 4.0%
Other 334,830 386,285 466,473 20.8%
Total 1,946,894 2,101,765 2,220,627 5.7%
Seasonality of Guest nights
Source: NSO (Inbound Tourism)
Source: NSO (Inbound Tourism)
Page 4
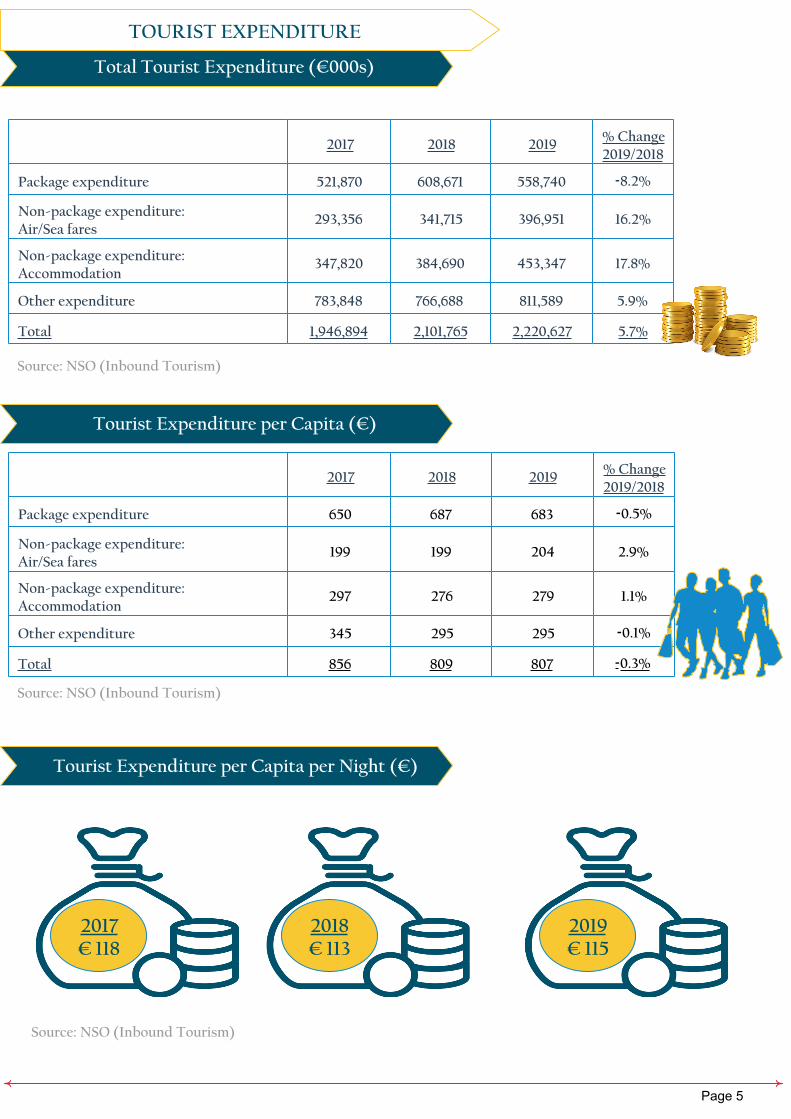
Total Tourist Expenditure (€000s)
TOURIST EXPENDITURE
2017 2018 2019% Change2019/2018
Package expenditure 521,870 608,671 558,740 -8.2%
Non-package expenditure:Air/Sea fares
293,356 341,715 396,951 16.2%
Non-package expenditure:Accommodation
347,820 384,690 453,347 17.8%
Other expenditure 783,848 766,688 811,589 5.9%
Total 1,946,894 2,101,765 2,220,627 5.7%
Tourist Expenditure per Capita (€)
2017 2018 2019% Change2019/2018
Package expenditure 650 687 683 -0.5%
Non-package expenditure:Air/Sea fares
199 199 204 2.9%
Non-package expenditure:Accommodation
297 276 279 1.1%
Other expenditure 345 295 295 -0.1%
Total 856 809 807 -0.3%
Source: NSO (Inbound Tourism)
Source: NSO (Inbound Tourism)
Tourist Expenditure per Capita per Night (€)
2017€ 118
2018€ 113
2019€ 115
Source: NSO (Inbound Tourism)
Page 5
CRUISE TRAFFIC
Cruise Passengers
2017 2018 2019% Change2019/2018
Transit 566,475 554,201 629,276 13.5%
Landed 103,660 78,538 136,420 73.7%
Total number of passengers
670,135 632,739 765,696 21.0%
of which:
EU nationals 473,887 423,134 491,599 16.2%
Non-EU nationals 196,248 209,605 274,097 30.8%
Passengers on Cruise Liners Berthed in Gozo
14,503 12,950 8,160 -37.0%
Passengers staying overnight
40,759 35,229 18,649 -47.1%
Cruise liner calls 342 310 359 15.8%
Source: NSO (Cruise Passengers)
Page 6
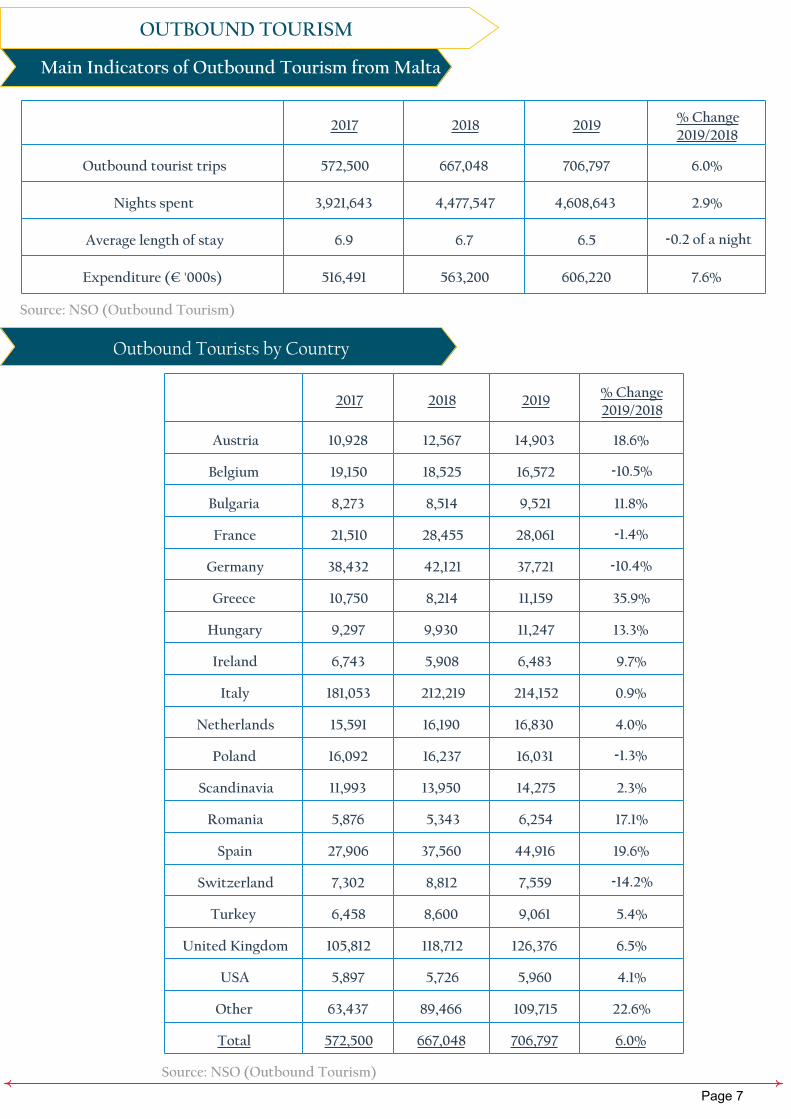
Outbound Tourists by Country
2017 2018 2019% Change 2019/2018
Austria 10,928 12,567 14,903 18.6%
Belgium 19,150 18,525 16,572 -10.5%
Bulgaria 8,273 8,514 9,521 11.8%
France 21,510 28,455 28,061 -1.4%
Germany 38,432 42,121 37,721 -10.4%
Greece 10,750 8,214 11,159 35.9%
Hungary 9,297 9,930 11,247 13.3%
Ireland 6,743 5,908 6,483 9.7%
Italy 181,053 212,219 214,152 0.9%
Netherlands 15,591 16,190 16,830 4.0%
Poland 16,092 16,237 16,031 -1.3%
Scandinavia 11,993 13,950 14,275 2.3%
Romania 5,876 5,343 6,254 17.1%
Spain 27,906 37,560 44,916 19.6%
Switzerland 7,302 8,812 7,559 -14.2%
Turkey 6,458 8,600 9,061 5.4%
United Kingdom 105,812 118,712 126,376 6.5%
USA 5,897 5,726 5,960 4.1%
Other 63,437 89,466 109,715 22.6%
Total 572,500 667,048 706,797 6.0%
Source: NSO (Outbound Tourism)
Main Indicators of Outbound Tourism from Malta
OUTBOUND TOURISM
2017 2018 2019% Change 2019/2018
Outbound tourist trips 572,500 667,048 706,797 6.0%
Nights spent 3,921,643 4,477,547 4,608,643 2.9%
Average length of stay 6.9 6.7 6.5 -0.2 of a night
Expenditure (€ '000s) 516,491 563,200 606,220 7.6%
Source: NSO (Outbound Tourism)
Page 7
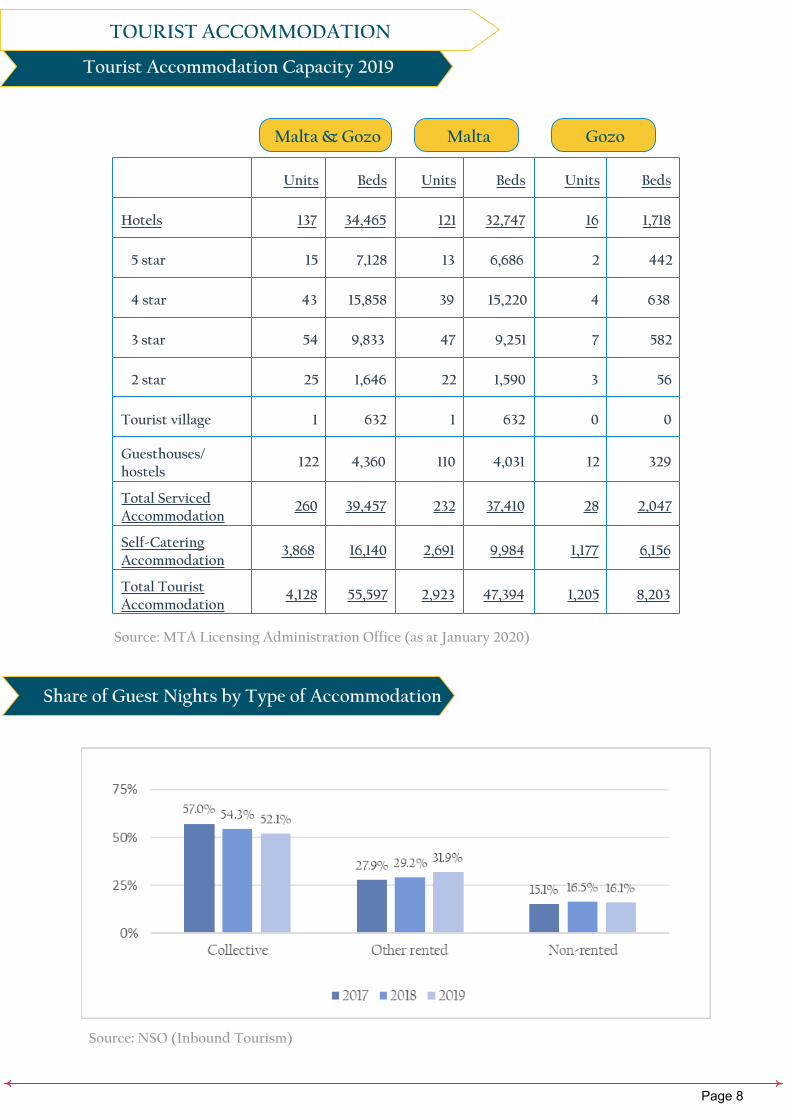
Tourist Accommodation Capacity 2019
TOURIST ACCOMMODATION
Units Beds Units Beds Units Beds
Hotels 137 34,465 121 32,747 16 1,718
5 star 15 7,128 13 6,686 2 442
4 star 43 15,858 39 15,220 4 638
3 star 54 9,833 47 9,251 7 582
2 star 25 1,646 22 1,590 3 56
Tourist village 1 632 1 632 0 0
Guesthouses/hostels
122 4,360 110 4,031 12 329
Total ServicedAccommodation
260 39,457 232 37,410 28 2,047
Self-CateringAccommodation
3,868 16,140 2,691 9,984 1,177 6,156
Total TouristAccommodation
4,128 55,597 2,923 47,394 1,205 8,203
Share of Guest Nights by Type of Accommodation
Source: MTA Licensing Administration Office (as at January 2020)
Source: NSO (Inbound Tourism)
Malta & Gozo Malta Gozo
Page 8
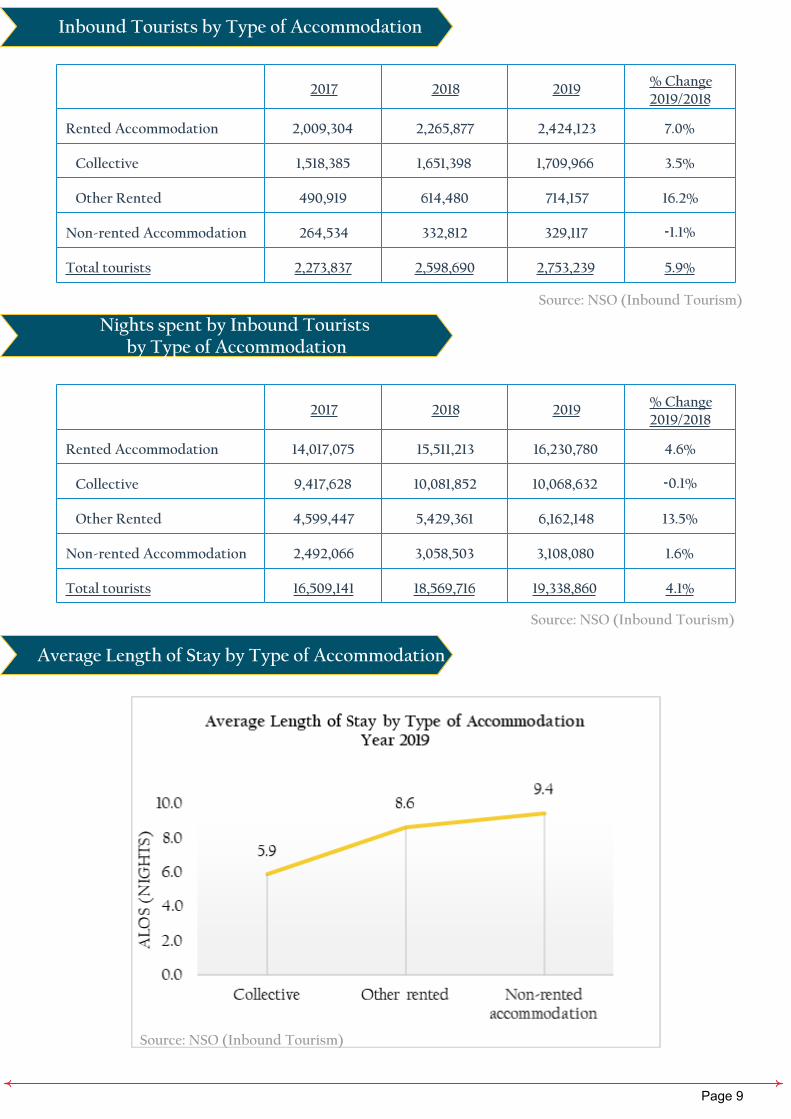
Inbound Tourists by Type of Accommodation
2017 2018 2019% Change2019/2018
Rented Accommodation 2,009,304 2,265,877 2,424,123 7.0%
Collective 1,518,385 1,651,398 1,709,966 3.5%
Other Rented 490,919 614,480 714,157 16.2%
Non-rented Accommodation 264,534 332,812 329,117 -1.1%
Total tourists 2,273,837 2,598,690 2,753,239 5.9%
Nights spent by Inbound Tourists by Type of Accommodation
2017 2018 2019% Change2019/2018
Rented Accommodation 14,017,075 15,511,213 16,230,780 4.6%
Collective 9,417,628 10,081,852 10,068,632 -0.1%
Other Rented 4,599,447 5,429,361 6,162,148 13.5%
Non-rented Accommodation 2,492,066 3,058,503 3,108,080 1.6%
Total tourists 16,509,141 18,569,716 19,338,860 4.1%
Average Length of Stay by Type of Accommodation
Source: NSO (Inbound Tourism)
Source: NSO (Inbound Tourism)
Source: NSO (Inbound Tourism)
Page 9
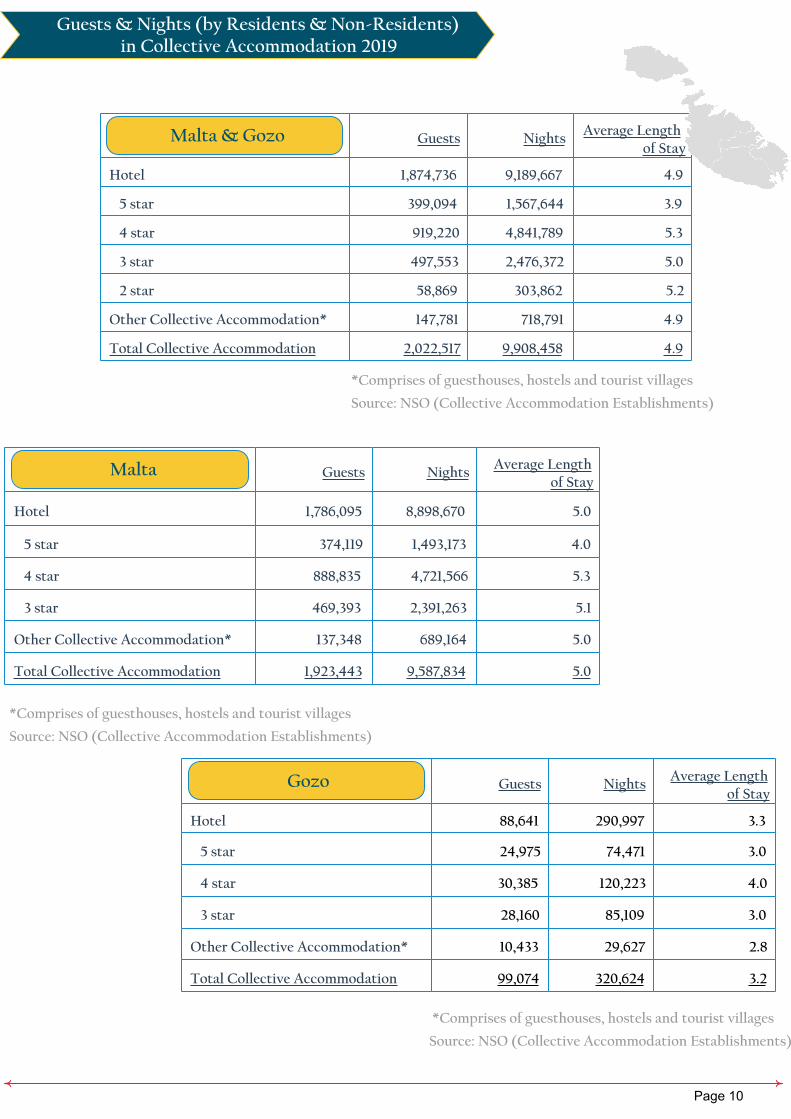
Guests & Nights (by Residents & Non-Residents) in Collective Accommodation 2019
*Comprises of guesthouses, hostels and tourist villages
Guests NightsAverage Length
of Stay
Hotel 1,874,736 9,189,667 4.9
5 star 399,094 1,567,644 3.9
4 star 919,220 4,841,789 5.3
3 star 497,553 2,476,372 5.0
2 star 58,869 303,862 5.2
Other Collective Accommodation* 147,781 718,791 4.9
Total Collective Accommodation 2,022,517 9,908,458 4.9
Malta & Gozo
Guests NightsAverage Length
of Stay
Hotel 1,786,095 8,898,670 5.0
5 star 374,119 1,493,173 4.0
4 star 888,835 4,721,566 5.3
3 star 469,393 2,391,263 5.1
Other Collective Accommodation* 137,348 689,164 5.0
Total Collective Accommodation 1,923,443 9,587,834 5.0
Malta
Guests NightsAverage Length
of Stay
Hotel 88,641 290,997 3.3
5 star 24,975 74,471 3.0
4 star 30,385 120,223 4.0
3 star 28,160 85,109 3.0
Other Collective Accommodation* 10,433 29,627 2.8
Total Collective Accommodation 99,074 320,624 3.2
Gozo
Source: NSO (Collective Accommodation Establishments)
*Comprises of guesthouses, hostels and tourist villages
Source: NSO (Collective Accommodation Establishments)
*Comprises of guesthouses, hostels and tourist villages
Source: NSO (Collective Accommodation Establishments)
Page 10
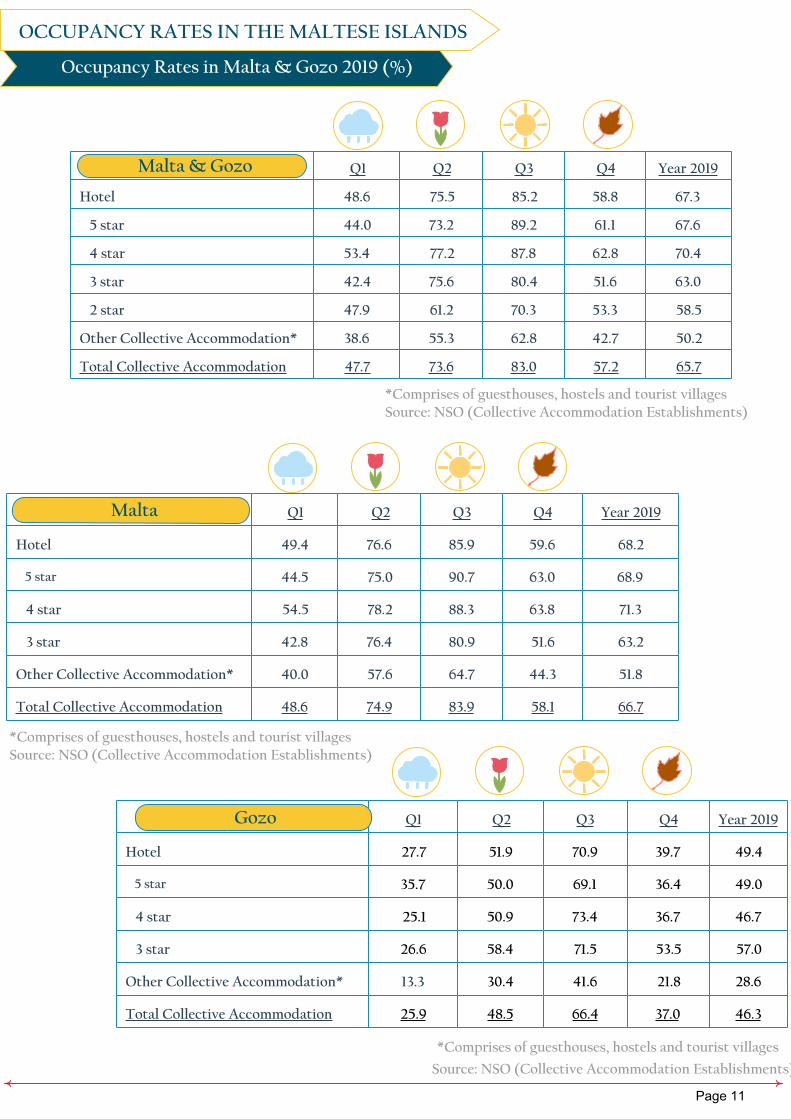
Occupancy Rates in Malta & Gozo 2019 (%)
OCCUPANCY RATES IN THE MALTESE ISLANDS
Q1 Q2 Q3 Q4 Year 2019
Hotel 48.6 75.5 85.2 58.8 67.3
5 star 44.0 73.2 89.2 61.1 67.6
4 star 53.4 77.2 87.8 62.8 70.4
3 star 42.4 75.6 80.4 51.6 63.0
2 star 47.9 61.2 70.3 53.3 58.5
Other Collective Accommodation* 38.6 55.3 62.8 42.7 50.2
Total Collective Accommodation 47.7 73.6 83.0 57.2 65.7
Malta & Gozo
Q1 Q2 Q3 Q4 Year 2019
Hotel 49.4 76.6 85.9 59.6 68.2
5 star 44.5 75.0 90.7 63.0 68.9
4 star 54.5 78.2 88.3 63.8 71.3
3 star 42.8 76.4 80.9 51.6 63.2
Other Collective Accommodation* 40.0 57.6 64.7 44.3 51.8
Total Collective Accommodation 48.6 74.9 83.9 58.1 66.7
Malta
Q1 Q2 Q3 Q4 Year 2019
Hotel 27.7 51.9 70.9 39.7 49.4
5 star 35.7 50.0 69.1 36.4 49.0
4 star 25.1 50.9 73.4 36.7 46.7
3 star 26.6 58.4 71.5 53.5 57.0
Other Collective Accommodation* 13.3 30.4 41.6 21.8 28.6
Total Collective Accommodation 25.9 48.5 66.4 37.0 46.3
Gozo
*Comprises of guesthouses, hostels and tourist villagesSource: NSO (Collective Accommodation Establishments)
*Comprises of guesthouses, hostels and tourist villages
Source: NSO (Collective Accommodation Establishments)
*Comprises of guesthouses, hostels and tourist villagesSource: NSO (Collective Accommodation Establishments)
Page 11
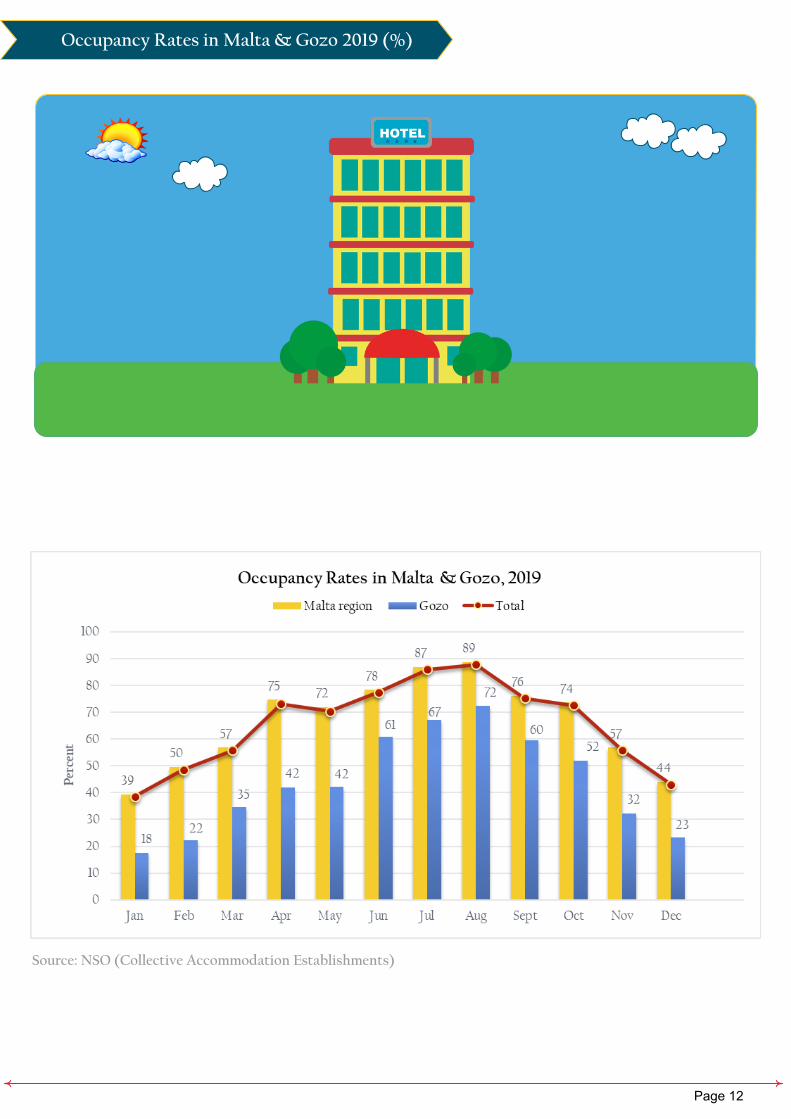
Occupancy Rates in Malta & Gozo 2019 (%)
Source: NSO (Collective Accommodation Establishments)
TextText
Text
Page 12
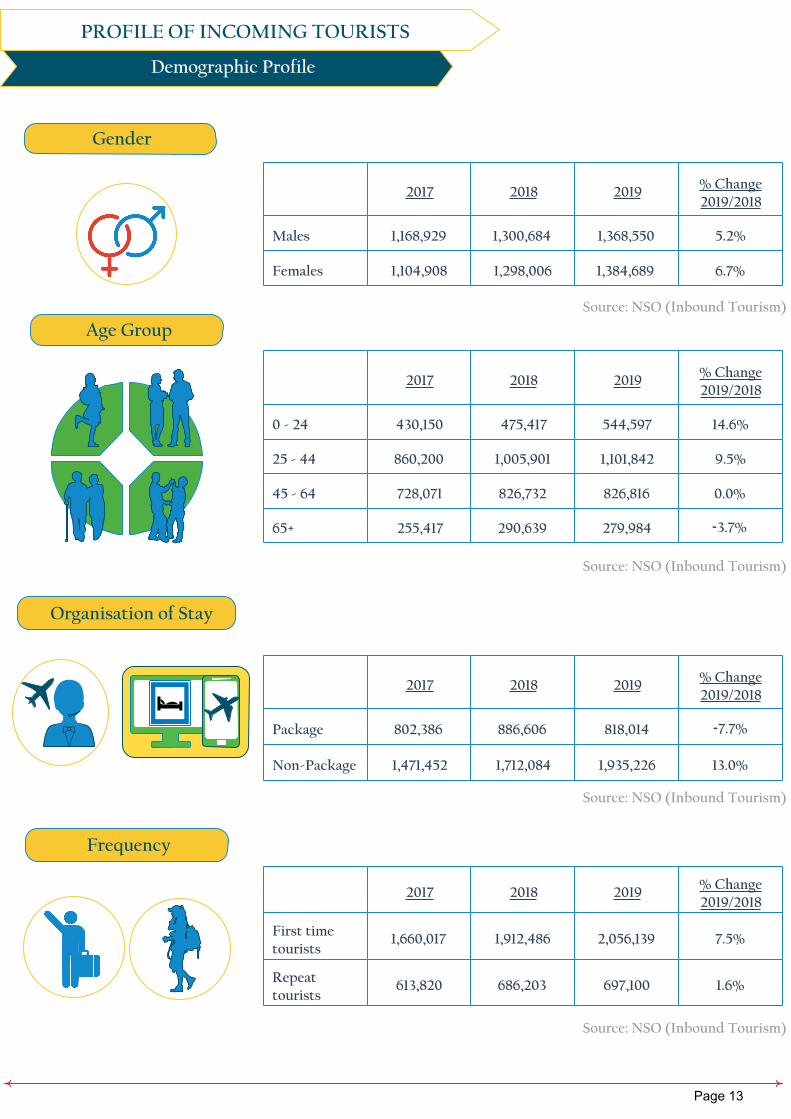
Demographic Profile
PROFILE OF INCOMING TOURISTS
2017 2018 2019% Change2019/2018
Males 1,168,929 1,300,684 1,368,550 5.2%
Females 1,104,908 1,298,006 1,384,689 6.7%
Gender
Age Group
2017 2018 2019% Change2019/2018
0 - 24 430,150 475,417 544,597 14.6%
25 - 44 860,200 1,005,901 1,101,842 9.5%
45 - 64 728,071 826,732 826,816 0.0%
65+ 255,417 290,639 279,984 -3.7%
Organisation of Stay
2017 2018 2019% Change2019/2018
Package 802,386 886,606 818,014 -7.7%
Non-Package 1,471,452 1,712,084 1,935,226 13.0%
Frequency
2017 2018 2019% Change2019/2018
First timetourists
1,660,017 1,912,486 2,056,139 7.5%
Repeattourists
613,820 686,203 697,100 1.6%
Source: NSO (Inbound Tourism)
Source: NSO (Inbound Tourism)
Source: NSO (Inbound Tourism)
Source: NSO (Inbound Tourism)
Page 13
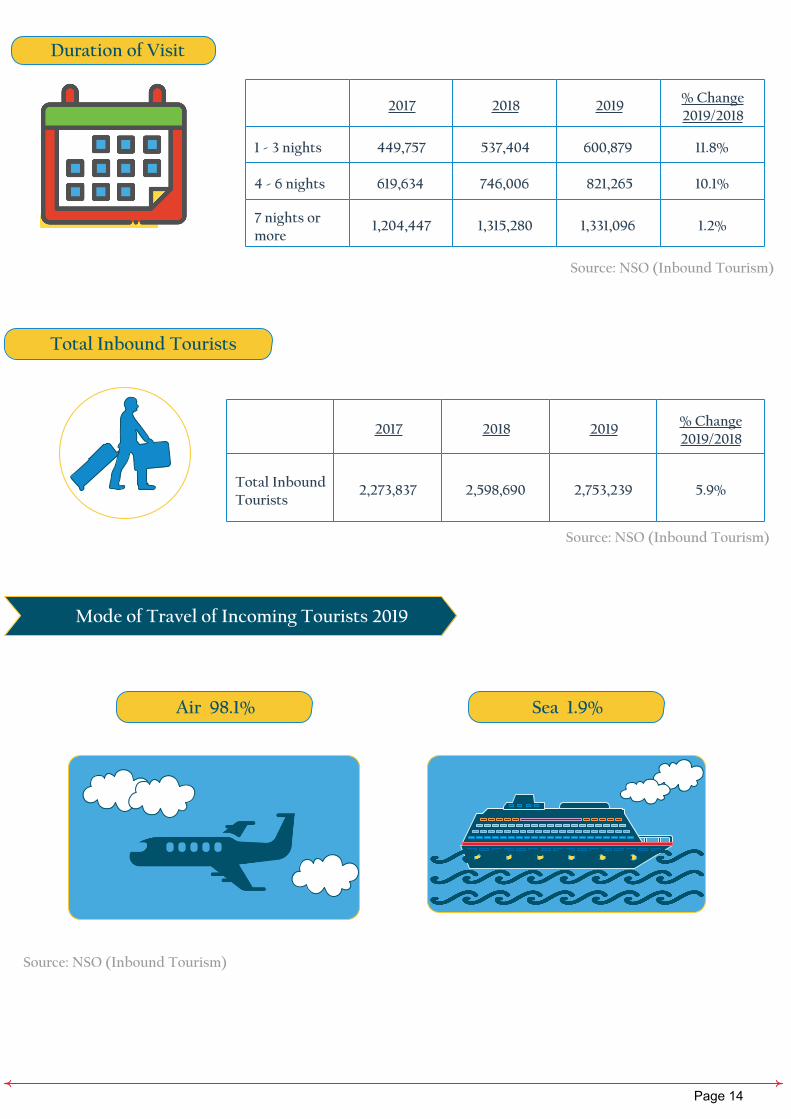
Mode of Travel of Incoming Tourists 2019
Air 98.1%
Text Text
Text
TextText
Duration of Visit
2017 2018 2019% Change2019/2018
1 - 3 nights 449,757 537,404 600,879 11.8%
4 - 6 nights 619,634 746,006 821,265 10.1%
7 nights or more
1,204,447 1,315,280 1,331,096 1.2%
Total Inbound Tourists
2017 2018 2019% Change2019/2018
Total InboundTourists
2,273,837 2,598,690 2,753,239 5.9%
Source: NSO (Inbound Tourism)
Source: NSO (Inbound Tourism)
Sea 1.9%
Source: NSO (Inbound Tourism)
Page 14
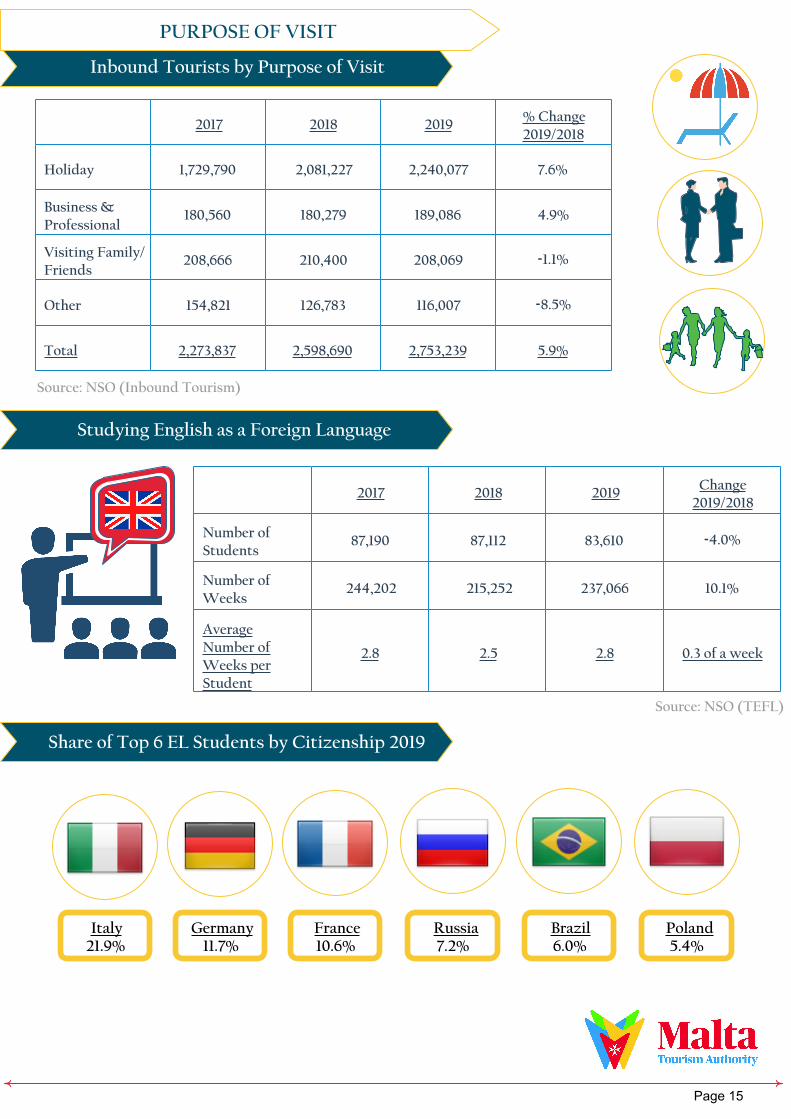
Inbound Tourists by Purpose of Visit
PURPOSE OF VISIT
2017 2018 2019% Change2019/2018
Holiday 1,729,790 2,081,227 2,240,077 7.6%
Business & Professional
180,560 180,279 189,086 4.9%
Visiting Family/Friends
208,666 210,400 208,069 -1.1%
Other 154,821 126,783 116,007 -8.5%
Total 2,273,837 2,598,690 2,753,239 5.9%
Studying English as a Foreign Language
Source: NSO (Inbound Tourism)
2017 2018 2019Change
2019/2018
Number ofStudents
87,190 87,112 83,610 -4.0%
Number of Weeks
244,202 215,252 237,066 10.1%
Average Number of Weeks per Student
2.8 2.5 2.8 0.3 of a week
Text
Share of Top 6 EL Students by Citizenship 2019
Source: NSO (TEFL)
Italy21.9%
Germany11.7%
France10.6%
Russia7.2%
Brazil6.0%
Poland5.4%
Page 15