Embed Size (px)
Citation preview
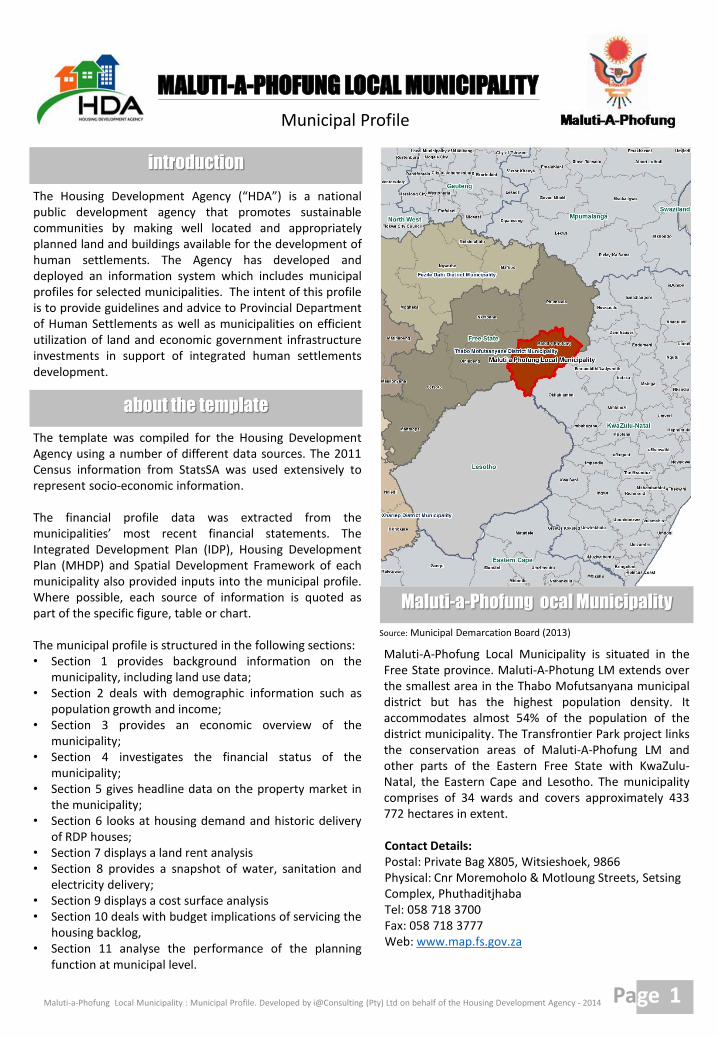
Source: Municipal Demarcation Board (2013)
MALUTI-A-PHOFUNG LOCAL MUNICIPALITY
Municipal Profile
Maluti-a-Phofung Local Municipality : Municipal Profile. Developed by i@Consulting (Pty) Ltd on behalf of the Housing Development Agency - 2014 Page 1
The Housing Development Agency (“HDA”) is a nationalpublic development agency that promotes sustainablecommunities by making well located and appropriatelyplanned land and buildings available for the development ofhuman settlements. The Agency has developed anddeployed an information system which includes municipalprofiles for selected municipalities. The intent of this profileis to provide guidelines and advice to Provincial Departmentof Human Settlements as well as municipalities on efficientutilization of land and economic government infrastructureinvestments in support of integrated human settlementsdevelopment.
introduction
The template was compiled for the Housing DevelopmentAgency using a number of different data sources. The 2011Census information from StatsSA was used extensively torepresent socio-economic information.
The financial profile data was extracted from themunicipalities’ most recent financial statements. TheIntegrated Development Plan (IDP), Housing DevelopmentPlan (MHDP) and Spatial Development Framework of eachmunicipality also provided inputs into the municipal profile.Where possible, each source of information is quoted aspart of the specific figure, table or chart.
The municipal profile is structured in the following sections:• Section 1 provides background information on the
municipality, including land use data;• Section 2 deals with demographic information such as
population growth and income;• Section 3 provides an economic overview of the
municipality;• Section 4 investigates the financial status of the
municipality;• Section 5 gives headline data on the property market in
the municipality;• Section 6 looks at housing demand and historic delivery
of RDP houses;• Section 7 displays a land rent analysis• Section 8 provides a snapshot of water, sanitation and
electricity delivery;• Section 9 displays a cost surface analysis• Section 10 deals with budget implications of servicing the
housing backlog,• Section 11 analyse the performance of the planning
function at municipal level.
about the template
Maluti-A-Phofung Local Municipality is situated in theFree State province. Maluti-A-Photung LM extends overthe smallest area in the Thabo Mofutsanyana municipaldistrict but has the highest population density. Itaccommodates almost 54% of the population of thedistrict municipality. The Transfrontier Park project linksthe conservation areas of Maluti-A-Phofung LM andother parts of the Eastern Free State with KwaZulu-Natal, the Eastern Cape and Lesotho. The municipalitycomprises of 34 wards and covers approximately 433772 hectares in extent.
Contact Details:Postal: Private Bag X805, Witsieshoek, 9866Physical: Cnr Moremoholo & Motloung Streets, Setsing Complex, PhuthaditjhabaTel: 058 718 3700Fax: 058 718 3777Web: www.map.fs.gov.za
Maluti-a-Phofung ocal Municipality
Section 1: Background
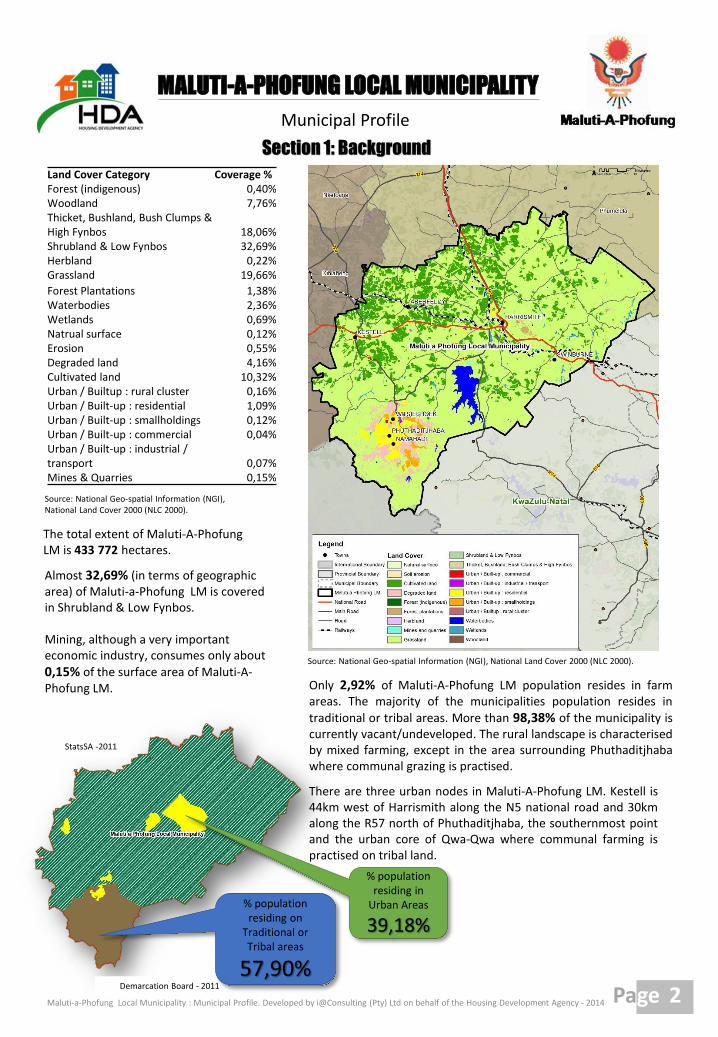
Almost 32,69% (in terms of geographic area) of Maluti-a-Phofung LM is covered in Shrubland & Low Fynbos.
Mining, although a very important economic industry, consumes only about
0,15% of the surface area of Maluti-A-Phofung LM.
Page 2
Only 2,92% of Maluti-A-Phofung LM population resides in farmareas. The majority of the municipalities population resides in
traditional or tribal areas. More than 98,38% of the municipality iscurrently vacant/undeveloped. The rural landscape is characterisedby mixed farming, except in the area surrounding Phuthaditjhabawhere communal grazing is practised.
Demarcation Board - 2011
StatsSA -2011
Municipal Profile
MALUTI-A-PHOFUNG LOCAL MUNICIPALITY
Maluti-a-Phofung Local Municipality : Municipal Profile. Developed by i@Consulting (Pty) Ltd on behalf of the Housing Development Agency - 2014
Land Cover Category Coverage %Forest (indigenous) 0,40%Woodland 7,76%Thicket, Bushland, Bush Clumps & High Fynbos 18,06%Shrubland & Low Fynbos 32,69%Herbland 0,22%Grassland 19,66%
Forest Plantations 1,38%Waterbodies 2,36%Wetlands 0,69%Natrual surface 0,12%Erosion 0,55%Degraded land 4,16%Cultivated land 10,32%Urban / Builtup : rural cluster 0,16%Urban / Built-up : residential 1,09%Urban / Built-up : smallholdings 0,12%Urban / Built-up : commercial 0,04%Urban / Built-up : industrial / transport 0,07%Mines & Quarries 0,15%
% population residing on
Traditional or Tribal areas
57,90%
% population residing in
Urban Areas
39,18%
There are three urban nodes in Maluti-A-Phofung LM. Kestell is44km west of Harrismith along the N5 national road and 30kmalong the R57 north of Phuthaditjhaba, the southernmost pointand the urban core of Qwa-Qwa where communal farming ispractised on tribal land.
Source: National Geo-spatial Information (NGI), National Land Cover 2000 (NLC 2000).
Source: National Geo-spatial Information (NGI), National Land Cover 2000 (NLC 2000).
The total extent of Maluti-A-PhofungLM is 433 772 hectares.
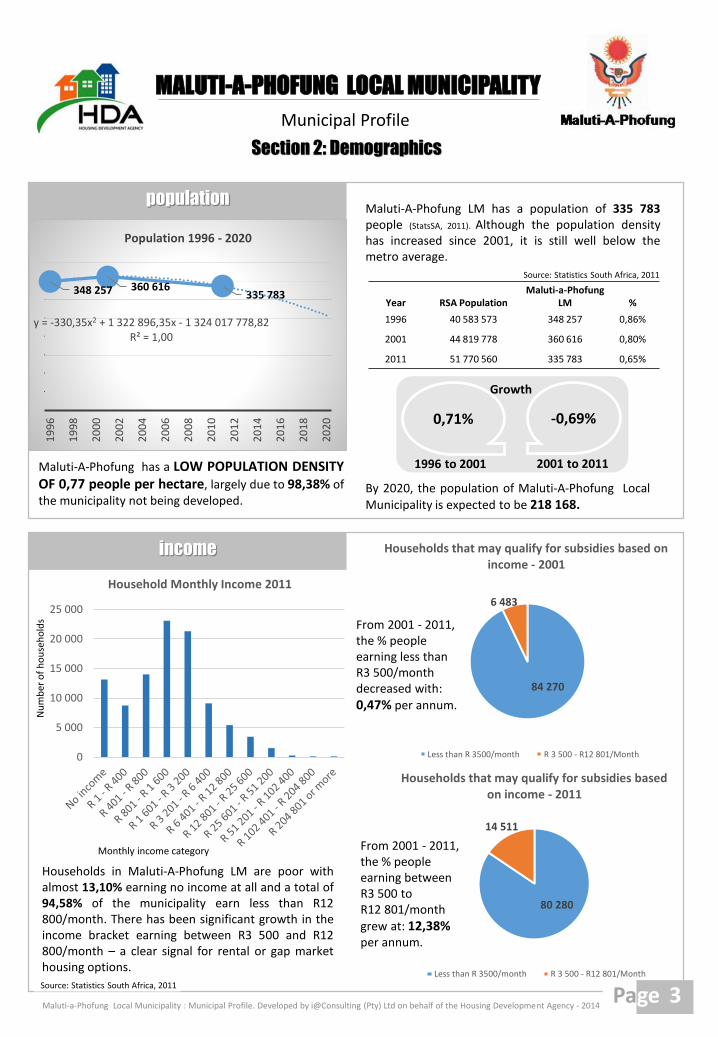
80 280
14 511
Households that may qualify for subsidies based on income - 2011
Less than R 3500/month R 3 500 - R12 801/Month
84 270
6 483
Households that may qualify for subsidies based on income - 2001
Less than R 3500/month R 3 500 - R12 801/Month0
5 000
10 000
15 000
20 000
25 000
Household Monthly Income 2011
Section 2: Demographics
Maluti-A-Phofung LM has a population of 335 783people (StatsSA, 2011). Although the population densityhas increased since 2001, it is still well below themetro average.
Maluti-A-Phofung has a LOW POPULATION DENSITYOF 0,77 people per hectare, largely due to 98,38% ofthe municipality not being developed.
population
1996 to 2001 2001 to 2011
0,71% -0,69%
Growth
By 2020, the population of Maluti-A-Phofung Local
Municipality is expected to be 218 168.
income
From 2001 - 2011, the % people earning less than R3 500/month decreased with:
0,47% per annum.
From 2001 - 2011, the % people earning between R3 500 to R12 801/month
grew at: 12,38%per annum.
Households in Maluti-A-Phofung LM are poor withalmost 13,10% earning no income at all and a total of94,58% of the municipality earn less than R12800/month. There has been significant growth in theincome bracket earning between R3 500 and R12800/month – a clear signal for rental or gap markethousing options.
Source: Statistics South Africa, 2011
Page 3
Municipal Profile
Monthly income category
Source: Statistics South Africa, 2011
Maluti-a-Phofung Local Municipality : Municipal Profile. Developed by i@Consulting (Pty) Ltd on behalf of the Housing Development Agency - 2014
MALUTI-A-PHOFUNG LOCAL MUNICIPALITY
Nu
mb
er o
f h
ou
seh
old
s
Year RSA PopulationMaluti-a-Phofung
LM %
1996 40 583 573 348 257 0,86%
2001 44 819 778 360 616 0,80%
2011 51 770 560 335 783 0,65%
348 257 360 616335 783
y = -330,35x2 + 1 322 896,35x - 1 324 017 778,82R² = 1,00
19
96
19
98
20
00
20
02
20
04
20
06
20
08
20
10
20
12
20
14
20
16
20
18
20
20
Population 1996 - 2020
0 10 000 20 000 30 000 40 000 50 000 60 000
No schooling
Grade 0
Grade 1 / Sub A
Grade 2 / Sub BGrade 3 / Standard 1 / ABET 1 (Kha Ri Gude,SANLI)
Grade 4 / Standard 2
Grade 5 / Standard 3 / ABET 2
Grade 6 / Standard 4
Grade 7 / Standard 5 / ABET 3
Grade 8 / Standard 6 / Form 1Grade 9 / Standard 7 / Form 2 / ABET 4
Grade 10 / Standard 8 / Form 3
Grade 11 / Standard 9 / Form 4
NTC I / N1 / NIC / (V) Level 2
NTC II / N2 / NIC / (V) Level 3
Certificate with less than Grade 12 / Std 10
Diploma with less than Grade 12 / Std 10
Grade 12 / Std 10 / Form 5
Grade 12 / Standard 10 / Form 5 / Matric / NTC111
NTC III / N3 / NIC / (V) Level 4
NTC IV / N4
NTC V / N5
NTC VI / N6
Certificate with Grade 12 / Std 10
Diploma with Grade 12 / Std 10
Higher Diploma
Post Higher Diploma (Masters, Doctoral Diploma)
Bachelors Degree
Bachelors Degree and Post graduate Diploma
Honours degree
Higher Degree (Masters / PhD)
Other
Number of people
Hig
hes
t le
vel o
f ed
uca
tio
n a
chie
ved
in
20
11
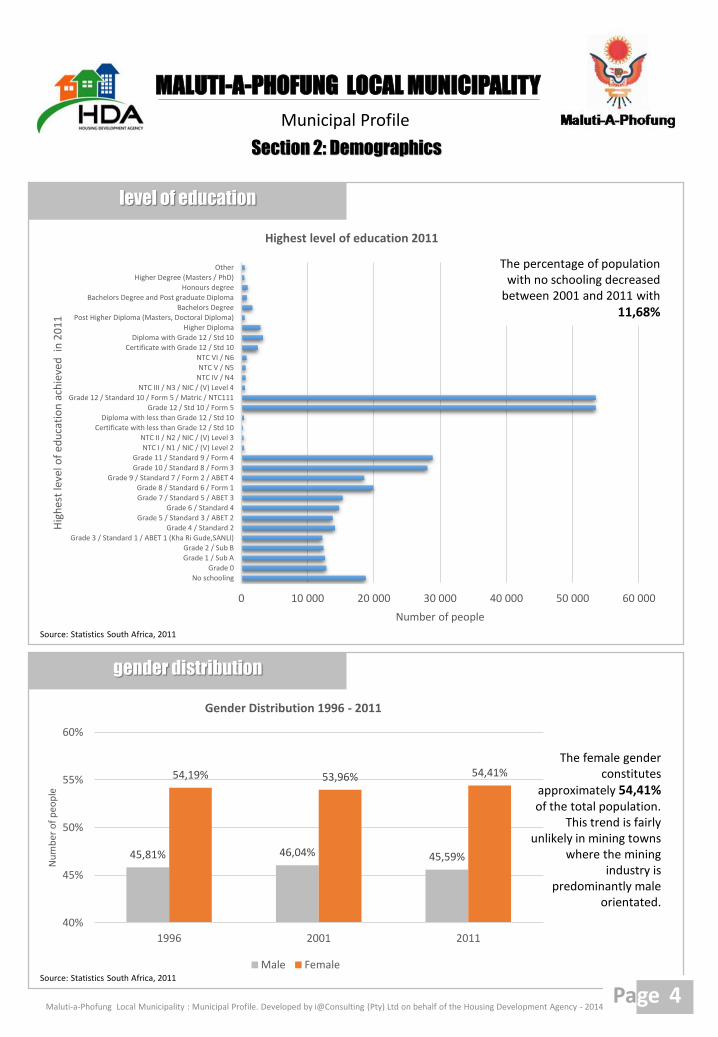
Highest level of education 2011
The percentage of population with no schooling decreased
between 2001 and 2011 with
11,68%
level of education
Section 2: Demographics
gender distribution
Source: Statistics South Africa, 2011
The female gender constitutes
approximately 54,41% of the total population.
This trend is fairly unlikely in mining towns
where the mining industry is
predominantly male orientated.
4Page
Municipal Profile
Source: Statistics South Africa, 2011
MALUTI-A-PHOFUNG LOCAL MUNICIPALITY
Maluti-a-Phofung Local Municipality : Municipal Profile. Developed by i@Consulting (Pty) Ltd on behalf of the Housing Development Agency - 2014
45,81% 46,04% 45,59%
54,19% 53,96% 54,41%
40%
45%
50%
55%
60%
1996 2001 2011
Nu
mb
er o
f p
eop
le
Gender Distribution 1996 - 2011
Male Female
Section 3: Economics
Page 5
economic sector & strength
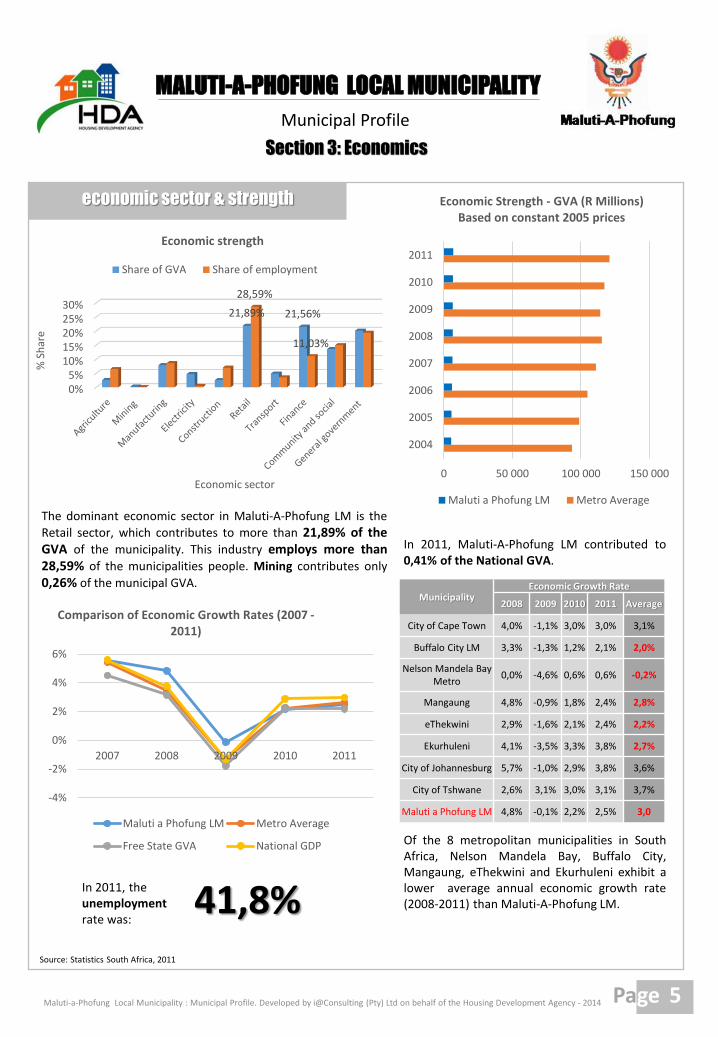
The dominant economic sector in Maluti-A-Phofung LM is the
Retail sector, which contributes to more than 21,89% of theGVA of the municipality. This industry employs more than28,59% of the municipalities people. Mining contributes only
0,26% of the municipal GVA.
In 2011, Maluti-A-Phofung LM contributed to0,41% of the National GVA.
Of the 8 metropolitan municipalities in SouthAfrica, Nelson Mandela Bay, Buffalo City,Mangaung, eThekwini and Ekurhuleni exhibit alower average annual economic growth rate(2008-2011) than Maluti-A-Phofung LM.
In 2011, theunemploymentrate was:
41,8%
Municipal Profile
Source: Statistics South Africa, 2011
MALUTI-A-PHOFUNG LOCAL MUNICIPALITY
Maluti-a-Phofung Local Municipality : Municipal Profile. Developed by i@Consulting (Pty) Ltd on behalf of the Housing Development Agency - 2014
0 50 000 100 000 150 000
2004
2005
2006
2007
2008
2009
2010
2011
Economic Strength - GVA (R Millions) Based on constant 2005 prices
Maluti a Phofung LM Metro Average
0%5%
10%15%20%25%30%
21,89% 21,56%
28,59%
11,03%
% S
har
e
Economic sector
Economic strength
Share of GVA Share of employment
-4%
-2%
0%
2%
4%
6%
2007 2008 2009 2010 2011
Comparison of Economic Growth Rates (2007 -2011)
Maluti a Phofung LM Metro Average
Free State GVA National GDP
MunicipalityEconomic Growth Rate
2008 2009 2010 2011 Average
City of Cape Town 4,0% -1,1% 3,0% 3,0% 3,1%
Buffalo City LM 3,3% -1,3% 1,2% 2,1% 2,0%
Nelson Mandela Bay Metro
0,0% -4,6% 0,6% 0,6% -0,2%
Mangaung 4,8% -0,9% 1,8% 2,4% 2,8%
eThekwini 2,9% -1,6% 2,1% 2,4% 2,2%
Ekurhuleni 4,1% -3,5% 3,3% 3,8% 2,7%
City of Johannesburg 5,7% -1,0% 2,9% 3,8% 3,6%
City of Tshwane 2,6% 3,1% 3,0% 3,1% 3,7%
Maluti a Phofung LM 4,8% -0,1% 2,2% 2,5% 3,0
Service charges
Infrastructure carrying value
R-
R500
R1 000
R1 500
R2 000
R2 500
R3 000
2012(Rand/million)
2013(Rand/million)
R331 R330
R2 744 R2 503
R-
R100
R200
R300
R400
R500
2013 (Rand/million)
Revenue billed R478
Renevue collected R408
Loss in cash flow R70
RA
ND
/MIL
LIO
N
Annual Collection Rate (2013)
Section 4: Financial Status of the
municipality
annual collection rate
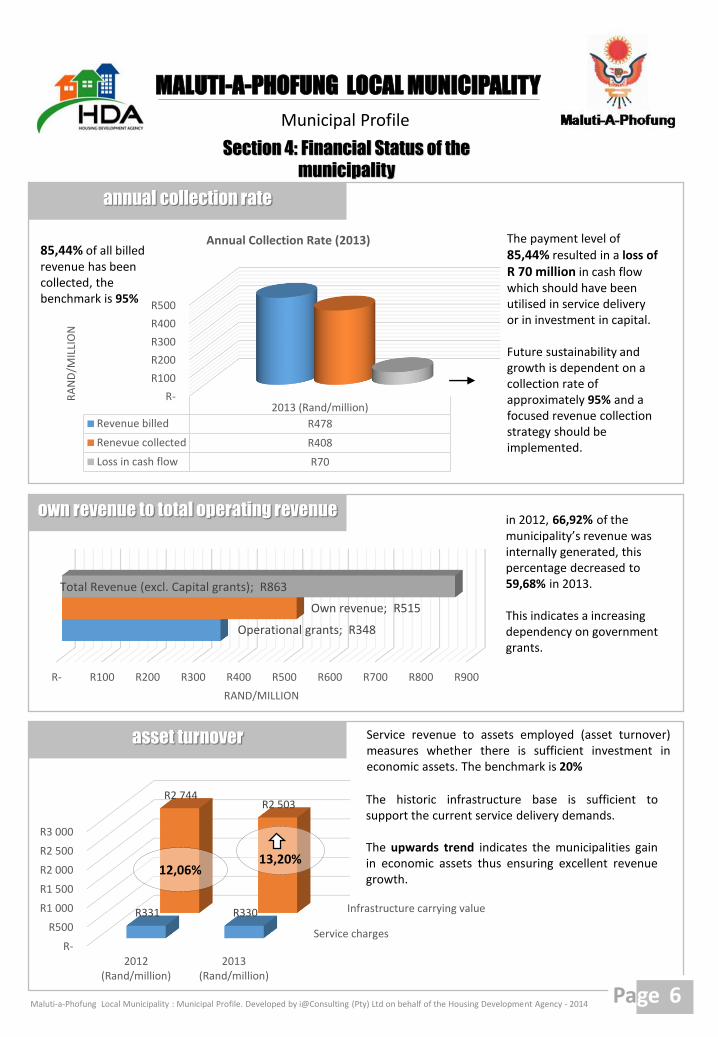
85,44% of all billed revenue has been collected, the benchmark is 95%
The payment level of
85,44% resulted in a loss of
R 70 million in cash flow which should have been utilised in service delivery or in investment in capital.
Future sustainability and growth is dependent on a collection rate of approximately 95% and a focused revenue collection strategy should be implemented.
own revenue to total operating revenue
asset turnover Service revenue to assets employed (asset turnover)measures whether there is sufficient investment ineconomic assets. The benchmark is 20%
Page 6
Municipal Profile
MALUTI-A-PHOFUNG LOCAL MUNICIPALITY
Maluti-a-Phofung Local Municipality : Municipal Profile. Developed by i@Consulting (Pty) Ltd on behalf of the Housing Development Agency - 2014
12,06%13,20%
The historic infrastructure base is sufficient tosupport the current service delivery demands.
The upwards trend indicates the municipalities gainin economic assets thus ensuring excellent revenuegrowth.
R- R100 R200 R300 R400 R500 R600 R700 R800 R900
Operational grants; R348
Own revenue; R515
Total Revenue (excl. Capital grants); R863
RAND/MILLION
in 2012, 66,92% of the municipality’s revenue was internally generated, this percentage decreased to 59,68% in 2013.
This indicates a increasing dependency on government grants.
05
101520253035404550
No
of
Tran
sfer
s
Total Number of Transfers
Section 4: Financial status of the
municipality
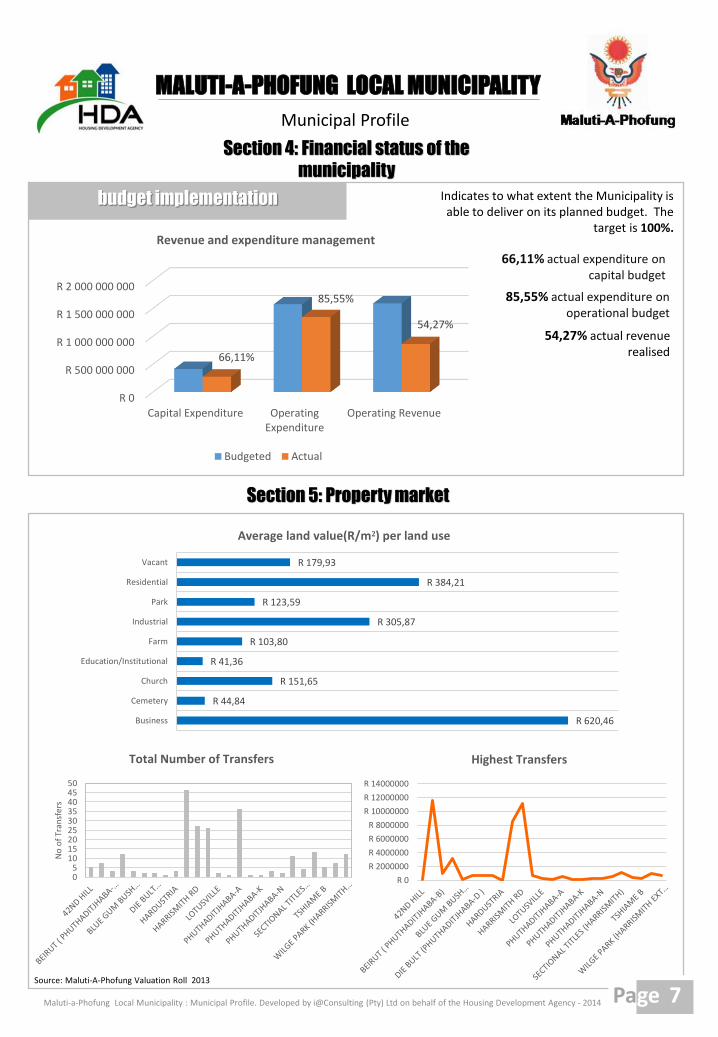
budget implementation Indicates to what extent the Municipality is able to deliver on its planned budget. The
target is 100%.
66,11% actual expenditure on capital budget
85,55% actual expenditure on operational budget
54,27% actual revenue realised
Page 7
Section 5: Property market
Municipal Profile
MALUTI-A-PHOFUNG LOCAL MUNICIPALITY
Maluti-a-Phofung Local Municipality : Municipal Profile. Developed by i@Consulting (Pty) Ltd on behalf of the Housing Development Agency - 2014
R 0
R 500 000 000
R 1 000 000 000
R 1 500 000 000
R 2 000 000 000
Capital Expenditure OperatingExpenditure
Operating Revenue
66,11%
85,55%
54,27%
Revenue and expenditure management
Budgeted Actual
R 0
R 2000000
R 4000000
R 6000000
R 8000000
R 10000000
R 12000000
R 14000000
Highest Transfers
Source: Maluti-A-Phofung Valuation Roll 2013
R 620,46
R 44,84
R 151,65
R 41,36
R 103,80
R 305,87
R 123,59
R 384,21
R 179,93
Business
Cemetery
Church
Education/Institutional
Farm
Industrial
Park
Residential
Vacant
Average land value(R/m²) per land use
Section 6: Housing demand and supply
dwelling type & housing backlog
housing delivery
Page 8
Municipal Profile
Source: Statistics South Africa, 2011
Source: Statistics South Africa, 2011
MALUTI-A-PHOFUNG LOCAL MUNICIPALITY
Maluti-a-Phofung Local Municipality : Municipal Profile. Developed by i@Consulting (Pty) Ltd on behalf of the Housing Development Agency - 2014
Housing ProjectsNumber of Units
Housing ProjectsNumber of Units
Kestell/Tlholong Corridor 1 200 Schoonplaatz 1253
Harrismith Extension 34 384 Tshiame A 1051
Harrismith Extension 35 800 Westerson 207
Phuthaditjhaba Weltevrede
500 Distater Park 208
Bluegumbosch 199 654 Tshiame D 554
Tshiame E 1 000 Intabazwe 690
Harrismith/IntabazweCorridor
1156
0 20 000 40 000 60 000 80 000
House
Traditional dwelling
Flat or apartment
Cluster house
Townhouse
Semi-detached house
House/flat/room in backyard
Backyard shack
Informal settlement
Servants quarters/granny flat
Other
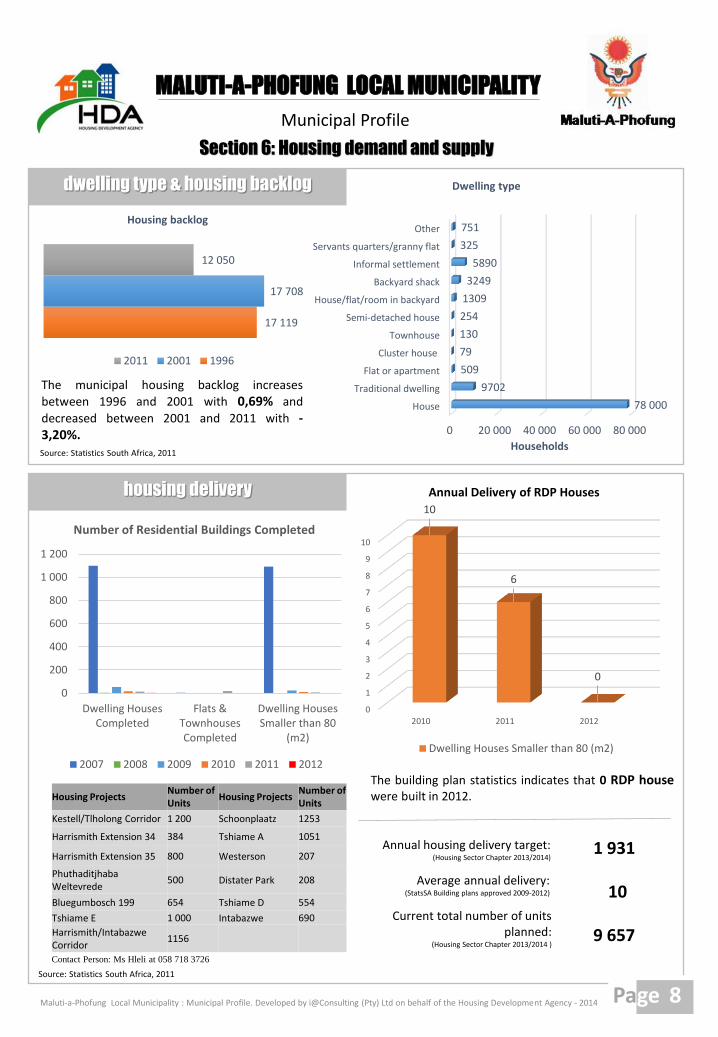
78 000
9702
509
79
130
254
1309
3249
5890
325
751
Households
Dwelling type
17 119
17 708
12 050
Housing backlog
2011 2001 1996
The municipal housing backlog increases
between 1996 and 2001 with 0,69% and
decreased between 2001 and 2011 with -3,20%.
0
200
400
600
800
1 000
1 200
Dwelling HousesCompleted
Flats &TownhousesCompleted
Dwelling HousesSmaller than 80
(m2)
Number of Residential Buildings Completed
2007 2008 2009 2010 2011 2012
0
1
2
3
4
5
6
7
8
9
10
2010 2011 2012
10
6
0
Annual Delivery of RDP Houses
Dwelling Houses Smaller than 80 (m2)
Annual housing delivery target:(Housing Sector Chapter 2013/2014)
Average annual delivery:(StatsSA Building plans approved 2009-2012)
Current total number of units planned:
(Housing Sector Chapter 2013/2014 )
1 931
10
9 657
The building plan statistics indicates that 0 RDP housewere built in 2012.
Contact Person: Ms Hleli at 058 718 3726
R 0
R 50
R 100
R 150
R 200
R 250
0-5 5-10 10-1515-2020-2525-3030-3535-40 > 60
Ran
d p
er/m
²
Time in min from CBD
Average Total Property value – Vacant Properties
R 0
R 100
R 200
R 300
R 400
R 500
0-5 5-10 10-1515-2020-2525-3030-3535-40
Ran
d p
er/m
²
Time in min from CBD
Average Total Property value – Residential Properties
R 0
R 100
R 200
R 300
R 400
R 500
R 600
R 700
0-5
5-1
0
10
-15
15
-20
20
-25
25
-30
30
-35
35
-40
40
-45
45
-50
50
-55
55
-60
> 6
0
Ran
d p
er/m
²
Time in min from CBD
Average Total Property value – Agricultural Properties
R 0
R 20
R 40
R 60
R 80
R 100
R 120
0-5 5-10 10-1515-2020-2525-3030-3535-40
Ran
d p
er/m
²
Time in min from CBD
Average Total Property value -Educational/Institutional Properties
R 0
R 200
R 400
R 600
R 800
R 1 000
R 1 200
0-5 5-10 10-15 15-20 20-25 25-30 30-35 35-40
Ran
d p
er/m
²
Time in min from CBD
Average Total Property value – Business Properties
Source: Maluti-A-Phofung Valuation Roll 2013
Municipal Profile
Page 9
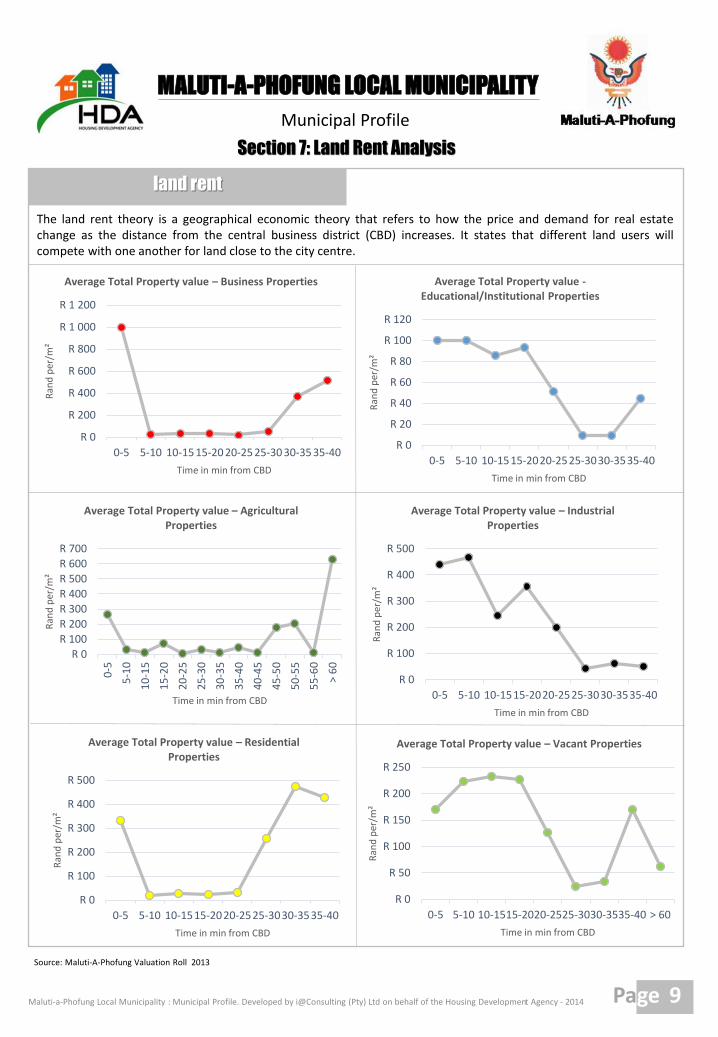
Section 7: Land Rent Analysis
MALUTI-A-PHOFUNG LOCAL MUNICIPALITY
The land rent theory is a geographical economic theory that refers to how the price and demand for real estatechange as the distance from the central business district (CBD) increases. It states that different land users willcompete with one another for land close to the city centre.
land rent
Maluti-a-Phofung Local Municipality : Municipal Profile. Developed by i@Consulting (Pty) Ltd on behalf of the Housing Development Agency - 2014
R 0
R 100
R 200
R 300
R 400
R 500
0-5 5-10 10-1515-2020-2525-3030-3535-40
Ran
d p
er/m
²
Time in min from CBD
Average Total Property value – Industrial Properties
0 20000 40000 60000 80000 100000
Electricity
Gas
Paraffin
Candles
Solar
None
Number of Households
Source of Lighting 2011
0 20 000 40 000 60 000
Water inside dwelling
Water inside yard
Water on community stand: <200mfrom dwelling
Water on community stand: >200mfrom dwelling
No access to piped water
Number of Households
Access to Piped Water: 2011
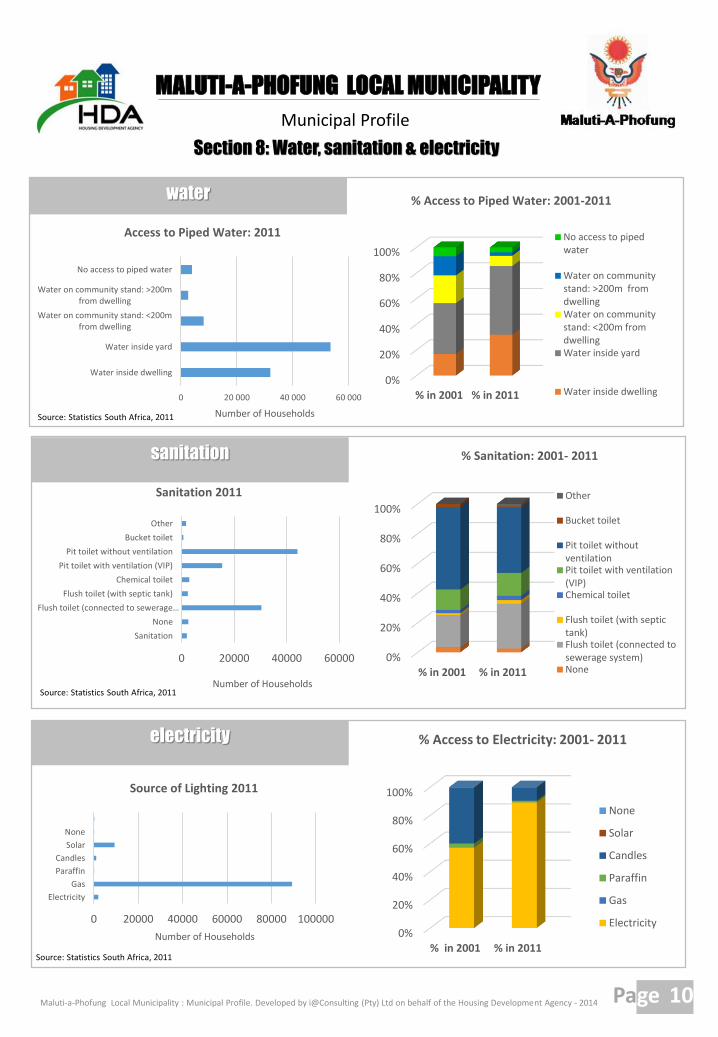
Section 8: Water, sanitation & electricity
water
Page 10
Municipal Profile
Source: Statistics South Africa, 2011
MALUTI-A-PHOFUNG LOCAL MUNICIPALITY
Maluti-a-Phofung Local Municipality : Municipal Profile. Developed by i@Consulting (Pty) Ltd on behalf of the Housing Development Agency - 2014
sanitation
Source: Statistics South Africa, 2011
electricity
0%
20%
40%
60%
80%
100%
% in 2001 % in 2011
% Access to Piped Water: 2001-2011
No access to pipedwater
Water on communitystand: >200m fromdwellingWater on communitystand: <200m fromdwellingWater inside yard
Water inside dwelling
0 20000 40000 60000
Sanitation
None
Flush toilet (connected to sewerage…
Flush toilet (with septic tank)
Chemical toilet
Pit toilet with ventilation (VIP)
Pit toilet without ventilation
Bucket toilet
Other
Number of Households
Sanitation 2011
Source: Statistics South Africa, 2011
0%
20%
40%
60%
80%
100%
% in 2001 % in 2011
% Sanitation: 2001- 2011
Other
Bucket toilet
Pit toilet withoutventilationPit toilet with ventilation(VIP)Chemical toilet
Flush toilet (with septictank)Flush toilet (connected tosewerage system)None
0%
20%
40%
60%
80%
100%
% in 2001 % in 2011
% Access to Electricity: 2001- 2011
None
Solar
Candles
Paraffin
Gas
Electricity
Municipal Profile
Page 11
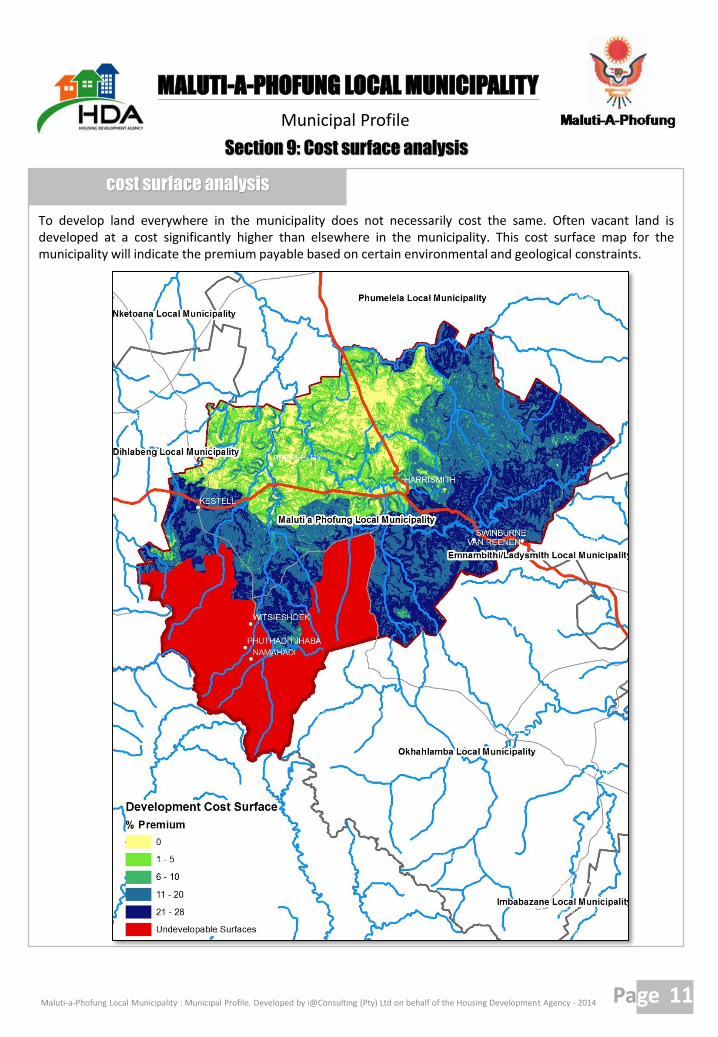
Section 9: Cost surface analysis
MALUTI-A-PHOFUNG LOCAL MUNICIPALITY
Maluti-a-Phofung Local Municipality : Municipal Profile. Developed by i@Consulting (Pty) Ltd on behalf of the Housing Development Agency - 2014
cost surface analysis
To develop land everywhere in the municipality does not necessarily cost the same. Often vacant land isdeveloped at a cost significantly higher than elsewhere in the municipality. This cost surface map for themunicipality will indicate the premium payable based on certain environmental and geological constraints.
Municipal Profile
Page 12
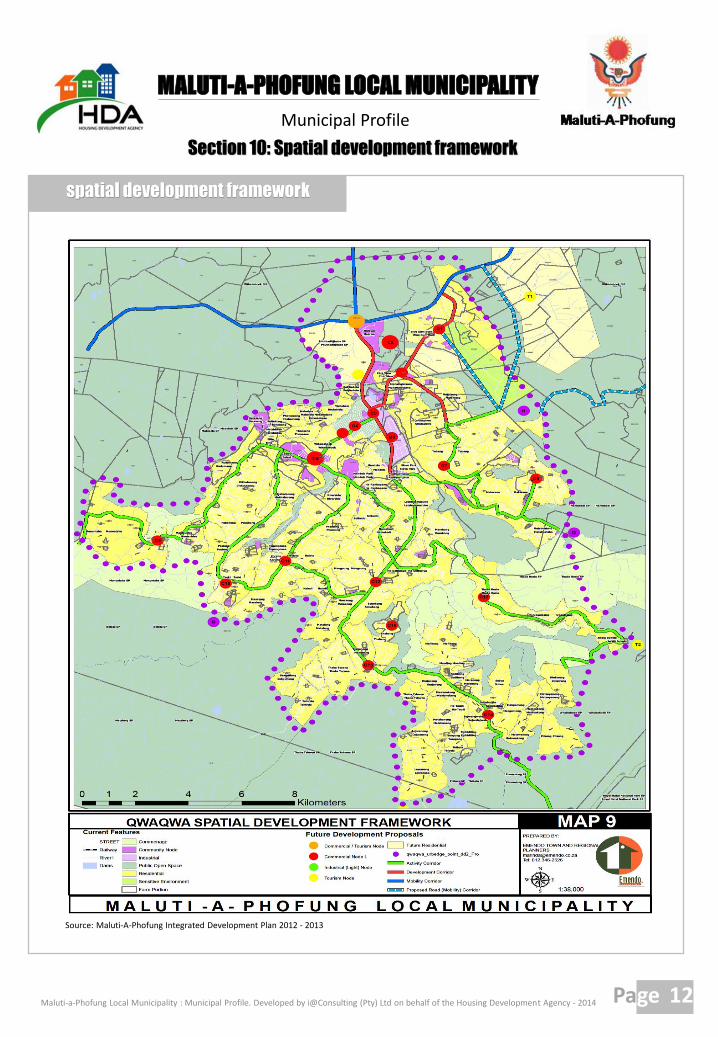
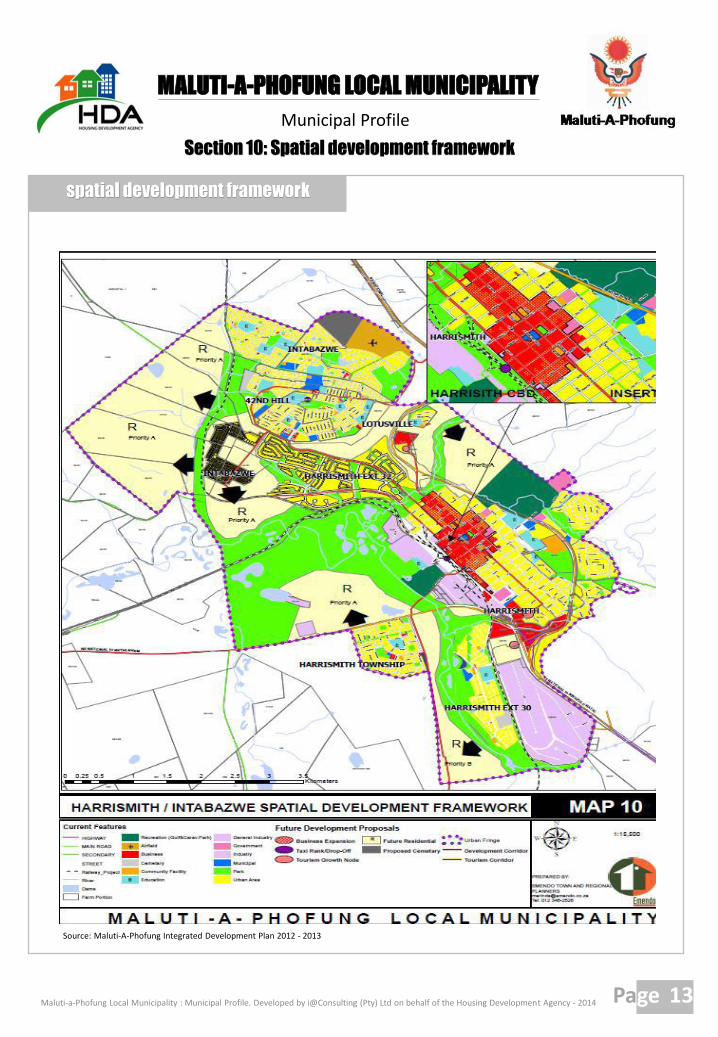
Section 10: Spatial development framework
MALUTI-A-PHOFUNG LOCAL MUNICIPALITY
Maluti-a-Phofung Local Municipality : Municipal Profile. Developed by i@Consulting (Pty) Ltd on behalf of the Housing Development Agency - 2014
spatial development framework
Source: Maluti-A-Phofung Integrated Development Plan 2012 - 2013
Municipal Profile
Page 13
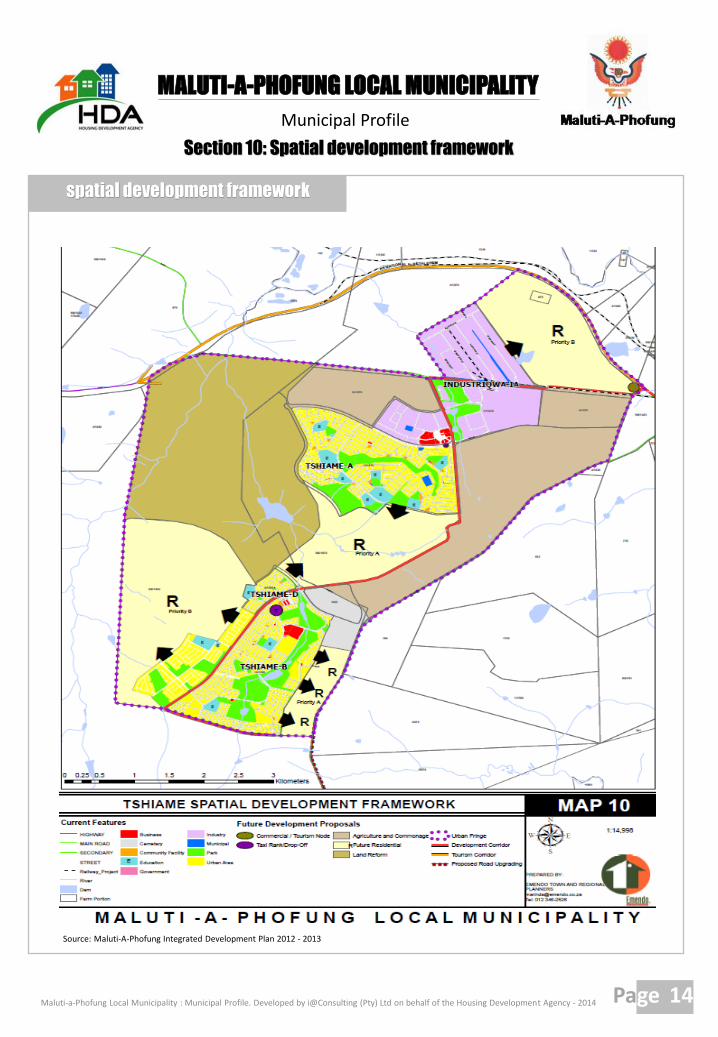
Section 10: Spatial development framework
MALUTI-A-PHOFUNG LOCAL MUNICIPALITY
Maluti-a-Phofung Local Municipality : Municipal Profile. Developed by i@Consulting (Pty) Ltd on behalf of the Housing Development Agency - 2014
spatial development framework
Source: Maluti-A-Phofung Integrated Development Plan 2012 - 2013
Municipal Profile
Page 14
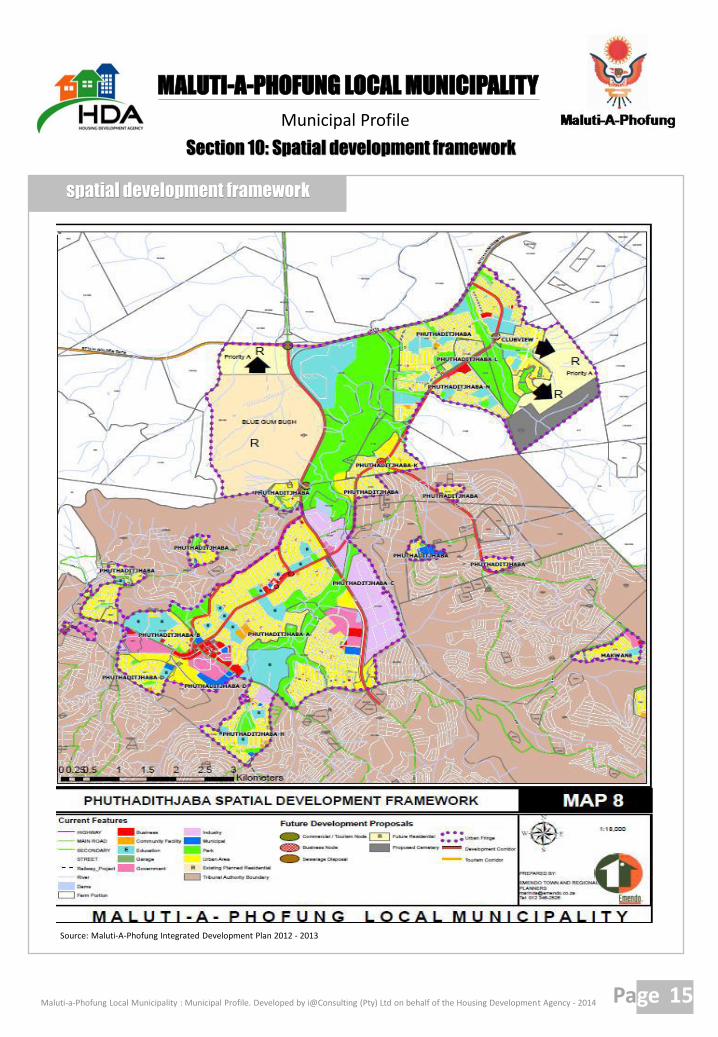
Section 10: Spatial development framework
MALUTI-A-PHOFUNG LOCAL MUNICIPALITY
Maluti-a-Phofung Local Municipality : Municipal Profile. Developed by i@Consulting (Pty) Ltd on behalf of the Housing Development Agency - 2014
spatial development framework
Source: Maluti-A-Phofung Integrated Development Plan 2012 - 2013
Municipal Profile
Page 15
Section 10: Spatial development framework
MALUTI-A-PHOFUNG LOCAL MUNICIPALITY
Maluti-a-Phofung Local Municipality : Municipal Profile. Developed by i@Consulting (Pty) Ltd on behalf of the Housing Development Agency - 2014
spatial development framework
Source: Maluti-A-Phofung Integrated Development Plan 2012 - 2013
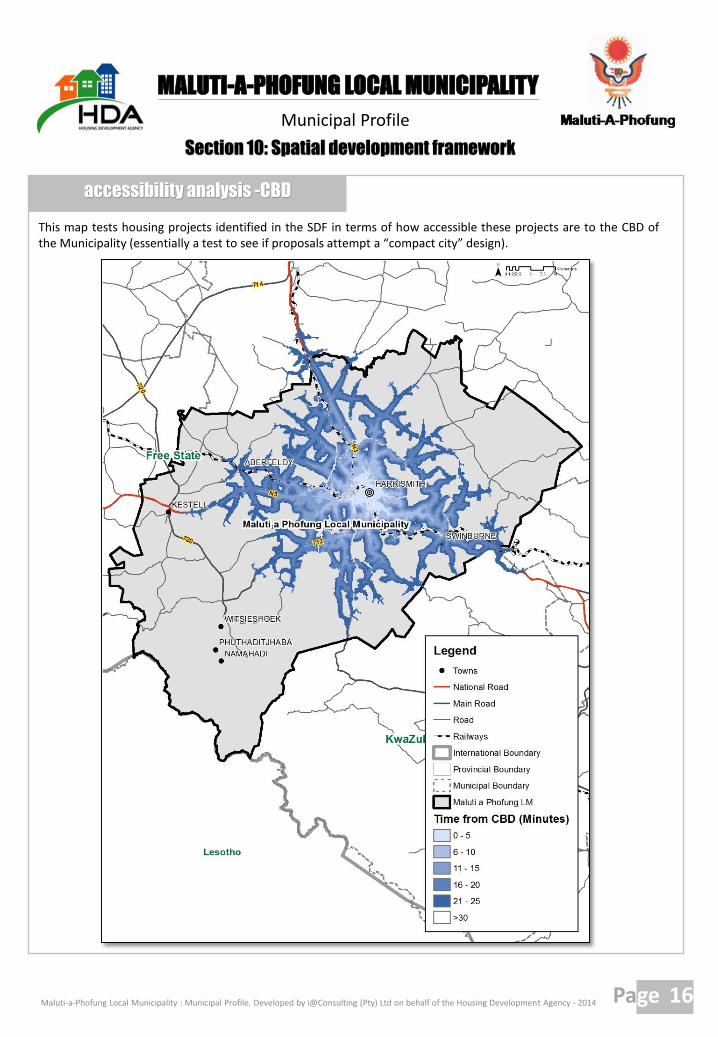
This map tests housing projects identified in the SDF in terms of how accessible these projects are to the CBD ofthe Municipality (essentially a test to see if proposals attempt a “compact city” design).
Municipal Profile
Page 16
Section 10: Spatial development framework
MALUTI-A-PHOFUNG LOCAL MUNICIPALITY
Maluti-a-Phofung Local Municipality : Municipal Profile. Developed by i@Consulting (Pty) Ltd on behalf of the Housing Development Agency - 2014
accessibility analysis -CBD
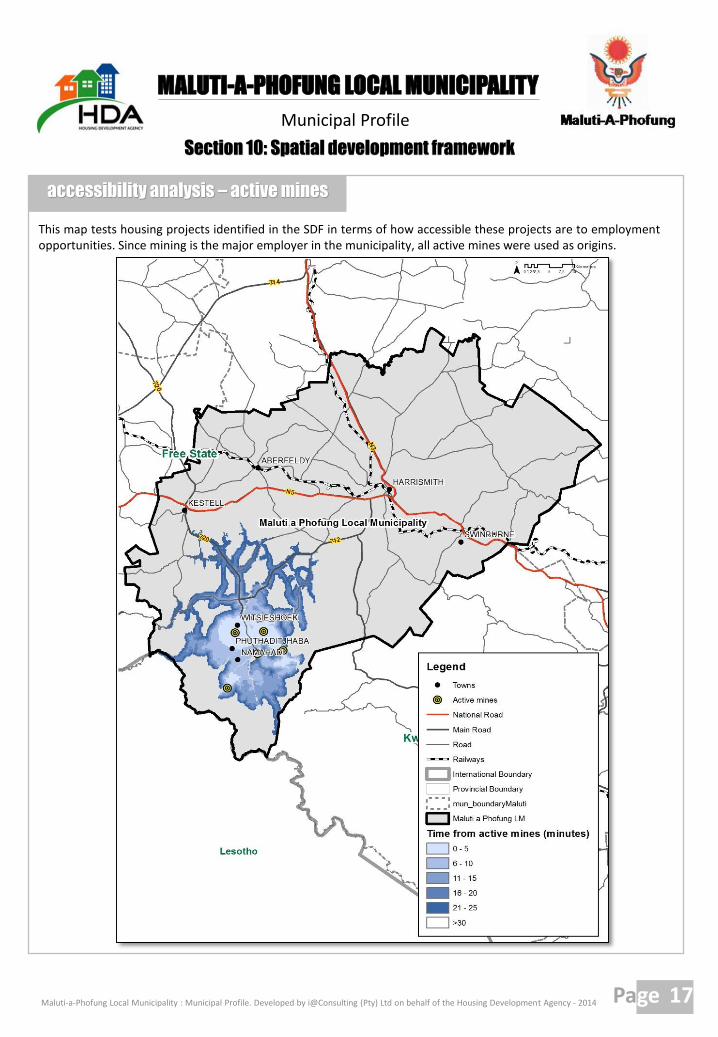
This map tests housing projects identified in the SDF in terms of how accessible these projects are to employmentopportunities. Since mining is the major employer in the municipality, all active mines were used as origins.
Municipal Profile
Page 17
Section 10: Spatial development framework
MALUTI-A-PHOFUNG LOCAL MUNICIPALITY
Maluti-a-Phofung Local Municipality : Municipal Profile. Developed by i@Consulting (Pty) Ltd on behalf of the Housing Development Agency - 2014
accessibility analysis – active mines
Municipal Profile
Page 18
Section 10: Spatial development framework
MALUTI-A-PHOFUNG LOCAL MUNICIPALITY
Maluti-a-Phofung Local Municipality : Municipal Profile. Developed by i@Consulting (Pty) Ltd on behalf of the Housing Development Agency - 2014
budget implications of the SDF
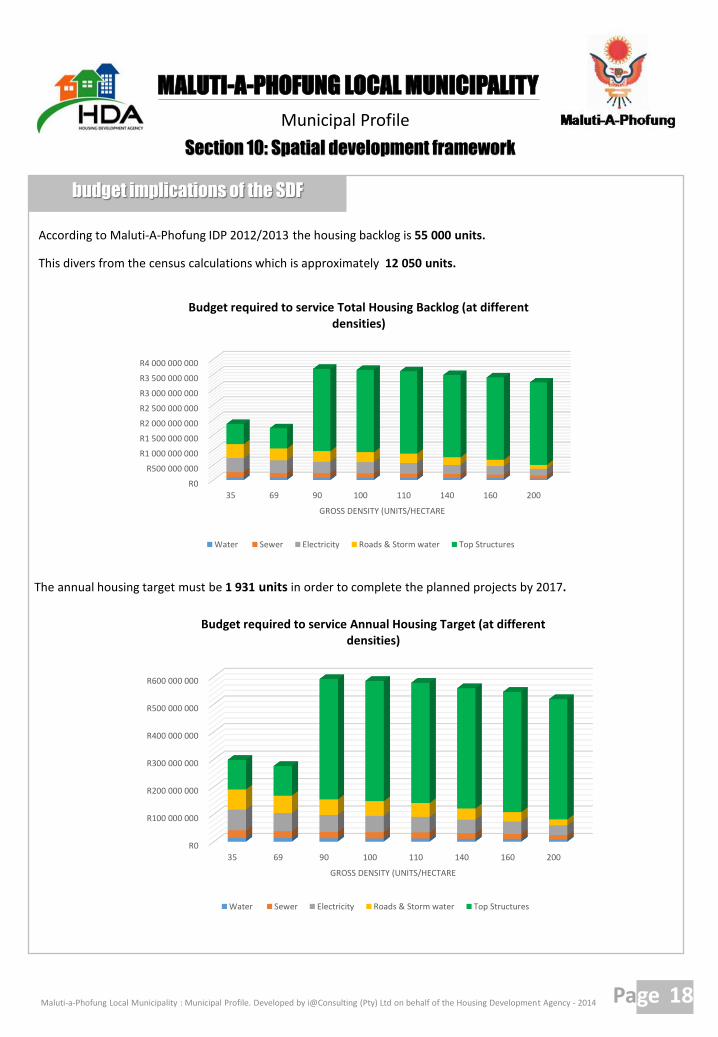
This divers from the census calculations which is approximately 12 050 units.
According to Maluti-A-Phofung IDP 2012/2013 the housing backlog is 55 000 units.
R0
R500 000 000
R1 000 000 000
R1 500 000 000
R2 000 000 000
R2 500 000 000
R3 000 000 000
R3 500 000 000
R4 000 000 000
35 69 90 100 110 140 160 200
GROSS DENSITY (UNITS/HECTARE
Budget required to service Total Housing Backlog (at different densities)
Water Sewer Electricity Roads & Storm water Top Structures
R0
R100 000 000
R200 000 000
R300 000 000
R400 000 000
R500 000 000
R600 000 000
35 69 90 100 110 140 160 200
GROSS DENSITY (UNITS/HECTARE
Budget required to service Annual Housing Target (at different densities)
Water Sewer Electricity Roads & Storm water Top Structures
The annual housing target must be 1 931 units in order to complete the planned projects by 2017.
Municipal Profile
Page 19
Section 11: Planning practises assessment
MALUTI-A-PHOFUNG LOCAL MUNICIPALITY
Maluti-a-Phofung Local Municipality : Municipal Profile. Developed by i@Consulting (Pty) Ltd on behalf of the Housing Development Agency - 2014
summary
scope of planning practises
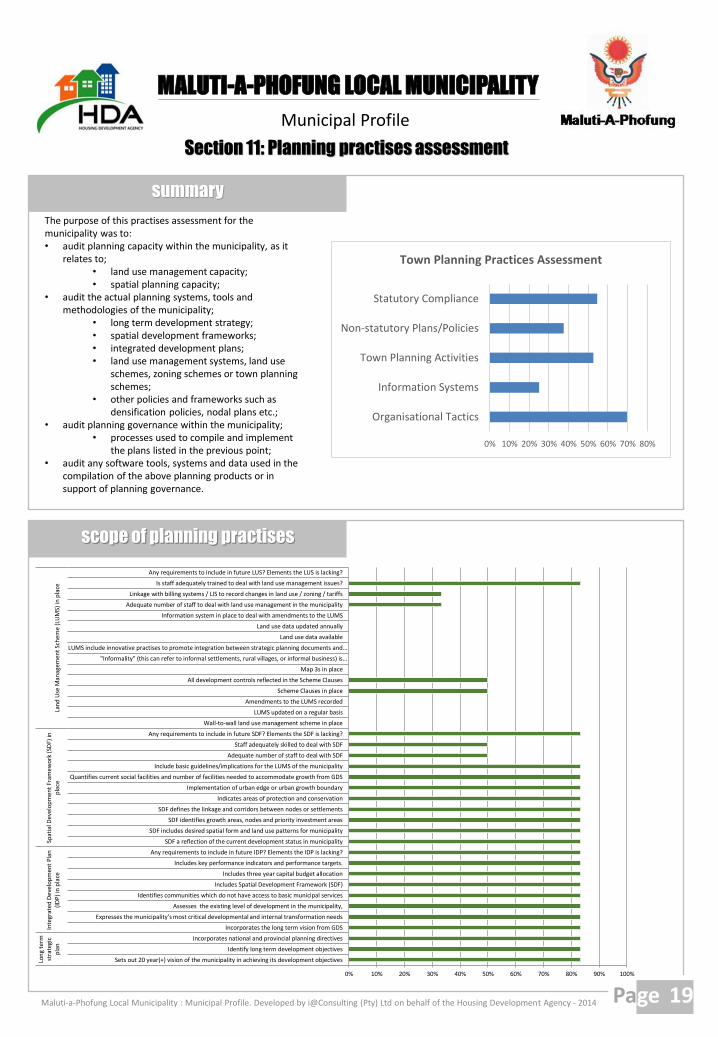
The purpose of this practises assessment for the municipality was to:• audit planning capacity within the municipality, as it
relates to;• land use management capacity;• spatial planning capacity;
• audit the actual planning systems, tools and methodologies of the municipality;
• long term development strategy;• spatial development frameworks;• integrated development plans;• land use management systems, land use
schemes, zoning schemes or town planning schemes;
• other policies and frameworks such as densification policies, nodal plans etc.;
• audit planning governance within the municipality;• processes used to compile and implement
the plans listed in the previous point;• audit any software tools, systems and data used in the
compilation of the above planning products or in support of planning governance.
0% 10% 20% 30% 40% 50% 60% 70% 80%
Organisational Tactics
Information Systems
Town Planning Activities
Non-statutory Plans/Policies
Statutory Compliance
Town Planning Practices Assessment
0% 10% 20% 30% 40% 50% 60% 70% 80% 90% 100%
Sets out 20 year(+) vision of the municipality in achieving its development objectives
Identify long term development objectives
Incorporates national and provincial planning directives
Incorporates the long term vision from GDS
Expresses the municipality’s most critical developmental and internal transformation needs
Assesses the existing level of development in the municipality,
Identifies communities which do not have access to basic municipal services
Includes Spatial Development Framework (SDF)
Includes three year capital budget allocation
Includes key performance indicators and performance targets.
Any requirements to include in future IDP? Elements the IDP is lacking?
SDF a reflection of the current development status in municipality
SDF includes desired spatial form and land use patterns for municipality
SDF identifies growth areas, nodes and priority investment areas
SDF defines the linkage and corridors between nodes or settlements
Indicates areas of protection and conservation
Implementation of urban edge or urban growth boundary
Quantifies current social facilities and number of facilities needed to accommodate growth from GDS
Include basic guidelines/implications for the LUMS of the municipality
Adequate number of staff to deal with SDF
Staff adequately skilled to deal with SDF
Any requirements to include in future SDF? Elements the SDF is lacking?
Wall-to-wall land use management scheme in place
LUMS updated on a regular basis
Amendments to the LUMS recorded
Scheme Clauses in place
All development controls reflected in the Scheme Clauses
Map 3s in place
"Informality" (this can refer to informal settlements, rural villages, or informal business) is…
LUMS include innovative practises to promote integration between strategic planning documents and…
Land use data available
Land use data updated annually
Information system in place to deal with amendments to the LUMS
Adequate number of staff to deal with land use management in the municipality
Linkage with billing systems / LIS to record changes in land use / zoning / tariffs
Is staff adequately trained to deal with land use management issues?
Any requirements to include in future LUS? Elements the LUS is lacking?
Lon
g te
rmst
rate
gic
pla
nIn
tegr
ated
Dev
elo
pm
ent
Plan
(ID
P) in
pla
ceSp
atia
l Dev
elo
pm
ent
Fram
ewo
rk (
SDF)
inp
lace
Lan
d U
se M
anag
em
ent
Sch
eme
(LU
MS)
in p
lace
Municipal Profile
Page 20
Section 11: Planning practises assessment
MALUTI-A-PHOFUNG LOCAL MUNICIPALITY
Maluti-a-Phofung Local Municipality : Municipal Profile. Developed by i@Consulting (Pty) Ltd on behalf of the Housing Development Agency - 2014
planning activities
systems
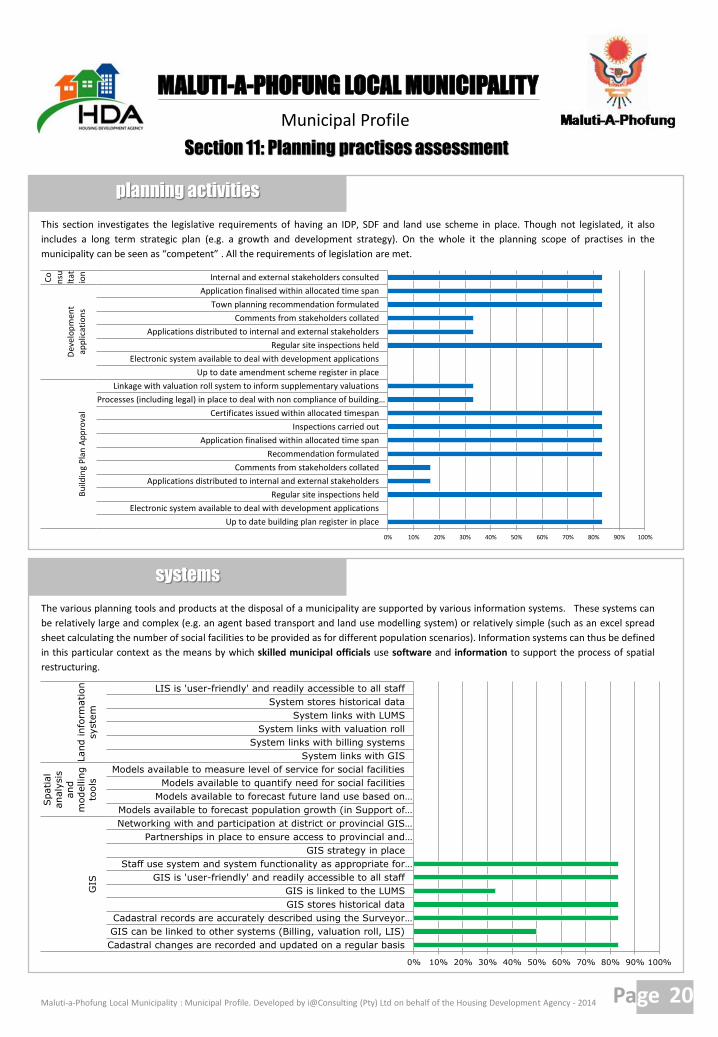
This section investigates the legislative requirements of having an IDP, SDF and land use scheme in place. Though not legislated, it also
includes a long term strategic plan (e.g. a growth and development strategy). On the whole it the planning scope of practises in the
municipality can be seen as “competent” . All the requirements of legislation are met.
The various planning tools and products at the disposal of a municipality are supported by various information systems. These systems can
be relatively large and complex (e.g. an agent based transport and land use modelling system) or relatively simple (such as an excel spread
sheet calculating the number of social facilities to be provided as for different population scenarios). Information systems can thus be defined
in this particular context as the means by which skilled municipal officials use software and information to support the process of spatial
restructuring.
0% 10% 20% 30% 40% 50% 60% 70% 80% 90% 100%
Up to date building plan register in place
Electronic system available to deal with development applications
Regular site inspections held
Applications distributed to internal and external stakeholders
Comments from stakeholders collated
Recommendation formulated
Application finalised within allocated time span
Inspections carried out
Certificates issued within allocated timespan
Processes (including legal) in place to deal with non compliance of building…
Linkage with valuation roll system to inform supplementary valuations
Up to date amendment scheme register in place
Electronic system available to deal with development applications
Regular site inspections held
Applications distributed to internal and external stakeholders
Comments from stakeholders collated
Town planning recommendation formulated
Application finalised within allocated time span
Internal and external stakeholders consulted
Bu
ildin
g P
lan
Ap
pro
val
Dev
elo
pm
ent
app
licat
ion
s
Co
nsu
ltat
ion
0% 10% 20% 30% 40% 50% 60% 70% 80% 90% 100%
Cadastral changes are recorded and updated on a regular basis
GIS can be linked to other systems (Billing, valuation roll, LIS)
Cadastral records are accurately described using the Surveyor…
GIS stores historical data
GIS is linked to the LUMS
GIS is 'user-friendly' and readily accessible to all staff
Staff use system and system functionality as appropriate for…
GIS strategy in place
Partnerships in place to ensure access to provincial and…
Networking with and participation at district or provincial GIS…
Models available to forecast population growth (in Support of…
Models available to forecast future land use based on…
Models available to quantify need for social facilities
Models available to measure level of service for social facilities
System links with GIS
System links with billing systems
System links with valuation roll
System links with LUMS
System stores historical data
LIS is 'user-friendly' and readily accessible to all staff
GIS
Spatial
analy
sis
and
modellin
g
tools
Land info
rmation
syste
m
Municipal Profile
Page 21
Section 11: Planning practises assessment
MALUTI-A-PHOFUNG LOCAL MUNICIPALITY
Maluti-a-Phofung Local Municipality : Municipal Profile. Developed by i@Consulting (Pty) Ltd on behalf of the Housing Development Agency - 2014
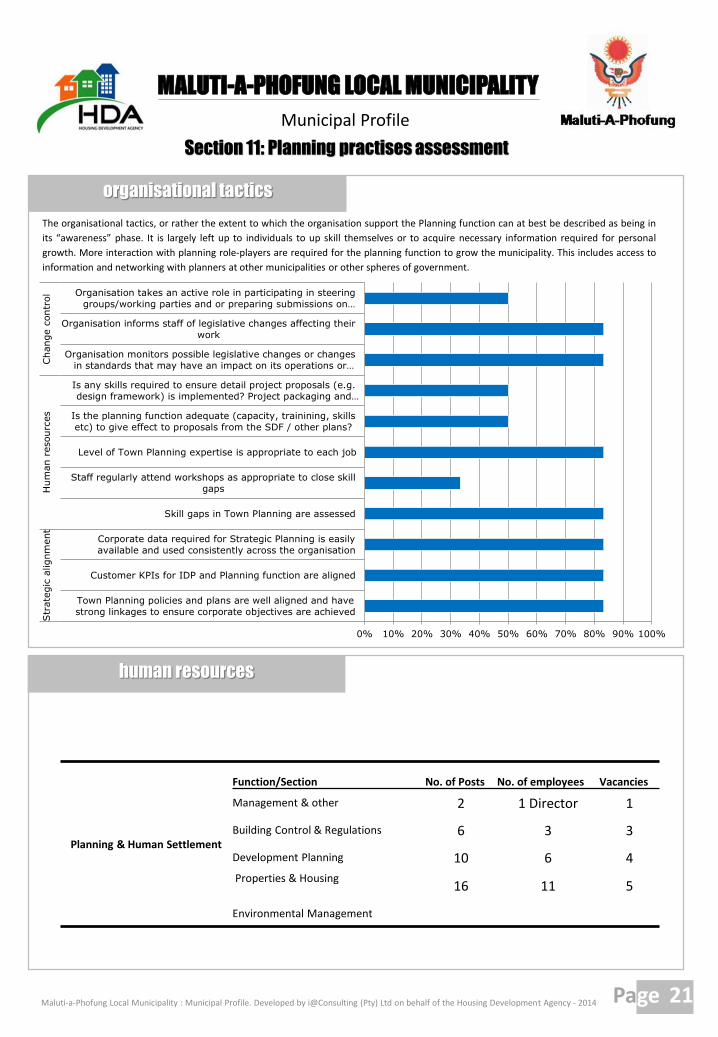
organisational tactics
human resources
The organisational tactics, or rather the extent to which the organisation support the Planning function can at best be described as being in
its “awareness” phase. It is largely left up to individuals to up skill themselves or to acquire necessary information required for personal
growth. More interaction with planning role-players are required for the planning function to grow the municipality. This includes access to
information and networking with planners at other municipalities or other spheres of government.
Planning & Human Settlement
Function/Section No. of Posts No. of employees Vacancies
Management & other 2 1 Director 1
Building Control & Regulations 6 3 3
Development Planning 10 6 4
Properties & Housing16 11 5
Environmental Management
0% 10% 20% 30% 40% 50% 60% 70% 80% 90% 100%
Town Planning policies and plans are well aligned and have
strong linkages to ensure corporate objectives are achieved
Customer KPIs for IDP and Planning function are aligned
Corporate data required for Strategic Planning is easily
available and used consistently across the organisation
Skill gaps in Town Planning are assessed
Staff regularly attend workshops as appropriate to close skill
gaps
Level of Town Planning expertise is appropriate to each job
Is the planning function adequate (capacity, trainining, skills
etc) to give effect to proposals from the SDF / other plans?
Is any skills required to ensure detail project proposals (e.g.
design framework) is implemented? Project packaging and…
Organisation monitors possible legislative changes or changes
in standards that may have an impact on its operations or…
Organisation informs staff of legislative changes affecting their
work
Organisation takes an active role in participating in steering
groups/working parties and or preparing submissions on…
Str
ate
gic
alignm
ent
Hum
an r
esourc
es
Change c
ontr
ol