Embed Size (px)
Citation preview
Attain’s
Managed Futures
Rankings(updated 2/24/2015)
Attain Capital Management
1 East Wacker Drive
Suite 3000
Chicago, IL 60601
312.604.0926
www.AttainCapital.com
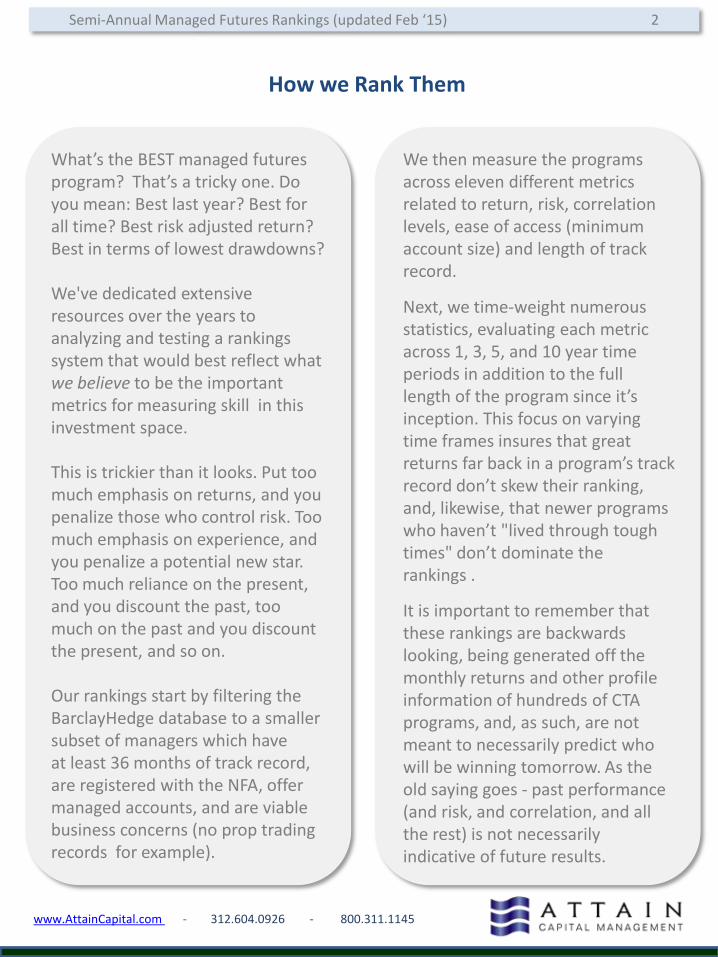
What’s the BEST managed futures program? That’s a tricky one. Do you mean: Best last year? Best for all time? Best risk adjusted return? Best in terms of lowest drawdowns?
We've dedicated extensive resources over the years to analyzing and testing a rankings system that would best reflect what we believe to be the important metrics for measuring skill in this investment space.
This is trickier than it looks. Put too much emphasis on returns, and you penalize those who control risk. Too much emphasis on experience, and you penalize a potential new star. Too much reliance on the present, and you discount the past, too much on the past and you discount the present, and so on.
Our rankings start by filtering the BarclayHedge database to a smaller subset of managers which have at least 36 months of track record, are registered with the NFA, offer managed accounts, and are viable business concerns (no prop trading records for example).
2 Attain Portfolio Advisors
www.AttainCapital.com - 312.604.0926 - 800.311.1145
Semi-Annual Managed Futures Rankings (updated Feb ‘15) 2
How we Rank Them
We then measure the programs across eleven different metrics related to return, risk, correlation levels, ease of access (minimum account size) and length of track record.
Next, we time-weight numerous statistics, evaluating each metric across 1, 3, 5, and 10 year time periods in addition to the full length of the program since it’s inception. This focus on varying time frames insures that great returns far back in a program’s track record don’t skew their ranking, and, likewise, that newer programs who haven’t "lived through tough times" don’t dominate the rankings .
It is important to remember that these rankings are backwards looking, being generated off the monthly returns and other profile information of hundreds of CTA programs, and, as such, are not meant to necessarily predict who will be winning tomorrow. As the old saying goes - past performance (and risk, and correlation, and all the rest) is not necessarily indicative of future results.
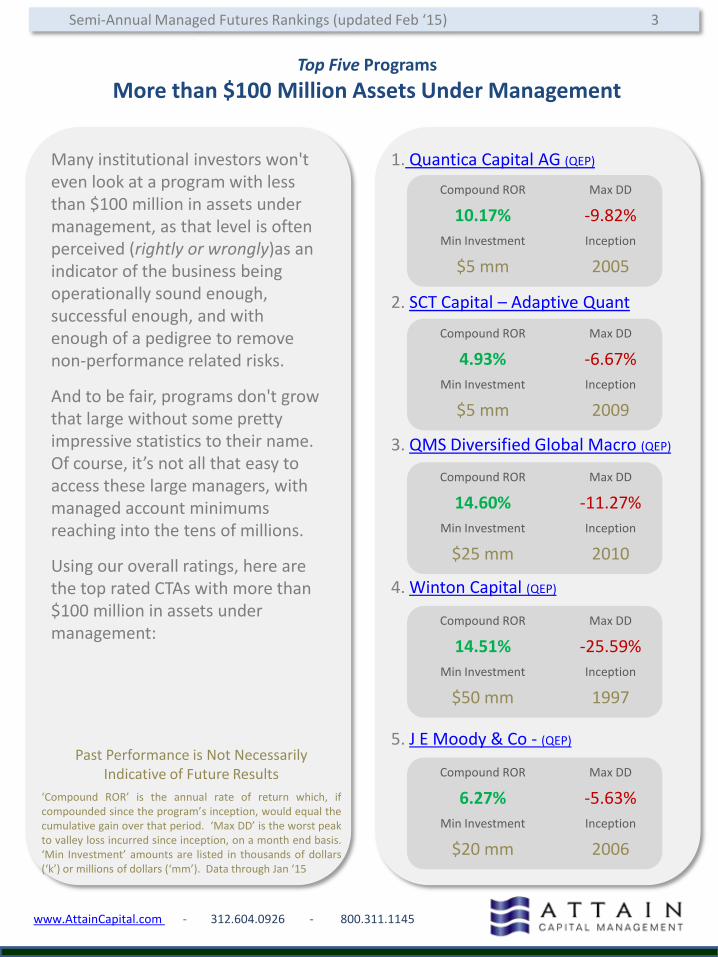
Many institutional investors won't even look at a program with less than $100 million in assets under management, as that level is often perceived (rightly or wrongly)as an indicator of the business being operationally sound enough, successful enough, and with enough of a pedigree to remove non-performance related risks.
And to be fair, programs don't grow that large without some pretty impressive statistics to their name. Of course, it’s not all that easy to access these large managers, with managed account minimums reaching into the tens of millions.
Using our overall ratings, here are the top rated CTAs with more than $100 million in assets under management:
2 Attain Portfolio Advisors
www.AttainCapital.com - 312.604.0926 - 800.311.1145
Top Five Programs
More than $100 Million Assets Under Management
1. Quantica Capital AG (QEP)
2. SCT Capital – Adaptive Quant
3. QMS Diversified Global Macro (QEP)
4. Winton Capital (QEP)
5. J E Moody & Co - (QEP)
Compound ROR Max DD
10.17% -9.82%
Min Investment Inception
$5 mm 2005
Compound ROR Max DD
4.93% -6.67%
Min Investment Inception
$5 mm 2009
Compound ROR Max DD
14.60% -11.27%
Min Investment Inception
$25 mm 2010
Compound ROR Max DD
14.51% -25.59%
Min Investment Inception
$50 mm 1997
Compound ROR Max DD
6.27% -5.63%
Min Investment Inception
$20 mm 2006
Past Performance is Not Necessarily Indicative of Future Results
‘Compound ROR’ is the annual rate of return which, ifcompounded since the program’s inception, would equal thecumulative gain over that period. ‘Max DD’ is the worst peakto valley loss incurred since inception, on a month end basis.‘Min Investment’ amounts are listed in thousands of dollars(‘k’) or millions of dollars (‘mm’). Data through Jan ‘15
Semi-Annual Managed Futures Rankings (updated Feb ‘15) 3
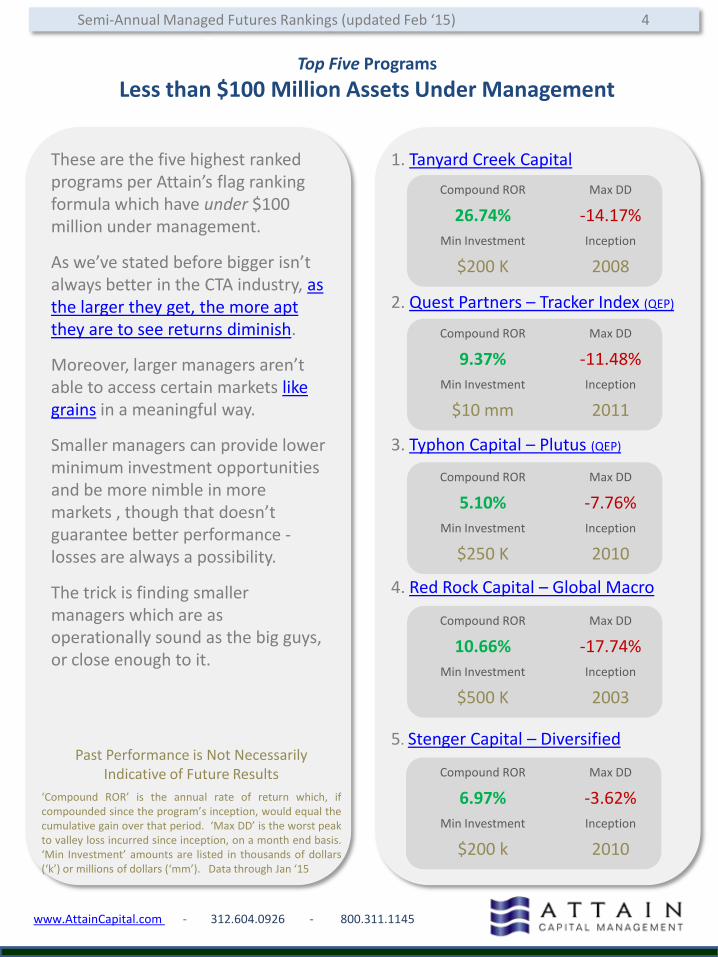
These are the five highest ranked programs per Attain’s flag ranking formula which have under $100 million under management.
As we’ve stated before bigger isn’t always better in the CTA industry, as the larger they get, the more apt they are to see returns diminish.
Moreover, larger managers aren’t able to access certain markets like grains in a meaningful way.
Smaller managers can provide lower minimum investment opportunities and be more nimble in more markets , though that doesn’t guarantee better performance -losses are always a possibility.
The trick is finding smaller managers which are as operationally sound as the big guys, or close enough to it.
2 Attain Portfolio Advisors
www.AttainCapital.com - 312.604.0926 - 800.311.1145
Top Five Programs
Less than $100 Million Assets Under Management
1. Tanyard Creek Capital
2. Quest Partners – Tracker Index (QEP)
3. Typhon Capital – Plutus (QEP)
4. Red Rock Capital – Global Macro
5. Stenger Capital – Diversified
Compound ROR Max DD
26.74% -14.17%
Min Investment Inception
$200 K 2008
Compound ROR Max DD
9.37% -11.48%
Min Investment Inception
$10 mm 2011
Compound ROR Max DD
5.10% -7.76%
Min Investment Inception
$250 K 2010
Compound ROR Max DD
10.66% -17.74%
Min Investment Inception
$500 K 2003
Compound ROR Max DD
6.97% -3.62%
Min Investment Inception
$200 k 2010
Semi-Annual Managed Futures Rankings (updated Feb ‘15) 4
Past Performance is Not Necessarily Indicative of Future Results
‘Compound ROR’ is the annual rate of return which, ifcompounded since the program’s inception, would equal thecumulative gain over that period. ‘Max DD’ is the worst peakto valley loss incurred since inception, on a month end basis.‘Min Investment’ amounts are listed in thousands of dollars(‘k’) or millions of dollars (‘mm’). Data through Jan ‘15
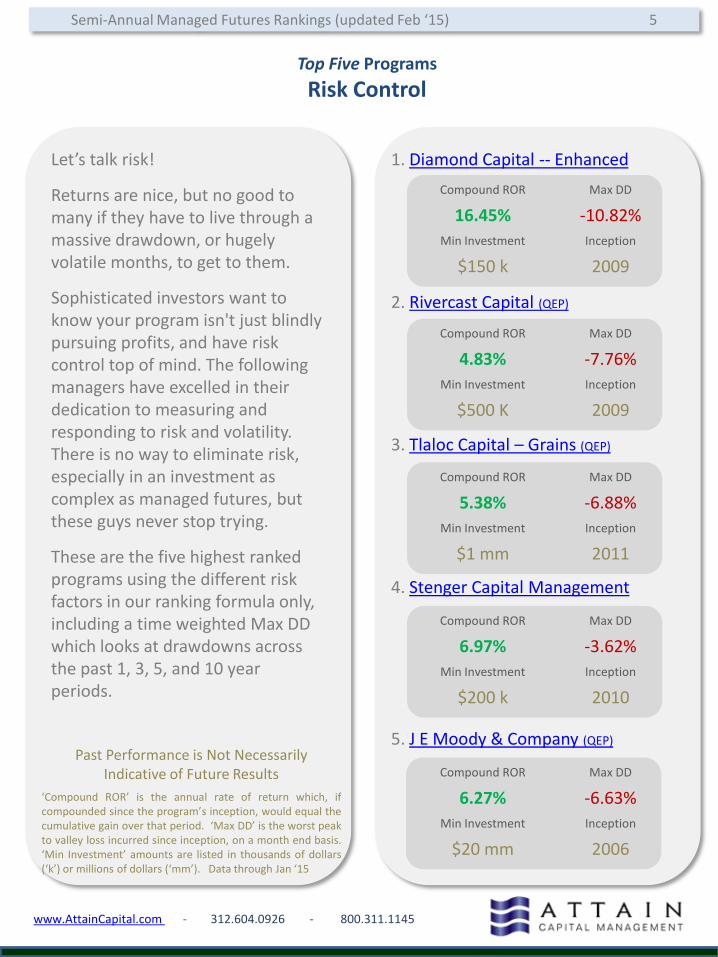
Let’s talk risk!
Returns are nice, but no good to many if they have to live through a massive drawdown, or hugely volatile months, to get to them.
Sophisticated investors want to know your program isn't just blindly pursuing profits, and have risk control top of mind. The following managers have excelled in their dedication to measuring and responding to risk and volatility. There is no way to eliminate risk, especially in an investment as complex as managed futures, but these guys never stop trying.
These are the five highest ranked programs using the different risk factors in our ranking formula only, including a time weighted Max DD which looks at drawdowns across the past 1, 3, 5, and 10 year periods.
2 Attain Portfolio Advisors
www.AttainCapital.com - 312.604.0926 - 800.311.1145
1. Diamond Capital -- Enhanced
2. Rivercast Capital (QEP)
3. Tlaloc Capital – Grains (QEP)
4. Stenger Capital Management
5. J E Moody & Company (QEP)
Compound ROR Max DD
16.45% -10.82%
Min Investment Inception
$150 k 2009
Compound ROR Max DD
4.83% -7.76%
Min Investment Inception
$500 K 2009
Compound ROR Max DD
5.38% -6.88%
Min Investment Inception
$1 mm 2011
Compound ROR Max DD
6.97% -3.62%
Min Investment Inception
$200 k 2010
Compound ROR Max DD
6.27% -6.63%
Min Investment Inception
$20 mm 2006
Top Five Programs
Risk Control
Semi-Annual Managed Futures Rankings (updated Feb ‘15) 5
Past Performance is Not Necessarily Indicative of Future Results
‘Compound ROR’ is the annual rate of return which, ifcompounded since the program’s inception, would equal thecumulative gain over that period. ‘Max DD’ is the worst peakto valley loss incurred since inception, on a month end basis.‘Min Investment’ amounts are listed in thousands of dollars(‘k’) or millions of dollars (‘mm’). Data through Jan ‘15

Many investors looking at alternatives do so with an eye towards the larger returns possible in the space. Those larger returns come with larger risks, to be sure, but some investors are willing to accept the higher risk in exchange for double digit returns.
For those ‘damn the torpedoes’ type investors, we look here at only the reward metrics in our model, including an average monthly dollar gain metric which considers how much real money a manager has actually made, not just what their past performance has been, and the time weighted compound returns.
These are the five highest ranked programs based on our Reward metrics.
2 Attain Portfolio Advisors
www.AttainCapital.com - 312.604.0926 - 800.311.1145
1. Mulvaney Capital – Global (QEP)
2. Dunn Capital World Monetary (QEP)
3. KeyQuant SAS – Key Trends (QEP)
4. Graham Capital – K4D-15V (QEP)
5. Aspect Capital – Limited (QEP)
Compound ROR Max DD
16.41% -45.02%
Min Investment Inception
$10 mm 1999
Compound ROR Max DD
14.79% -60.06%
Min Investment Inception
$500 k 1984
Compound ROR Max DD
11.62% -30.59%
Min Investment Inception
$50 mm 1999
Compound ROR Max DD
9.28% -22.19%
Min Investment Inception
$20 mm 1998
Compound ROR Max DD
19.78% -19.15%
Min Investment Inception
$10 mm 2010
Top Five Programs
Reward Only
Past Performance is Not Necessarily Indicative of Future Results
‘Compound ROR’ is the annual rate of return which, ifcompounded since the program’s inception, would equal thecumulative gain over that period. ‘Max DD’ is the worst peakto valley loss incurred since inception, on a month end basis.‘Min Investment’ amounts are listed in thousands of dollars(‘k’) or millions of dollars (‘mm’). Data through Jan ‘15
Semi-Annual Managed Futures Rankings (updated Feb ‘15) 6
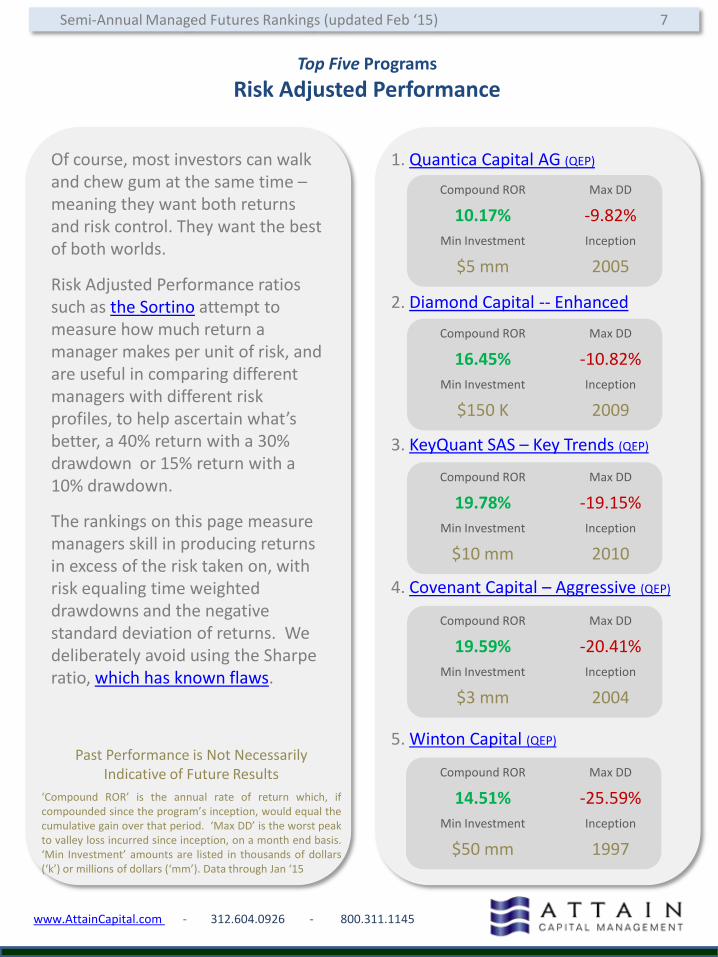
Of course, most investors can walk and chew gum at the same time –meaning they want both returns and risk control. They want the best of both worlds.
Risk Adjusted Performance ratios such as the Sortino attempt to measure how much return a manager makes per unit of risk, and are useful in comparing different managers with different risk profiles, to help ascertain what’s better, a 40% return with a 30% drawdown or 15% return with a 10% drawdown.
The rankings on this page measure managers skill in producing returns in excess of the risk taken on, with risk equaling time weighted drawdowns and the negative standard deviation of returns. We deliberately avoid using the Sharpe ratio, which has known flaws.
2 Attain Portfolio Advisors
www.AttainCapital.com - 312.604.0926 - 800.311.1145
1. Quantica Capital AG (QEP)
2. Diamond Capital -- Enhanced
3. KeyQuant SAS – Key Trends (QEP)
4. Covenant Capital – Aggressive (QEP)
5. Winton Capital (QEP)
Compound ROR Max DD
19.59% -20.41%
Min Investment Inception
$3 mm 2004
Compound ROR Max DD
14.51% -25.59%
Min Investment Inception
$50 mm 1997
Compound ROR Max DD
10.17% -9.82%
Min Investment Inception
$5 mm 2005
Compound ROR Max DD
16.45% -10.82%
Min Investment Inception
$150 K 2009
Compound ROR Max DD
19.78% -19.15%
Min Investment Inception
$10 mm 2010
Top Five Programs
Risk Adjusted Performance
Semi-Annual Managed Futures Rankings (updated Feb ‘15) 7
Past Performance is Not Necessarily Indicative of Future Results
‘Compound ROR’ is the annual rate of return which, ifcompounded since the program’s inception, would equal thecumulative gain over that period. ‘Max DD’ is the worst peakto valley loss incurred since inception, on a month end basis.‘Min Investment’ amounts are listed in thousands of dollars(‘k’) or millions of dollars (‘mm’). Data through Jan ‘15
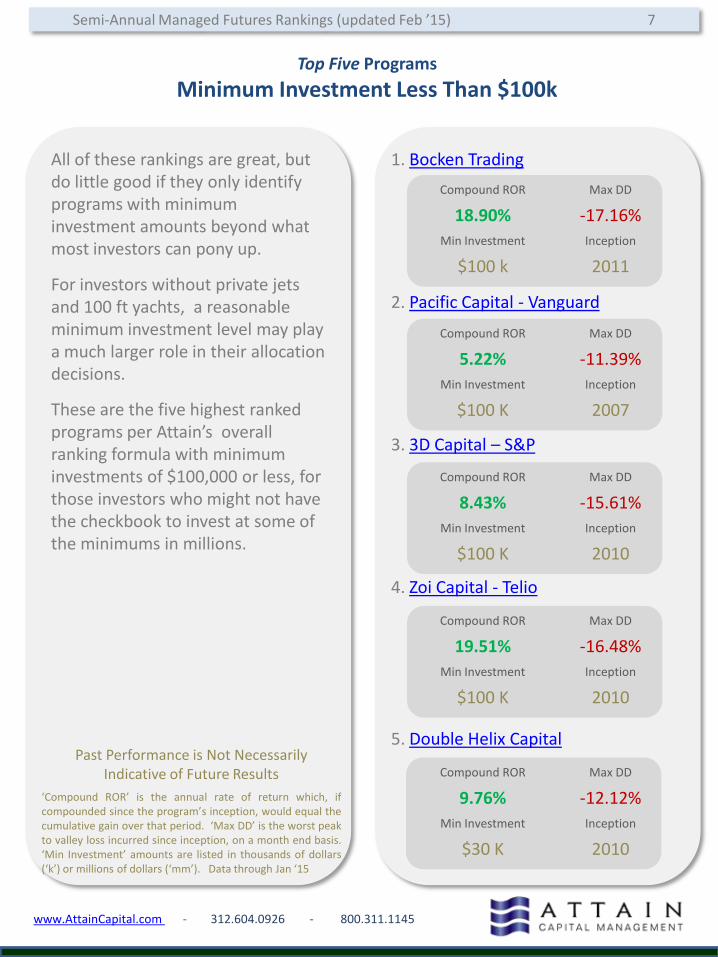
All of these rankings are great, but do little good if they only identify programs with minimum investment amounts beyond what most investors can pony up.
For investors without private jets and 100 ft yachts, a reasonable minimum investment level may play a much larger role in their allocation decisions.
These are the five highest ranked programs per Attain’s overall ranking formula with minimum investments of $100,000 or less, for those investors who might not have the checkbook to invest at some of the minimums in millions.
2 Attain Portfolio Advisors
www.AttainCapital.com - 312.604.0926 - 800.311.1145
1. Bocken Trading
2. Pacific Capital - Vanguard
3. 3D Capital – S&P
4. Zoi Capital - Telio
5. Double Helix Capital
Compound ROR Max DD
19.51% -16.48%
Min Investment Inception
$100 K 2010
Compound ROR Max DD
9.76% -12.12%
Min Investment Inception
$30 K 2010
Compound ROR Max DD
18.90% -17.16%
Min Investment Inception
$100 k 2011
Compound ROR Max DD
5.22% -11.39%
Min Investment Inception
$100 K 2007
Compound ROR Max DD
8.43% -15.61%
Min Investment Inception
$100 K 2010
Top Five Programs
Minimum Investment Less Than $100k
Past Performance is Not Necessarily Indicative of Future Results
‘Compound ROR’ is the annual rate of return which, ifcompounded since the program’s inception, would equal thecumulative gain over that period. ‘Max DD’ is the worst peakto valley loss incurred since inception, on a month end basis.‘Min Investment’ amounts are listed in thousands of dollars(‘k’) or millions of dollars (‘mm’). Data through Jan ‘15
Semi-Annual Managed Futures Rankings (updated Feb ’15) 7
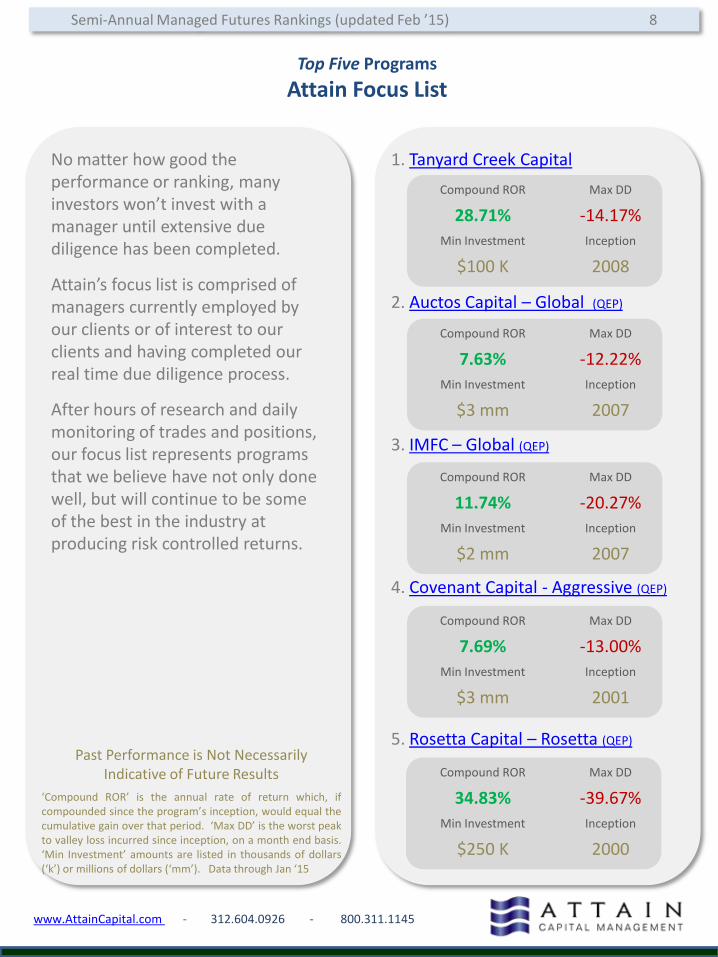
No matter how good the performance or ranking, many investors won’t invest with a manager until extensive due diligence has been completed.
Attain’s focus list is comprised of managers currently employed by our clients or of interest to our clients and having completed our real time due diligence process.
After hours of research and daily monitoring of trades and positions, our focus list represents programs that we believe have not only done well, but will continue to be some of the best in the industry at producing risk controlled returns.
2 Attain Portfolio Advisors
www.AttainCapital.com - 312.604.0926 - 800.311.1145
1. Tanyard Creek Capital
2. Auctos Capital – Global (QEP)
3. IMFC – Global (QEP)
4. Covenant Capital - Aggressive (QEP)
5. Rosetta Capital – Rosetta (QEP)
Compound ROR Max DD
7.69% -13.00%
Min Investment Inception
$3 mm 2001
Compound ROR Max DD
34.83% -39.67%
Min Investment Inception
$250 K 2000
Compound ROR Max DD
28.71% -14.17%
Min Investment Inception
$100 K 2008
Compound ROR Max DD
7.63% -12.22%
Min Investment Inception
$3 mm 2007
Compound ROR Max DD
11.74% -20.27%
Min Investment Inception
$2 mm 2007
Top Five Programs
Attain Focus List
Past Performance is Not Necessarily Indicative of Future Results
‘Compound ROR’ is the annual rate of return which, ifcompounded since the program’s inception, would equal thecumulative gain over that period. ‘Max DD’ is the worst peakto valley loss incurred since inception, on a month end basis.‘Min Investment’ amounts are listed in thousands of dollars(‘k’) or millions of dollars (‘mm’). Data through Jan ‘15
Semi-Annual Managed Futures Rankings (updated Feb ’15) 8
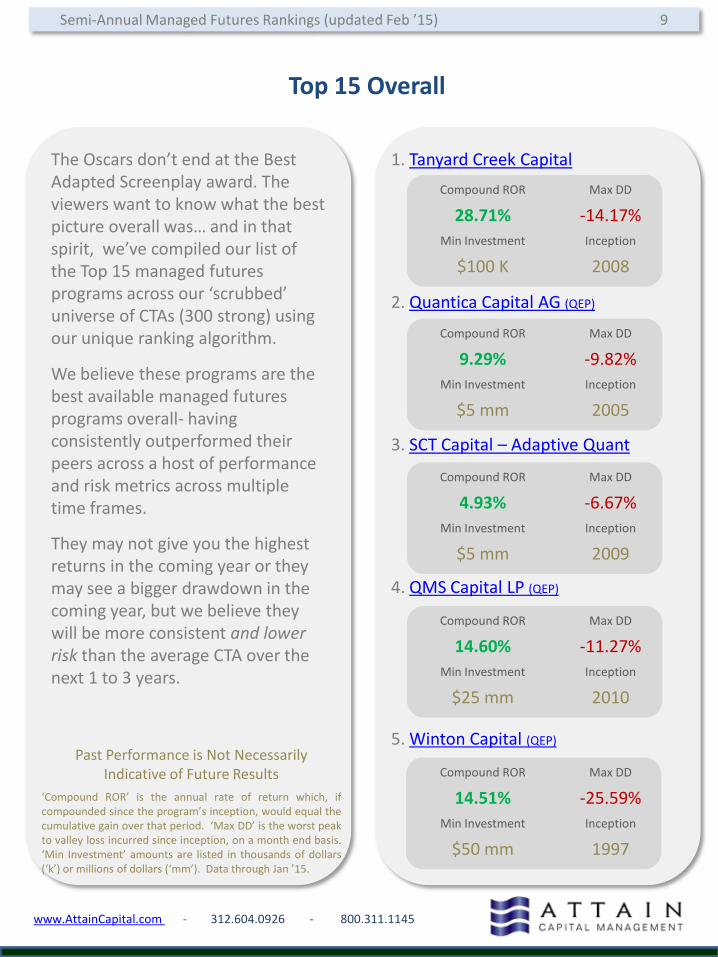
The Oscars don’t end at the Best Adapted Screenplay award. The viewers want to know what the best picture overall was… and in that spirit, we’ve compiled our list of the Top 15 managed futures programs across our ‘scrubbed’ universe of CTAs (300 strong) using our unique ranking algorithm.
We believe these programs are the best available managed futures programs overall- having consistently outperformed their peers across a host of performance and risk metrics across multiple time frames.
They may not give you the highest returns in the coming year or they may see a bigger drawdown in the coming year, but we believe they will be more consistent and lower risk than the average CTA over the next 1 to 3 years.
2 Attain Portfolio Advisors
www.AttainCapital.com - 312.604.0926 - 800.311.1145
Top 15 Overall
1. Tanyard Creek Capital
2. Quantica Capital AG (QEP)
3. SCT Capital – Adaptive Quant
4. QMS Capital LP (QEP)
5. Winton Capital (QEP)
Compound ROR Max DD
14.60% -11.27%
Min Investment Inception
$25 mm 2010
Compound ROR Max DD
14.51% -25.59%
Min Investment Inception
$50 mm 1997
Compound ROR Max DD
28.71% -14.17%
Min Investment Inception
$100 K 2008
Compound ROR Max DD
9.29% -9.82%
Min Investment Inception
$5 mm 2005
Compound ROR Max DD
4.93% -6.67%
Min Investment Inception
$5 mm 2009
Past Performance is Not Necessarily Indicative of Future Results
‘Compound ROR’ is the annual rate of return which, ifcompounded since the program’s inception, would equal thecumulative gain over that period. ‘Max DD’ is the worst peakto valley loss incurred since inception, on a month end basis.‘Min Investment’ amounts are listed in thousands of dollars(‘k’) or millions of dollars (‘mm’). Data through Jan ’15.
Semi-Annual Managed Futures Rankings (updated Feb ’15) 9
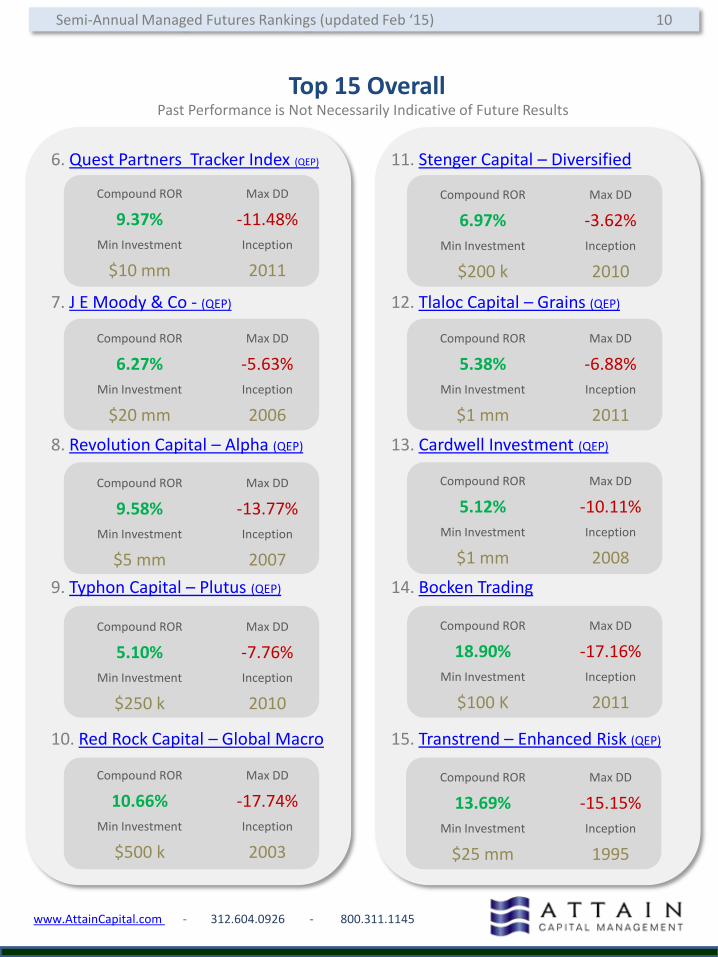
6. Quest Partners Tracker Index (QEP)
7. J E Moody & Co - (QEP)
8. Revolution Capital – Alpha (QEP)
9. Typhon Capital – Plutus (QEP)
10. Red Rock Capital – Global Macro
2 Attain Portfolio Advisors
www.AttainCapital.com - 312.604.0926 - 800.311.1145
11. Stenger Capital – Diversified
12. Tlaloc Capital – Grains (QEP)
13. Cardwell Investment (QEP)
14. Bocken Trading
15. Transtrend – Enhanced Risk (QEP)
Compound ROR Max DD
18.90% -17.16%
Min Investment Inception
$100 K 2011
Compound ROR Max DD
13.69% -15.15%
Min Investment Inception
$25 mm 1995
Compound ROR Max DD
6.97% -3.62%
Min Investment Inception
$200 k 2010
Compound ROR Max DD
5.38% -6.88%
Min Investment Inception
$1 mm 2011
Compound ROR Max DD
5.12% -10.11%
Min Investment Inception
$1 mm 2008
Compound ROR Max DD
9.37% -11.48%
Min Investment Inception
$10 mm 2011
Compound ROR Max DD
6.27% -5.63%
Min Investment Inception
$20 mm 2006
Compound ROR Max DD
9.58% -13.77%
Min Investment Inception
$5 mm 2007
Compound ROR Max DD
5.10% -7.76%
Min Investment Inception
$250 k 2010
Compound ROR Max DD
10.66% -17.74%
Min Investment Inception
$500 k 2003
Semi-Annual Managed Futures Rankings (updated Feb ‘15) 10
Past Performance is Not Necessarily Indicative of Future Results
Top 15 Overall
Attain Portfolio Advisors
1 East Wacker Drive
Suite 3000
Chicago, IL 60601
312.604.0926
www.AttainCapital.com
About Attain:
Attain Capital Management is a registered commodity brokerage firm which has been helping investors identify and access top managed futures programs since 2002 , and currently allocate to 30+ managers with combined assets over $6 Billion (purposely avoiding the $1B+ managers).
We have pulled over 2,800 managed futures programs into our database for further analysis, filtering that down to a list of approximately 300 we rank with our proprietary algorithm and believe are investable; and further filtering that down to just a handful that meet our client’s criteria and make it through our due diligence process. We then aid our clients in accessing these select managers via individual managed accounts (www.AttainCapital.com) or privately offered fund vehicles structured as LLCs (www.AttainFunds.com).
Finally, we believe education is a key ingredient to success in alternative investments, and have authored over 500 whitepapers and research reports over the years, and share more frequent commentary and ideas on our popular Managed Futures Blog, which is read in over 50 countries around the world.
Disclaimer
The information contained in this report is intended for informational purposes only. While the information and statistics given are believed to be complete and accurate, we cannot guarantee their completeness or accuracy. Attain has not undertaken to verify the completeness or accuracy of any of the information and statistics provided by third parties.
As past performance does not guarantee future results, these results may have no bearing on, and may not be indicative of, any individual returns realized through participation in any of the investment programs detailed herein.
Any specific investment or investment service contained or referred to in this report may not be suitable for all investors. You should not rely on any of the information as a substitute for the exercise of your own skill and judgment in making such a decision on the appropriateness of such investments. You should therefore carefully consider whether such trading is suitable for you in light of your financial condition. You may sustain a total loss of the investment. Finally, the ability to withstand losses and to adhere to a particular trading program in spite of trading losses are material points which can adversely affect investor performance.
Managed futures accounts can subject to substantial charges for management and advisory fees. The numbers within this website include all such fees, but it may be necessary for those accounts that are subject to these charges to make substantial trading profits in the future to avoid depletion or exhaustion of their assets.
Investors interested in investing with a managed futures program (excepting those programs which are offered exclusively to qualified eligible persons as that term is defined by CFTC regulation 4.7) will be required to receive and sign off on a disclosure document in compliance with certain CFT rules The disclosure documents contains a complete description of the principal risk factors and each fee to be charged to your account by the CTA, as well as the composite performance of accounts under the CTA's management over at least the most recent five years. Investor interested in investing in any of the programs on this website are urged to carefully read these disclosure documents, including, but not limited to the performance information, before investing in any such programs.
Those investors who are qualified eligible persons as that term is defined by CFTC regulation 4.7 and interested in investing in a program exempt from having to provide a disclosure document and considered by the regulations to be sophisticated enough to understand the risks and be able to interpret the accuracy and completeness of any performance information on their own.
Attain Capital receives a portion of the commodity brokerage commissions you pay in connection with your futures trading and/or a portion of the interest income (if any) earned on an account's assets. CTAs may also pay Attain a portion of the fees they receive from accounts introduced to them by Attain.
We recommend investors visit the Commodity Futures Trading Commission ("CFTC") website at the following address before trading: http://www.cftc.gov/cftc/cftcbeforetrade.htm


![5. The Four Ways To [Attain] Psychic Powerbukudharma.com/ebook/the four ways to attain psychic power.pdf · This means to develop the four ways to [attain] psychic power with](https://img.pdfslide.net/doc/110x75/5cae950988c99333788d5ce0/5-the-four-ways-to-attain-psychic-four-ways-to-attain-psychic-powerpdf-this.jpg)


![Goal Intent Attain[1]](https://img.pdfslide.net/doc/110x75/577d35691a28ab3a6b90617a/goal-intent-attain1.jpg)