Embed Size (px)
Citation preview
Management scenarios for the Jordan River salinity crisis
Efrat Farber a, Avner Vengosh a,*, Ittai Gavrieli b, Amer Marie c,Thomas D. Bullen d, Bernhard Mayer e, Ran Holtzman f, Michal Segal f,
Uri Shavit f
a Department of Geological and Environmental Sciences, Ben Gurion University, P.O. Box 653, Beer Sheva 84106, Israelb Geological Survey of Israel, 30 Malkei Israel St., Jerusalem 95501, Israel
c Department of Applied Earth and Environmental Sciences, Al-Quds University, East Jerusalem, West Bankd Water Resources Division, U.S. Geological Survey, MS 420, 345 Middlefield Rd., Menlo Park, CA 04025, USA
e Department of Geology and Geophysics, University of Calgary, 2500 University Drive NW, Calgary, Alta., Canada T2N 1N4f Department of Civil and Environmental Engineering, Technion, Israel Institute of Technology, Haifa 32000, Israel
Received 17 February 2005; accepted 28 July 2005Editorial handling by R. Fuge
Abstract
Recent geochemical and hydrological findings show that the water quality of the base flow of the Lower Jordan River,between the Sea of Galilee and the Dead Sea, is dependent upon the ratio between surface water flow and groundwaterdischarge. Using water quality data, mass-balance calculations, and actual flow-rate measurements, possible managementscenarios for the Lower Jordan River and their potential a!ects on its salinity are investigated. The predicted scenariosreveal that implementation of some elements of the Israel–Jordan peace treaty will have negative e!ects on the JordanRiver water salinity. It is predicted that removal of sewage e"uents dumped into the river (!13 MCM/a) will significantlyreduce the river water!s flow and increase the relative proportion of the saline groundwater flux into the river. Under thisscenario, the Cl content of the river at its southern point (Abdalla Bridge) will rise to almost 7000 mg/L during the sum-mer. In contrast, removal of all the saline water (16.5 MCM/a) that is artificially discharged into the Lower Jordan Riverwill significantly reduce its Cl concentration, to levels of 650–2600 and 3000–3500 mg/L in the northern and southern areasof the Lower Jordan River, respectively. However, because the removal of either the sewage e"uents or the saline waterwill decrease the river!s discharge to a level that could potentially cause river desiccation during the summer months, otherwater sources must be allocated to preserve in-stream flow needs and hence the river!s ecosystem.! 2005 Elsevier Ltd. All rights reserved.
1. Introduction
Management of cross-boundary rivers requiresfull cooperation between the riparian states. In many
cases, the upstream country controls the river!s flowrate (e.g., Euphrates, Nile, Colorado, Rio Grande,Danube and Mekong) and thus many conflicts arisedue to uneven distribution or unilateral changes inwater utilization. In addition to water quantity dis-tribution, water quality has become an importantfactor determining the ability to utilize the river
0883-2927/$ - see front matter ! 2005 Elsevier Ltd. All rights reserved.doi:10.1016/j.apgeochem.2005.07.007
* Corresponding author.E-mail address: [email protected] (A. Vengosh).
Applied Geochemistry 20 (2005) 2138–2153
www.elsevier.com/locate/apgeochem
AppliedGeochemistry

water. This is due to the fact that the quality of manyinternational rivers has deteriorated significantlyover the last decades (Shmueli, 1999).
The problems involved in applying internationaltreaties for international rivers include heterogene-ities in drinking-water standards (e.g., the DanubeRiver; Linnerooth, 1990), water laws, and manage-ment systems (e.g., the Rio Grande River; Sch-mandt, 2002) among the riparian states. The jointmanagement of an international river requires acomprehensive scientific understanding of the pro-cesses that are controlling the degradation of theriver!s quality. In this paper, the Lower JordanRiver system is used to demonstrate that scientificunderstanding of the hydrological system is thekey for sustainable joint management between theriparian states.
The Lower Jordan River marks the internationalborder between Israel and theWest Bank on the westand the Hashemite Kingdom of Jordan on the east.Decades of diversion of upstream good-qualitywater and direct dumping of saline water and waste-water have severely damaged the river!s ecologicalsystem. The salinity of the Lower Jordan River hasrisen significantly (up to 5400 mg Cl/L in summer2001; Farber et al., 2004), endangering its capabilityto supply water, even to saline-resistant crops such aspalms, which are one of the main agricultural prod-ucts of the Jordan Valley. At the same time, theJordan River is an important component of thePeace Treaty between Israel and Jordan (Israel–Jordan Peace Treaty, Annex II, 2004). The water is-sue is an essential aspect of the treaty and receivedthe same level of attention as security and territorialissues. Concerning the Jordan River, it was agreedthat (1) Jordan is entitled to an annual quantityequivalent to that of Israel, provided, however, thatJordan!s use will not harm the quantity or quality ofIsraeli uses (Annex II, article 2); (2) Saline springscurrently diverted to the Jordan River are earmarkedfor desalinization (Annex II, article 3); and (3) Israeland Jordan will each prohibit the disposal of munici-pal and industrial wastewater into the course of theYarmouk River or the Jordan River before theyare treated to standards allowing their unrestrictedagricultural use (Annex II, article 3).
Although the peace treaty was signed a decadeago, none of the above items have been imple-mented. However, future development in the regionwill require dealing with these issues. The complexityof the hydrological system and the severe degrada-tion of the water quality make future management
schemes even more di#cult to design. In this paper,the authors use their understanding of the hydrolog-ical and geochemical system of the Lower JordanRiver (Farber et al., 2004; Holtzman et al., 2005)to show that implementation of the treaty is likelyto lead to further degradation in water quantityand quality of the Lower Jordan River water. Therelationships between surface inflows and ground-water discharge to the river are used in order toquantify the salt budget and hence the salinity ofthe Jordan River. Di!erent management scenariosthat are related to the implementation of the peacetreaty are then simulated for prediction of the riverflow rate and salinity.
2. The hydrological system of the Lower Jordan River
The total length of the Jordan River, from its ori-gins in the Hermon Mountains in the north to itsmouth at the Dead Sea, is approximately 250 km(aerial distance), but its meandering course increasesits length to 330 km (Tahal, 2000). The River islocated in a semiarid area and can be divided intotwo sections: the Upper Jordan River, from theHermon Mountains, to the Sea of Galilee (LakeTiberias), and the Lower Jordan River, from theSea of Galilee to the Dead Sea. The latter sectionalso marks most of the border between Israel, theWest Bank and Kingdom of Jordan (Fig. 1). Whilethe Upper Jordan River is a major source of highquality drinking water, the water that dischargedfrom the Sea of Galilee into the Lower Jordan Riverwere historically more saline and therefore of lowerquality (Nissenbaum, 1969). The construction oftwo dams at the outlet of the Sea of Galilee hasresulted in further deterioration of the water qualityand quantity in the Lower Jordan River. Currently,there is no input of water from the Sea of Galilee tothe Lower Jordan River Water. Water quantity hasdecreased from the historical volumetric dischargeestimated around 1300 MCM/a (Salameh andNaser, 1999) to a recently measured and estimatedbase flow of 30–200 MCM/a (Holtzman et al.,2005 and Tahal, 2000, respectively) with rare highdischarge (!600 m3/s) flood events. Holtzmanet al. (2005) measured the discharge under droughtconditions (i.e., only base flow) while Tahal (2000)estimated the discharge including floods, which oc-cur mostly during very rainy winters, when the damsover the Sea of Galilee and/or on the YarmoukRiver are opened. The historical contributors in-cluded outlet from the Sea of Galilee (540 MCM/a),
E. Farber et al. / Applied Geochemistry 20 (2005) 2138–2153 2139
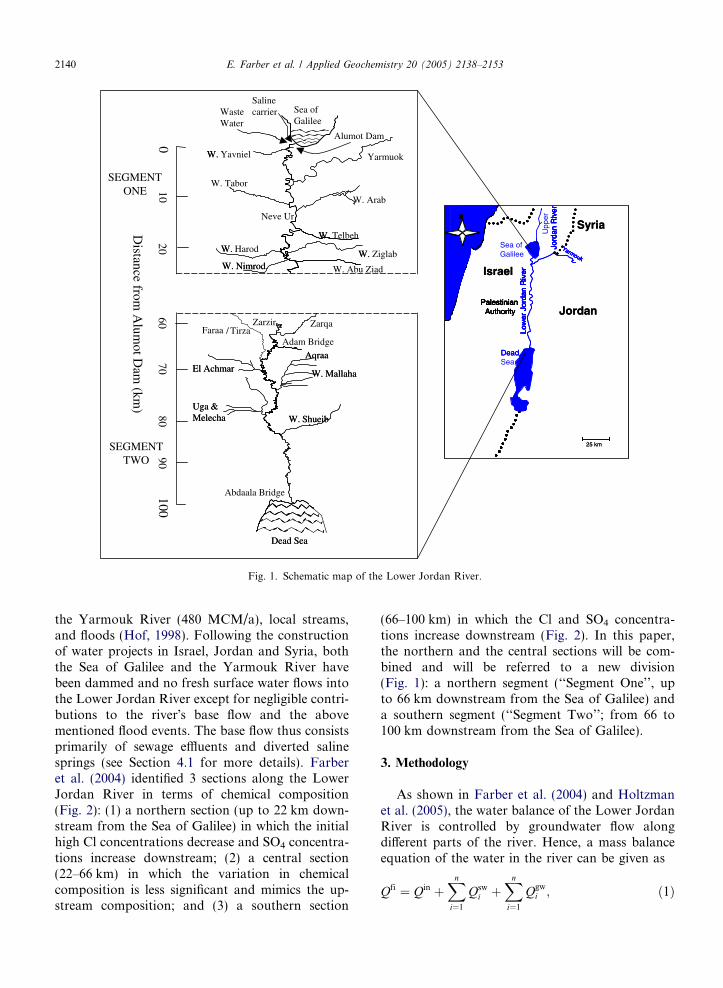
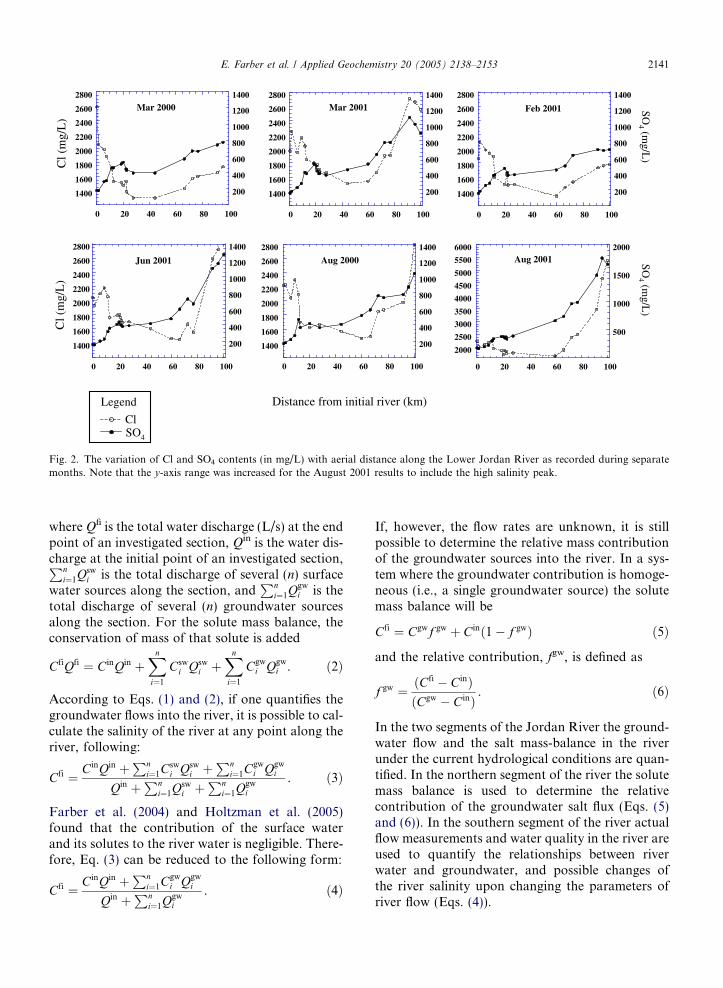
the Yarmouk River (480 MCM/a), local streams,and floods (Hof, 1998). Following the constructionof water projects in Israel, Jordan and Syria, boththe Sea of Galilee and the Yarmouk River havebeen dammed and no fresh surface water flows intothe Lower Jordan River except for negligible contri-butions to the river!s base flow and the abovementioned flood events. The base flow thus consistsprimarily of sewage e"uents and diverted salinesprings (see Section 4.1 for more details). Farberet al. (2004) identified 3 sections along the LowerJordan River in terms of chemical composition(Fig. 2): (1) a northern section (up to 22 km down-stream from the Sea of Galilee) in which the initialhigh Cl concentrations decrease and SO4 concentra-tions increase downstream; (2) a central section(22–66 km) in which the variation in chemicalcomposition is less significant and mimics the up-stream composition; and (3) a southern section
(66–100 km) in which the Cl and SO4 concentra-tions increase downstream (Fig. 2). In this paper,the northern and the central sections will be com-bined and will be referred to a new division(Fig. 1): a northern segment (‘‘Segment One’’, upto 66 km downstream from the Sea of Galilee) anda southern segment (‘‘Segment Two’’; from 66 to100 km downstream from the Sea of Galilee).
3. Methodology
As shown in Farber et al. (2004) and Holtzmanet al. (2005), the water balance of the Lower JordanRiver is controlled by groundwater flow alongdi!erent parts of the river. Hence, a mass balanceequation of the water in the river can be given as
Qfi " Qin #Xn
i"1
Qswi #
Xn
i"1
Qgwi ; $1%
Jordan
Israel
PalestinianAuthority
Low
er J
orda
n R
iver
Syria
Sea ofGalilee
DeadSea
Yarmouk
25 km
Upp
erJo
rdan
Riv
er
N
Jordan
Israel
PalestinianAuthority
Low
er J
orda
n R
iver
Syria
Dead
Yarmouk
25 km
Jord
an R
iver
N
Uga &Melecha W. Shueib
Dead Sea
AqraaEl Achmar W. Mallaha
Faraa / Tirza
Sea ofGalilee
W. Yavniel
W. Nimrod
W. Telbeh
W. Ziglab
Yarmuok
W. Harod
W. Tabor
W. Abu Ziad
SalinecarrierWaste
Water
W. Arab
Abdaala Bridge
Adam Bridge
Zarzir
Neve Ur
Alumot Dam0100
Distance from
Alum
ot Dam
(km)
PalestinianAuthority
Low
er J
orda
n R
iver
Dead
Yarmouk
Jord
an R
iver
N
PalestinianAuthority
Low
er J
orda
n R
iver
Yarmouk
Jord
an R
iver
N
PalestinianAuthority
Low
er J
orda
n R
iver
Yarmouk
Jord
an R
iver
NNN
Palestinian
Low
er J
orda
n R
iver
Jord
an R
iver
NNNNNN
Uga &Melecha W. Shueib
Dead Sea
AqraaEl Achmar W. Mallaha
Zarqa
W.
W. Nimrod
W.
W.W.
1020
6070
8090
SEGMENTONE
SEGMENTTWO
Fig. 1. Schematic map of the Lower Jordan River.
2140 E. Farber et al. / Applied Geochemistry 20 (2005) 2138–2153
whereQfi is the total water discharge (L/s) at the endpoint of an investigated section, Qin is the water dis-charge at the initial point of an investigated section,Pn
i"1Qswi is the total discharge of several (n) surface
water sources along the section, andPn
i"1Qgwi is the
total discharge of several (n) groundwater sourcesalong the section. For the solute mass balance, theconservation of mass of that solute is added
CfiQfi " CinQin #Xn
i"1
Cswi Qsw
i #Xn
i"1
Cgwi Qgw
i . $2%
According to Eqs. (1) and (2), if one quantifies thegroundwater flows into the river, it is possible to cal-culate the salinity of the river at any point along theriver, following:
Cfi " CinQin #Pn
i"1Cswi Qsw
i #Pn
i"1Cgwi Qgw
i
Qin #Pn
i"1Qswi #
Pni"1Q
gwi
. $3%
Farber et al. (2004) and Holtzman et al. (2005)found that the contribution of the surface waterand its solutes to the river water is negligible. There-fore, Eq. (3) can be reduced to the following form:
Cfi " CinQin #Pn
i"1Cgwi Qgw
i
Qin #Pn
i"1Qgwi
. $4%
If, however, the flow rates are unknown, it is stillpossible to determine the relative mass contributionof the groundwater sources into the river. In a sys-tem where the groundwater contribution is homoge-neous (i.e., a single groundwater source) the solutemass balance will be
Cfi " Cgwf gw # Cin$1& f gw% $5%
and the relative contribution, fgw, is defined as
f gw " $Cfi & Cin%$Cgw & Cin%
. $6%
In the two segments of the Jordan River the ground-water flow and the salt mass-balance in the riverunder the current hydrological conditions are quan-tified. In the northern segment of the river the solutemass balance is used to determine the relativecontribution of the groundwater salt flux (Eqs. (5)and (6)). In the southern segment of the river actualflow measurements and water quality in the river areused to quantify the relationships between riverwater and groundwater, and possible changes ofthe river salinity upon changing the parameters ofriver flow (Eqs. (4)).
1400
1600
1800
2000
2200
2400
2600
2800
200
400
600
800
1000
1200
1400
0 20 40 60 80 100
Feb 2001
1400
1600
1800
2000
2200
2400
2600
2800
200
400
600
800
1000
1200
1400
0 20 40 60 80 100
Mar 2000
1400
1600
1800
2000
2200
2400
2600
2800
200
400
600
800
1000
1200
1400
0 20 40 60 80 100
Mar 2001
Cl (
mg/
L)
SO4 (m
g/L)
2000
250030003500
400045005000
55006000
500
1000
1500
2000
0 20 40 60 80 100
Aug 2001
1400
1600
1800
2000
2200
2400
2600
2800
200
400
600
800
1000
1200
1400
0 20 40 60 80 100
Aug 2000
1400
1600
1800
2000
2200
2400
2600
2800
200
400
600
800
1000
1200
1400
0 20 40 60 80 100
Jun 2001
Cl (
mg/
L)
SO4 (m
g/L)
Distance from initial river (km)ClSO4
Legend
Fig. 2. The variation of Cl and SO4 contents (in mg/L) with aerial distance along the Lower Jordan River as recorded during separatemonths. Note that the y-axis range was increased for the August 2001 results to include the high salinity peak.
E. Farber et al. / Applied Geochemistry 20 (2005) 2138–2153 2141
4. Results and discussion
4.1. The northern segment of the Lower Jordan River
4.1.1. Current situationThe northern segment of the Lower Jordan River
extends from Alumot Dam to Adam Bridge (Seg-ment One- the upper 66 km; Fig. 1). The down-stream side of the Alumot dam is the headwatersof the Lower Jordan River. The dam separates theSea of Galilee from the headwaters of the LowerJordan River (Fig. 3).
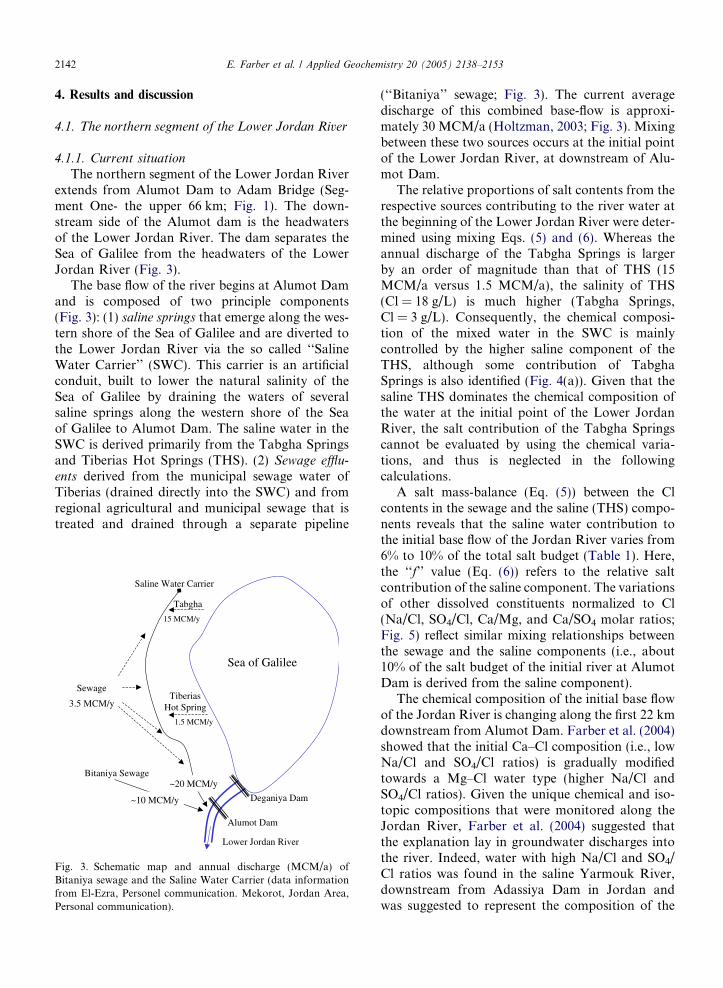
The base flow of the river begins at Alumot Damand is composed of two principle components(Fig. 3): (1) saline springs that emerge along the wes-tern shore of the Sea of Galilee and are diverted tothe Lower Jordan River via the so called ‘‘SalineWater Carrier’’ (SWC). This carrier is an artificialconduit, built to lower the natural salinity of theSea of Galilee by draining the waters of severalsaline springs along the western shore of the Seaof Galilee to Alumot Dam. The saline water in theSWC is derived primarily from the Tabgha Springsand Tiberias Hot Springs (THS). (2) Sewage e!u-ents derived from the municipal sewage water ofTiberias (drained directly into the SWC) and fromregional agricultural and municipal sewage that istreated and drained through a separate pipeline
(‘‘Bitaniya’’ sewage; Fig. 3). The current averagedischarge of this combined base-flow is approxi-mately 30 MCM/a (Holtzman, 2003; Fig. 3). Mixingbetween these two sources occurs at the initial pointof the Lower Jordan River, at downstream of Alu-mot Dam.
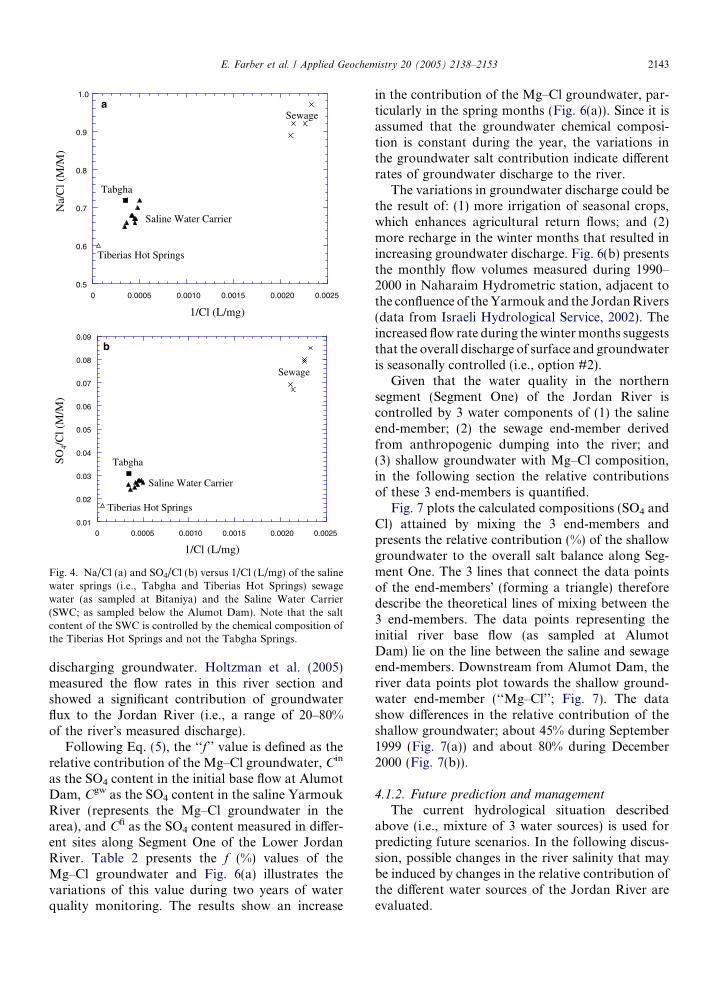
The relative proportions of salt contents from therespective sources contributing to the river water atthe beginning of the Lower Jordan River were deter-mined using mixing Eqs. (5) and (6). Whereas theannual discharge of the Tabgha Springs is largerby an order of magnitude than that of THS (15MCM/a versus 1.5 MCM/a), the salinity of THS(Cl = 18 g/L) is much higher (Tabgha Springs,Cl = 3 g/L). Consequently, the chemical composi-tion of the mixed water in the SWC is mainlycontrolled by the higher saline component of theTHS, although some contribution of TabghaSprings is also identified (Fig. 4(a)). Given that thesaline THS dominates the chemical composition ofthe water at the initial point of the Lower JordanRiver, the salt contribution of the Tabgha Springscannot be evaluated by using the chemical varia-tions, and thus is neglected in the followingcalculations.
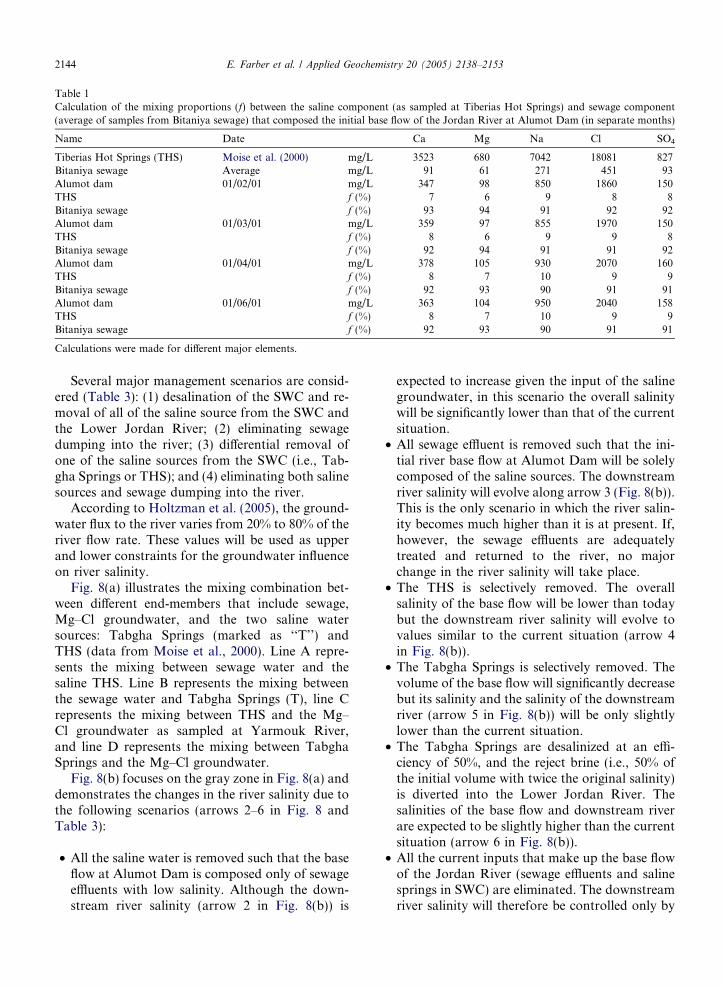
A salt mass-balance (Eq. (5)) between the Clcontents in the sewage and the saline (THS) compo-nents reveals that the saline water contribution tothe initial base flow of the Jordan River varies from6% to 10% of the total salt budget (Table 1). Here,the ‘‘f’’ value (Eq. (6)) refers to the relative saltcontribution of the saline component. The variationsof other dissolved constituents normalized to Cl(Na/Cl, SO4/Cl, Ca/Mg, and Ca/SO4 molar ratios;Fig. 5) reflect similar mixing relationships betweenthe sewage and the saline components (i.e., about10% of the salt budget of the initial river at AlumotDam is derived from the saline component).
The chemical composition of the initial base flowof the Jordan River is changing along the first 22 kmdownstream from Alumot Dam. Farber et al. (2004)showed that the initial Ca–Cl composition (i.e., lowNa/Cl and SO4/Cl ratios) is gradually modifiedtowards a Mg–Cl water type (higher Na/Cl andSO4/Cl ratios). Given the unique chemical and iso-topic compositions that were monitored along theJordan River, Farber et al. (2004) suggested thatthe explanation lay in groundwater discharges intothe river. Indeed, water with high Na/Cl and SO4/Cl ratios was found in the saline Yarmouk River,downstream from Adassiya Dam in Jordan andwas suggested to represent the composition of the
TiberiasHot Spring
1.5 MCM/y
Tabgha
15 MCM/y
Sea of Galilee
Saline Water Carrier
~20 MCM/y
Lower Jordan River
Bitaniya Sewage
~10 MCM/y
Alumot Dam
3.5 MCM/y
Deganiya Dam
Sewage
Fig. 3. Schematic map and annual discharge (MCM/a) ofBitaniya sewage and the Saline Water Carrier (data informationfrom El-Ezra, Personel communication. Mekorot, Jordan Area,Personal communication).
2142 E. Farber et al. / Applied Geochemistry 20 (2005) 2138–2153
discharging groundwater. Holtzman et al. (2005)measured the flow rates in this river section andshowed a significant contribution of groundwaterflux to the Jordan River (i.e., a range of 20–80%of the river!s measured discharge).
Following Eq. (5), the ‘‘f’’ value is defined as therelative contribution of the Mg–Cl groundwater, Cin
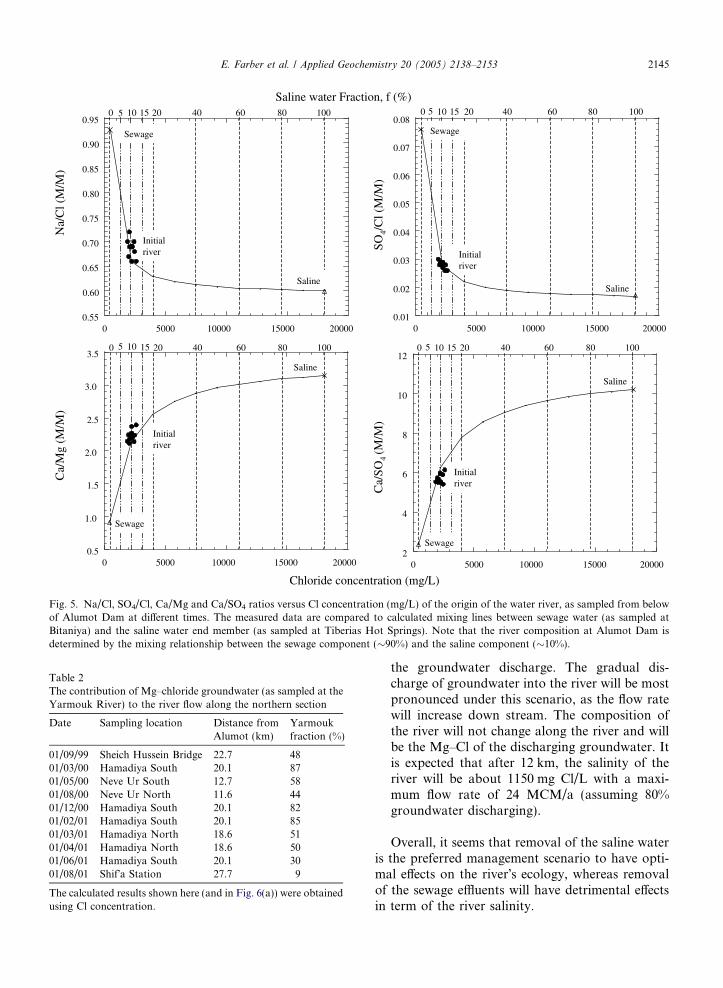
as the SO4 content in the initial base flow at AlumotDam, Cgw as the SO4 content in the saline YarmoukRiver (represents the Mg–Cl groundwater in thearea), and Cfi as the SO4 content measured in di!er-ent sites along Segment One of the Lower JordanRiver. Table 2 presents the f (%) values of theMg–Cl groundwater and Fig. 6(a) illustrates thevariations of this value during two years of waterquality monitoring. The results show an increase
in the contribution of the Mg–Cl groundwater, par-ticularly in the spring months (Fig. 6(a)). Since it isassumed that the groundwater chemical composi-tion is constant during the year, the variations inthe groundwater salt contribution indicate di!erentrates of groundwater discharge to the river.
The variations in groundwater discharge could bethe result of: (1) more irrigation of seasonal crops,which enhances agricultural return flows; and (2)more recharge in the winter months that resulted inincreasing groundwater discharge. Fig. 6(b) presentsthe monthly flow volumes measured during 1990–2000 in Naharaim Hydrometric station, adjacent tothe confluence of theYarmouk and the JordanRivers(data from Israeli Hydrological Service, 2002). Theincreased flow rate during the wintermonths suggeststhat the overall discharge of surface and groundwateris seasonally controlled (i.e., option #2).
Given that the water quality in the northernsegment (Segment One) of the Jordan River iscontrolled by 3 water components of (1) the salineend-member; (2) the sewage end-member derivedfrom anthropogenic dumping into the river; and(3) shallow groundwater with Mg–Cl composition,in the following section the relative contributionsof these 3 end-members is quantified.
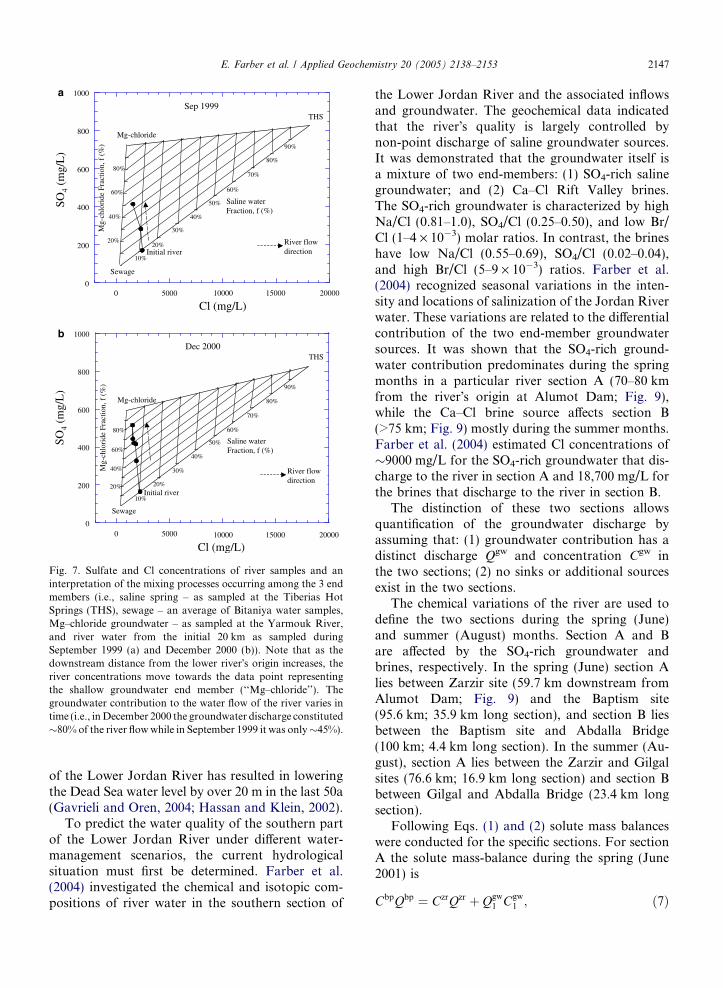
Fig. 7 plots the calculated compositions (SO4 andCl) attained by mixing the 3 end-members andpresents the relative contribution (%) of the shallowgroundwater to the overall salt balance along Seg-ment One. The 3 lines that connect the data pointsof the end-members! (forming a triangle) thereforedescribe the theoretical lines of mixing between the3 end-members. The data points representing theinitial river base flow (as sampled at AlumotDam) lie on the line between the saline and sewageend-members. Downstream from Alumot Dam, theriver data points plot towards the shallow ground-water end-member (‘‘Mg–Cl’’; Fig. 7). The datashow di!erences in the relative contribution of theshallow groundwater; about 45% during September1999 (Fig. 7(a)) and about 80% during December2000 (Fig. 7(b)).
4.1.2. Future prediction and managementThe current hydrological situation described
above (i.e., mixture of 3 water sources) is used forpredicting future scenarios. In the following discus-sion, possible changes in the river salinity that maybe induced by changes in the relative contribution ofthe di!erent water sources of the Jordan River areevaluated.
Na/
Cl (
M/M
)
1/Cl (L/mg)
Sewage
Saline Water Carrier
Tabgha
Tiberias Hot Springs
a
0.5
0.6
0.7
0.8
0.9
1.0
0 0.0005 0.0010 0.0015 0.0020 0.0025
0.01
0.02
0.03
0.04
0.05
0.06
0.07
0.08
0.09
0 0.0005 0.0010 0.0015 0.0020 0.0025
SO4/
Cl (
M/M
)
1/Cl (L/mg)
Sewage
Saline Water Carrier
Tabgha
Tiberias Hot Springs
b
Fig. 4. Na/Cl (a) and SO4/Cl (b) versus 1/Cl (L/mg) of the salinewater springs (i.e., Tabgha and Tiberias Hot Springs) sewagewater (as sampled at Bitaniya) and the Saline Water Carrier(SWC; as sampled below the Alumot Dam). Note that the saltcontent of the SWC is controlled by the chemical composition ofthe Tiberias Hot Springs and not the Tabgha Springs.
E. Farber et al. / Applied Geochemistry 20 (2005) 2138–2153 2143
Several major management scenarios are consid-ered (Table 3): (1) desalination of the SWC and re-moval of all of the saline source from the SWC andthe Lower Jordan River; (2) eliminating sewagedumping into the river; (3) di!erential removal ofone of the saline sources from the SWC (i.e., Tab-gha Springs or THS); and (4) eliminating both salinesources and sewage dumping into the river.
According to Holtzman et al. (2005), the ground-water flux to the river varies from 20% to 80% of theriver flow rate. These values will be used as upperand lower constraints for the groundwater influenceon river salinity.
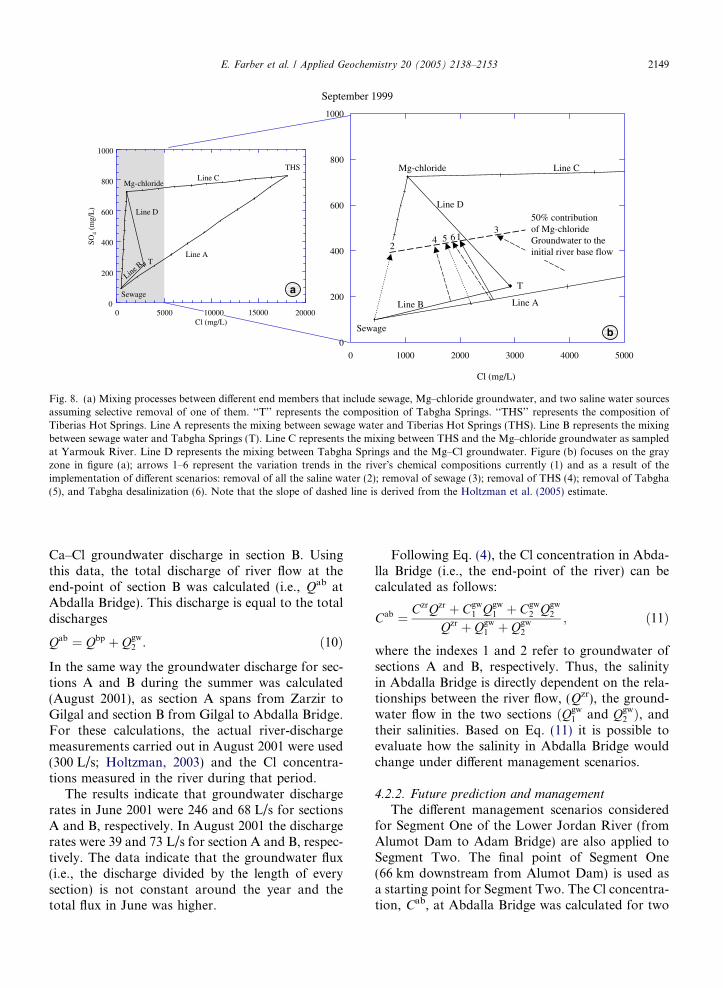
Fig. 8(a) illustrates the mixing combination bet-ween di!erent end-members that include sewage,Mg–Cl groundwater, and the two saline watersources: Tabgha Springs (marked as ‘‘T’’) andTHS (data from Moise et al., 2000). Line A repre-sents the mixing between sewage water and thesaline THS. Line B represents the mixing betweenthe sewage water and Tabgha Springs (T), line Crepresents the mixing between THS and the Mg–Cl groundwater as sampled at Yarmouk River,and line D represents the mixing between TabghaSprings and the Mg–Cl groundwater.
Fig. 8(b) focuses on the gray zone in Fig. 8(a) anddemonstrates the changes in the river salinity due tothe following scenarios (arrows 2–6 in Fig. 8 andTable 3):
• All the saline water is removed such that the baseflow at Alumot Dam is composed only of sewagee"uents with low salinity. Although the down-stream river salinity (arrow 2 in Fig. 8(b)) is
expected to increase given the input of the salinegroundwater, in this scenario the overall salinitywill be significantly lower than that of the currentsituation.
• All sewage e"uent is removed such that the ini-tial river base flow at Alumot Dam will be solelycomposed of the saline sources. The downstreamriver salinity will evolve along arrow 3 (Fig. 8(b)).This is the only scenario in which the river salin-ity becomes much higher than it is at present. If,however, the sewage e"uents are adequatelytreated and returned to the river, no majorchange in the river salinity will take place.
• The THS is selectively removed. The overallsalinity of the base flow will be lower than todaybut the downstream river salinity will evolve tovalues similar to the current situation (arrow 4in Fig. 8(b)).
• The Tabgha Springs is selectively removed. Thevolume of the base flow will significantly decreasebut its salinity and the salinity of the downstreamriver (arrow 5 in Fig. 8(b)) will be only slightlylower than the current situation.
• The Tabgha Springs are desalinized at an e#-ciency of 50%, and the reject brine (i.e., 50% ofthe initial volume with twice the original salinity)is diverted into the Lower Jordan River. Thesalinities of the base flow and downstream riverare expected to be slightly higher than the currentsituation (arrow 6 in Fig. 8(b)).
• All the current inputs that make up the base flowof the Jordan River (sewage e"uents and salinesprings in SWC) are eliminated. The downstreamriver salinity will therefore be controlled only by
Table 1Calculation of the mixing proportions (f) between the saline component (as sampled at Tiberias Hot Springs) and sewage component(average of samples from Bitaniya sewage) that composed the initial base flow of the Jordan River at Alumot Dam (in separate months)
Name Date Ca Mg Na Cl SO4
Tiberias Hot Springs (THS) Moise et al. (2000) mg/L 3523 680 7042 18081 827Bitaniya sewage Average mg/L 91 61 271 451 93Alumot dam 01/02/01 mg/L 347 98 850 1860 150THS f (%) 7 6 9 8 8Bitaniya sewage f (%) 93 94 91 92 92Alumot dam 01/03/01 mg/L 359 97 855 1970 150THS f (%) 8 6 9 9 8Bitaniya sewage f (%) 92 94 91 91 92Alumot dam 01/04/01 mg/L 378 105 930 2070 160THS f (%) 8 7 10 9 9Bitaniya sewage f (%) 92 93 90 91 91Alumot dam 01/06/01 mg/L 363 104 950 2040 158THS f (%) 8 7 10 9 9Bitaniya sewage f (%) 92 93 90 91 91
Calculations were made for di!erent major elements.
2144 E. Farber et al. / Applied Geochemistry 20 (2005) 2138–2153
the groundwater discharge. The gradual dis-charge of groundwater into the river will be mostpronounced under this scenario, as the flow ratewill increase down stream. The composition ofthe river will not change along the river and willbe the Mg–Cl of the discharging groundwater. Itis expected that after 12 km, the salinity of theriver will be about 1150 mg Cl/L with a maxi-mum flow rate of 24 MCM/a (assuming 80%groundwater discharging).
Overall, it seems that removal of the saline wateris the preferred management scenario to have opti-mal e!ects on the river!s ecology, whereas removalof the sewage e"uents will have detrimental e!ectsin term of the river salinity.
Saline water Fraction, f (%)
Initial river
0.55
0.60
0.65
0.70
0.75
0.80
0.85
0.90
0.95
0 5000 10000 15000 20000
Initialriver
Saline
Sewage
0.01
0.02
0.03
0.04
0.05
0.06
0.07
0.08
0 10000
Na/
Cl (
M/M
)
SO4/
Cl (
M/M
)
0 20 40 60 80 100 0 605 1510 5 1510 20 40
20000
Saline
10080
Sewage
5000 15000 20000
Sewage
Saline
1.0
1.5
2.0
2.5
Saline
Sewage
Ca/
Mg
(M/M
)
Ca/
SO4
(M/M
)
0 20 40 60 80 100 0 20 40 60 80 100
Initial river
Initialriver
105 15 5 15103.5 12
3.010
8
6
4
0.5 20 5000 10000 15000 20000 0 5000 1500010000
Chloride concentration (mg/L)
Fig. 5. Na/Cl, SO4/Cl, Ca/Mg and Ca/SO4 ratios versus Cl concentration (mg/L) of the origin of the water river, as sampled from belowof Alumot Dam at di!erent times. The measured data are compared to calculated mixing lines between sewage water (as sampled atBitaniya) and the saline water end member (as sampled at Tiberias Hot Springs). Note that the river composition at Alumot Dam isdetermined by the mixing relationship between the sewage component (!90%) and the saline component (!10%).
Table 2The contribution of Mg–chloride groundwater (as sampled at theYarmouk River) to the river flow along the northern section
Date Sampling location Distance fromAlumot (km)
Yarmoukfraction (%)
01/09/99 Sheich Hussein Bridge 22.7 4801/03/00 Hamadiya South 20.1 8701/05/00 Neve Ur South 12.7 5801/08/00 Neve Ur North 11.6 4401/12/00 Hamadiya South 20.1 8201/02/01 Hamadiya South 20.1 8501/03/01 Hamadiya North 18.6 5101/04/01 Hamadiya North 18.6 5001/06/01 Hamadiya South 20.1 3001/08/01 Shif!a Station 27.7 9
The calculated results shown here (and in Fig. 6(a)) were obtainedusing Cl concentration.
E. Farber et al. / Applied Geochemistry 20 (2005) 2138–2153 2145
4.2. The southern segment of the Lower Jordan River
4.2.1. Current situationThe southern segment (Segment Two; 66–100 km
from Alumot Dam; Fig. 1) of the Lower JordanRiver is characterized by a downstream increase insalinity (Fig. 2). Historical data (Bentor, 1961; Neevand Emery, 1967) indicate that the Cl concentrationof the most southern point of the Lower JordanRiver at Abdalla Bridge was !400 mg/L in 1925
and 1947. The present river Cl concentration is inthe range of 1500–2500 mg/L during most of theyear, but can reach up to 5400 mg/L at its mostsouthern point during the summer months (Farberet al., 2004).
Until the 1950s, the estimated Jordan River dis-charge to the Dead Sea was approximately 1300MCM/a (Klein, 1995, 1998; Hof, 1998). The currentdischarge is only 30–200 MCM/a (Holtzman et al.,2005; Tahal, 2000). The significantly reduced flow
0102030405060708090
100
Sep-99
Nov-99
Jan-00
Mar-00
May-00
Jul-00
Sep-00
Jan-01
Mar-01
May-01
Jul-01
Date
Mg-
chlo
ride
GW
Fra
ctio
n, f
(%)
Nov-00
1
10
100
1000
Oct Nov Dec Jan Feb Mar Apr May June July Aug Sept
Mon
thly
Vol
ume
(MC
M)
1990/91
1991/92
1992/93
1993/94
1994/95
1995/96
1996/97
1997/98
1998/99
1999/00
Average
a
b
Fig. 6. (a) Mg–Cl groundwater (GW; as sampled at Yarmouk River) contribution to the Lower Jordan River!s chemical compositionalong the northern section of the river, and (b) monthly flow volumes at the Naharaim hydrometric station (in the Yarmouk River), from1990–2000 (Israeli Hydrological Service, 2002). Note the correspondence between the increases in the discharge of surface andgroundwater during the fall and winter months, marked as arrows.
2146 E. Farber et al. / Applied Geochemistry 20 (2005) 2138–2153
of the Lower Jordan River has resulted in loweringthe Dead Sea water level by over 20 m in the last 50a(Gavrieli and Oren, 2004; Hassan and Klein, 2002).
To predict the water quality of the southern partof the Lower Jordan River under di!erent water-management scenarios, the current hydrologicalsituation must first be determined. Farber et al.(2004) investigated the chemical and isotopic com-positions of river water in the southern section of
the Lower Jordan River and the associated inflowsand groundwater. The geochemical data indicatedthat the river!s quality is largely controlled bynon-point discharge of saline groundwater sources.It was demonstrated that the groundwater itself isa mixture of two end-members: (1) SO4-rich salinegroundwater; and (2) Ca–Cl Rift Valley brines.The SO4-rich groundwater is characterized by highNa/Cl (0.81–1.0), SO4/Cl (0.25–0.50), and low Br/Cl (1–4 · 10&3) molar ratios. In contrast, the brineshave low Na/Cl (0.55–0.69), SO4/Cl (0.02–0.04),and high Br/Cl (5–9 · 10&3) ratios. Farber et al.(2004) recognized seasonal variations in the inten-sity and locations of salinization of the Jordan Riverwater. These variations are related to the di!erentialcontribution of the two end-member groundwatersources. It was shown that the SO4-rich ground-water contribution predominates during the springmonths in a particular river section A (70–80 kmfrom the river!s origin at Alumot Dam; Fig. 9),while the Ca–Cl brine source a!ects section B(>75 km; Fig. 9) mostly during the summer months.Farber et al. (2004) estimated Cl concentrations of!9000 mg/L for the SO4-rich groundwater that dis-charge to the river in section A and 18,700 mg/L forthe brines that discharge to the river in section B.
The distinction of these two sections allowsquantification of the groundwater discharge byassuming that: (1) groundwater contribution has adistinct discharge Qgw and concentration Cgw inthe two sections; (2) no sinks or additional sourcesexist in the two sections.
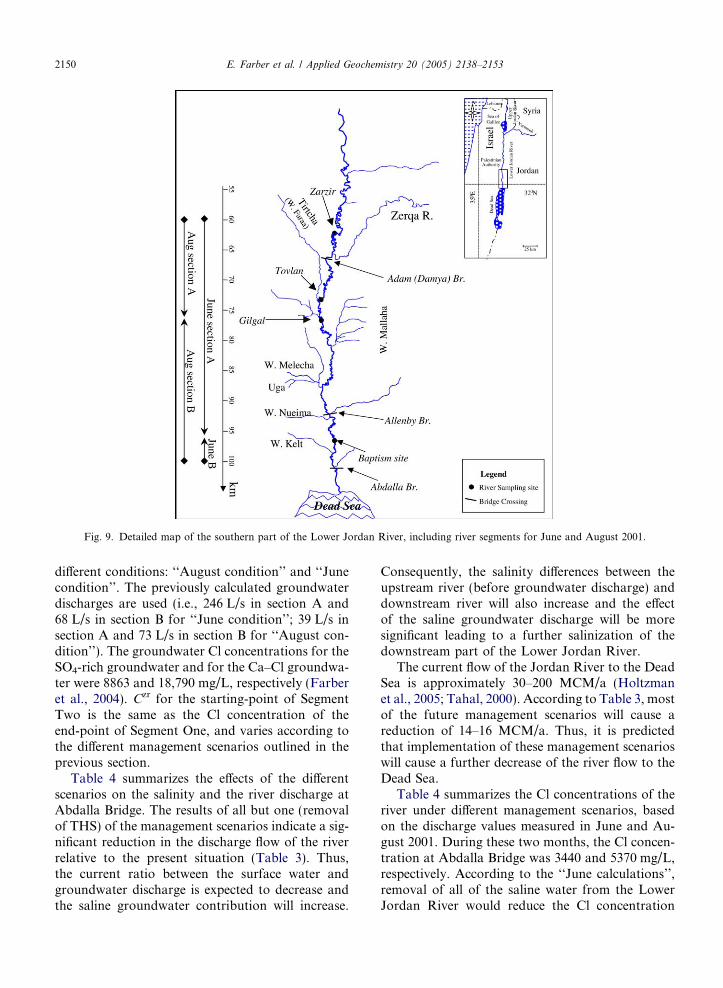
The chemical variations of the river are used todefine the two sections during the spring (June)and summer (August) months. Section A and Bare a!ected by the SO4-rich groundwater andbrines, respectively. In the spring (June) section Alies between Zarzir site (59.7 km downstream fromAlumot Dam; Fig. 9) and the Baptism site(95.6 km; 35.9 km long section), and section B liesbetween the Baptism site and Abdalla Bridge(100 km; 4.4 km long section). In the summer (Au-gust), section A lies between the Zarzir and Gilgalsites (76.6 km; 16.9 km long section) and section Bbetween Gilgal and Abdalla Bridge (23.4 km longsection).
Following Eqs. (1) and (2) solute mass balanceswere conducted for the specific sections. For sectionA the solute mass-balance during the spring (June2001) is
CbpQbp " CzrQzr # Qgw1 Cgw
1 ; $7%
0
200
400
600
800
1000
0 5000 10000 15000 20000
Mg-chloride
THS
Sewage
20%
40%
60%
80%
10%
20%
30%
40%
50%
60%
70%
80%
90%
Saline water Fraction, f (%)
Mg-
chlo
ride
Fra
ctio
n, f
(%)
Sep 1999
Initial riverRiver flow direction
SO4
(mg/
L)
Cl (mg/L)
0
200
400
600
800
1000
0 5000 10000 15000 20000
Mg-chloride
THS
Sewage
Saline water Fraction, f (%)
Mg-
chlo
ride
Fra
ctio
n, f
(%)
Dec 2000
20%
40%
60%
80%
10%
20%
30%
40%
50%
60%
70%
80%
90%
Initial river
River flow direction
SO4
(mg/
L)
Cl (mg/L)
a
b
Fig. 7. Sulfate and Cl concentrations of river samples and aninterpretation of the mixing processes occurring among the 3 endmembers (i.e., saline spring – as sampled at the Tiberias HotSprings (THS), sewage – an average of Bitaniya water samples,Mg–chloride groundwater – as sampled at the Yarmouk River,and river water from the initial 20 km as sampled duringSeptember 1999 (a) and December 2000 (b)). Note that as thedownstream distance from the lower river!s origin increases, theriver concentrations move towards the data point representingthe shallow groundwater end member (‘‘Mg–chloride’’). Thegroundwater contribution to the water flow of the river varies intime (i.e., inDecember 2000 the groundwater discharge constituted!80% of the river flowwhile in September 1999 it was only!45%).
E. Farber et al. / Applied Geochemistry 20 (2005) 2138–2153 2147
where Cbp and Czr are Cl concentrations at the riv-er!s initial-point and end-point of section A (i.e.,Baptism sites and Zarzir; 2720 and 1460 mg/L,respectively). Cgw
1 is the we conducted-rich ground-water in section A (8863 mg/L; Farber et al., 2004),Qzr is the actual river-discharge measurement car-ried out in June 2001 (1200 L/s; Holtzman, 2003),and Qgw
1 is the we conducted-rich groundwaterdischarge in section A. Using this data, the totaldischarge of river flow at the end-point of sectionA was calculated (i.e.,Qbp at Baptism Site). Thisdischarge is equal to the total discharges
Qbp " Qzr # Qgw1 . $8%
For section B the solute mass balance during thespring (June 2001) is
CabQab " CbpQbp # Qgw2 Cgw
2 ; $9%
where Cbp and Cab are the Cl concentrations at theriver!s initial-point and end-point of section B (i.e.,at Baptism Site and Abdalla Bridge, 2720 and3440 mg/L, respectively). Cgw
2 is the brine componentin section B (18,790 mg/L; Farber et al., 2004),Qbp isthe value that was calculated previously, Qgw
2 is the
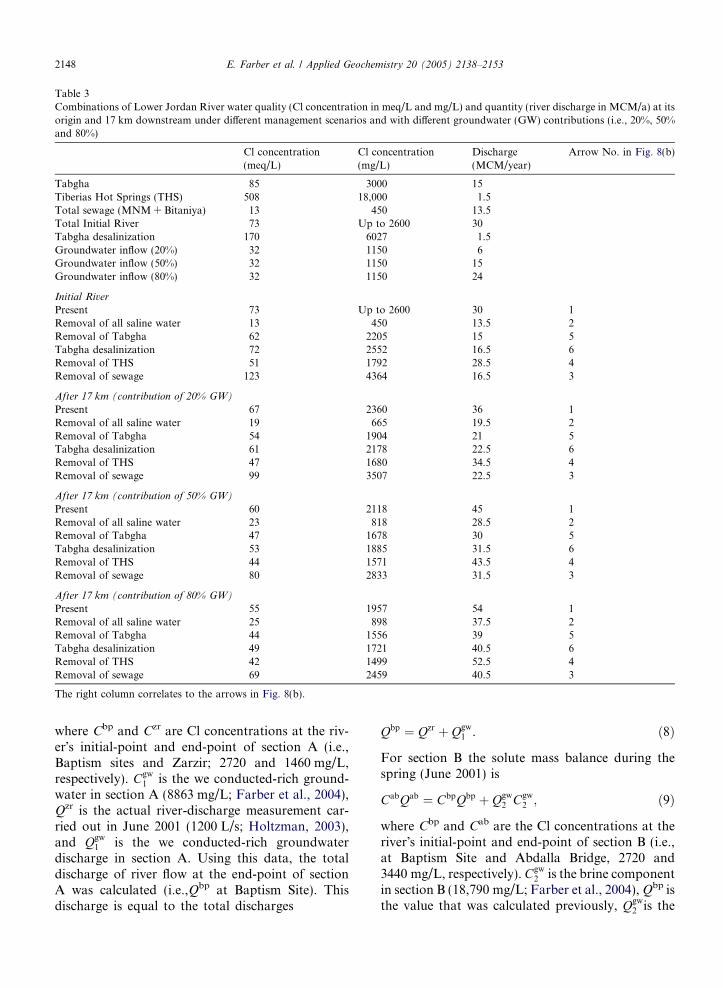
Table 3Combinations of Lower Jordan River water quality (Cl concentration in meq/L and mg/L) and quantity (river discharge in MCM/a) at itsorigin and 17 km downstream under di!erent management scenarios and with di!erent groundwater (GW) contributions (i.e., 20%, 50%and 80%)
Cl concentration(meq/L)
Cl concentration(mg/L)
Discharge(MCM/year)
Arrow No. in Fig. 8(b)
Tabgha 85 3000 15Tiberias Hot Springs (THS) 508 18,000 1.5Total sewage (MNM + Bitaniya) 13 450 13.5Total Initial River 73 Up to 2600 30Tabgha desalinization 170 6027 1.5Groundwater inflow (20%) 32 1150 6Groundwater inflow (50%) 32 1150 15Groundwater inflow (80%) 32 1150 24
Initial RiverPresent 73 Up to 2600 30 1Removal of all saline water 13 450 13.5 2Removal of Tabgha 62 2205 15 5Tabgha desalinization 72 2552 16.5 6Removal of THS 51 1792 28.5 4Removal of sewage 123 4364 16.5 3
After 17 km (contribution of 20% GW)Present 67 2360 36 1Removal of all saline water 19 665 19.5 2Removal of Tabgha 54 1904 21 5Tabgha desalinization 61 2178 22.5 6Removal of THS 47 1680 34.5 4Removal of sewage 99 3507 22.5 3
After 17 km (contribution of 50% GW)Present 60 2118 45 1Removal of all saline water 23 818 28.5 2Removal of Tabgha 47 1678 30 5Tabgha desalinization 53 1885 31.5 6Removal of THS 44 1571 43.5 4Removal of sewage 80 2833 31.5 3
After 17 km (contribution of 80% GW)Present 55 1957 54 1Removal of all saline water 25 898 37.5 2Removal of Tabgha 44 1556 39 5Tabgha desalinization 49 1721 40.5 6Removal of THS 42 1499 52.5 4Removal of sewage 69 2459 40.5 3
The right column correlates to the arrows in Fig. 8(b).
2148 E. Farber et al. / Applied Geochemistry 20 (2005) 2138–2153
Ca–Cl groundwater discharge in section B. Usingthis data, the total discharge of river flow at theend-point of section B was calculated (i.e., Qab atAbdalla Bridge). This discharge is equal to the totaldischarges
Qab " Qbp # Qgw2 . $10%
In the same way the groundwater discharge for sec-tions A and B during the summer was calculated(August 2001), as section A spans from Zarzir toGilgal and section B from Gilgal to Abdalla Bridge.For these calculations, the actual river-dischargemeasurements carried out in August 2001 were used(300 L/s; Holtzman, 2003) and the Cl concentra-tions measured in the river during that period.
The results indicate that groundwater dischargerates in June 2001 were 246 and 68 L/s for sectionsA and B, respectively. In August 2001 the dischargerates were 39 and 73 L/s for section A and B, respec-tively. The data indicate that the groundwater flux(i.e., the discharge divided by the length of everysection) is not constant around the year and thetotal flux in June was higher.
Following Eq. (4), the Cl concentration in Abda-lla Bridge (i.e., the end-point of the river) can becalculated as follows:
Cab " CzrQzr # Cgw1 Qgw
1 # Cgw2 Qgw
2
Qzr # Qgw1 # Qgw
2
; $11%
where the indexes 1 and 2 refer to groundwater ofsections A and B, respectively. Thus, the salinityin Abdalla Bridge is directly dependent on the rela-tionships between the river flow, (Qzr), the ground-water flow in the two sections $Qgw
1 and Qgw2 %, and
their salinities. Based on Eq. (11) it is possible toevaluate how the salinity in Abdalla Bridge wouldchange under di!erent management scenarios.
4.2.2. Future prediction and managementThe di!erent management scenarios considered
for Segment One of the Lower Jordan River (fromAlumot Dam to Adam Bridge) are also applied toSegment Two. The final point of Segment One(66 km downstream from Alumot Dam) is used asa starting point for Segment Two. The Cl concentra-tion, Cab, at Abdalla Bridge was calculated for two
September 1999
0
200
400
600
800
1000
0 1000 2000 3000 4000 5000
T
Line A
Line C
Line D
Line B
16542
3
Mg-chloride
Sewage
50% contribution of Mg-chloride Groundwater to the initial river base flow
Line C
Cl (mg/L)
Mg-chloride
Sewage
T
5000
Line D
Line A
Line B
15000 2000010000
a
b
1000
THS
800
Cl (mg/L)
SO4
(mg/
L)
600
400
200
00
Fig. 8. (a) Mixing processes between di!erent end members that include sewage, Mg–chloride groundwater, and two saline water sourcesassuming selective removal of one of them. ‘‘T’’ represents the composition of Tabgha Springs. ‘‘THS’’ represents the composition ofTiberias Hot Springs. Line A represents the mixing between sewage water and Tiberias Hot Springs (THS). Line B represents the mixingbetween sewage water and Tabgha Springs (T). Line C represents the mixing between THS and the Mg–chloride groundwater as sampledat Yarmouk River. Line D represents the mixing between Tabgha Springs and the Mg–Cl groundwater. Figure (b) focuses on the grayzone in figure (a); arrows 1–6 represent the variation trends in the river!s chemical compositions currently (1) and as a result of theimplementation of di!erent scenarios: removal of all the saline water (2); removal of sewage (3); removal of THS (4); removal of Tabgha(5), and Tabgha desalinization (6). Note that the slope of dashed line is derived from the Holtzman et al. (2005) estimate.
E. Farber et al. / Applied Geochemistry 20 (2005) 2138–2153 2149
di!erent conditions: ‘‘August condition’’ and ‘‘Junecondition’’. The previously calculated groundwaterdischarges are used (i.e., 246 L/s in section A and68 L/s in section B for ‘‘June condition’’; 39 L/s insection A and 73 L/s in section B for ‘‘August con-dition’’). The groundwater Cl concentrations for theSO4-rich groundwater and for the Ca–Cl groundwa-ter were 8863 and 18,790 mg/L, respectively (Farberet al., 2004). Czr for the starting-point of SegmentTwo is the same as the Cl concentration of theend-point of Segment One, and varies according tothe di!erent management scenarios outlined in theprevious section.
Table 4 summarizes the e!ects of the di!erentscenarios on the salinity and the river discharge atAbdalla Bridge. The results of all but one (removalof THS) of the management scenarios indicate a sig-nificant reduction in the discharge flow of the riverrelative to the present situation (Table 3). Thus,the current ratio between the surface water andgroundwater discharge is expected to decrease andthe saline groundwater contribution will increase.
Consequently, the salinity di!erences between theupstream river (before groundwater discharge) anddownstream river will also increase and the e!ectof the saline groundwater discharge will be moresignificant leading to a further salinization of thedownstream part of the Lower Jordan River.
The current flow of the Jordan River to the DeadSea is approximately 30–200 MCM/a (Holtzmanet al., 2005; Tahal, 2000). According to Table 3, mostof the future management scenarios will cause areduction of 14–16 MCM/a. Thus, it is predictedthat implementation of these management scenarioswill cause a further decrease of the river flow to theDead Sea.
Table 4 summarizes the Cl concentrations of theriver under di!erent management scenarios, basedon the discharge values measured in June and Au-gust 2001. During these two months, the Cl concen-tration at Abdalla Bridge was 3440 and 5370 mg/L,respectively. According to the ‘‘June calculations’’,removal of all of the saline water from the LowerJordan River would reduce the Cl concentration
Fig. 9. Detailed map of the southern part of the Lower Jordan River, including river segments for June and August 2001.
2150 E. Farber et al. / Applied Geochemistry 20 (2005) 2138–2153
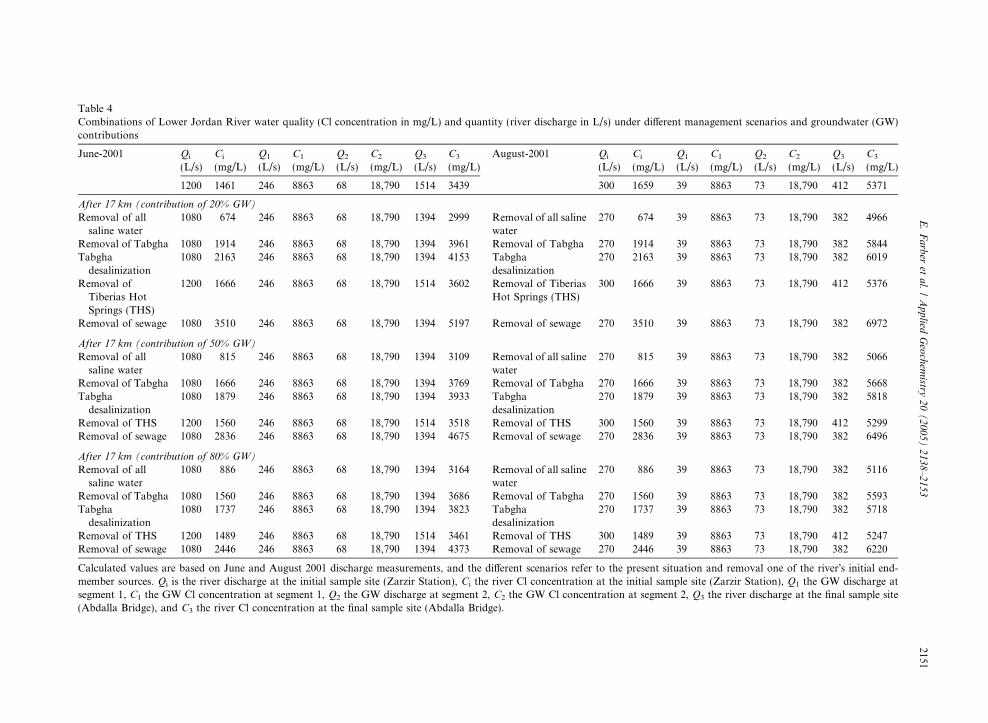
Table 4Combinations of Lower Jordan River water quality (Cl concentration in mg/L) and quantity (river discharge in L/s) under di!erent management scenarios and groundwater (GW)contributions
June-2001 Qi
(L/s)Ci
(mg/L)Q1
(L/s)C1
(mg/L)Q2
(L/s)C2
(mg/L)Q3
(L/s)C3
(mg/L)August-2001 Qi
(L/s)Ci
(mg/L)Q1
(L/s)C1
(mg/L)Q2
(L/s)C2
(mg/L)Q3
(L/s)C3
(mg/L)
1200 1461 246 8863 68 18,790 1514 3439 300 1659 39 8863 73 18,790 412 5371
After 17 km (contribution of 20% GW)Removal of allsaline water
1080 674 246 8863 68 18,790 1394 2999 Removal of all salinewater
270 674 39 8863 73 18,790 382 4966
Removal of Tabgha 1080 1914 246 8863 68 18,790 1394 3961 Removal of Tabgha 270 1914 39 8863 73 18,790 382 5844Tabghadesalinization
1080 2163 246 8863 68 18,790 1394 4153 Tabghadesalinization
270 2163 39 8863 73 18,790 382 6019
Removal ofTiberias HotSprings (THS)
1200 1666 246 8863 68 18,790 1514 3602 Removal of TiberiasHot Springs (THS)
300 1666 39 8863 73 18,790 412 5376
Removal of sewage 1080 3510 246 8863 68 18,790 1394 5197 Removal of sewage 270 3510 39 8863 73 18,790 382 6972
After 17 km (contribution of 50% GW)Removal of allsaline water
1080 815 246 8863 68 18,790 1394 3109 Removal of all salinewater
270 815 39 8863 73 18,790 382 5066
Removal of Tabgha 1080 1666 246 8863 68 18,790 1394 3769 Removal of Tabgha 270 1666 39 8863 73 18,790 382 5668Tabghadesalinization
1080 1879 246 8863 68 18,790 1394 3933 Tabghadesalinization
270 1879 39 8863 73 18,790 382 5818
Removal of THS 1200 1560 246 8863 68 18,790 1514 3518 Removal of THS 300 1560 39 8863 73 18,790 412 5299Removal of sewage 1080 2836 246 8863 68 18,790 1394 4675 Removal of sewage 270 2836 39 8863 73 18,790 382 6496
After 17 km (contribution of 80% GW)Removal of allsaline water
1080 886 246 8863 68 18,790 1394 3164 Removal of all salinewater
270 886 39 8863 73 18,790 382 5116
Removal of Tabgha 1080 1560 246 8863 68 18,790 1394 3686 Removal of Tabgha 270 1560 39 8863 73 18,790 382 5593Tabghadesalinization
1080 1737 246 8863 68 18,790 1394 3823 Tabghadesalinization
270 1737 39 8863 73 18,790 382 5718
Removal of THS 1200 1489 246 8863 68 18,790 1514 3461 Removal of THS 300 1489 39 8863 73 18,790 412 5247Removal of sewage 1080 2446 246 8863 68 18,790 1394 4373 Removal of sewage 270 2446 39 8863 73 18,790 382 6220
Calculated values are based on June and August 2001 discharge measurements, and the di!erent scenarios refer to the present situation and removal one of the river!s initial end-member sources. Qi is the river discharge at the initial sample site (Zarzir Station), Ci the river Cl concentration at the initial sample site (Zarzir Station), Q1 the GW discharge atsegment 1, C1 the GW Cl concentration at segment 1, Q2 the GW discharge at segment 2, C2 the GW Cl concentration at segment 2, Q3 the river discharge at the final sample site(Abdalla Bridge), and C3 the river Cl concentration at the final sample site (Abdalla Bridge).
E.Farber
etal.
/Applied
Geochem
istry20
(2005)2138–2153
2151

to 3000 mg/L, whereas removal of the sewage fromthe lower river!s origin would increase the Clconcentration to !5000 mg/L at Abdalla Bridge.According to the ‘‘August calculations’’, removalof all the saline water from the lower river!s originwould reduce the Cl concentration to 5200 mg/Land removal of the sewage from the lower river!sorigin would increase the Cl concentration to!7000 mg/L at Abdalla Bridge. Therefore, theability to utilize the river water in the future dependson the river!s management at the initial point of theLower Jordan River at Alumot Dam. Removal ofthe upstream saline water would have the most ben-eficial e!ect on the river!s ecological system, whereasremoval of the sewage water would have detrimen-tal e!ects in term of the river salinity.
5. Conclusions
This paper aims to predict the future salinityvariations of the Lower Jordan River under severaldi!erent management scenarios that are included inthe peace treaty between Israel and Jordan. The pre-dictions are based on the authors! understanding ofthe relationships between shallow groundwater andsurface water flow in the Jordan River. For thecalculations of the future scenarios, di!erentialremoval of the water sources (sewage and salinewaters) that composed the initial flow of the JordanRiver have been considered. Removal of sewagee"uents and saline water are the principal elementsthat are mentioned in the peace treaty betweenIsrael and Jordan concerning future joint manage-ment activities.
While the data on actual discharge flow in theJordan River is limited (Holtzman et al., 2005),recently published geochemical data (Farber et al.,2004) were used to quantify the relationshipsbetween groundwater flux and river flow.
The salinity of the initial river (at Alumot Dam) iscurrently up to 2600 mg Cl/L, and depends primarilyon the relationships between natural saline waterand sewage e"uents that are dumped into the river.The calculations show that removal of the sewagee"uents from the Lower Jordan River will increaseits salinity (to !4400 mg Cl/L), whereas removal ofthe saline component will reduce it (to !450 mgCl/L) at Alumot Dam. Current shallow groundwa-ter discharge to the northern section (SegmentOne) of the Lower Jordan River bu!ers river qualityand reduces river salinity. The river salinity decrea-ses downstream from 2360 to 2000 mg Cl/L (with
20–80% groundwater contribution, respectively)about 20 km downstream of Alumot Dam. Removalof the sewage component will cause a downstreamincrease in river salinity (to !3500 mg Cl/L),whereas removal of the saline component will causea downstream reduction in salinity (to !665 mg Cl/L). Our predictions indicate that the northern part(Segment One) of the Lower Jordan River couldturn into a low-saline river if the current salinecomponent is removed. In this case, the river willbe suitable for almost all types of agricultural appli-cations (but will have limited water for this purposedue to decrease in the river flux). In contrast, thesalinity of the Lower Jordan River could increaseupon removal of the sewage e"uents and thus itssuitability for di!erent agricultural crops would befurther limited.
The di!erent management scenarios that areapplied to the northern area of the Lower JordanRiver are also valid to the southern part (‘‘SegmentTwo’’; 66–100 km downstream from Alumot Dam).For this part of the river, we based our estimationon two discharge measurements that were carriedout in June and August 2001 at Zarzir Station(66 km downstream from Alumot Dam; Holtzmanet al., 2005) and solute mass balance assuming thatgroundwater discharge is the major source of salini-zation of the river in this section (Farber et al.,2004). The current salinity of themost southern pointof the Lower Jordan River at Abdalla Bridge is 3440and 5370 mg Cl/L (June and August 2001, respec-tively). The calculations indicate that removal of thesaline component at the initial point of the river inAlumot Dam would cause only a small change inthe downstream river!s salinity (decrease from 3440to 3000 mg Cl/L in June and 5370 to 5000 mg Cl/Lin August), given the large contribution of the salinegroundwater. However, selective removal of the sew-age component would cause a significant increase inthe downstream river!s salinity. Under this scenario,the river salinity at Abdalla Bridge would increaseto 5200 mgCl/L (in June), 7000 mgCl/L (in August).
Overall, the predictions indicate that the futureof the Lower Jordan River depends directly on thedi!erent management activities suggested by thepeace treaty between Israel and Jordan. Two oppo-site trends are shown upon elimination of the salinewater or sewage e"uents from the river. The contin-uation and possible increase in sewage drainage intothe river, combined with elimination of saline waterdischarge into the river, will significantly reduceriver water salinity and will increase its suitability
2152 E. Farber et al. / Applied Geochemistry 20 (2005) 2138–2153
for di!erent agricultural uses. In contrast, selectiveremoval of the sewage component will reduce thesurface flow, increase the contribution of the salinegroundwater in the southern part of the river, andconsequently, will increase the river!s salinity. It isconcluded that the sewage inflow into the JordanRiver is a vital component in maintaining and evenreducing the river!s salinity. Nonetheless, dischargeof sewage e"uents might contribute organiccontaminants. The authors, therefore, recommendim-proving the treatment of sewage e"uents beingdischarged into the river in order to improve otherelements of river quality.
Acknowledgments
This study was supported by the US Agency forInternational Development; Bureau for Global Pro-grams, Field Support and Research; Center for Eco-nomic Growth and Agriculture Development, TheMiddle East Regional Cooperation program(MERC project M20-068). We thank ECO Jordanand the Nature Protection Authority in Israel fortheir field assistance and contribution.
References
Bentor, Y.K., 1961. Some geochemical aspects of the Dead Seaand the question of its age. Geochim. Cosmochim. Acta 25,239–260.
Farber, E., Vengosh, A., Gavrieli, I., Marie, A., Bullen, T.D.,Mayer, B., Holtzman, R., Segal, M., Shavit, U., 2004.Hydrochemistry and isotope geochemistry of the lowerJordan River: constraints for the origin and mechanisms ofsalinization. Geochim. Cosmochim. Acta 68, 1989–2006.
Gavrieli, I., Oren, A., 2004. The Dead Sea as a dying lake. In:Nihoul, J.C.J., Zavialov, P.O., Micklin, P.P. (Eds.), Dyingand Dead Seas. Climatic versus Anthropic Causes. KluwerAcademic Publishers, Dordrecht, pp. 287–305.
Hassan, M., Klein, M., 2002. Fluvial adjustment of the LowerJordan River to a drop in the Dead Sea level. Geomorphology45, 21–33.
Hof, F.C., 1998. Dividing the Yarmouk!s waters: Jordan!s treatieswith Syria and Israel. Water Policy 1, 81–94.
Holtzman, R., Shavit, U., Segal-Rozenhaimer, M., Gavrieli,I., Farber, E., Vengosh, A., 2005. Mixing processesalong the Lower Jordan River. J. Environ. Qual.,34897–34906.
Holtzman, R., 2003. Water quality and quantities along theJordan River – salinization sources and mechanisms. In:Hebrew; tables, figures, and references in English. M.Sc.Thesis, Technion, Haifa, Israel.
Israeli Hydrological Service, 2002. Report of discharge measure-ments from Naharayim Hydrometer Station (No. 34185),Water Commissionership, Ministry of National Infrastruc-ture, Tel Aviv.
Israel–Jordan Peace Treaty, Annex II, 1994. Water RelatedMatters (verified 4 April 2004). Governments of Israel andJordan. Available from: <http://www.us-israel.org/jsource/Peace/annex2.html>.
Klein, M., 1995. The adjustment of the meandering pattern of theLower Jordan River to change in water discharge. EarthSurface Process. Landforms 10, 525–531.
Klein, M., 1998. Water balance of the Upper Jordan River basin.Water Inter. 23, 244–248.
Linnerooth, J., 1990. The Danube River Basin: negotiationsettlements to transboundary environmental issues. NatureRes. J. 30, 629–660.
Moise, T., Starinsky, A., Kolodny, Y., 2000. Ra isotopes and Rnin brines and ground waters of the Jordan-Dead Sea RiftValley: enrichment, retardation, and mixing. Geochim. Cos-mochim. Acta 64, 2371–2388.
Neev, D., Emery, K.O., 1967. The Dead Sea. Isr. Geol. Surv.Bull., 41.
Nissenbaum, A., 1969. Studies in the Geochemistry of the JordanRiver Dead Sea System. Ph.D. Dissertation, University ofCalifornia.
Salameh, E., Naser, H., 1999. Does the actual drop in DeadSea level reflect the development of water resourceswithin its drainage basin? Hydrochim. Hydrobiol. Acta27, 5–11.
Schmandt, J., 2002. Bi-national water issues in the Rio Grande/Rio Bravo basin. Water Policy 4, 137–155.
Shmueli, D.F., 1999. Water quality in international river basins.Political Geog. 18, 437–476.
Tahal, Israeli Water Division O#ce, Israeli O#ce of NationalFoundation, TAHAL-Consulting Engineering LTD, 2000.Flows in the Lower Jordan River. Report for the O#ce ofNational Foundation, 6130-d00.385.
E. Farber et al. / Applied Geochemistry 20 (2005) 2138–2153 2153