Embed Size (px)
Citation preview
Final Report
For
2016 Jordan River Bioassessment Study
Prepared For:
Friends of the Jordan River Watershed, Inc. P.O. Box 412
East Jordan, MI 49727
Prepared By:
739 Hastings Street Traverse City, Michigan 49686
Phone: (231) 941-2230 Facsimile: (231) 941-2240
www.glec.com
Principal Contact Persons:
Michelle VanDenBrand [email protected]
Dennis McCauley
January 10, 2017
Final Report Jordan River Bioassessment Study January 10, 2017
2
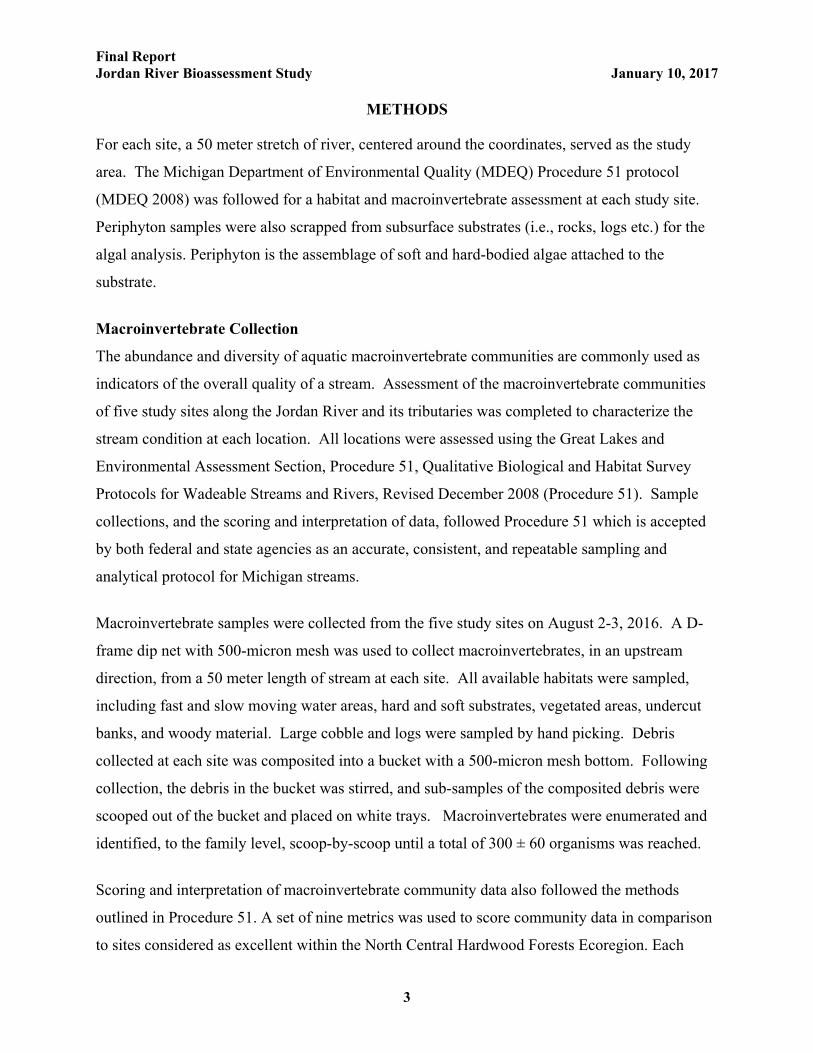
INTRODUCTION
Great Lakes Environmental Center, Inc. (GLEC) has completed a bioassessment for the Friends
of the Jordan River Watershed, Inc. at five study sites along the Jordan River and its tributaries.
The bioassessment consisted of the quantification of physical habitat, macroinvertebrate
populations and algal assemblages at each of the five sites. The study was conducted to
document existing conditions and serve as a baseline environmental assessment. Ideally, this
bioassessment will be repeated annually so that changes (or lack thereof) in the habitat,
macroinvertebrate population, or algal assemblage are observed and documented. Listed below
are the five study sites, their coordinates, and site location descriptions:
1. Deer Creek at M-32:
Latitude (Lat): 45.13597, Longitude (Lon): -85.11897
All data collected just upstream from the road-stream crossing.
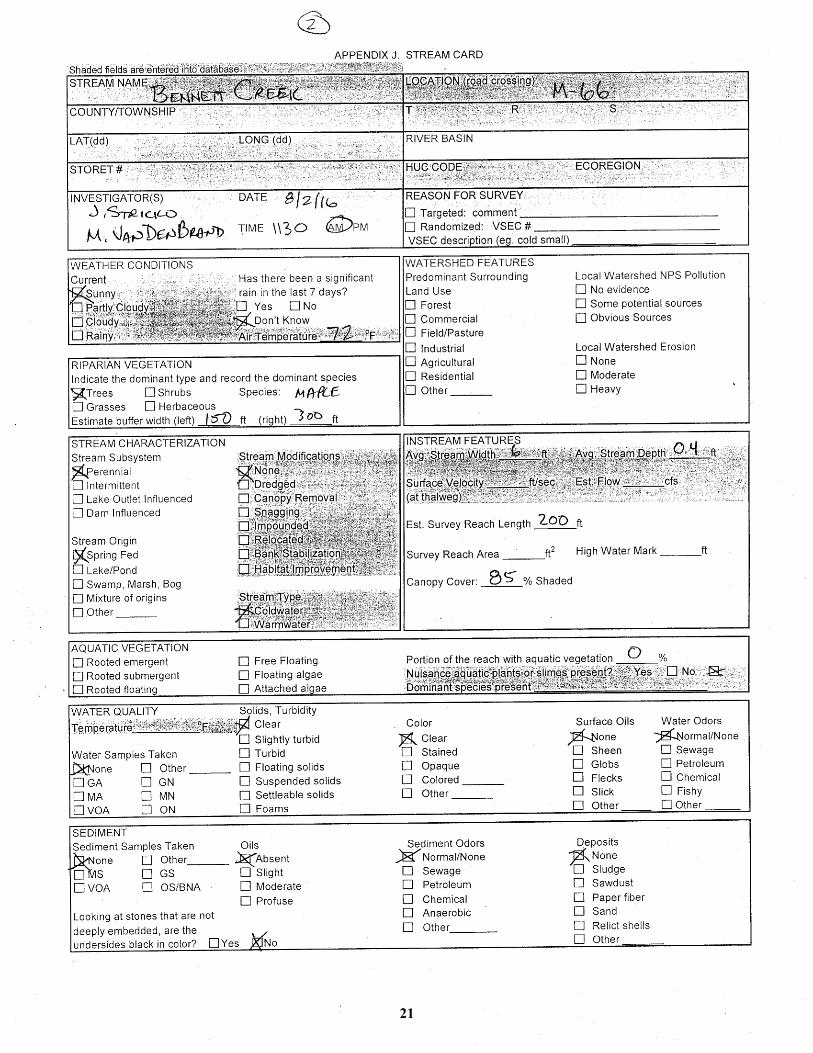
2. Bennett Creek at M-66
Lat: 45.10869, Lon: -85.12691
All data collected downstream from the road-stream crossing. Permission obtained from Frank,
property owner on the creek’s south side, to access stream here.
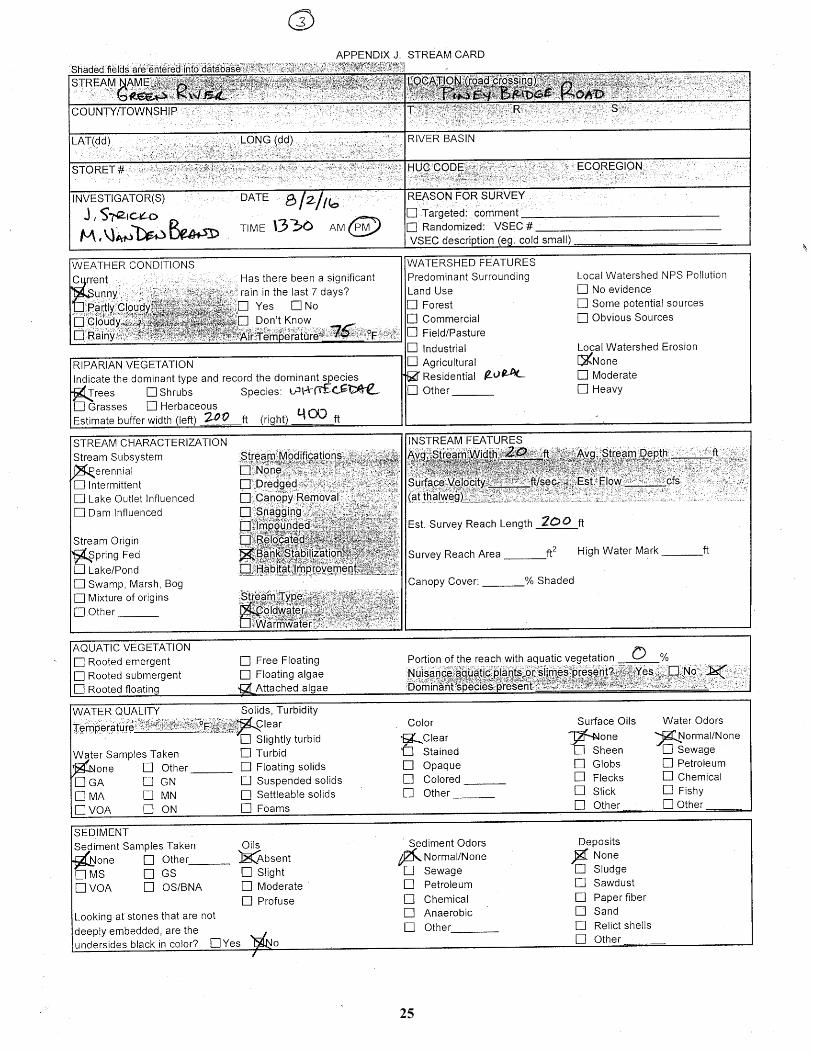
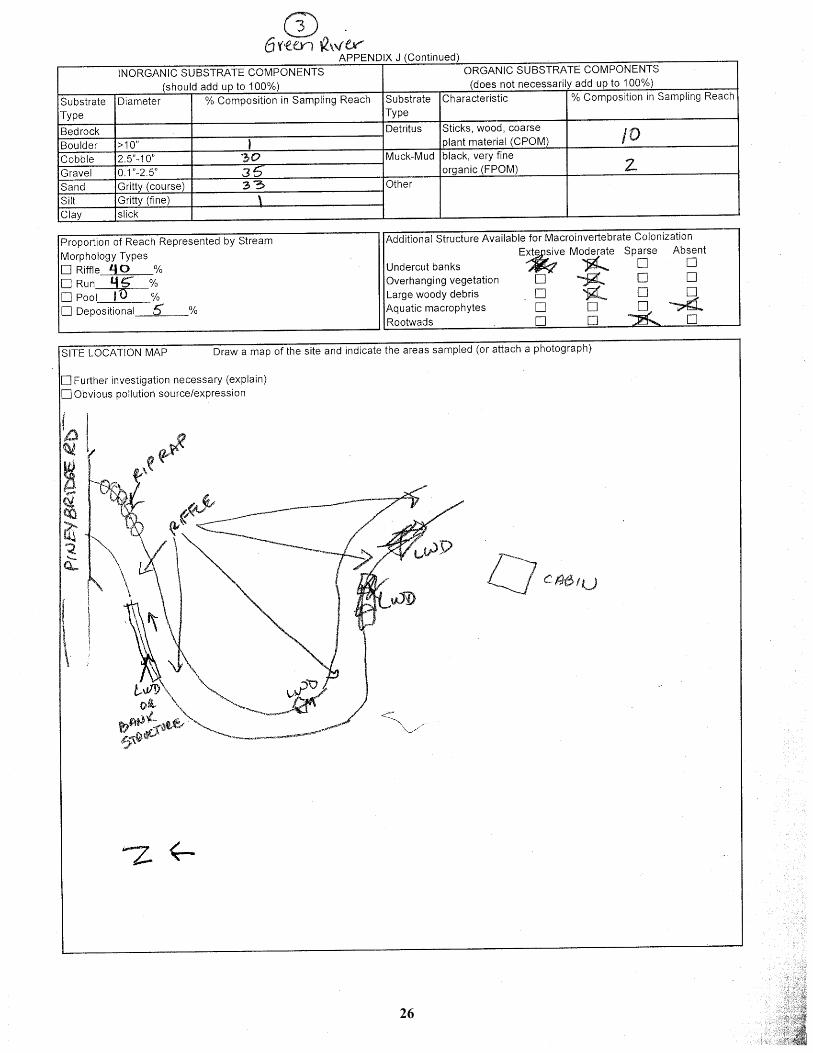
3. Green River at Pinney Bridge Road
Lat: 45.01102, Lon: -85.06065
Data collected downstream of the bridge. Both sides are well posted no trespassing.
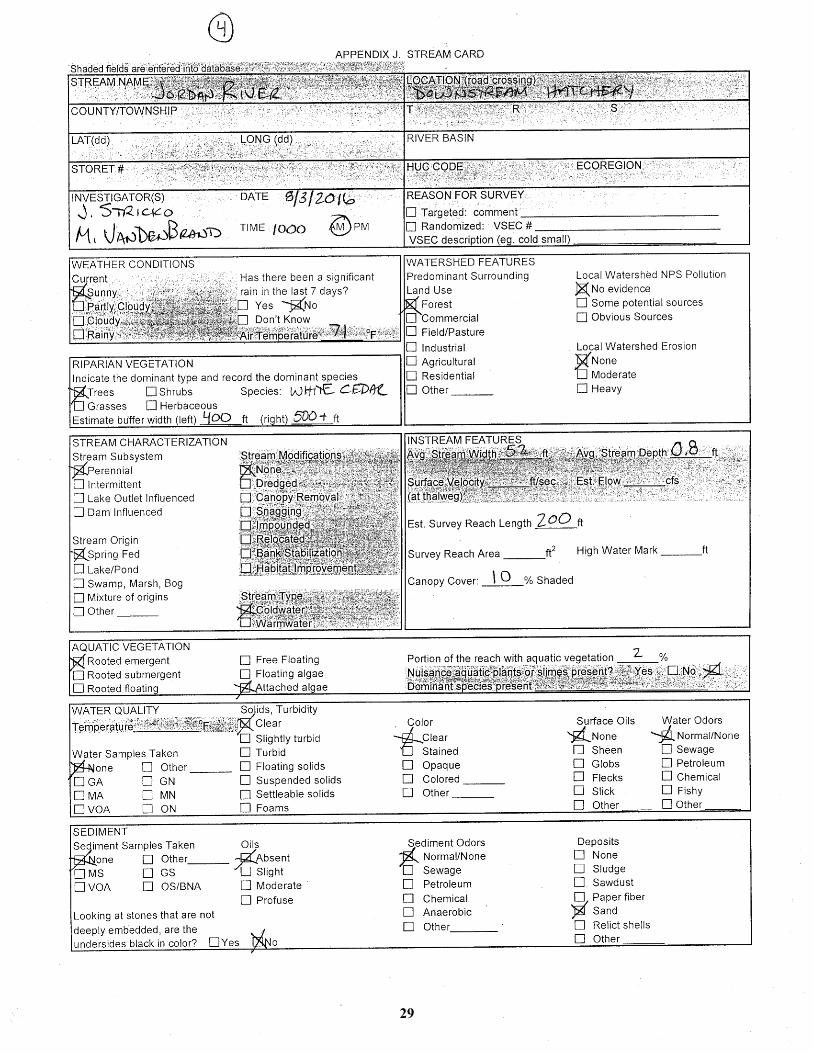
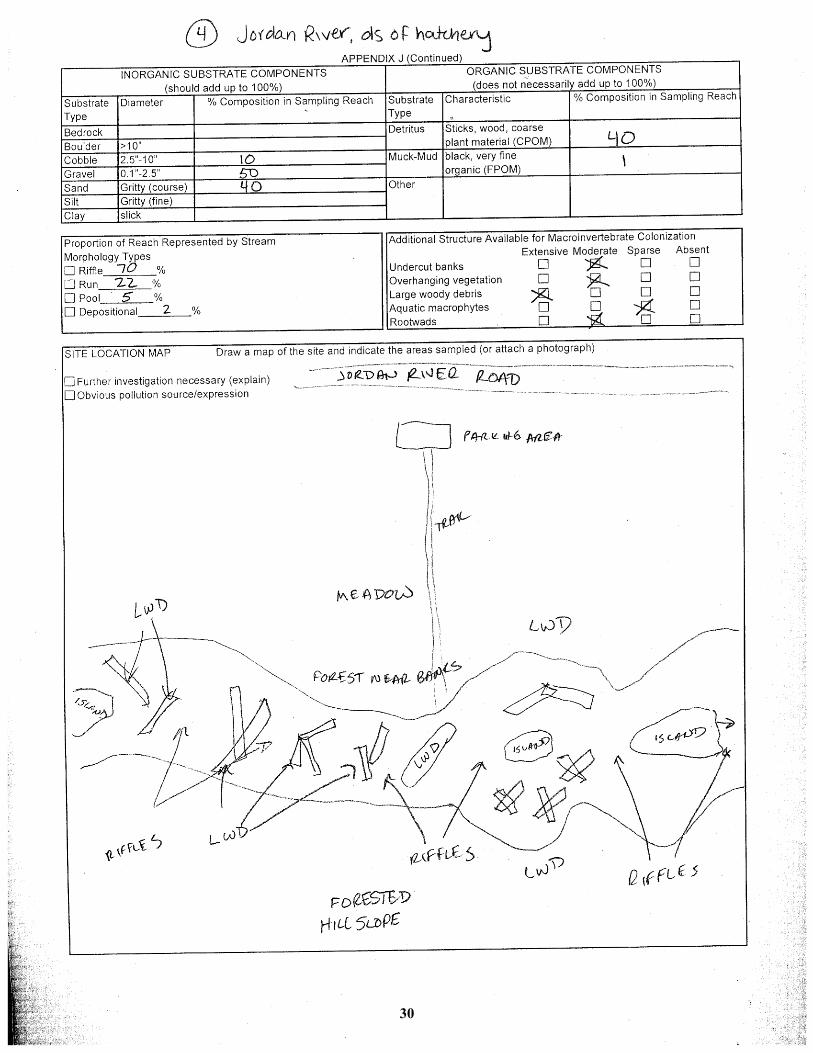
4. Jordan River, downstream of Fish Hatchery
Lat: 45.02478, Lon: -84.96973
Site required short hike to access, and is directly west from a grassy pull-off on Jordan River Rd.
south of the hatchery.
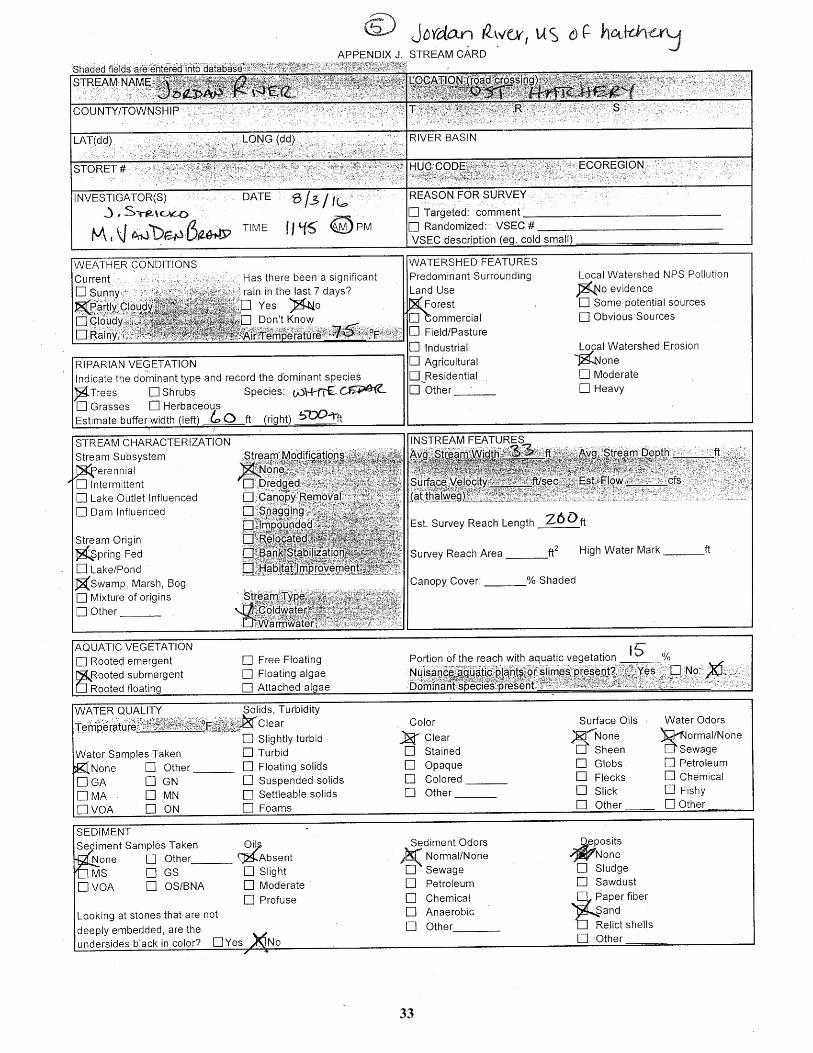
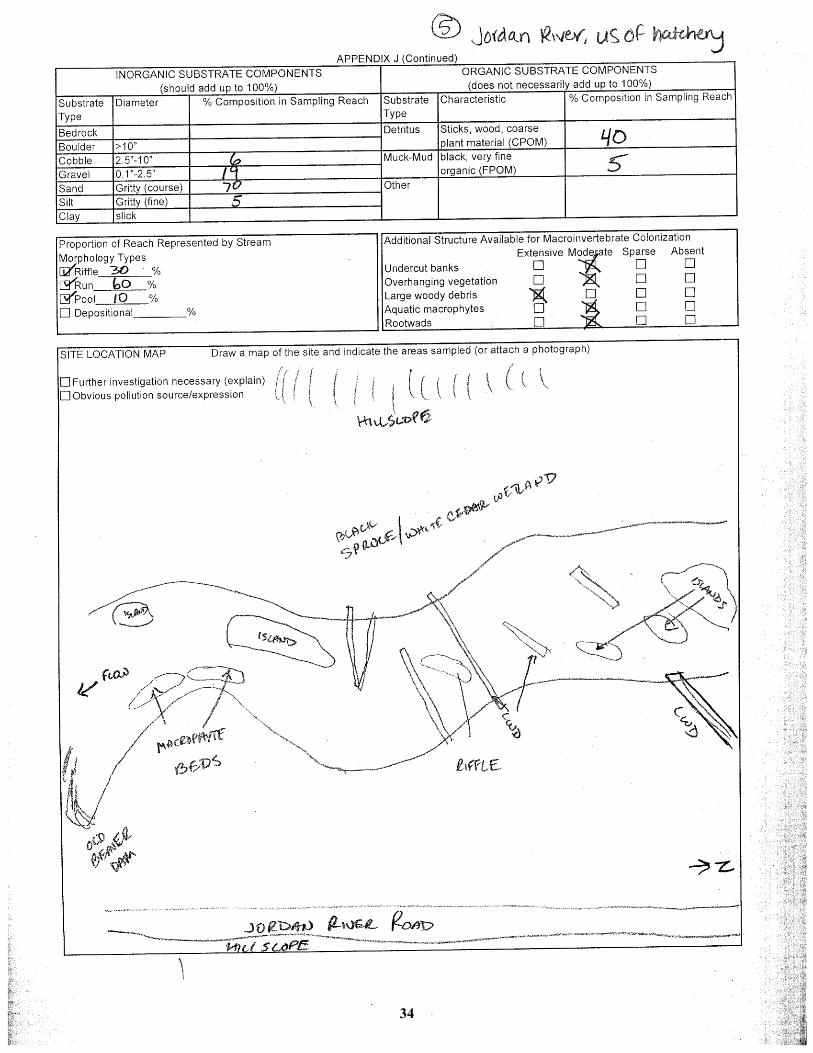
5. Jordan River, upstream of Fish Hatchery
Lat: 45.03271, Lon: -84.96581
All data was collected upstream of the Fish Hatchery. This is a braided channel with some
beaver ponding.
Final Report Jordan River Bioassessment Study January 10, 2017
3
METHODS For each site, a 50 meter stretch of river, centered around the coordinates, served as the study
area. The Michigan Department of Environmental Quality (MDEQ) Procedure 51 protocol
(MDEQ 2008) was followed for a habitat and macroinvertebrate assessment at each study site.
Periphyton samples were also scrapped from subsurface substrates (i.e., rocks, logs etc.) for the
algal analysis. Periphyton is the assemblage of soft and hard-bodied algae attached to the
substrate.
Macroinvertebrate Collection
The abundance and diversity of aquatic macroinvertebrate communities are commonly used as
indicators of the overall quality of a stream. Assessment of the macroinvertebrate communities
of five study sites along the Jordan River and its tributaries was completed to characterize the
stream condition at each location. All locations were assessed using the Great Lakes and
Environmental Assessment Section, Procedure 51, Qualitative Biological and Habitat Survey
Protocols for Wadeable Streams and Rivers, Revised December 2008 (Procedure 51). Sample
collections, and the scoring and interpretation of data, followed Procedure 51 which is accepted
by both federal and state agencies as an accurate, consistent, and repeatable sampling and
analytical protocol for Michigan streams.
Macroinvertebrate samples were collected from the five study sites on August 2-3, 2016. A D-
frame dip net with 500-micron mesh was used to collect macroinvertebrates, in an upstream
direction, from a 50 meter length of stream at each site. All available habitats were sampled,
including fast and slow moving water areas, hard and soft substrates, vegetated areas, undercut
banks, and woody material. Large cobble and logs were sampled by hand picking. Debris
collected at each site was composited into a bucket with a 500-micron mesh bottom. Following
collection, the debris in the bucket was stirred, and sub-samples of the composited debris were
scooped out of the bucket and placed on white trays. Macroinvertebrates were enumerated and
identified, to the family level, scoop-by-scoop until a total of 300 ± 60 organisms was reached.
Scoring and interpretation of macroinvertebrate community data also followed the methods
outlined in Procedure 51. A set of nine metrics was used to score community data in comparison
to sites considered as excellent within the North Central Hardwood Forests Ecoregion. Each
Final Report Jordan River Bioassessment Study January 10, 2017
4
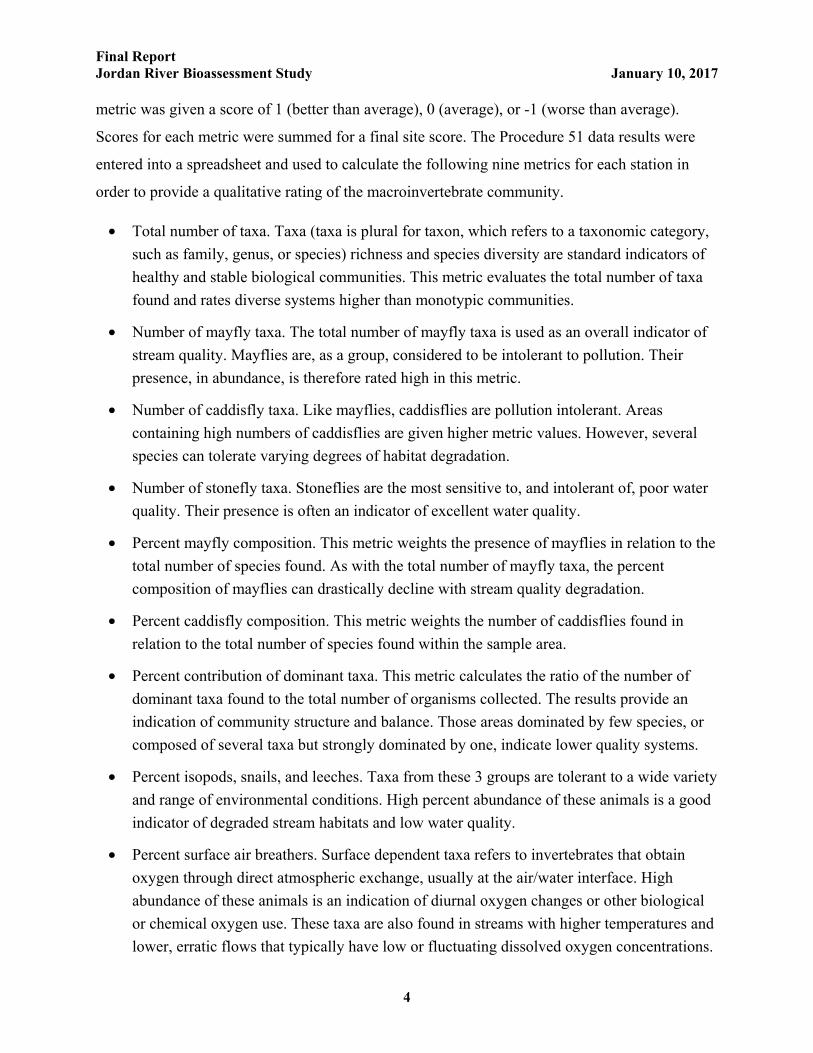
metric was given a score of 1 (better than average), 0 (average), or -1 (worse than average).
Scores for each metric were summed for a final site score. The Procedure 51 data results were
entered into a spreadsheet and used to calculate the following nine metrics for each station in
order to provide a qualitative rating of the macroinvertebrate community.
• Total number of taxa. Taxa (taxa is plural for taxon, which refers to a taxonomic category,
such as family, genus, or species) richness and species diversity are standard indicators of
healthy and stable biological communities. This metric evaluates the total number of taxa
found and rates diverse systems higher than monotypic communities.
• Number of mayfly taxa. The total number of mayfly taxa is used as an overall indicator of
stream quality. Mayflies are, as a group, considered to be intolerant to pollution. Their
presence, in abundance, is therefore rated high in this metric.
• Number of caddisfly taxa. Like mayflies, caddisflies are pollution intolerant. Areas
containing high numbers of caddisflies are given higher metric values. However, several
species can tolerate varying degrees of habitat degradation.
• Number of stonefly taxa. Stoneflies are the most sensitive to, and intolerant of, poor water
quality. Their presence is often an indicator of excellent water quality.
• Percent mayfly composition. This metric weights the presence of mayflies in relation to the
total number of species found. As with the total number of mayfly taxa, the percent
composition of mayflies can drastically decline with stream quality degradation.
• Percent caddisfly composition. This metric weights the number of caddisflies found in
relation to the total number of species found within the sample area.
• Percent contribution of dominant taxa. This metric calculates the ratio of the number of
dominant taxa found to the total number of organisms collected. The results provide an
indication of community structure and balance. Those areas dominated by few species, or
composed of several taxa but strongly dominated by one, indicate lower quality systems.
• Percent isopods, snails, and leeches. Taxa from these 3 groups are tolerant to a wide variety
and range of environmental conditions. High percent abundance of these animals is a good
indicator of degraded stream habitats and low water quality.
• Percent surface air breathers. Surface dependent taxa refers to invertebrates that obtain
oxygen through direct atmospheric exchange, usually at the air/water interface. High
abundance of these animals is an indication of diurnal oxygen changes or other biological
or chemical oxygen use. These taxa are also found in streams with higher temperatures and
lower, erratic flows that typically have low or fluctuating dissolved oxygen concentrations.
Final Report Jordan River Bioassessment Study January 10, 2017
5
This analysis results in a score based on a scale of -9 to 9; -9 to -5 is rated as Poor, -4 to 4 is rated
as Acceptable, and a score greater than 4 is rated as Excellent. Generally speaking, flowing
waters which harbor a high diversity of macroinvertebrates, including taxa sensitive to pollution
(e.g., mayfly, caddisfly, and stonefly taxa), are of high water and habitat quality. Water bodies
with low diversity of the macroinvertebrate community often have very high numbers of tolerant
organisms, due to their ability to thrive in degraded conditions with little competition or
predation.
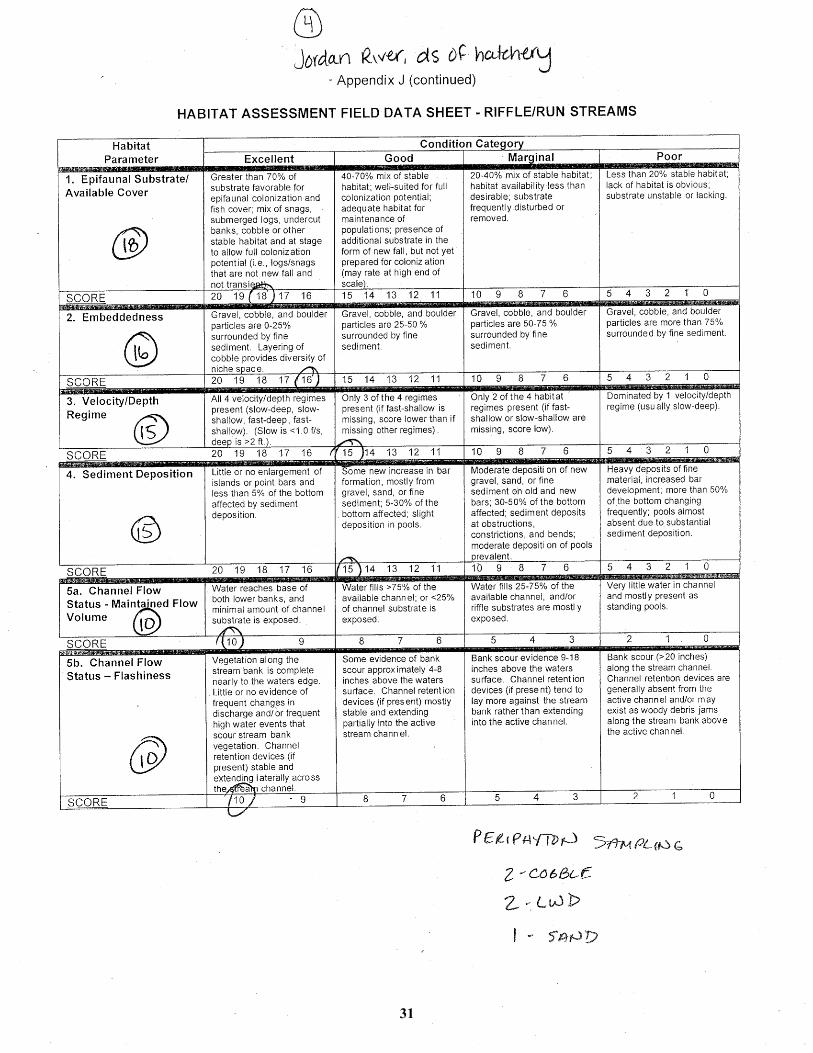
Habitat
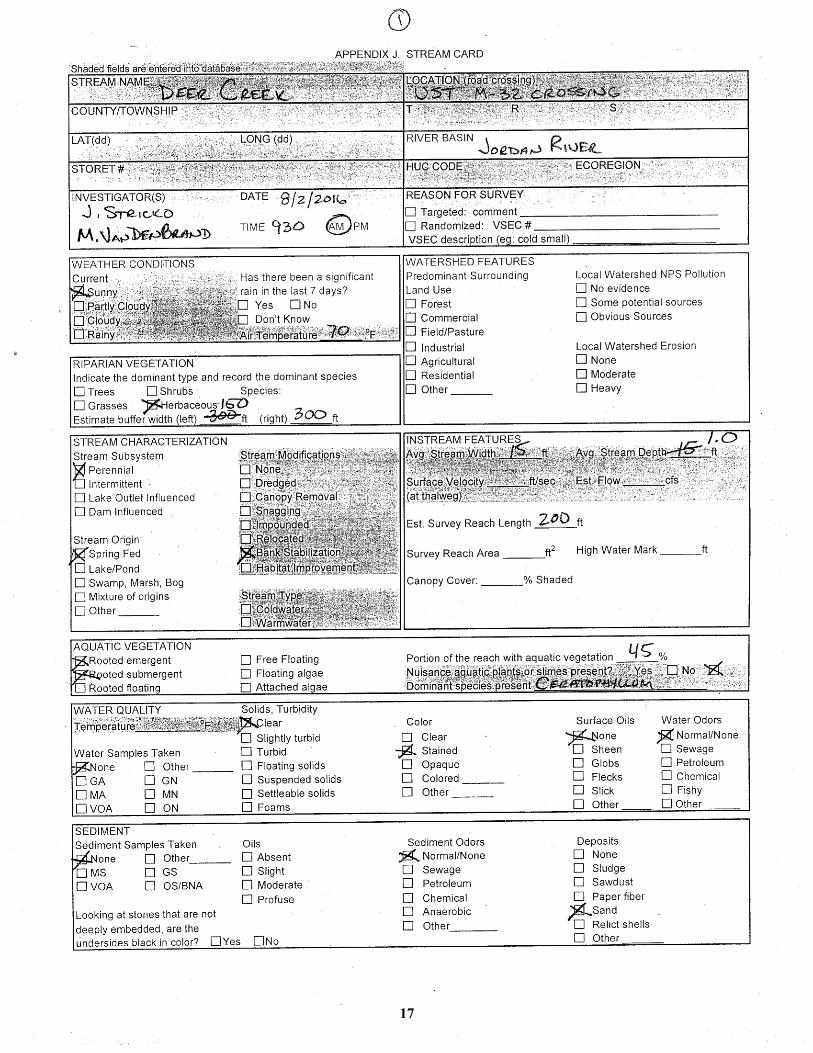
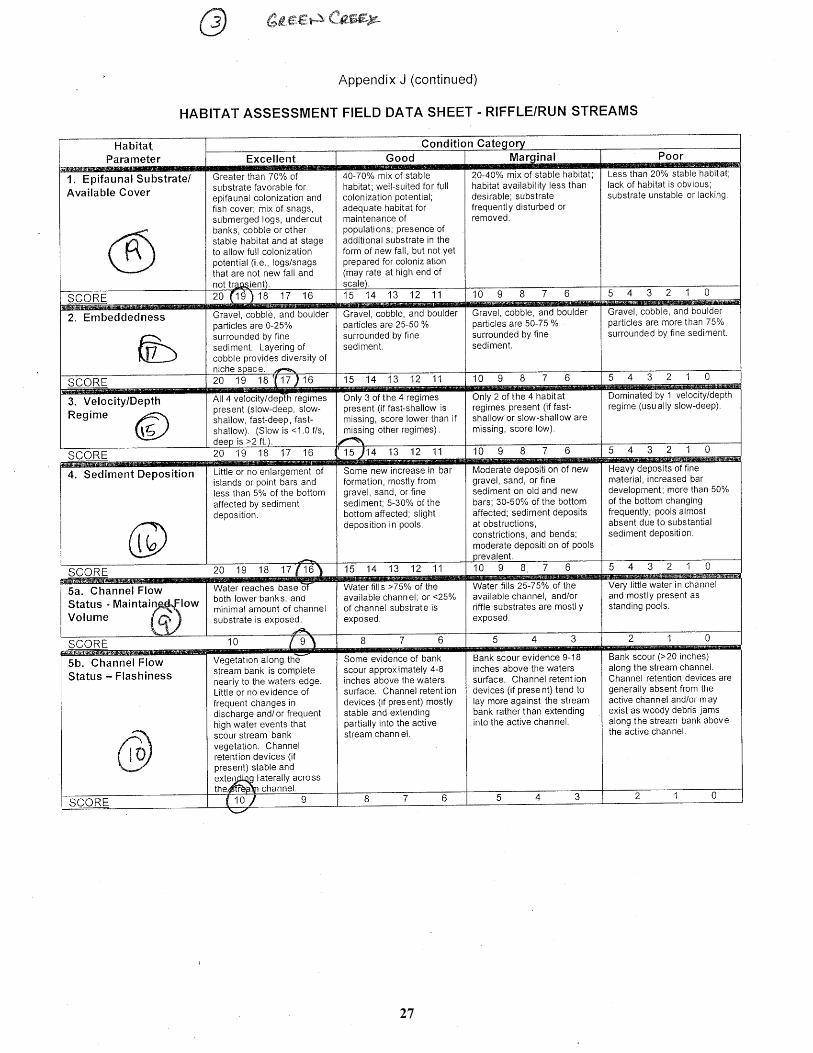
The physical characteristics of each site were documented using MDEQ’s Habitat Assessment
Stream Card and Field Data Sheet, included in the 2008 Procedure 51 protocol. The following
stream habitat characteristics were documented: riparian vegetation, watershed features, stream
characterization, instream features, aquatic vegetation, water quality, and sediment
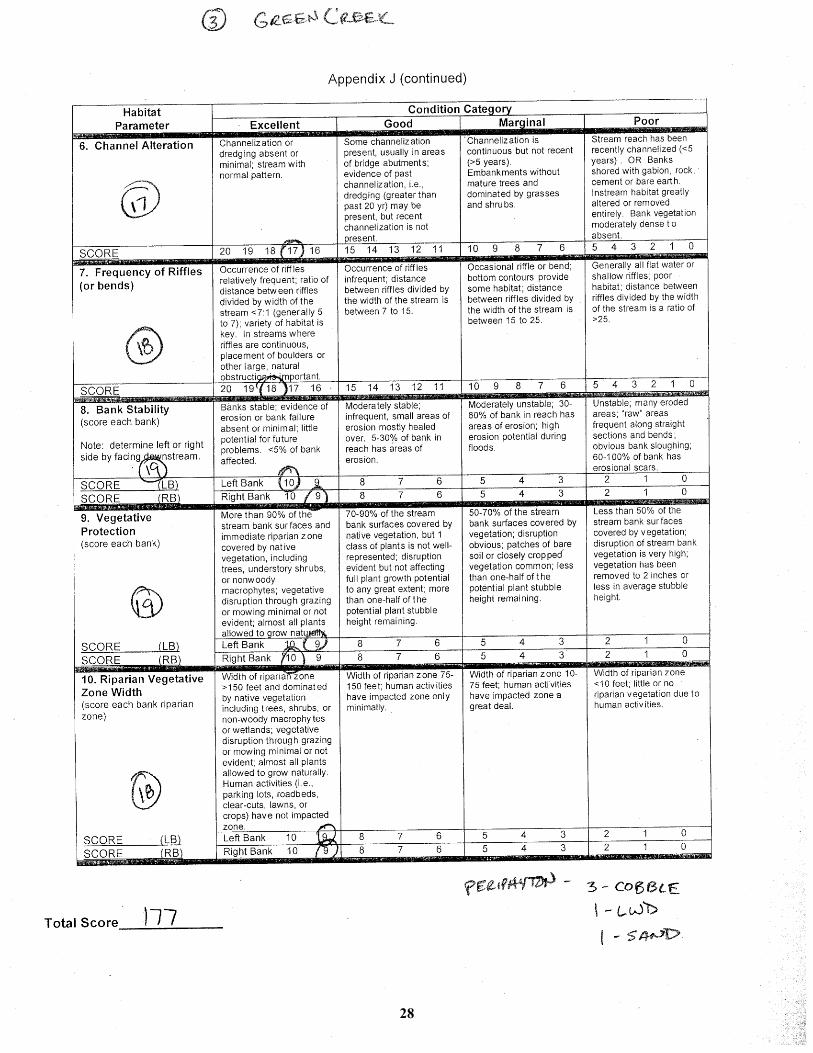
characterization. Ten metrics were used to score habitat quality. Data collection was based on
visual observations and best professional judgment.
Algae
In addition to the common Procedure 51 metrics, an algal community assessment was also
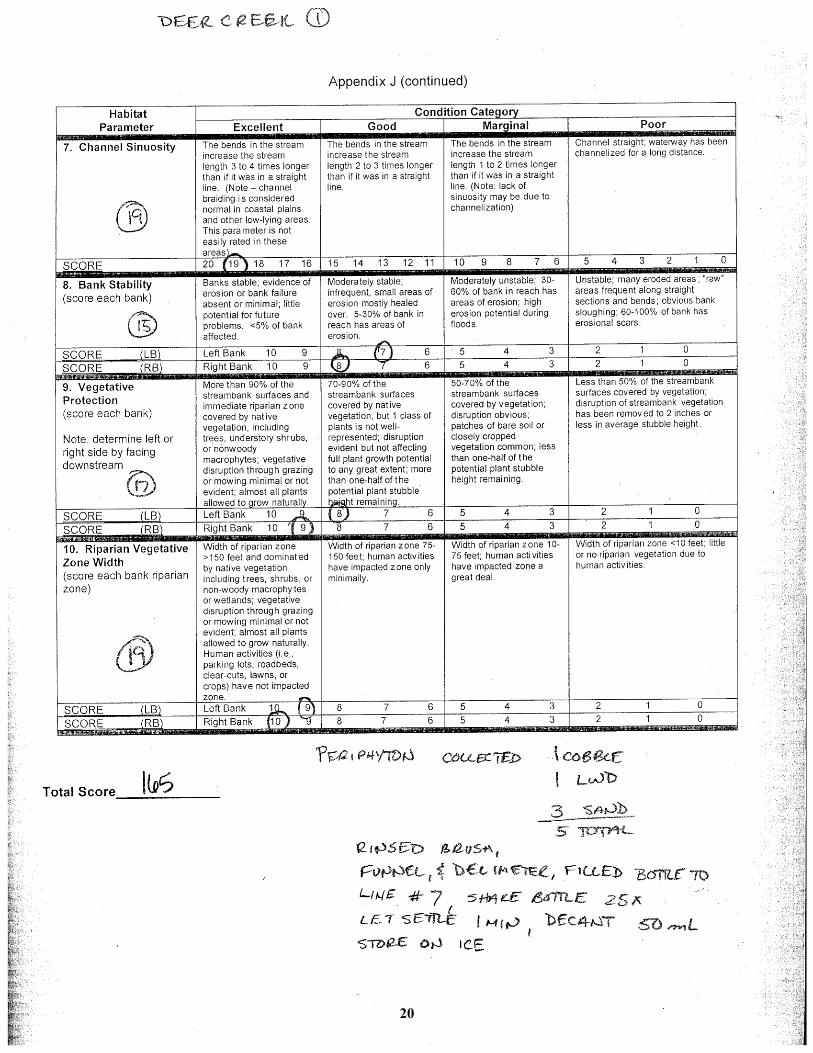
conducted in each study area. Using a 12-cm2 area delimiter (3.8 cm diameter PVC pipe, 3 cm
tall) and a stiff-bristle toothbrush, algae was scrubbed from the area inside of the delimiter from
the upper surface of three substrates based on the relative abundance of that substrate in the
sampling reach. For example, if the reach was heavily dominated by cobble substrate, all three
sub-samples were taken from cobble. If the reach had an equal mixture of cobble, sand, and
woody debris, one sub-sample was taken from each type of substrate. The three sub-samples
were composited into a 500 mL plastic bottle by rinsing the scrubbed substrate from each sub-
sample with site water into the plastic bottle. After the composite sample was collected, the
bottle was homogenized and a 50 mL aliquot was poured into a labeled 60 mL sample tube. The
samples were stored on ice until return to the laboratory. Once in the laboratory, the samples
were preserved with formalin and refrigerated until analysis. Algae are often split into two
groups when assessing water quality; soft algae and diatoms. Diatoms are algae with silica cell
walls in the division Bacillariophyta. All other algal taxa are considered soft algae. In a full
Final Report Jordan River Bioassessment Study January 10, 2017
6
bioassessment analysis, a soft algae count is performed and diatoms are cleaned and counted (a
full count consists of 600 valves) separately for species-level data. For this project, GLEC
suggested an analysis consisting of a normal soft algae count and identification of all diatoms to
the lowest possible taxonomic level. After examination in the laboratory of the collected algal
samples, this method was modified because all of the samples were strongly dominated by
diatom cells (>90%) and it was our expert opinion that the original method, which included a
soft algae count, would yield very little useful information. Instead, the soft algae count was not
conducted and an abbreviated diatom count (300 valves instead of 600) and identification to
species-level was completed to provide a baseline community composition that may be
compared to later samples. In the laboratory, diatom cells were cleaned in nitric acid, dried onto
coverslips and mounted onto microscope slides using Naphrax, a mounting medium with a high
refractive index. At 1000 magnification, 300 diatom valves (each diatom cell consists of two
diatom valves) were identified to the lowest possible level, mostly species. This abbreviated
diatom count was necessary to stay within the project’s resources. A full count may be done in
the future if desired.
RESULTS
Macroinvertebrate Assessment
Macroinvertebrate samples from the five study sites in the Jordan River Watershed contained 39
different taxa. Mayflies dominated the sample collections in three of the five study sites; Deer
Creek, Jordan River downstream of the fish hatchery, and Jordan River upstream of the fish
hatchery. Bennett Creek was dominated by caddisflies and black flies and Green River was
dominated by amphipods (scuds) and mayflies (Appendix 1). Invertebrates considered sensitive
to poor water and habitat quality (i.e., mayflies, caddisflies, or stoneflies) were collected at all
five sites. Species richness ranged from 15 to 26 taxa per site. The macroinvertebrate
community scores at all five sites scored as acceptable tending towards excellent, with the
exception of Deer Creek which scored as acceptable tending towards poor (Table 1).
Final Report Jordan River Bioassessment Study January 10, 2017
7
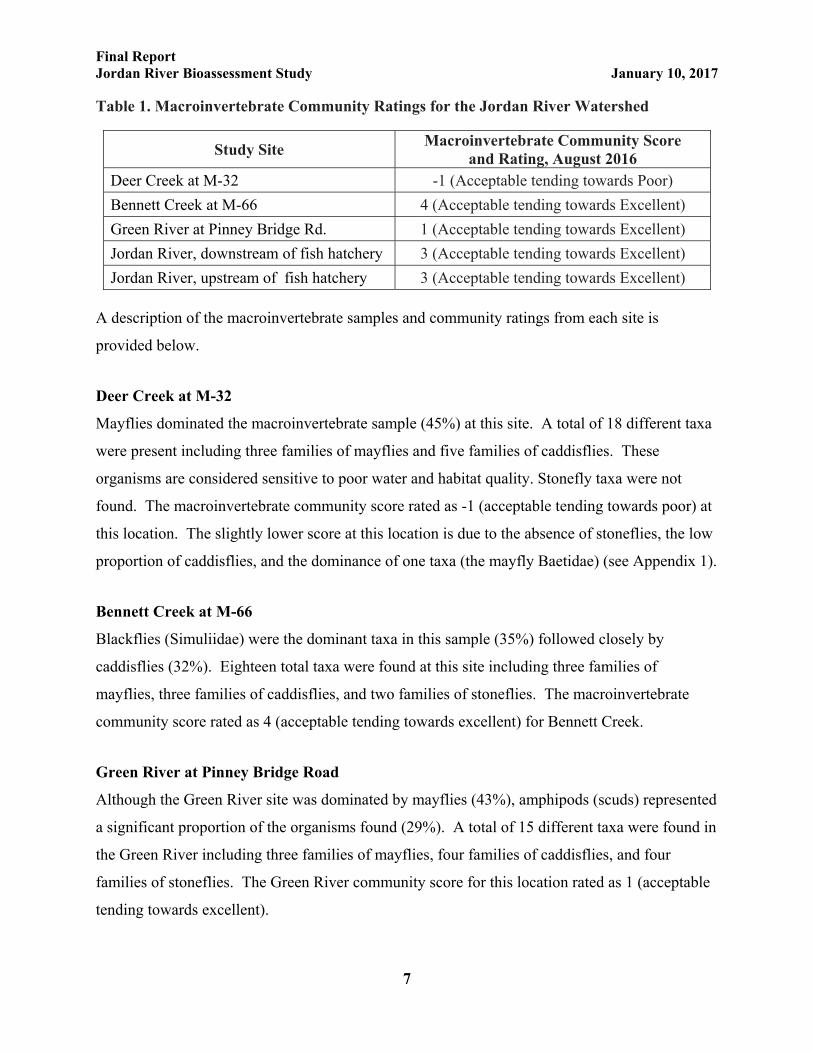
Table 1. Macroinvertebrate Community Ratings for the Jordan River Watershed
Study Site Macroinvertebrate Community Score
and Rating, August 2016 Deer Creek at M-32 -1 (Acceptable tending towards Poor)
Bennett Creek at M-66 4 (Acceptable tending towards Excellent)
Green River at Pinney Bridge Rd. 1 (Acceptable tending towards Excellent)
Jordan River, downstream of fish hatchery 3 (Acceptable tending towards Excellent)
Jordan River, upstream of fish hatchery 3 (Acceptable tending towards Excellent)
A description of the macroinvertebrate samples and community ratings from each site is
provided below.
Deer Creek at M-32
Mayflies dominated the macroinvertebrate sample (45%) at this site. A total of 18 different taxa
were present including three families of mayflies and five families of caddisflies. These
organisms are considered sensitive to poor water and habitat quality. Stonefly taxa were not
found. The macroinvertebrate community score rated as -1 (acceptable tending towards poor) at
this location. The slightly lower score at this location is due to the absence of stoneflies, the low
proportion of caddisflies, and the dominance of one taxa (the mayfly Baetidae) (see Appendix 1).
Bennett Creek at M-66
Blackflies (Simuliidae) were the dominant taxa in this sample (35%) followed closely by
caddisflies (32%). Eighteen total taxa were found at this site including three families of
mayflies, three families of caddisflies, and two families of stoneflies. The macroinvertebrate
community score rated as 4 (acceptable tending towards excellent) for Bennett Creek.
Green River at Pinney Bridge Road
Although the Green River site was dominated by mayflies (43%), amphipods (scuds) represented
a significant proportion of the organisms found (29%). A total of 15 different taxa were found in
the Green River including three families of mayflies, four families of caddisflies, and four
families of stoneflies. The Green River community score for this location rated as 1 (acceptable
tending towards excellent).
Final Report Jordan River Bioassessment Study January 10, 2017
8
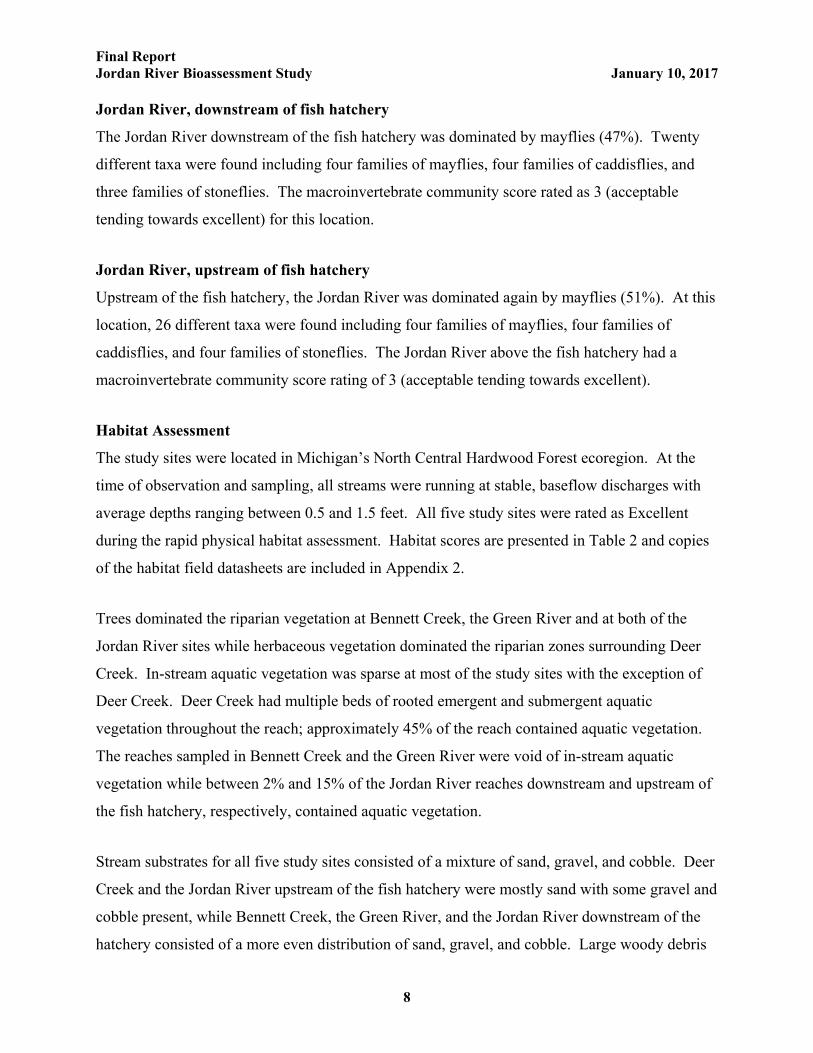
Jordan River, downstream of fish hatchery
The Jordan River downstream of the fish hatchery was dominated by mayflies (47%). Twenty
different taxa were found including four families of mayflies, four families of caddisflies, and
three families of stoneflies. The macroinvertebrate community score rated as 3 (acceptable
tending towards excellent) for this location.
Jordan River, upstream of fish hatchery
Upstream of the fish hatchery, the Jordan River was dominated again by mayflies (51%). At this
location, 26 different taxa were found including four families of mayflies, four families of
caddisflies, and four families of stoneflies. The Jordan River above the fish hatchery had a
macroinvertebrate community score rating of 3 (acceptable tending towards excellent).
Habitat Assessment
The study sites were located in Michigan’s North Central Hardwood Forest ecoregion. At the
time of observation and sampling, all streams were running at stable, baseflow discharges with
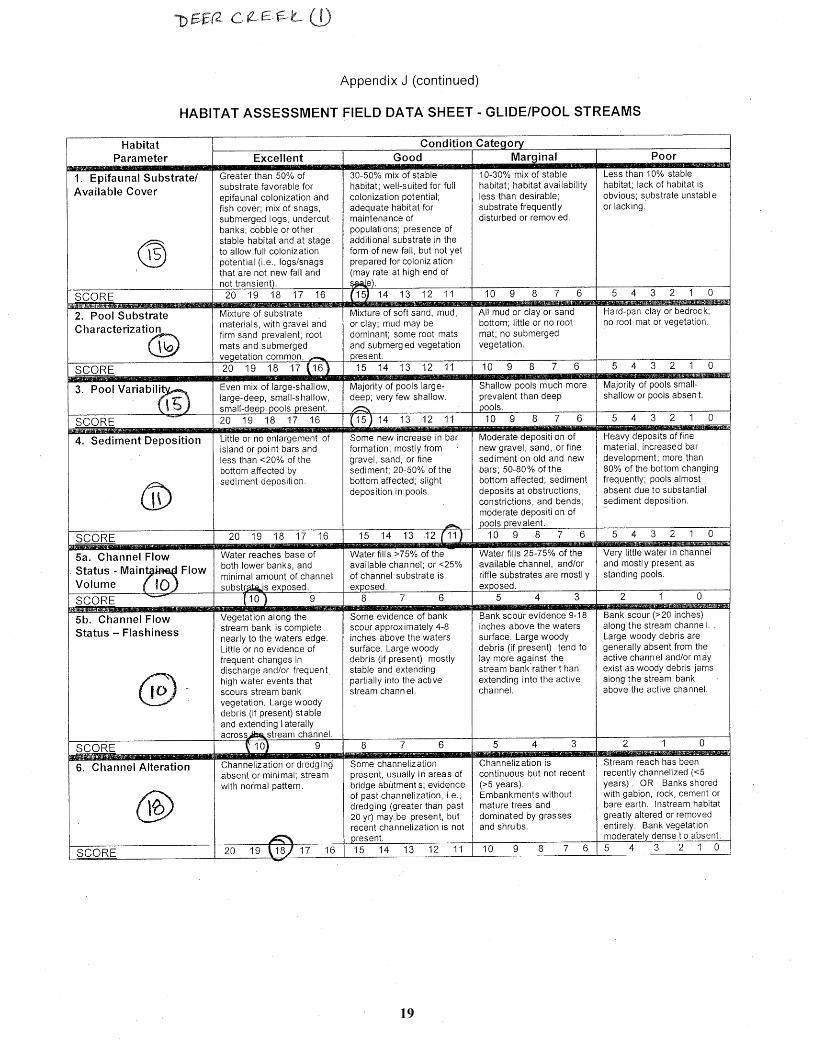
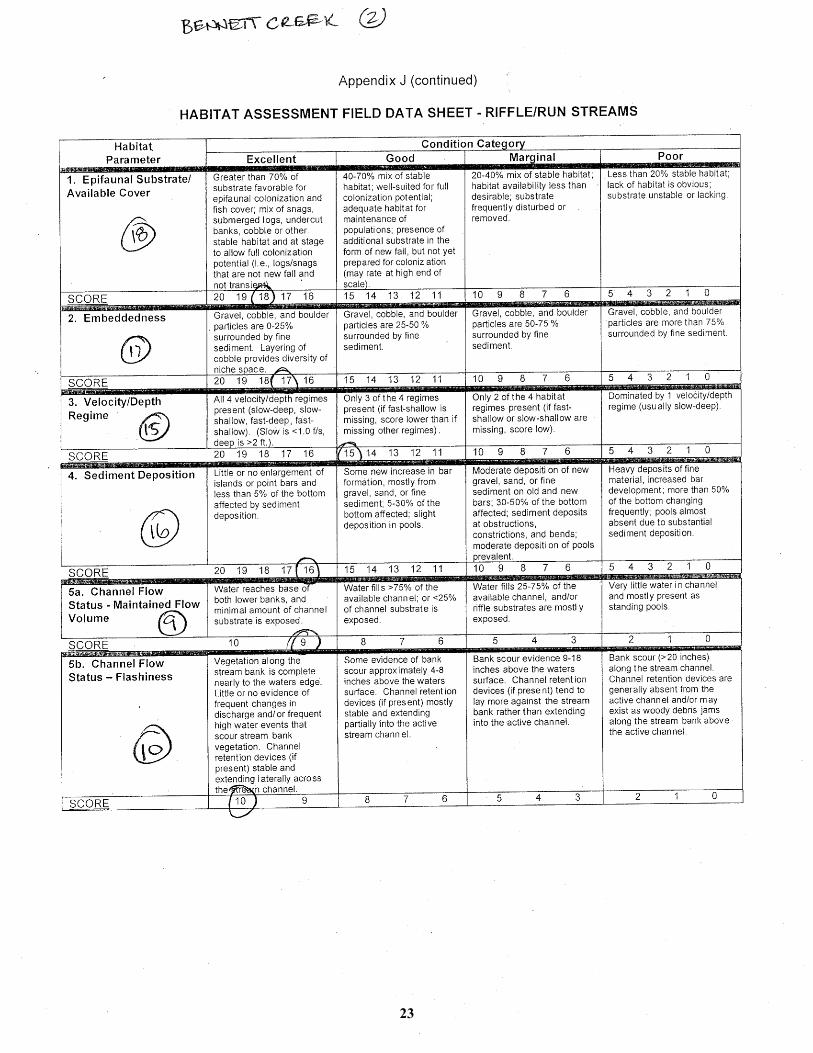
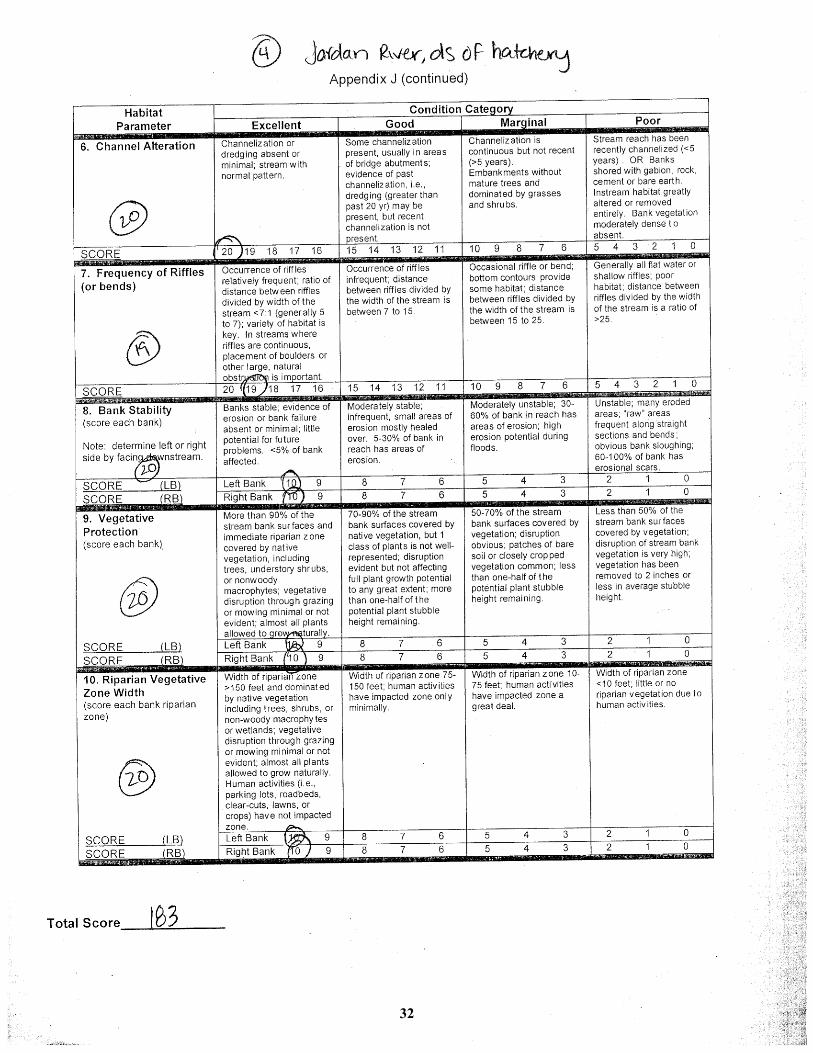
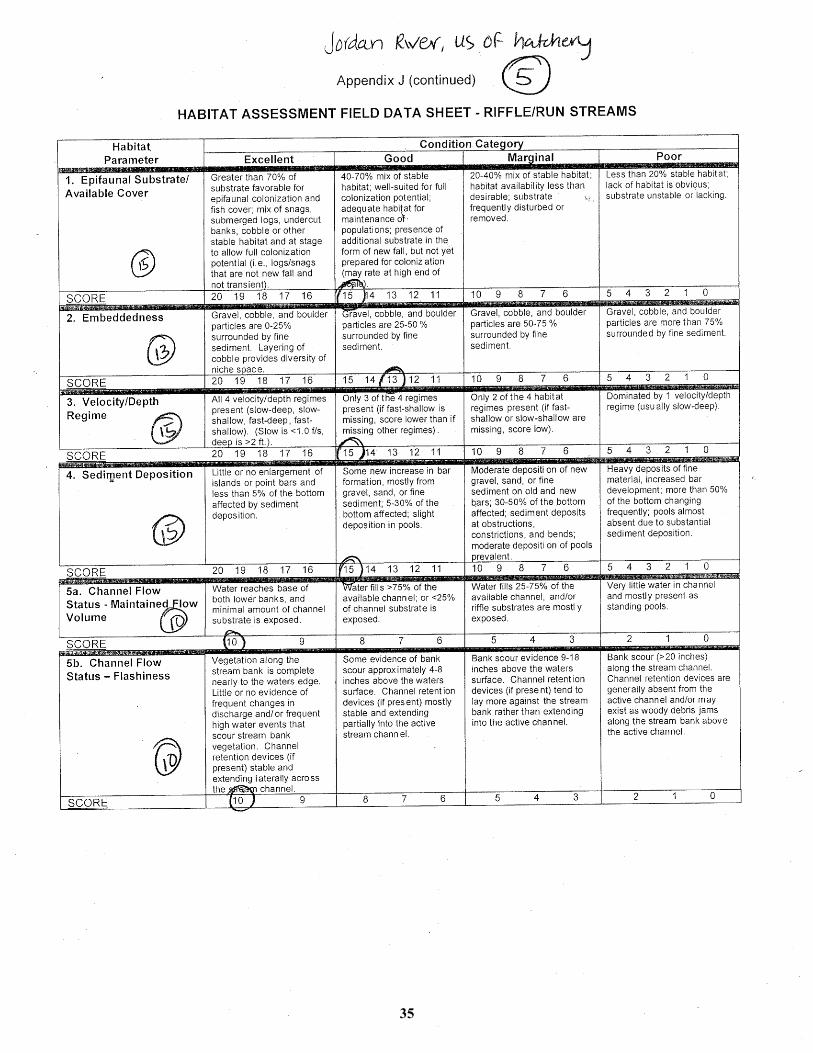
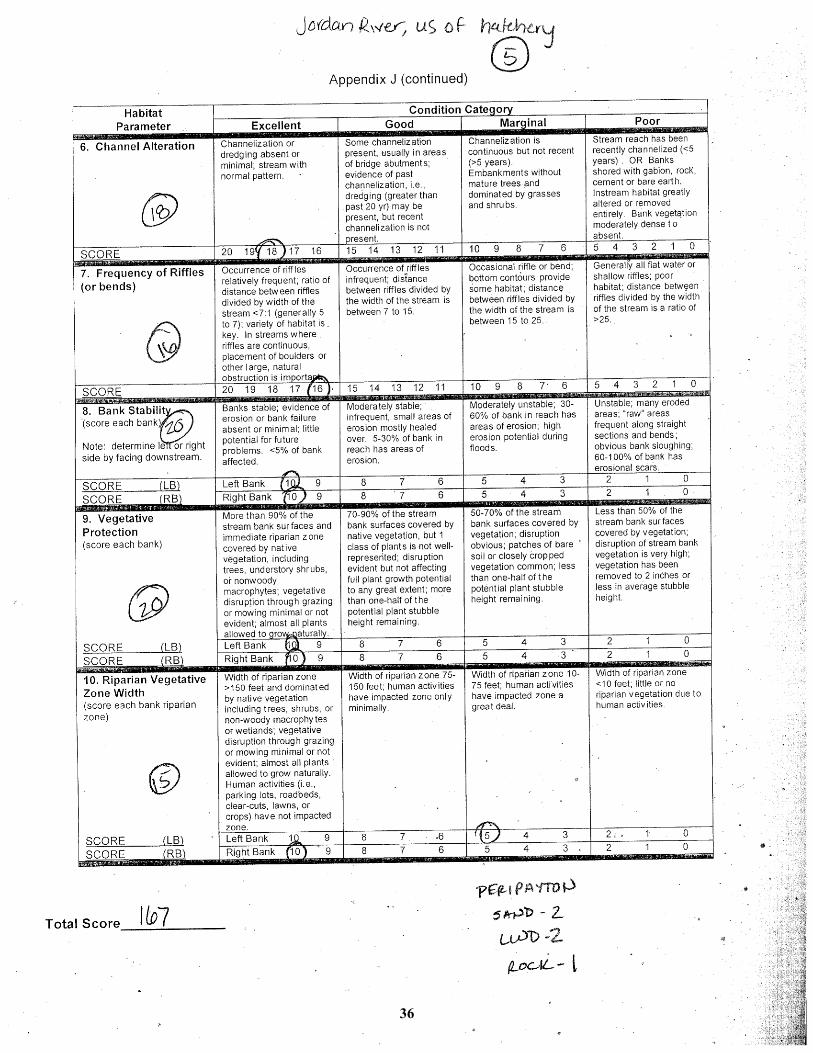
average depths ranging between 0.5 and 1.5 feet. All five study sites were rated as Excellent
during the rapid physical habitat assessment. Habitat scores are presented in Table 2 and copies
of the habitat field datasheets are included in Appendix 2.
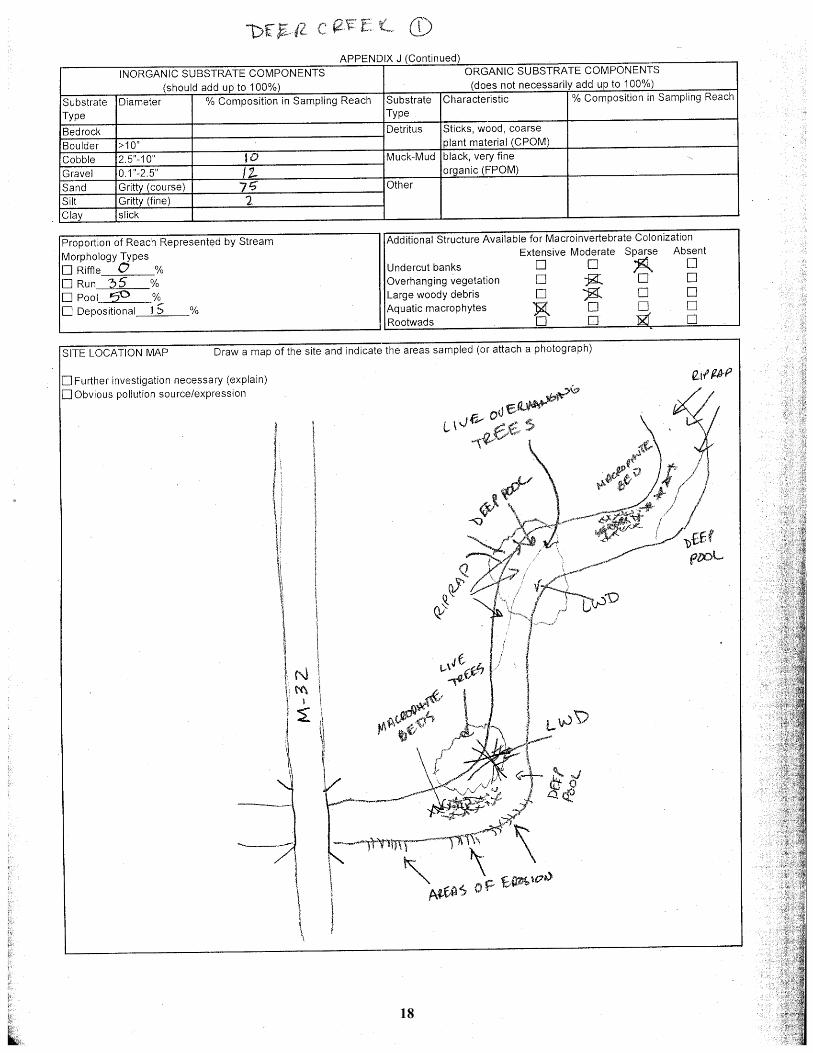
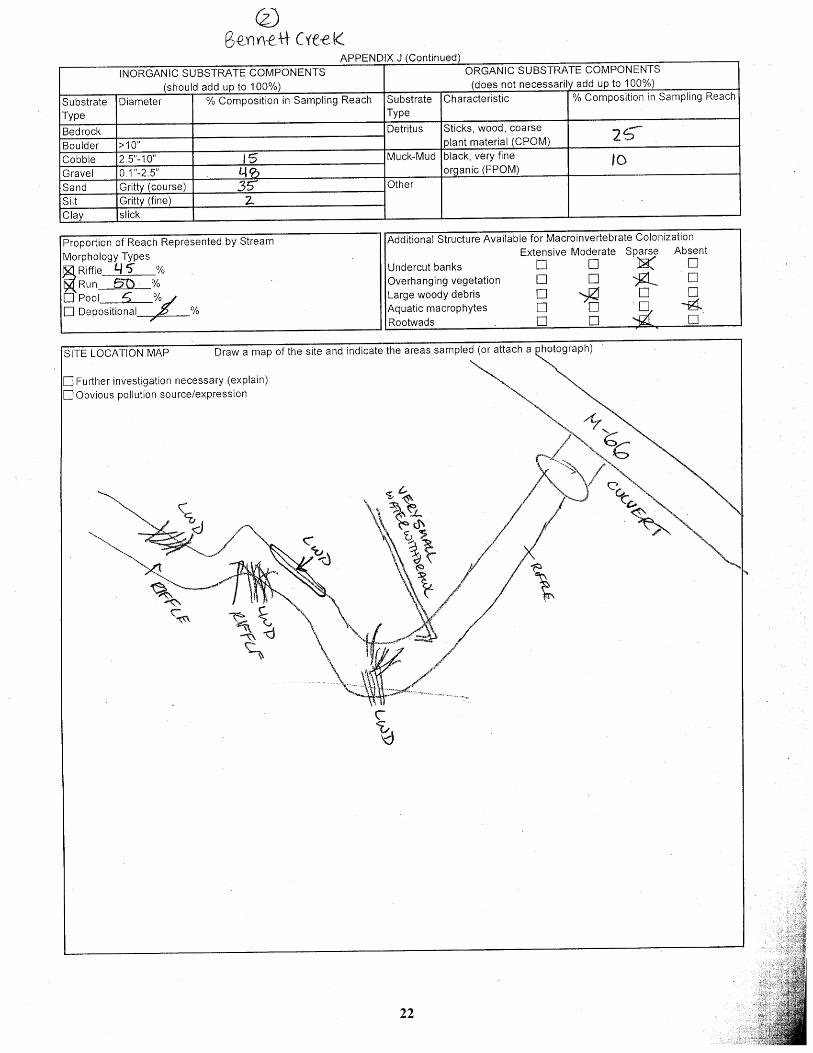
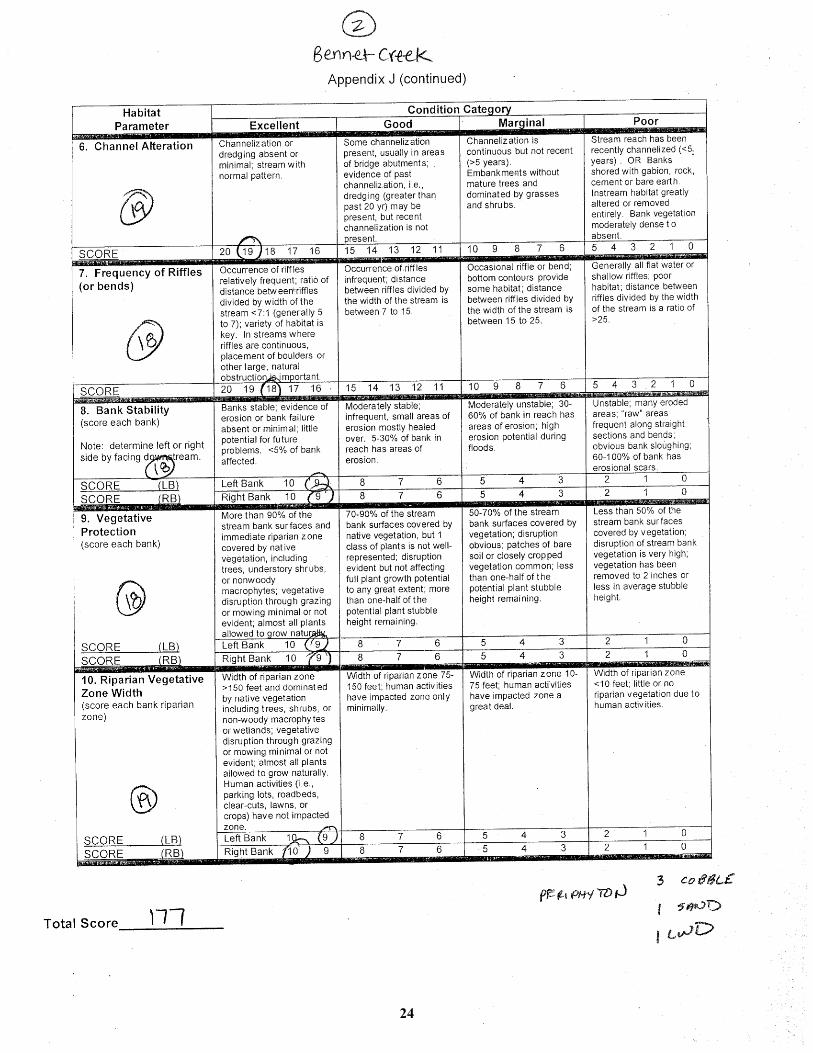
Trees dominated the riparian vegetation at Bennett Creek, the Green River and at both of the
Jordan River sites while herbaceous vegetation dominated the riparian zones surrounding Deer
Creek. In-stream aquatic vegetation was sparse at most of the study sites with the exception of
Deer Creek. Deer Creek had multiple beds of rooted emergent and submergent aquatic
vegetation throughout the reach; approximately 45% of the reach contained aquatic vegetation.
The reaches sampled in Bennett Creek and the Green River were void of in-stream aquatic
vegetation while between 2% and 15% of the Jordan River reaches downstream and upstream of
the fish hatchery, respectively, contained aquatic vegetation.
Stream substrates for all five study sites consisted of a mixture of sand, gravel, and cobble. Deer
Creek and the Jordan River upstream of the fish hatchery were mostly sand with some gravel and
cobble present, while Bennett Creek, the Green River, and the Jordan River downstream of the
hatchery consisted of a more even distribution of sand, gravel, and cobble. Large woody debris
Final Report Jordan River Bioassessment Study January 10, 2017
9
was present in moderate amounts at Deer Creek, Bennett Creek, and the Green River and in
extensive amounts in both of the Jordan River sites. Undercut banks and overhanging vegetation
were present in moderate to sparse amounts at all sites.
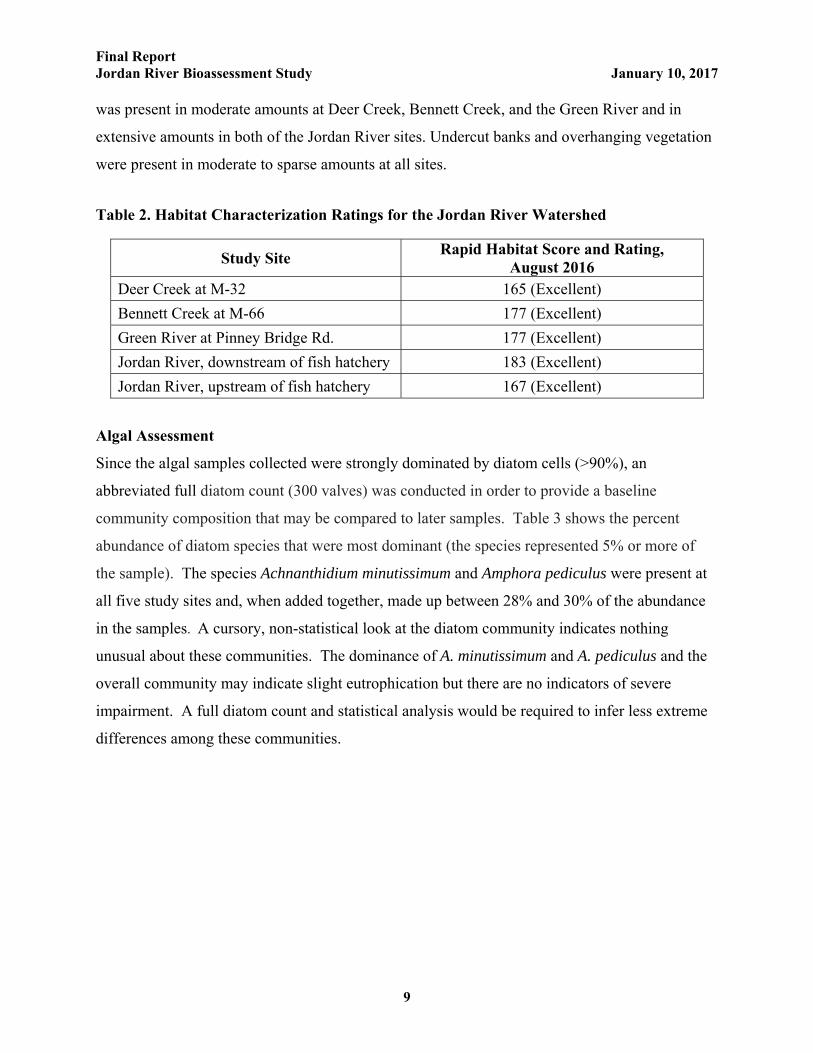
Table 2. Habitat Characterization Ratings for the Jordan River Watershed
Study Site Rapid Habitat Score and Rating,
August 2016 Deer Creek at M-32 165 (Excellent)
Bennett Creek at M-66 177 (Excellent)
Green River at Pinney Bridge Rd. 177 (Excellent)
Jordan River, downstream of fish hatchery 183 (Excellent)
Jordan River, upstream of fish hatchery 167 (Excellent)
Algal Assessment
Since the algal samples collected were strongly dominated by diatom cells (>90%), an
abbreviated full diatom count (300 valves) was conducted in order to provide a baseline
community composition that may be compared to later samples. Table 3 shows the percent
abundance of diatom species that were most dominant (the species represented 5% or more of
the sample). The species Achnanthidium minutissimum and Amphora pediculus were present at
all five study sites and, when added together, made up between 28% and 30% of the abundance
in the samples. A cursory, non-statistical look at the diatom community indicates nothing
unusual about these communities. The dominance of A. minutissimum and A. pediculus and the
overall community may indicate slight eutrophication but there are no indicators of severe
impairment. A full diatom count and statistical analysis would be required to infer less extreme
differences among these communities.
Final Report Jordan River Bioassessment Study January 10, 2017
10
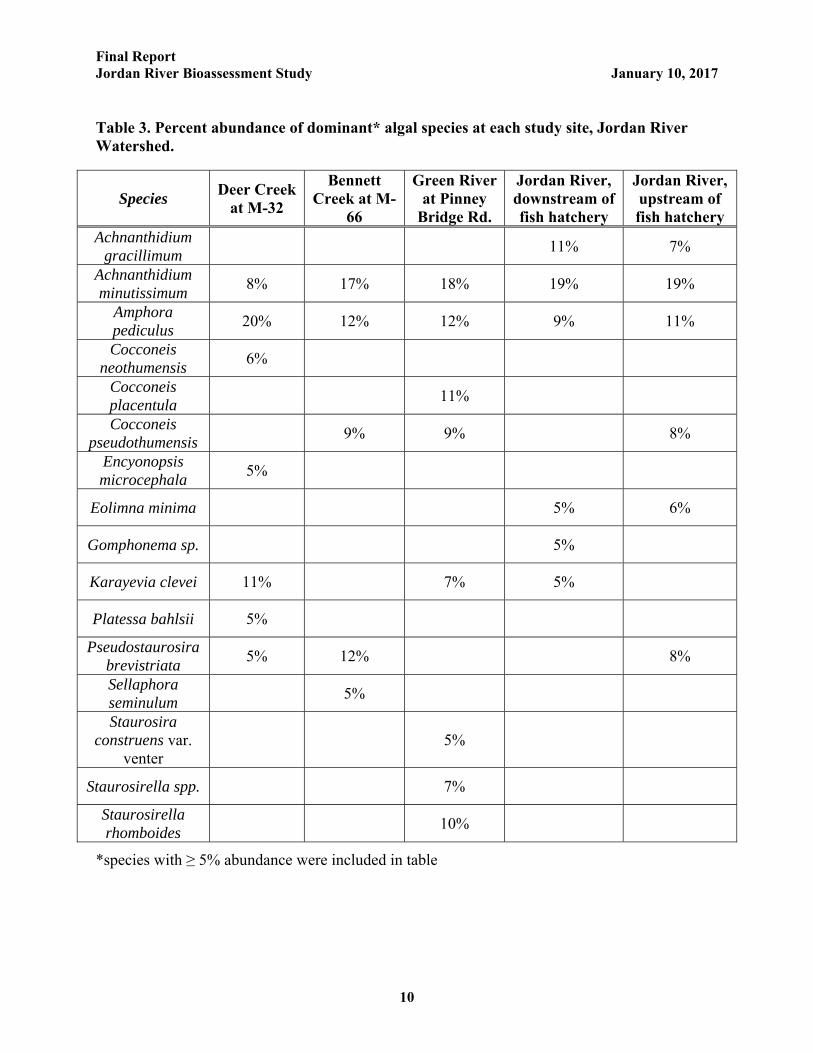
Table 3. Percent abundance of dominant* algal species at each study site, Jordan River Watershed.
Species Deer Creek at M-32
Bennett Creek at M-
66
Green River at Pinney
Bridge Rd.
Jordan River, downstream of fish hatchery
Jordan River, upstream of fish hatchery
Achnanthidium gracillimum 11% 7%
Achnanthidium minutissimum 8% 17% 18% 19% 19%
Amphora pediculus 20% 12% 12% 9% 11%
Cocconeis neothumensis 6%
Cocconeis placentula 11%
Cocconeis pseudothumensis 9% 9% 8%
Encyonopsis microcephala 5%
Eolimna minima 5% 6%
Gomphonema sp. 5%
Karayevia clevei 11% 7% 5%
Platessa bahlsii 5%
Pseudostaurosira brevistriata 5% 12% 8%
Sellaphora seminulum 5%
Staurosira construens var.
venter 5%
Staurosirella spp. 7%
Staurosirella rhomboides 10%
*species with ≥ 5% abundance were included in table
Final Report Jordan River Bioassessment Study January 10, 2017
11
CONCLUSIONS
GLEC staff completed a macroinvertebrate, habitat, and algal assessment for five study sites in
the Jordan River Watershed: Deer Creek, Bennett Creek, the Green River, and the Jordan River
downstream and upstream of the fish hatchery. Sample collections, and the scoring and
interpretation of data, followed MDEQ Procedure 51, which describes qualitative biological and
habitat survey protocols for wadeable streams. Summaries of the assessments and Procedure 51
results are presented in Tables 1-3.
All five study sites rated as Acceptable when assessing the macroinvertebrate community and
Excellent when assessing the habitat. Deer Creek scored slightly lower during the
macroinvertebrate assessment than the other four sites most likely due to the absence of
stoneflies at this location and the dominance of one taxa (the mayfly Baetidae). The high
percentage of sandy substrate and low percentage of coarser substrates such as gravel and cobble
would inhibit the colonization of stoneflies. Bennett Creek, the Green River and the Jordan
River consisted of a mix of sand, gravel, and cobble, and as a result supported multiple families
of mayflies, stoneflies, and caddisflies at each site. The algal community assessment identified
two species present in high proportions at all sites as well as multiple other species contributing
to the unique community composition at each site.
REFERENCES
Michigan Department of Natural Resources (MDEQ). 2008. Qualitative Biological and Habitat
Survey Protocols for Wadeable Streams and Rivers (Procedure 51). Great Lakes and
Environmental Assessment Section, Revised December 2008. Michigan Department of Natural
Resources. Lansing, Michigan.

Friends of the Jordan River Watershed Jordan River Bioassessment Study January 10, 2017
12
APPENDIX 1
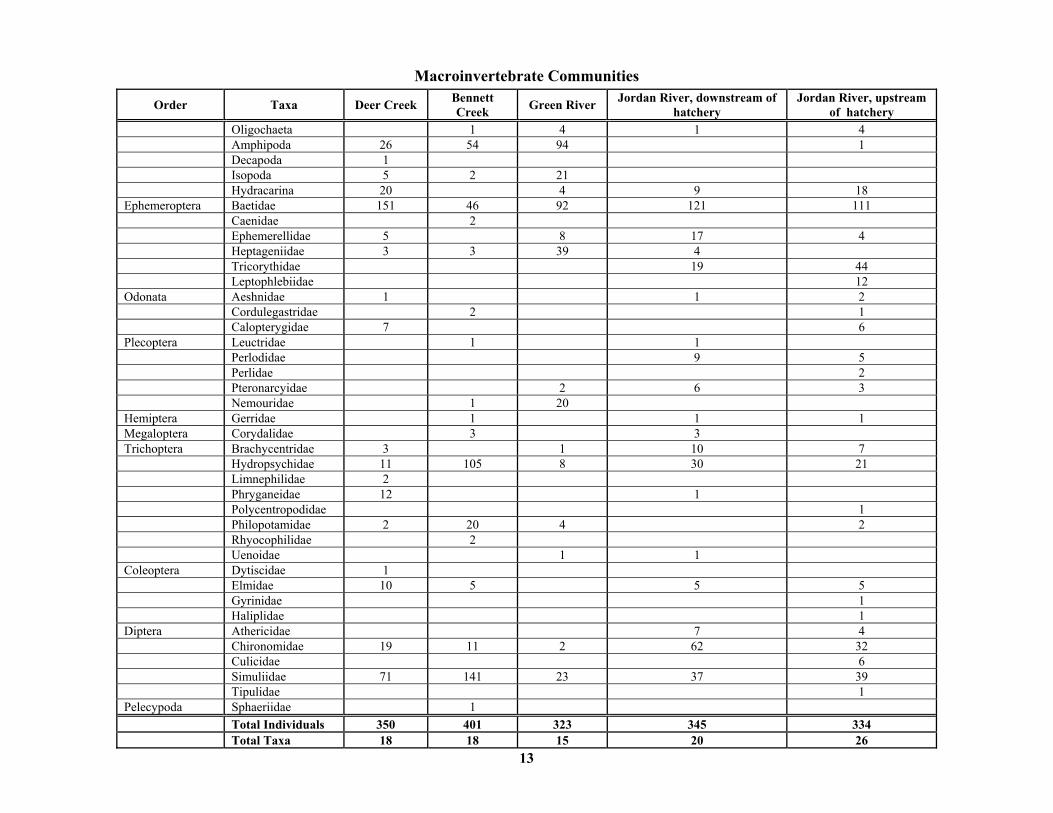
Macroinvertebrate Communities
13
Macroinvertebrate Communities
Order Taxa Deer Creek Bennett Creek
Green River Jordan River, downstream of
hatchery Jordan River, upstream
of hatchery Oligochaeta 1 4 1 4 Amphipoda 26 54 94 1 Decapoda 1 Isopoda 5 2 21 Hydracarina 20 4 9 18 Ephemeroptera Baetidae 151 46 92 121 111 Caenidae 2 Ephemerellidae 5 8 17 4 Heptageniidae 3 3 39 4 Tricorythidae 19 44 Leptophlebiidae 12 Odonata Aeshnidae 1 1 2 Cordulegastridae 2 1 Calopterygidae 7 6 Plecoptera Leuctridae 1 1 Perlodidae 9 5 Perlidae 2 Pteronarcyidae 2 6 3 Nemouridae 1 20 Hemiptera Gerridae 1 1 1 Megaloptera Corydalidae 3 3 Trichoptera Brachycentridae 3 1 10 7 Hydropsychidae 11 105 8 30 21 Limnephilidae 2 Phryganeidae 12 1 Polycentropodidae 1 Philopotamidae 2 20 4 2 Rhyocophilidae 2 Uenoidae 1 1 Coleoptera Dytiscidae 1 Elmidae 10 5 5 5 Gyrinidae 1 Haliplidae 1 Diptera Athericidae 7 4 Chironomidae 19 11 2 62 32 Culicidae 6 Simuliidae 71 141 23 37 39 Tipulidae 1 Pelecypoda Sphaeriidae 1
Total Individuals 350 401 323 345 334 Total Taxa 18 18 15 20 26
14
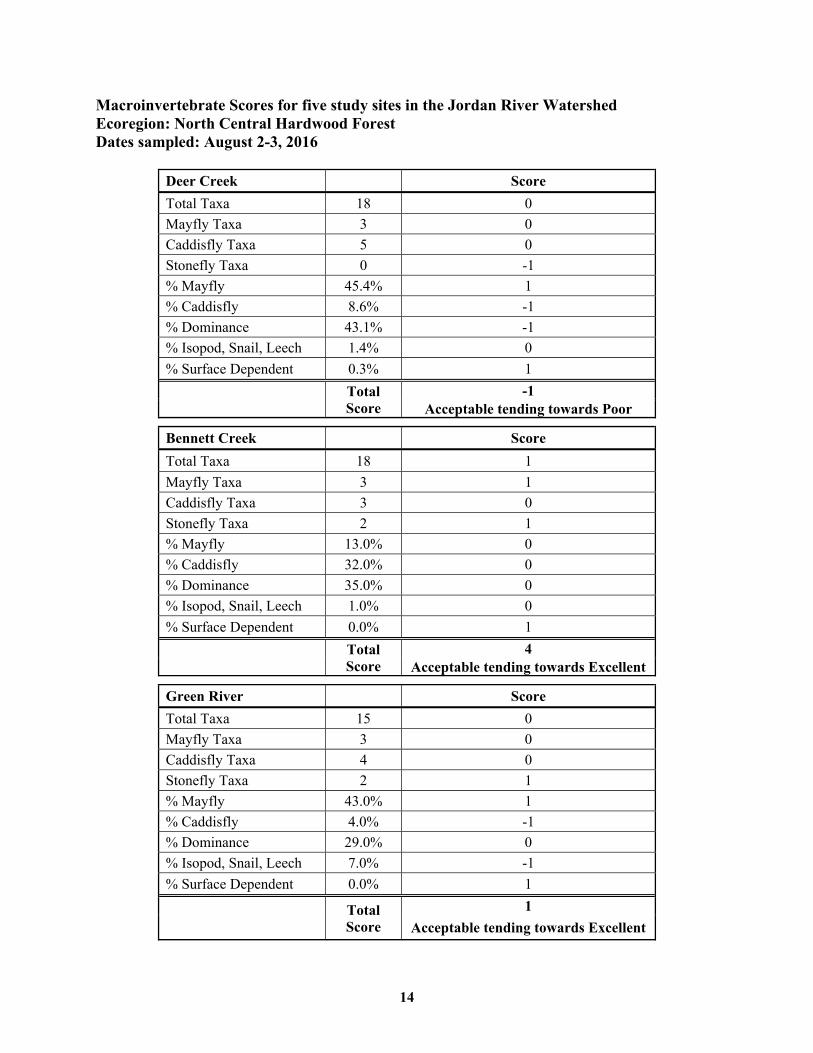
Macroinvertebrate Scores for five study sites in the Jordan River Watershed Ecoregion: North Central Hardwood Forest Dates sampled: August 2-3, 2016
Deer Creek Score
Total Taxa 18 0
Mayfly Taxa 3 0
Caddisfly Taxa 5 0
Stonefly Taxa 0 -1
% Mayfly 45.4% 1
% Caddisfly 8.6% -1
% Dominance 43.1% -1
% Isopod, Snail, Leech 1.4% 0
% Surface Dependent 0.3% 1
Total Score
-1 Acceptable tending towards Poor
Bennett Creek Score
Total Taxa 18 1
Mayfly Taxa 3 1
Caddisfly Taxa 3 0
Stonefly Taxa 2 1
% Mayfly 13.0% 0
% Caddisfly 32.0% 0
% Dominance 35.0% 0
% Isopod, Snail, Leech 1.0% 0
% Surface Dependent 0.0% 1
Total Score
4 Acceptable tending towards Excellent
Green River Score
Total Taxa 15 0
Mayfly Taxa 3 0
Caddisfly Taxa 4 0
Stonefly Taxa 2 1
% Mayfly 43.0% 1
% Caddisfly 4.0% -1
% Dominance 29.0% 0
% Isopod, Snail, Leech 7.0% -1
% Surface Dependent 0.0% 1
Total Score
1
Acceptable tending towards Excellent
15
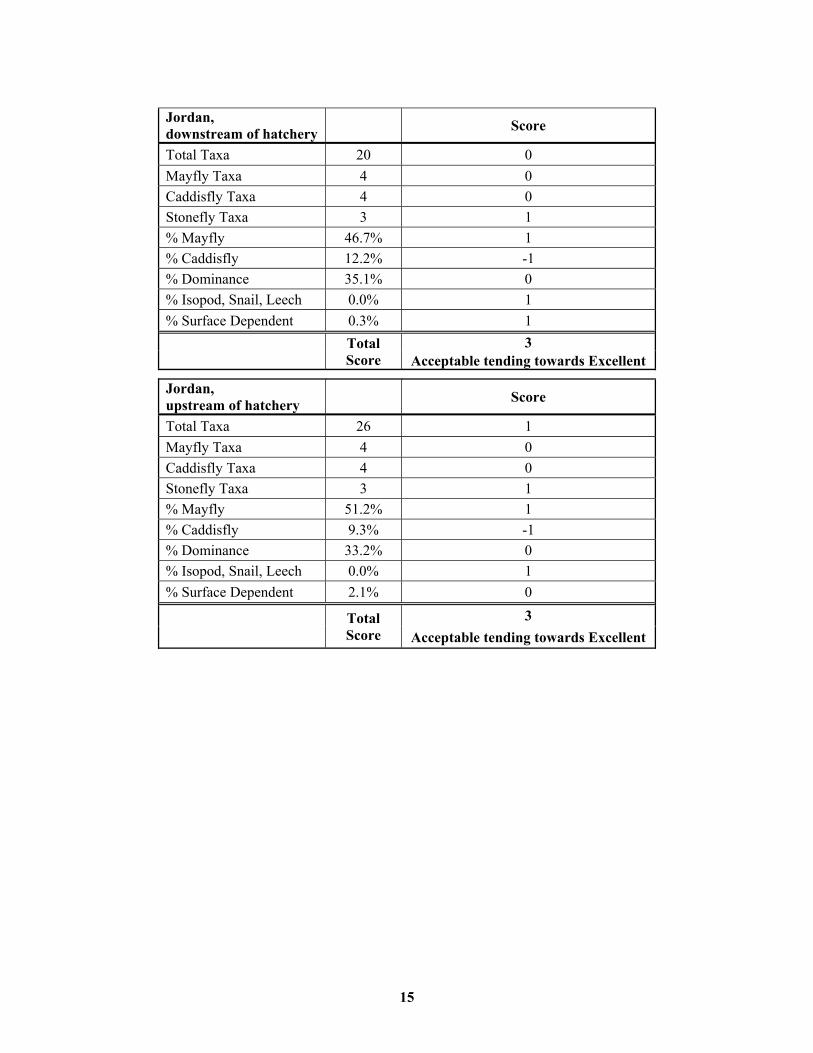
Jordan, downstream of hatchery
Score
Total Taxa 20 0
Mayfly Taxa 4 0
Caddisfly Taxa 4 0
Stonefly Taxa 3 1
% Mayfly 46.7% 1
% Caddisfly 12.2% -1
% Dominance 35.1% 0
% Isopod, Snail, Leech 0.0% 1
% Surface Dependent 0.3% 1
Total Score
3 Acceptable tending towards Excellent
Jordan, upstream of hatchery
Score
Total Taxa 26 1
Mayfly Taxa 4 0
Caddisfly Taxa 4 0
Stonefly Taxa 3 1
% Mayfly 51.2% 1
% Caddisfly 9.3% -1
% Dominance 33.2% 0
% Isopod, Snail, Leech 0.0% 1
% Surface Dependent 2.1% 0
Total Score
3
Acceptable tending towards Excellent

Friends of the Jordan River Watershed Jordan River Bioassessment Study January 10, 2017
16
APPENDIX 2
Habitat Evaluation
17
18
19
20
21
22
23
24
25
26
27
28
29
30
31
32
33
34
35
36