Embed Size (px)
DESCRIPTION
Winter Council Meeting 2015 Presentation
Citation preview
MAPC Winter Council Meeting Parker House Hotel
February 25, 2015
Karl Quackenbush Executive Director
Central Transportation Planning Staff
Tim Reardon Assistant Director of Data Services
Metropolitan Area Planning Council
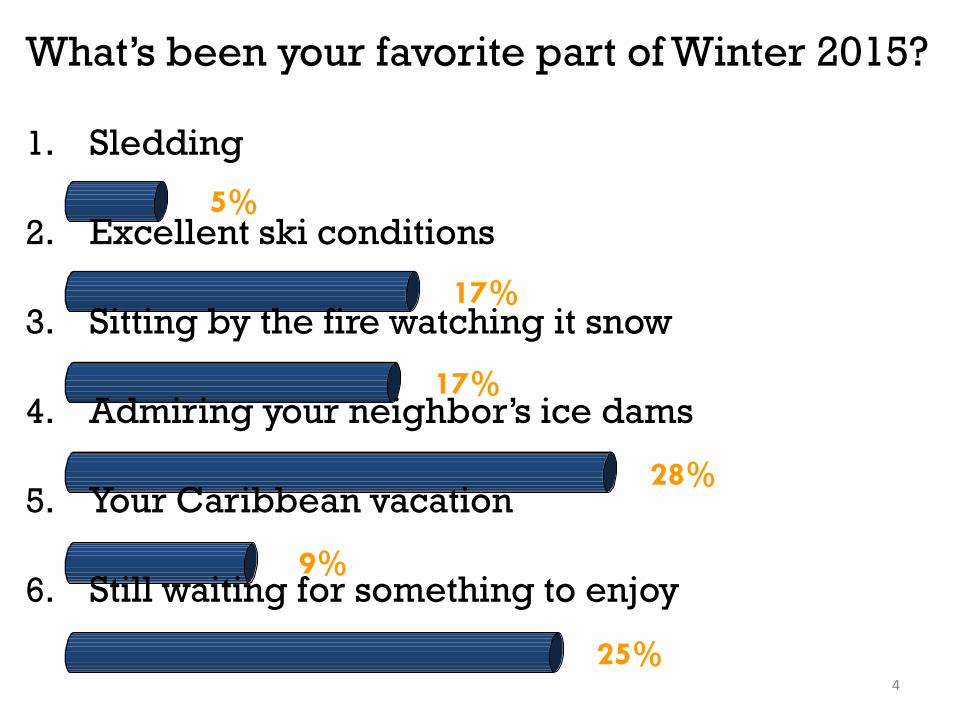
What’s been your favorite part of Winter 2015?
4
25%
9%
28%
17%
17%
5%
1. Sledding
2. Excellent ski conditions
3. Sitting by the fire watching it snow
4. Admiring your neighbor’s ice dams
5. Your Caribbean vacation
6. Still waiting for something to enjoy
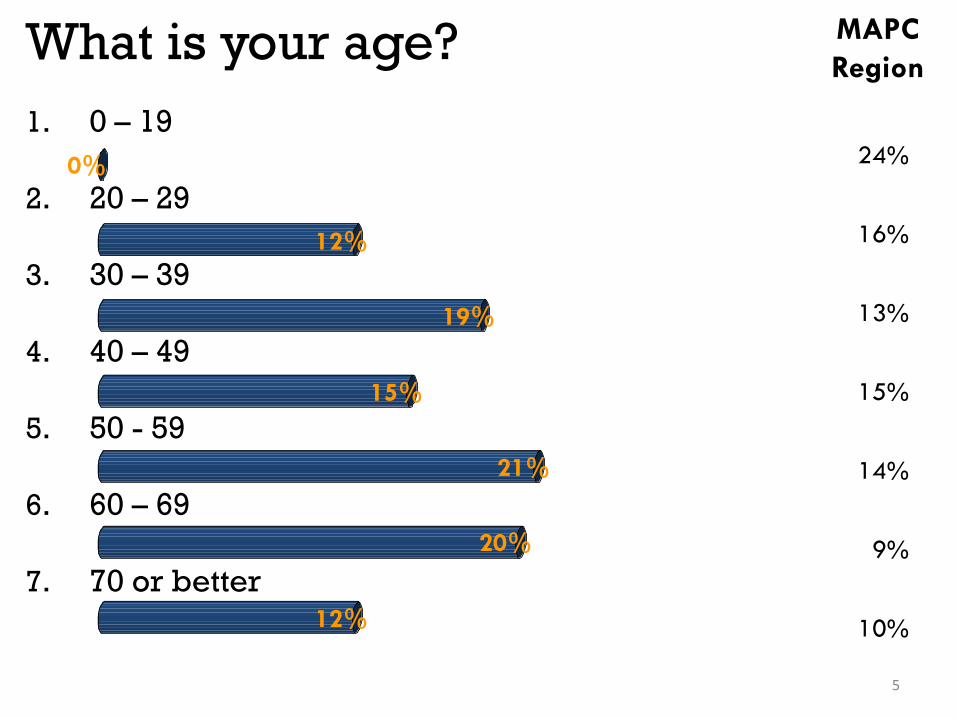
What is your age?
5
12%
20%
21%
15%
19%
12%
0%
1. 0 – 19
2. 20 – 29
3. 30 – 39
4. 40 – 49
5. 50 - 59
6. 60 – 69
7. 70 or better
MAPC
Region
24%
16%
13%
15%
14%
9%
10%
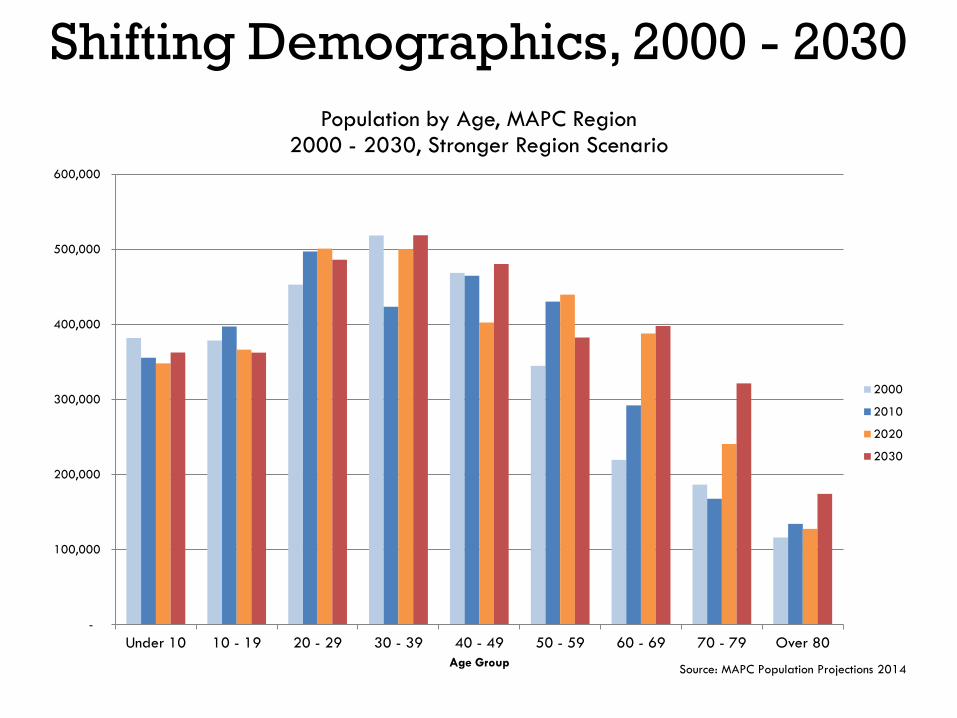
Shifting Demographics, 2000 - 2030
-
100,000
200,000
300,000
400,000
500,000
600,000
Under 10 10 - 19 20 - 29 30 - 39 40 - 49 50 - 59 60 - 69 70 - 79 Over 80
Age Group
Population by Age, MAPC Region 2000 - 2030, Stronger Region Scenario
2000
2010
2020
2030
Source: MAPC Population Projections 2014
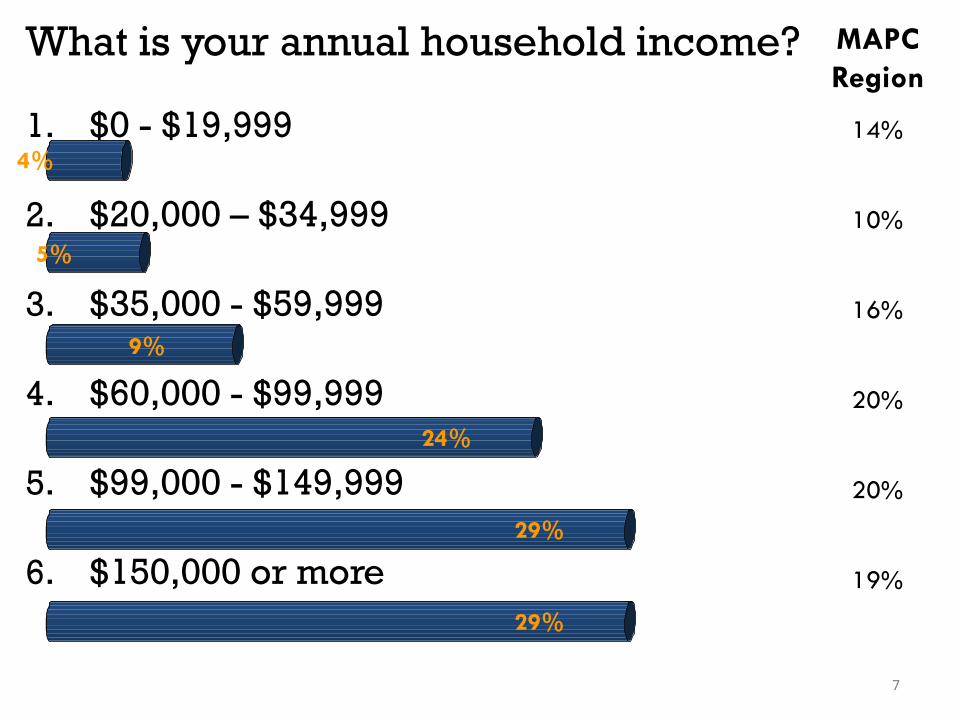
What is your annual household income?
7
29%
29%
24%
9%
5%
4%
14%
10%
16%
20%
20%
19%
MAPC
Region
1. $0 - $19,999
2. $20,000 – $34,999
3. $35,000 - $59,999
4. $60,000 - $99,999
5. $99,000 - $149,999
6. $150,000 or more
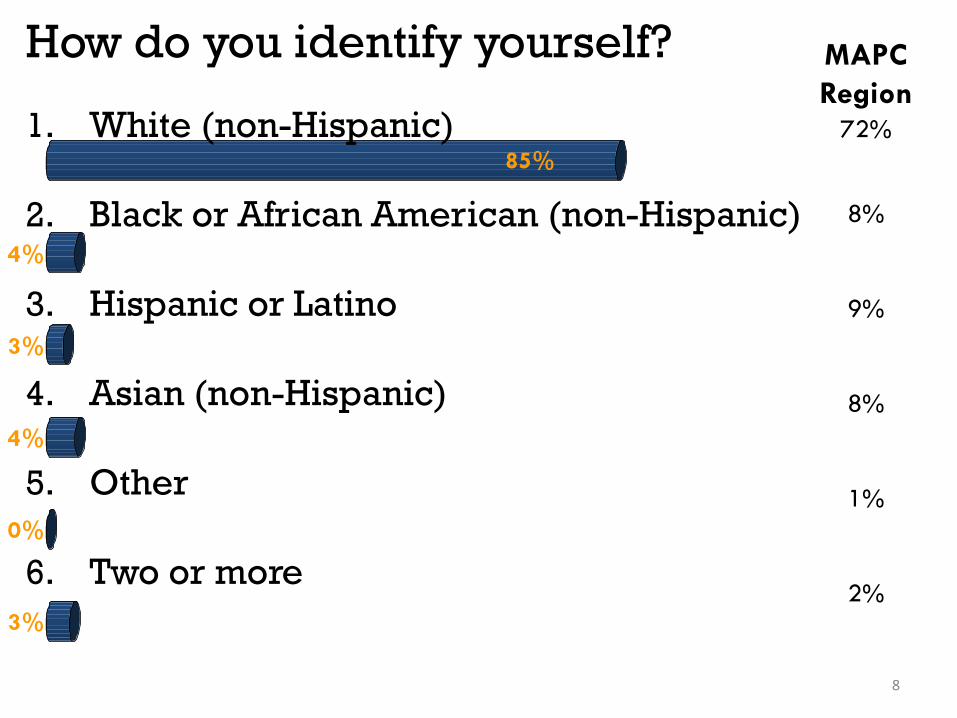
How do you identify yourself?
8
3%
0%
4%
3%
4%
85%
MAPC
Region 72%
8%
9%
8%
1%
2%
1. White (non-Hispanic)
2. Black or African American (non-Hispanic)
3. Hispanic or Latino
4. Asian (non-Hispanic)
5. Other
6. Two or more
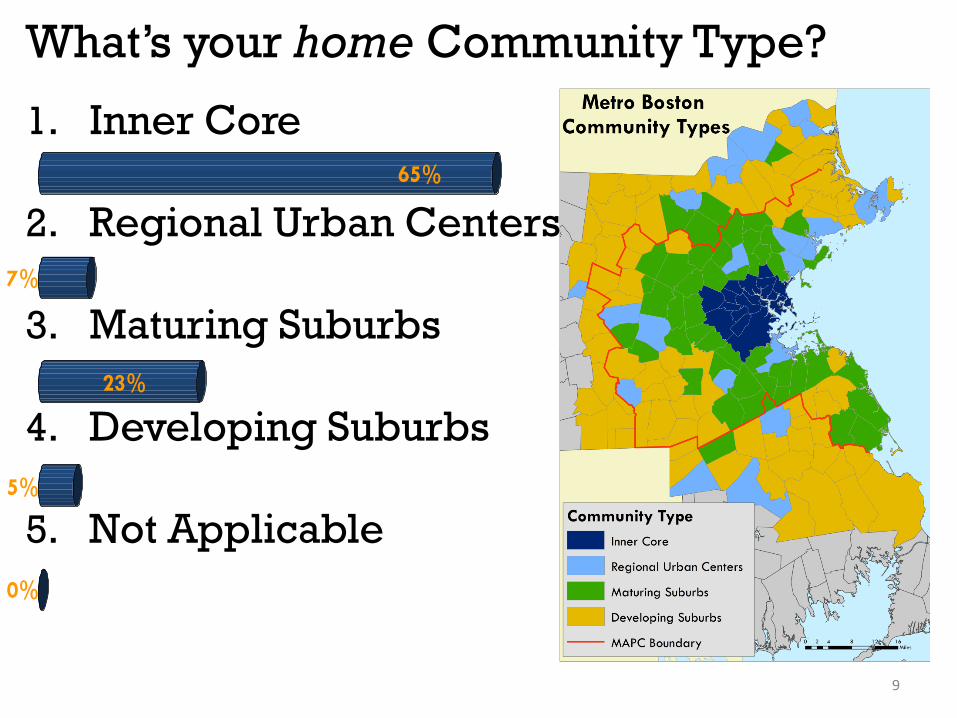
What’s your home Community Type?
9
0%
5%
23%
7%
65%
1. Inner Core
2. Regional Urban Centers
3. Maturing Suburbs
4. Developing Suburbs
5. Not Applicable
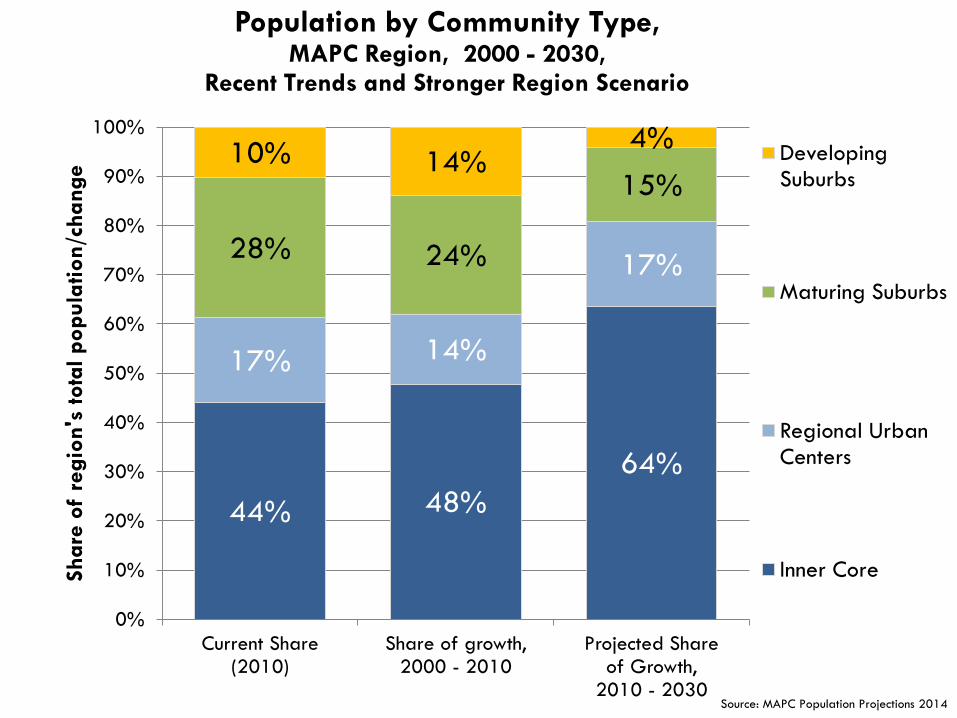
44% 48%
64%
17% 14%
17% 28% 24%
15% 10% 14%
4%
0%
10%
20%
30%
40%
50%
60%
70%
80%
90%
100%
Current Share (2010)
Share of growth, 2000 - 2010
Projected Share of Growth,
2010 - 2030
Share
of
regio
n's
tota
l po
pu
lation
/chan
ge
Population by Community Type, MAPC Region, 2000 - 2030,
Recent Trends and Stronger Region Scenario
Developing Suburbs
Maturing Suburbs
Regional Urban Centers
Inner Core
Source: MAPC Population Projections 2014
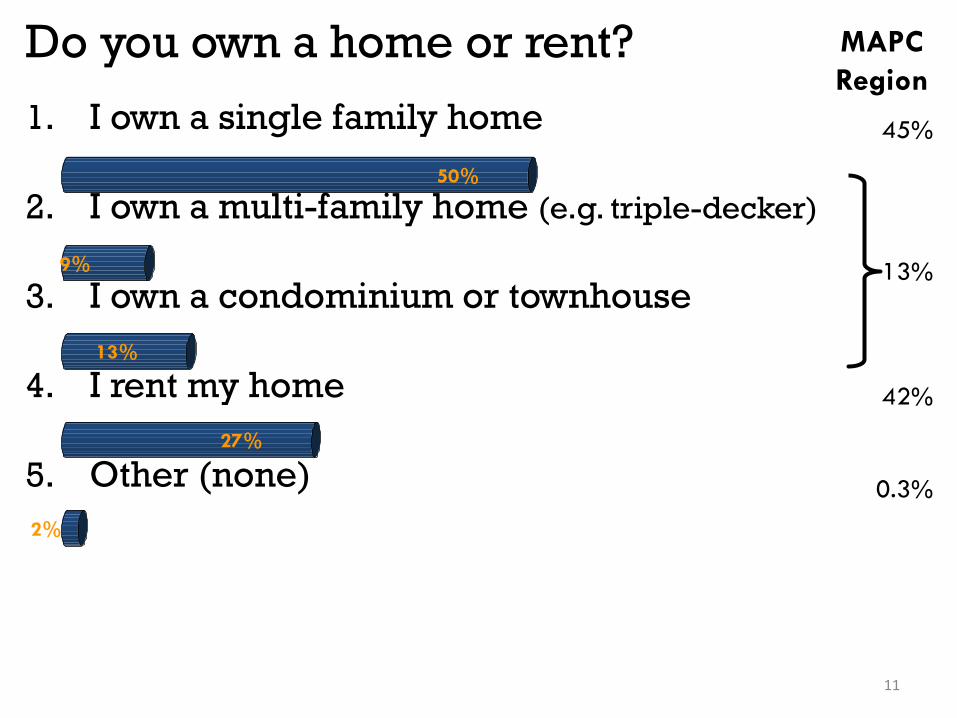
Do you own a home or rent?
11
2%
27%
13%
9%
50%
1. I own a single family home
2. I own a multi-family home (e.g. triple-decker)
3. I own a condominium or townhouse
4. I rent my home
5. Other (none)
45%
13%
42%
0.3%
MAPC
Region
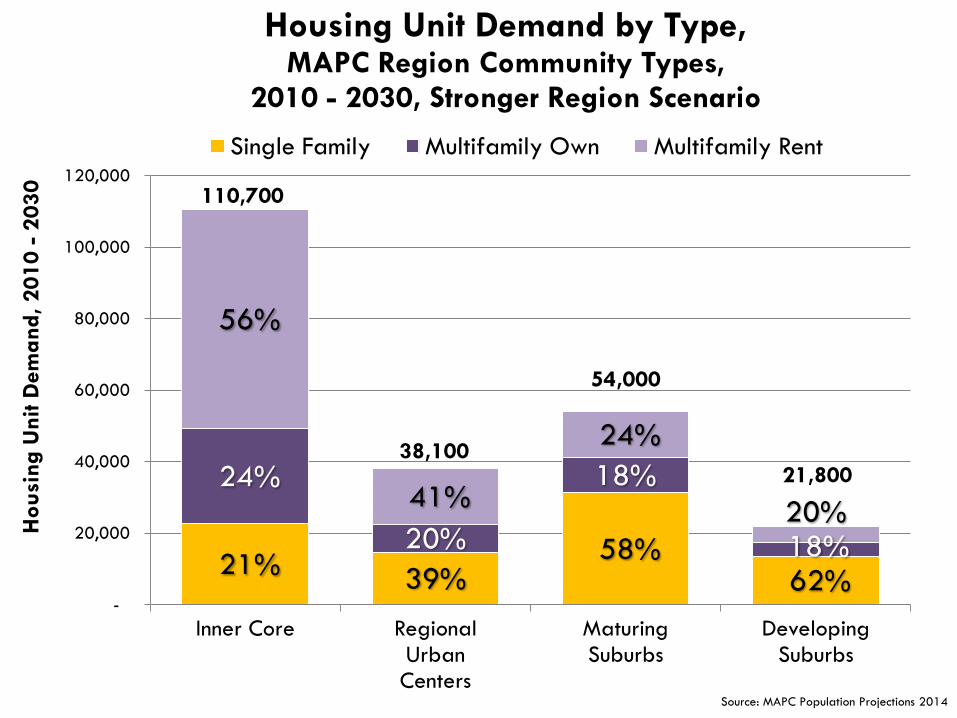
21% 39%
58% 62%
24%
20%
18%
18%
56%
41%
24%
20%
-
20,000
40,000
60,000
80,000
100,000
120,000
Inner Core Regional Urban Centers
Maturing Suburbs
Developing Suburbs
Housi
ng U
nit D
em
and
, 20
10
- 2
03
0
Housing Unit Demand by Type, MAPC Region Community Types,
2010 - 2030, Stronger Region Scenario
Single Family Multifamily Own Multifamily Rent
Source: MAPC Population Projections 2014
110,700
38,100
54,000
21,800
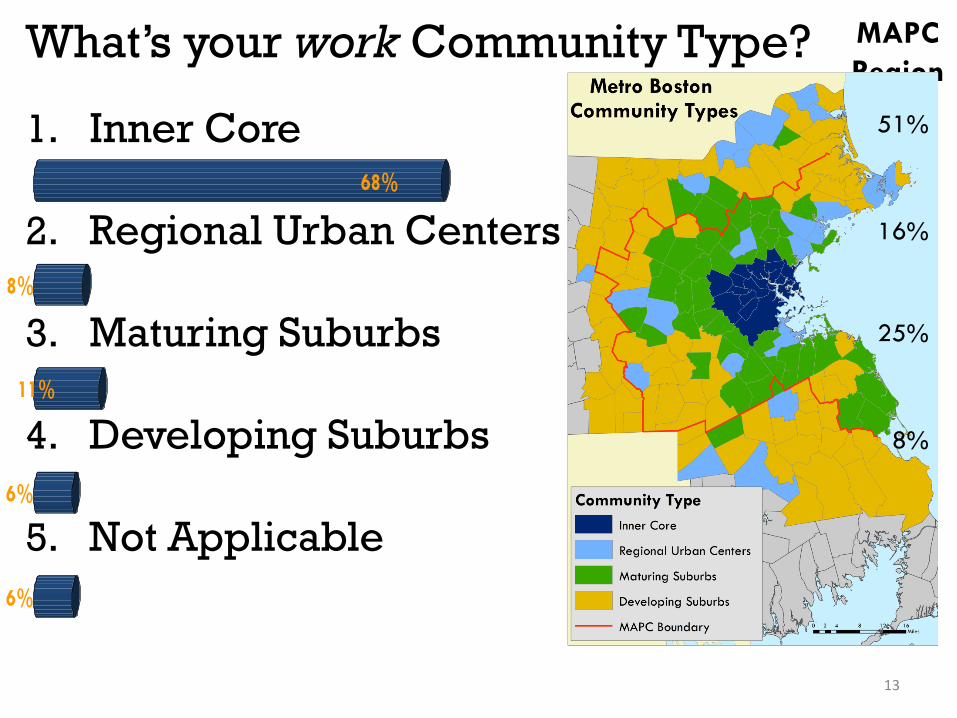
What’s your work Community Type?
13
6%
6%
11%
8%
68%
MAPC
Region
51%
16%
25%
8%
1. Inner Core
2. Regional Urban Centers
3. Maturing Suburbs
4. Developing Suburbs
5. Not Applicable
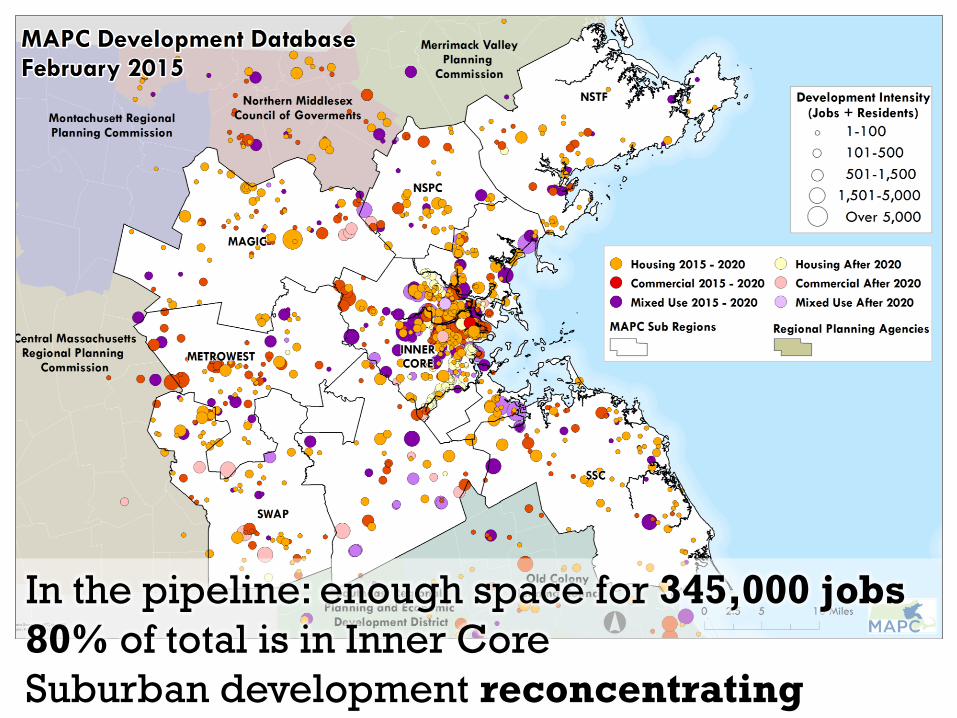
In the pipeline: enough space for 345,000 jobs
80% of total is in Inner Core
Suburban development reconcentrating
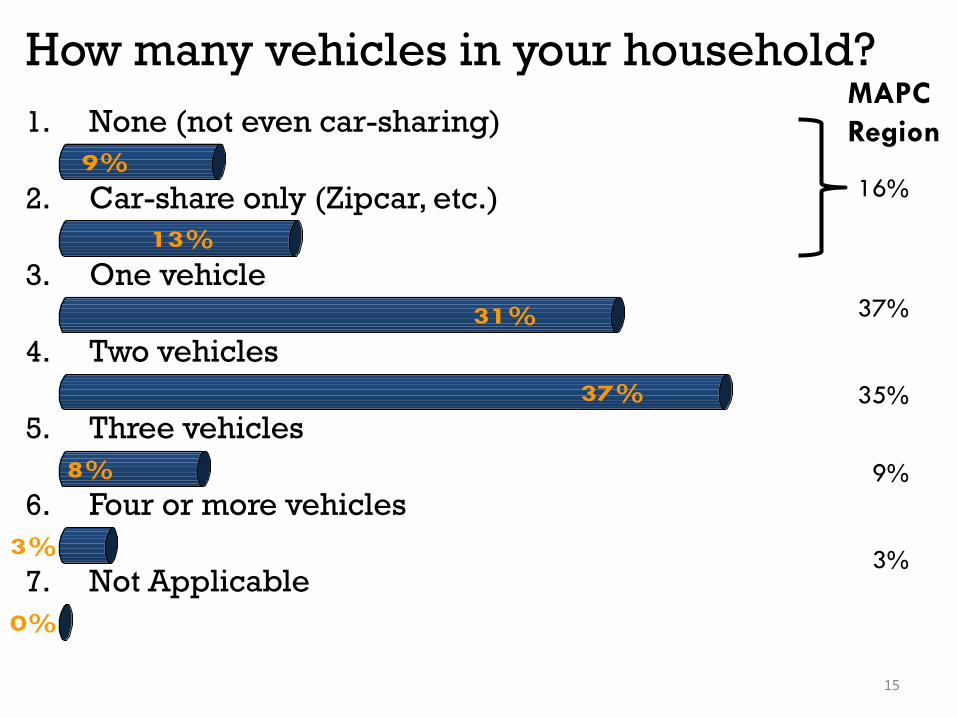
How many vehicles in your household?
15
0%
3%
8%
37%
31%
13%
9%
MAPC
Region
16%
37%
35%
9%
3%
1. None (not even car-sharing)
2. Car-share only (Zipcar, etc.)
3. One vehicle
4. Two vehicles
5. Three vehicles
6. Four or more vehicles
7. Not Applicable
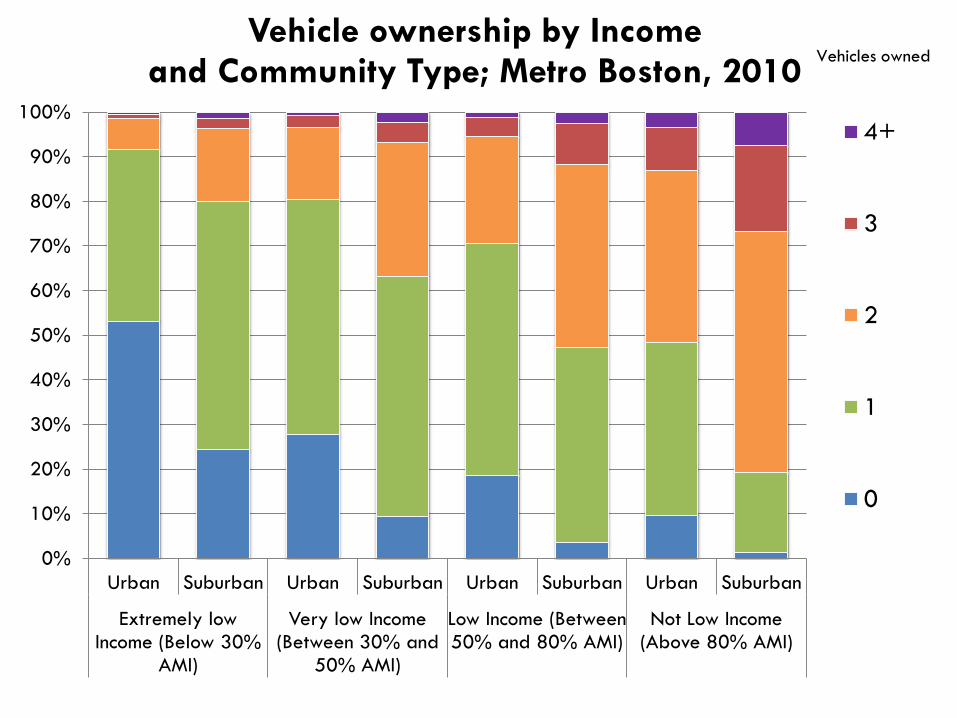
0%
10%
20%
30%
40%
50%
60%
70%
80%
90%
100%
Urban Suburban Urban Suburban Urban Suburban Urban Suburban
Extremely low Income (Below 30%
AMI)
Very low Income (Between 30% and
50% AMI)
Low Income (Between 50% and 80% AMI)
Not Low Income (Above 80% AMI)
Vehicle ownership by Income and Community Type; Metro Boston, 2010
4+
3
2
1
0
Vehicles owned
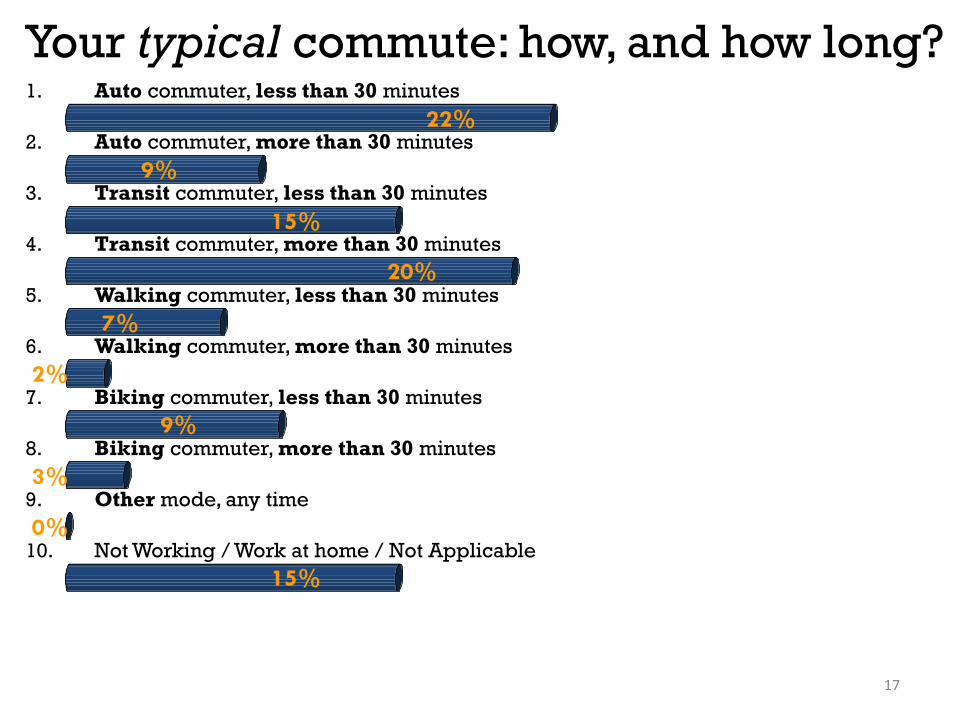
Your typical commute: how, and how long?
17
15%
0%
3%
9%
2%
7%
20%
15%
9%
22%
1. Auto commuter, less than 30 minutes
2. Auto commuter, more than 30 minutes
3. Transit commuter, less than 30 minutes
4. Transit commuter, more than 30 minutes
5. Walking commuter, less than 30 minutes
6. Walking commuter, more than 30 minutes
7. Biking commuter, less than 30 minutes
8. Biking commuter, more than 30 minutes
9. Other mode, any time
10. Not Working / Work at home / Not Applicable
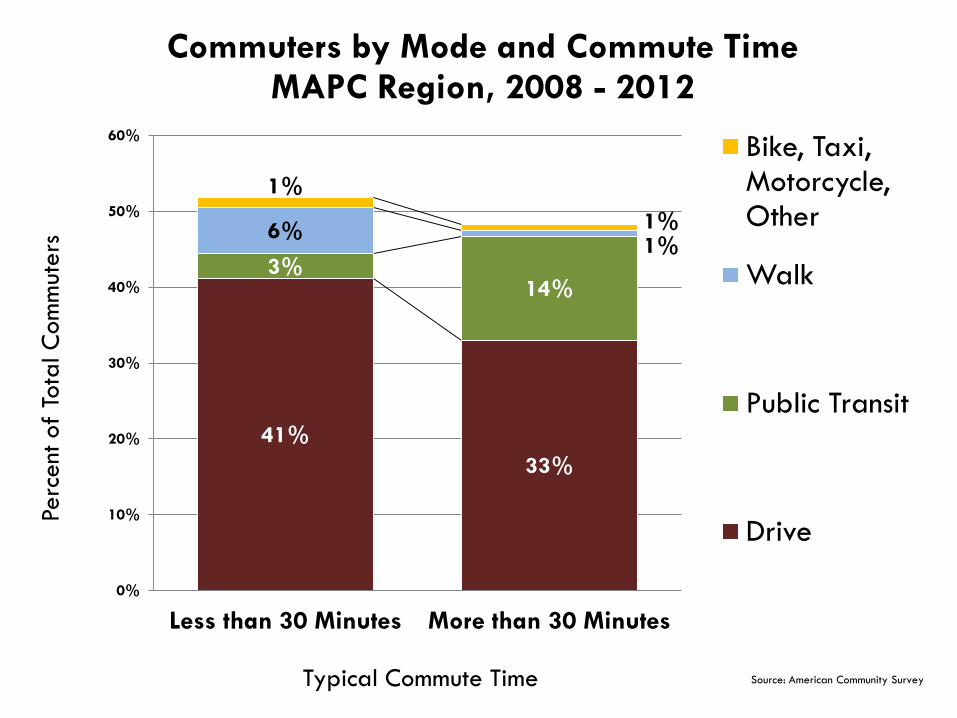
41%
33%
3% 14%
6% 1%
1%
1%
0%
10%
20%
30%
40%
50%
60%
Less than 30 Minutes More than 30 Minutes
Perc
ent
of
Tota
l C
om
mut
ers
Typical Commute Time
Commuters by Mode and Commute Time MAPC Region, 2008 - 2012
Bike, Taxi, Motorcycle, Other
Walk
Public Transit
Drive
Source: American Community Survey
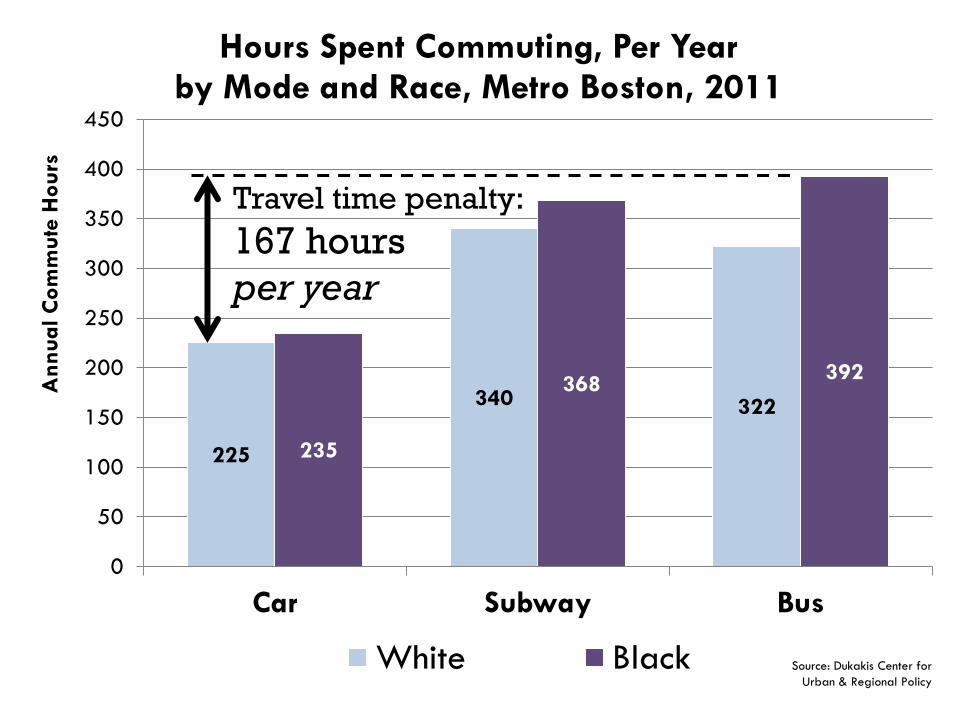
225
340 322
235
368 392
0
50
100
150
200
250
300
350
400
450
Car Subway Bus
Ann
ual C
om
mu
te H
ours
Hours Spent Commuting, Per Year
by Mode and Race, Metro Boston, 2011
White Black Source: Dukakis Center for
Urban & Regional Policy
Travel time penalty:
167 hours
per year
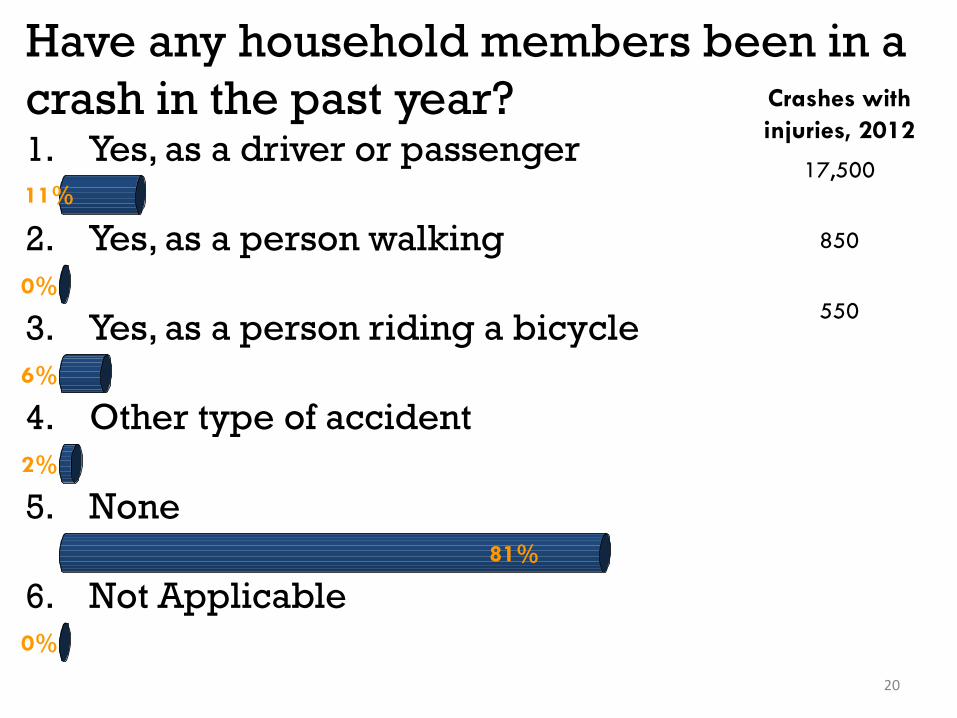
Have any household members been in a
crash in the past year?
20
0%
81%
2%
6%
0%
11%
Crashes with
injuries, 2012
17,500
850
550
1. Yes, as a driver or passenger
2. Yes, as a person walking
3. Yes, as a person riding a bicycle
4. Other type of accident
5. None
6. Not Applicable
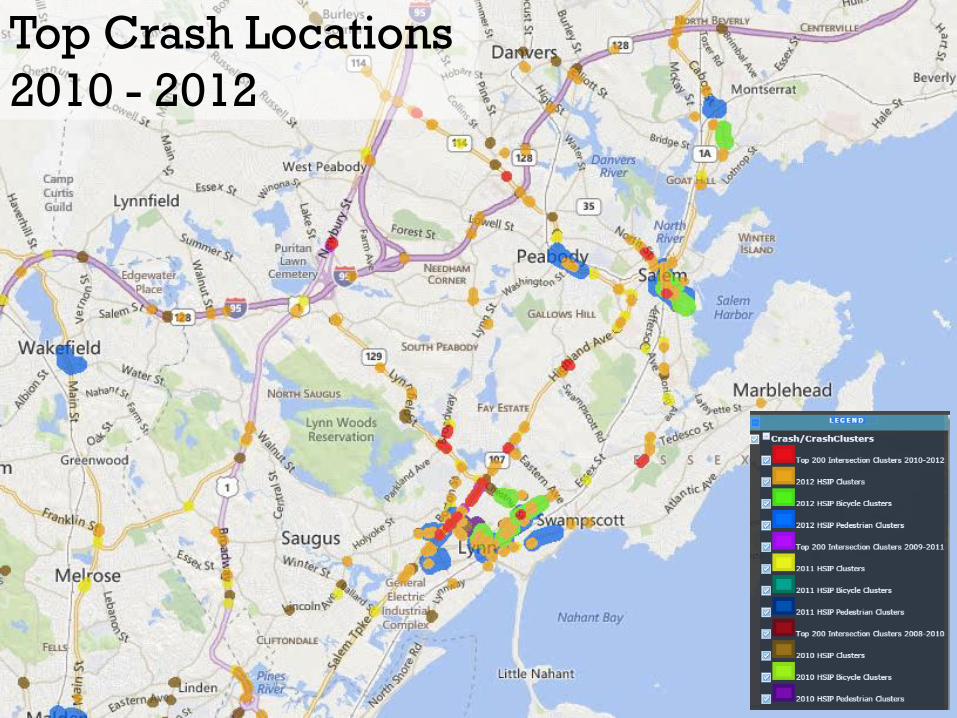
Top Crash Locations
2010 - 2012
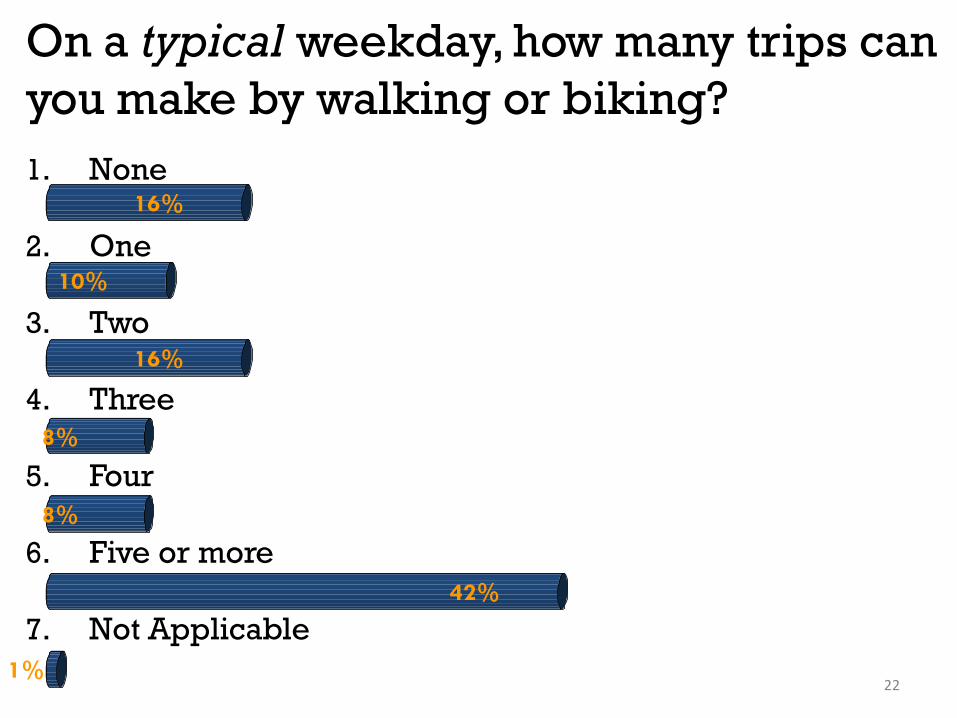
On a typical weekday, how many trips can
you make by walking or biking?
22 1%
42%
8%
8%
16%
10%
16%
1. None
2. One
3. Two
4. Three
5. Four
6. Five or more
7. Not Applicable
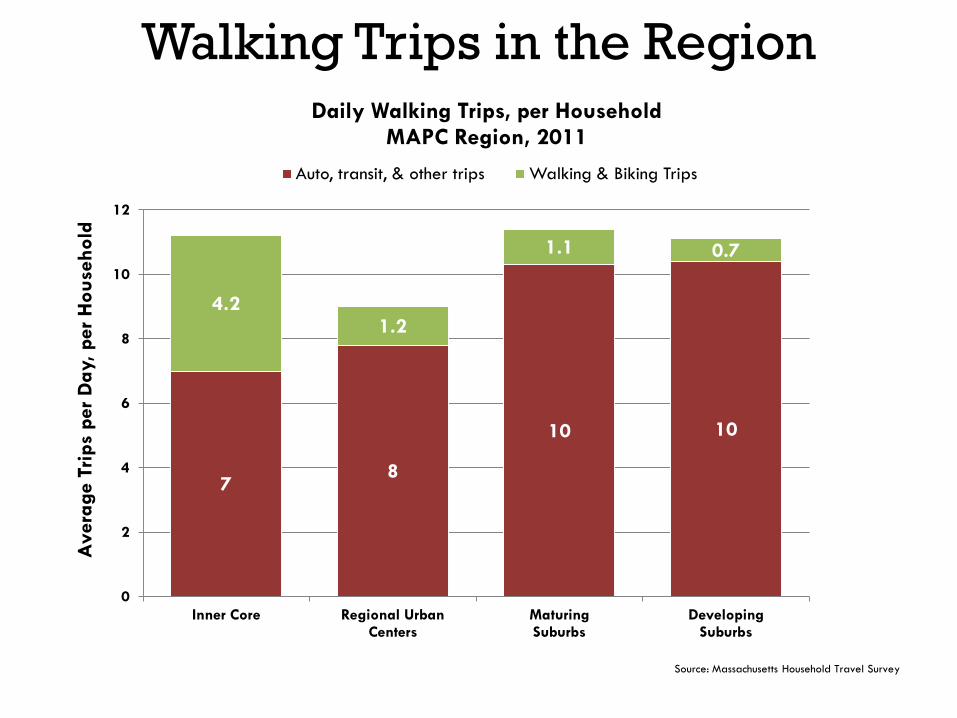
Walking Trips in the Region
7 8
10 10
4.2 1.2
1.1 0.7
0
2
4
6
8
10
12
Inner Core Regional Urban Centers
Maturing Suburbs
Developing Suburbs
Avera
ge T
rips
per
Day, per
Hou
seho
ld
Daily Walking Trips, per Household MAPC Region, 2011
Auto, transit, & other trips Walking & Biking Trips
Source: Massachusetts Household Travel Survey
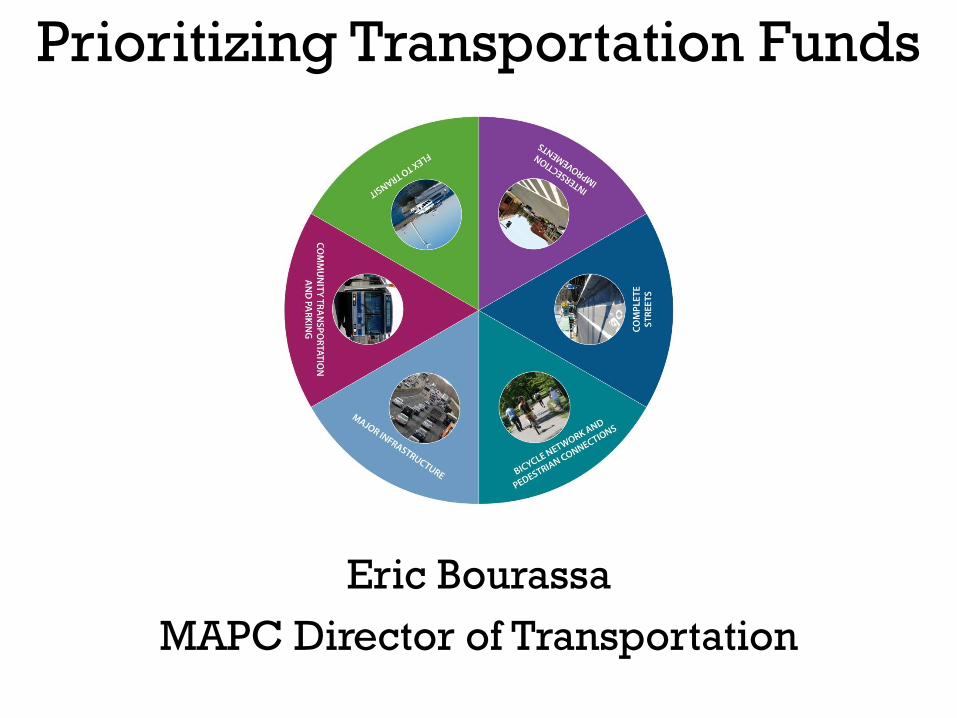
Prioritizing Transportation Funds
Eric Bourassa
MAPC Director of Transportation
Charting Progress to 2040
Goals
Safety
System Preservation
Capacity Management/Mobility
Clean Air/Clean Communities
Transportation Equity
Economic Vitality
Challenge
Not enough transportation funding
Need to prioritize limited funds
We need your input into what the priorities
should be
Feedback gathered today will be shared
with MPO members
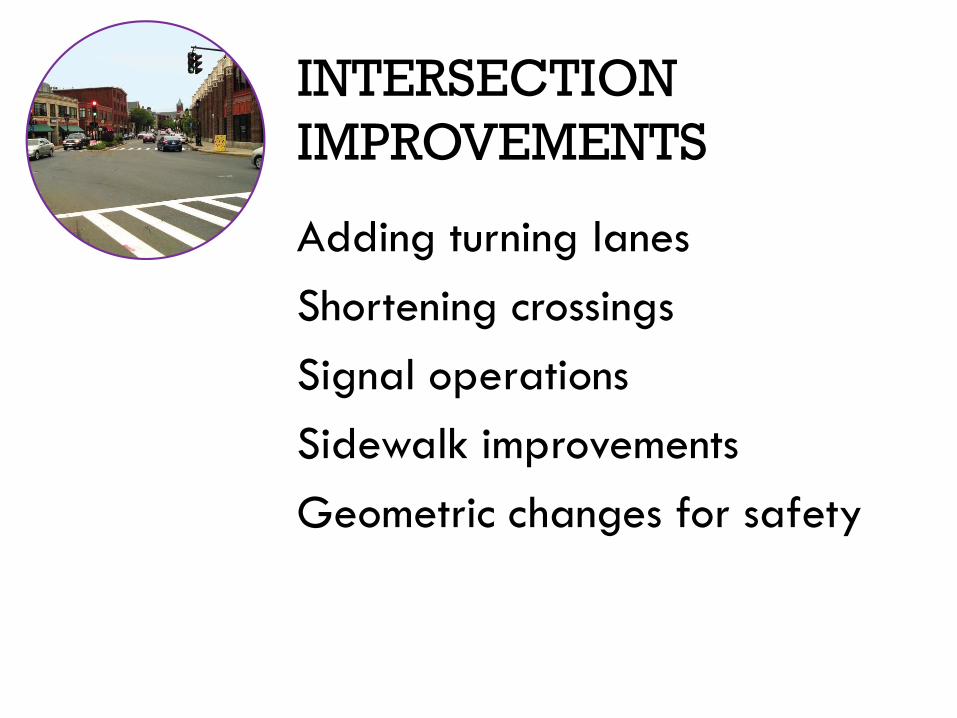
INTERSECTION
IMPROVEMENTS
Adding turning lanes
Shortening crossings
Signal operations
Sidewalk improvements
Geometric changes for safety
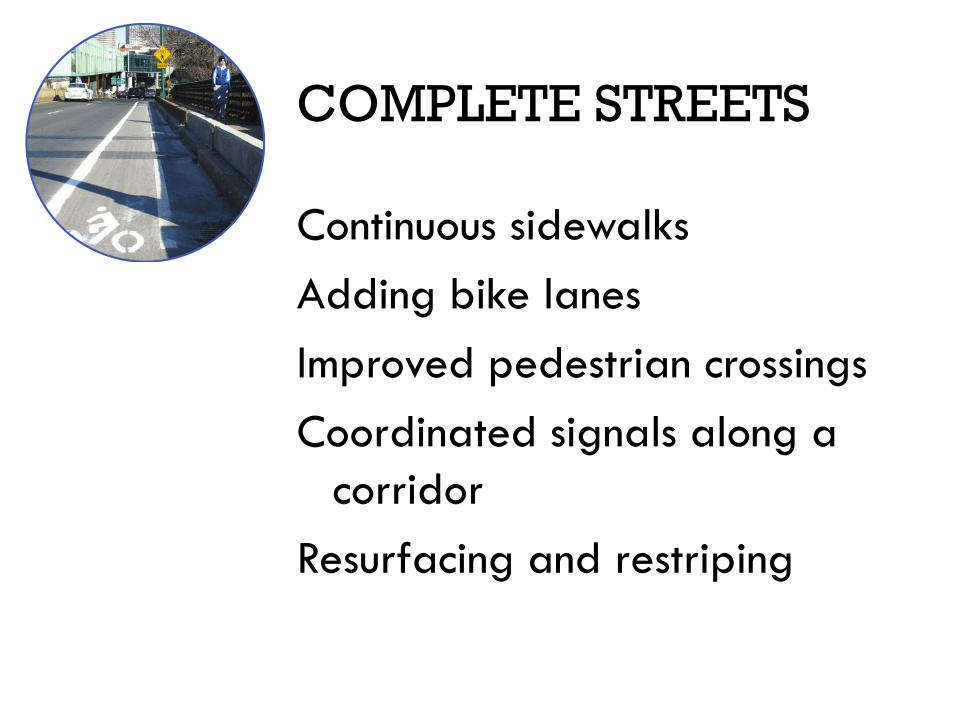
COMPLETE STREETS
Continuous sidewalks
Adding bike lanes
Improved pedestrian crossings
Coordinated signals along a
corridor
Resurfacing and restriping
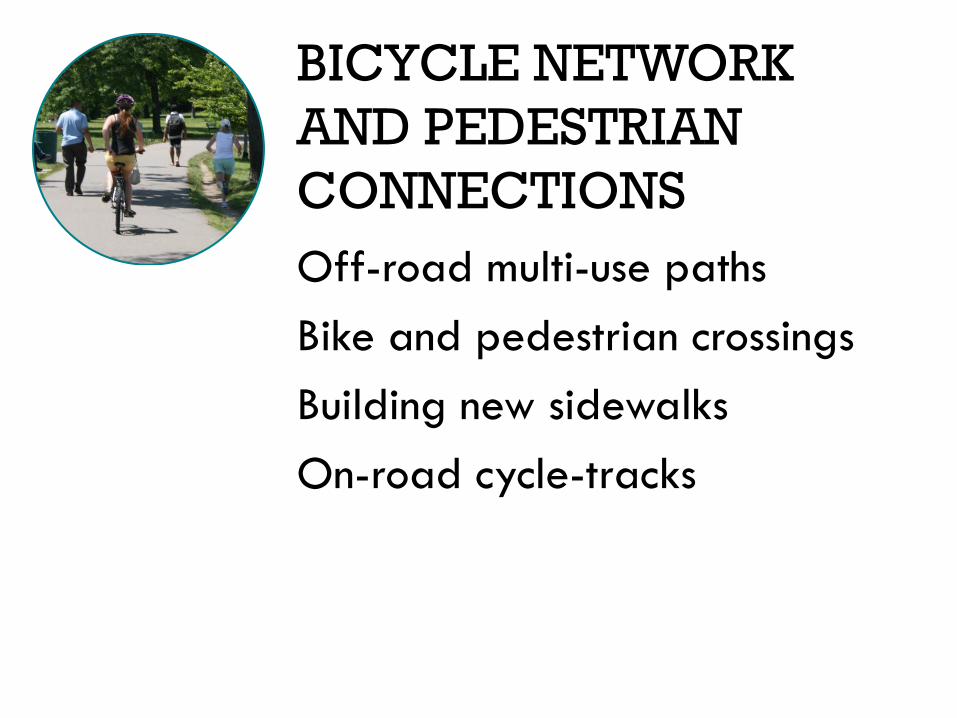
BICYCLE NETWORK
AND PEDESTRIAN
CONNECTIONS
Off-road multi-use paths
Bike and pedestrian crossings
Building new sidewalks
On-road cycle-tracks
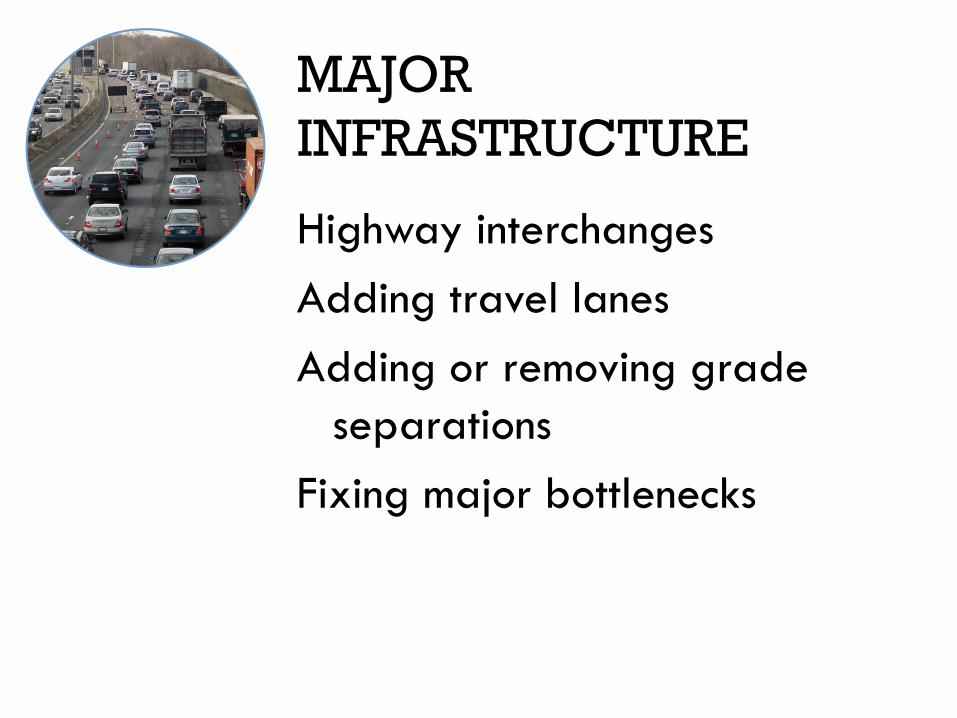
MAJOR
INFRASTRUCTURE
Highway interchanges
Adding travel lanes
Adding or removing grade
separations
Fixing major bottlenecks
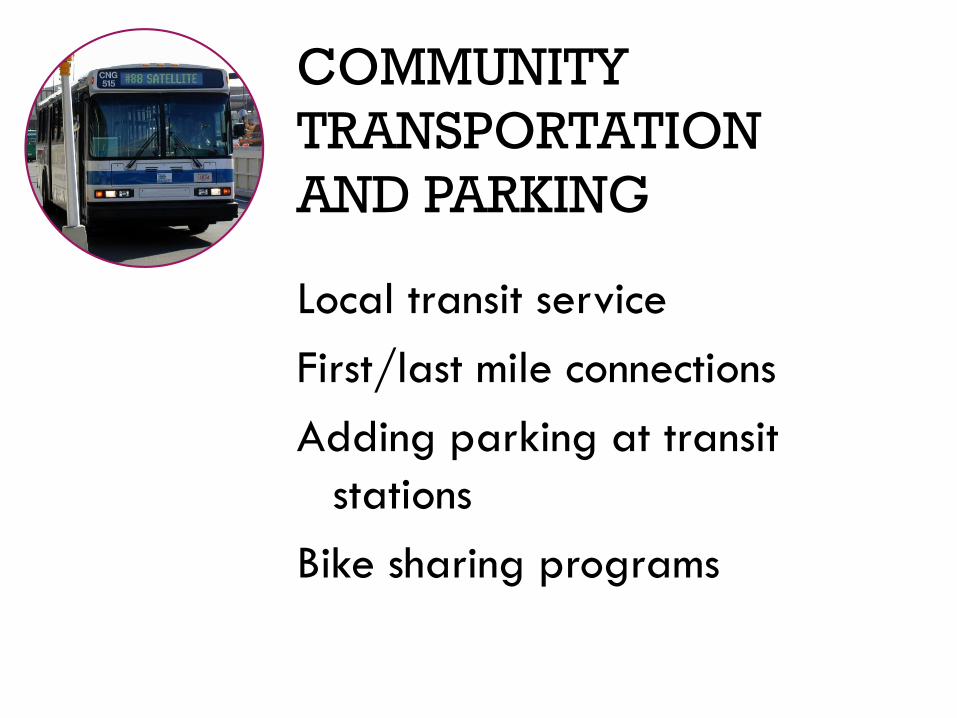
COMMUNITY
TRANSPORTATION
AND PARKING
Local transit service
First/last mile connections
Adding parking at transit
stations
Bike sharing programs
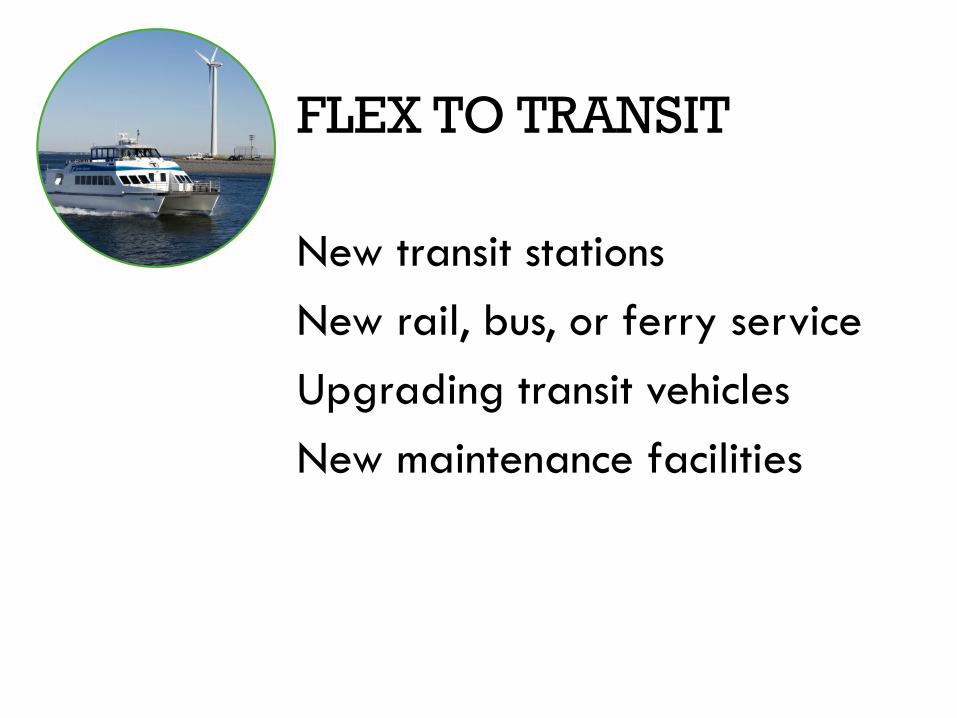
FLEX TO TRANSIT
New transit stations
New rail, bus, or ferry service
Upgrading transit vehicles
New maintenance facilities
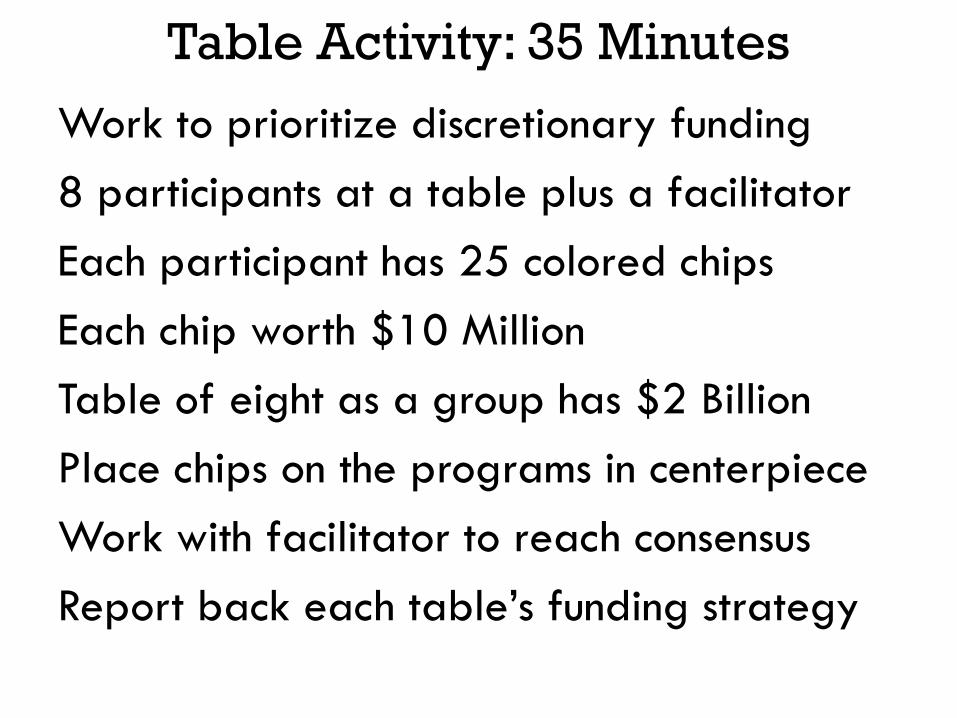
Table Activity: 35 Minutes
Work to prioritize discretionary funding
8 participants at a table plus a facilitator
Each participant has 25 colored chips
Each chip worth $10 Million
Table of eight as a group has $2 Billion
Place chips on the programs in centerpiece
Work with facilitator to reach consensus
Report back each table’s funding strategy
Materials
Goals and Objectives at each table
Worksheet describing activity and programs
Back of the worksheet has info on funding
Centerpiece
Colored Chips
Comment cards

Table Activity: 35 Minutes
Work to prioritize discretionary funding
8 participants at a table plus a facilitator
Each participant has 25 colored chips
Each chip worth $10 Million
Table of eight as a group has $2 Billion
Place chips on the programs in centerpiece
Work with facilitator to reach consensus
Report back each table’s funding strategy
Which type of scenario do you favor most?
37
1. Cluster A
2. Cluster B
3. Cluster C
4. Cluster D
5. Cluster E
6. None of the above
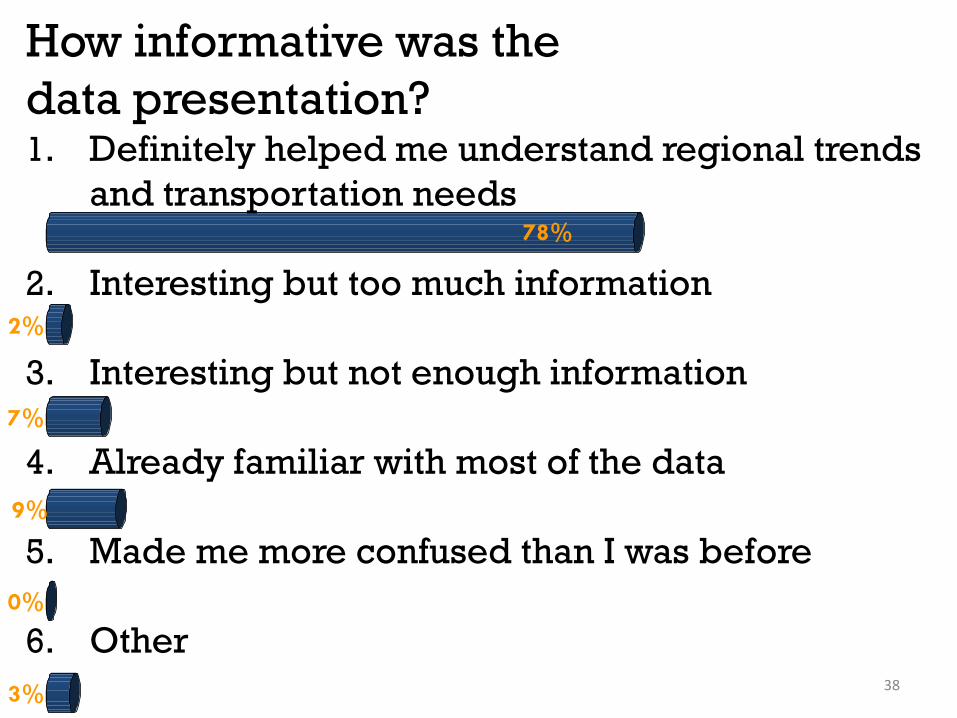
How informative was the
data presentation?
38 3%
0%
9%
7%
2%
78%
1. Definitely helped me understand regional trends
and transportation needs
2. Interesting but too much information
3. Interesting but not enough information
4. Already familiar with most of the data
5. Made me more confused than I was before
6. Other
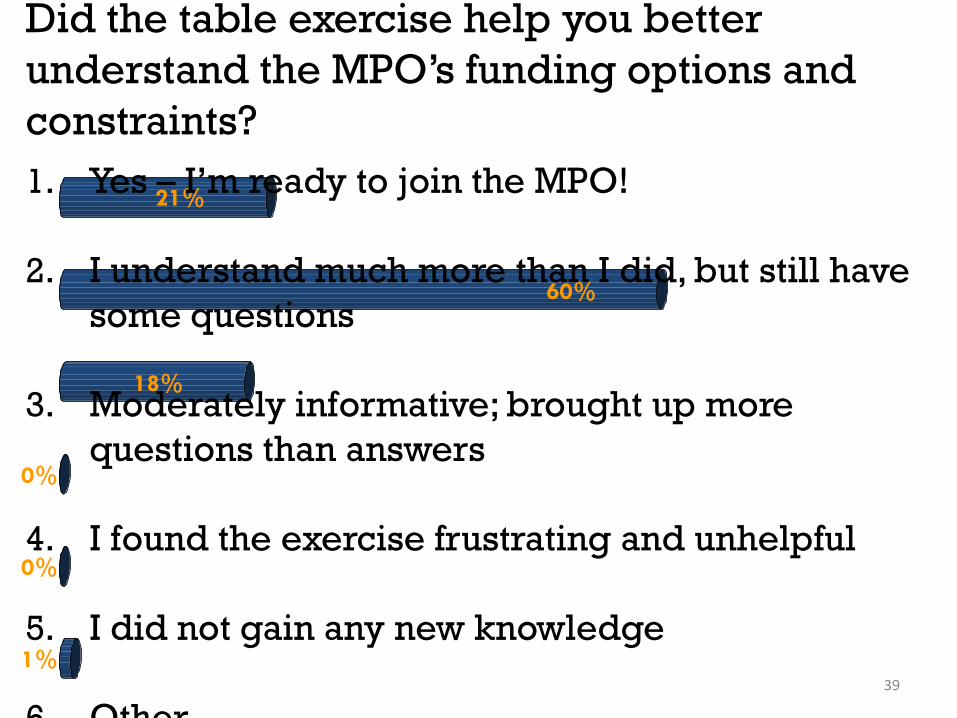
Did the table exercise help you better
understand the MPO’s funding options and
constraints?
39
1%
0%
0%
18%
60%
21%1. Yes – I’m ready to join the MPO!
2. I understand much more than I did, but still have
some questions
3. Moderately informative; brought up more
questions than answers
4. I found the exercise frustrating and unhelpful
5. I did not gain any new knowledge
6. Other
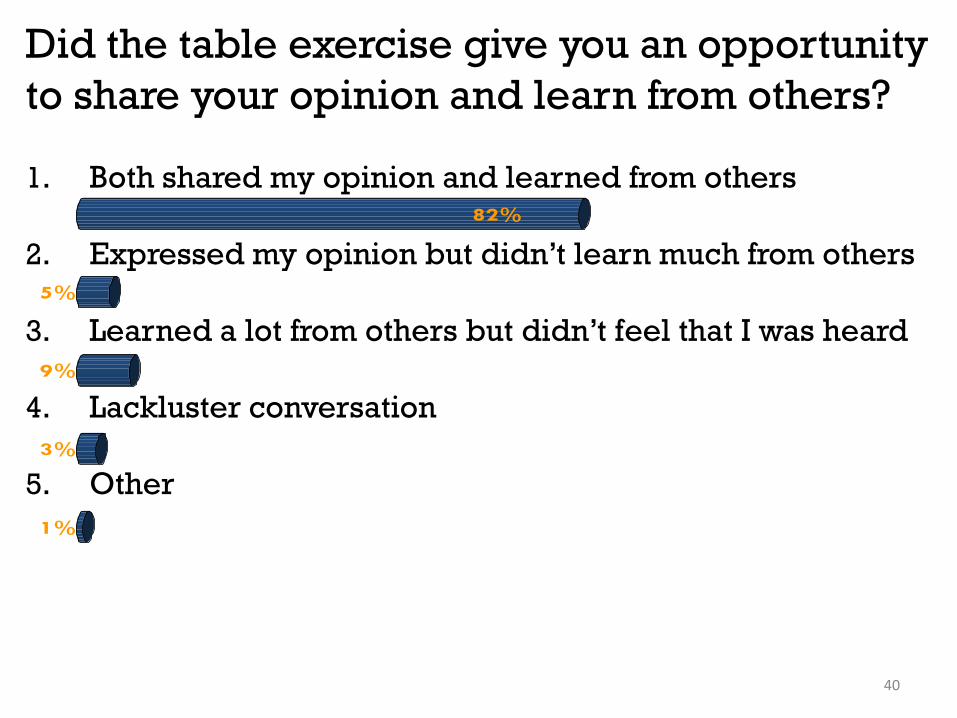
Did the table exercise give you an opportunity
to share your opinion and learn from others?
40
1%
3%
9%
5%
82%
1. Both shared my opinion and learned from others
2. Expressed my opinion but didn’t learn much from others
3. Learned a lot from others but didn’t feel that I was heard
4. Lackluster conversation
5. Other
MAPC Winter Council Meeting Parker House Hotel
February 25, 2015
Thank You!