Embed Size (px)
Citation preview
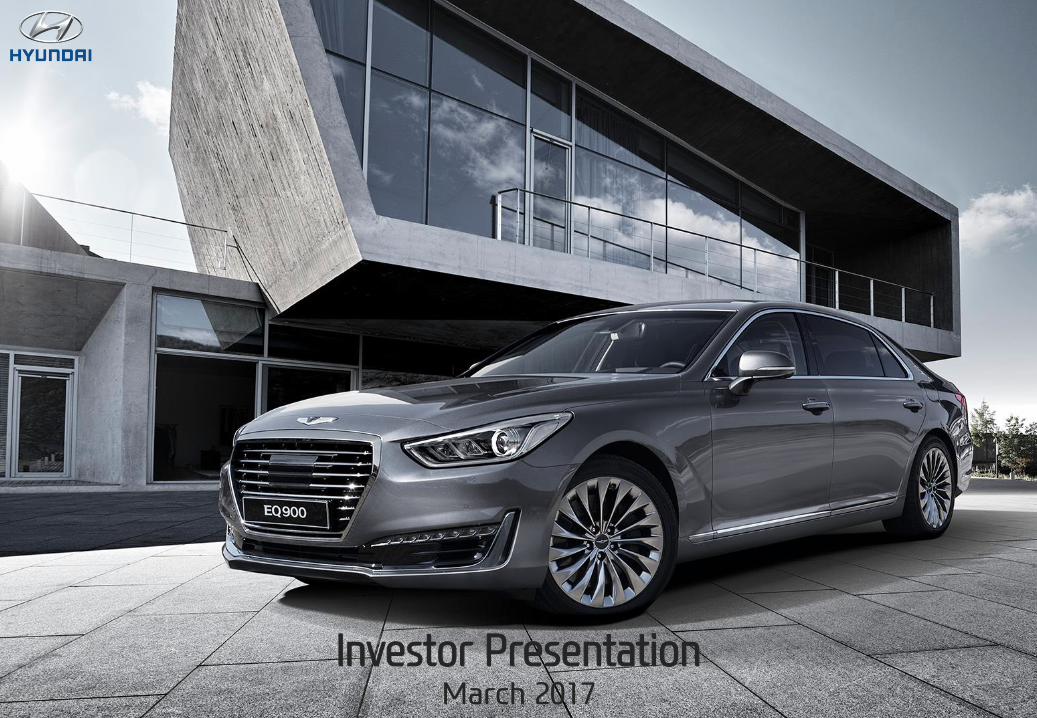
Investor Presentation March 2017
Cautionary Statement with Respect to Forward-Looking Statements
1
In the presentation that follows and in related comments by Hyundai Motor’s management, our use of the
words “expect,” “anticipate,” “project,” “estimate,” “forecast,” “objective,” “plan,” “goal,” “outlook,” “target,”
“pursue” and similar expressions is intended to identify forward looking statements.
The financial data discussed herein are presented on a preliminary basis before the audit from our Independent
Auditor; final data will be included in HMC’s Independent auditor’s report. While these statements represent our
current judgment on what the future may hold, and we believe these judgments are reasonable, actual results
may differ materially due to numerous important factors. Such factors include, among others, the following :
changes in economic conditions, currency exchange rates or political stability; shortages of fuel, labor strikes
or work stoppages; market acceptance of the corporation’s new products; significant changes in the
competitive environment; changes in laws, regulations and tax rates; and the ability of the corporation to
achieve reductions in cost and employment levels to realize production efficiencies and implement capital
expenditures at levels and times planned by management.
We do not intend or assume any obligation to update any forward-looking statement, which speaks only as of
the date on which it is made.
Table of Contents
2
• Key Strengths for HMC
• Future Strategies
• Shareholder Value
• Appendix
4
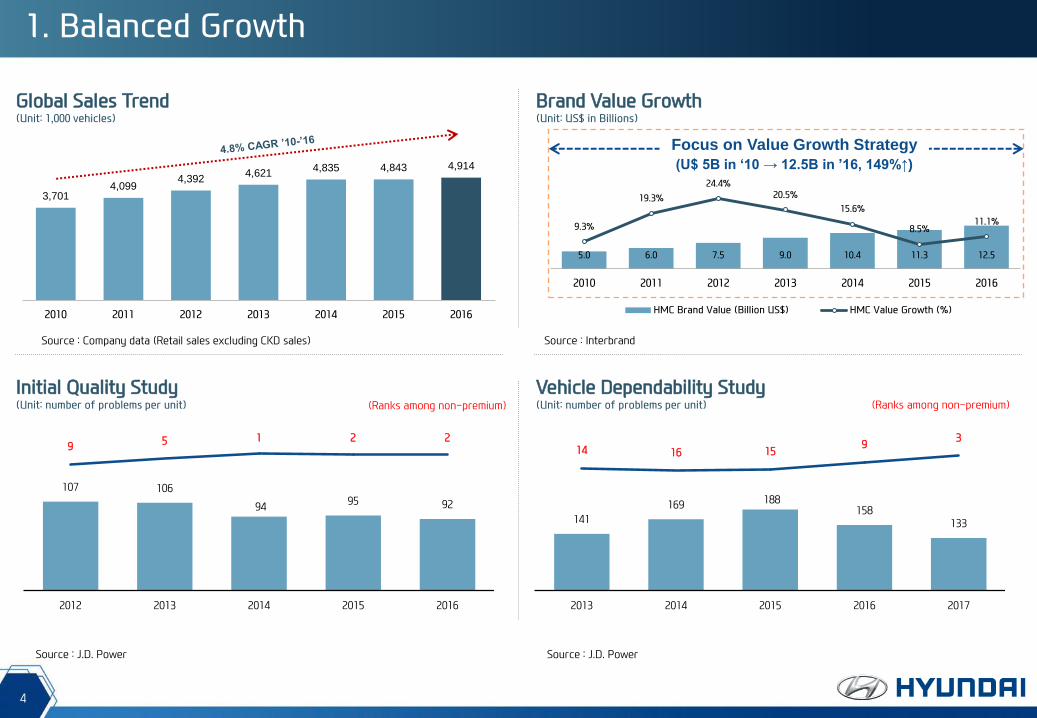
3,701 4,099
4,392 4,621
4,835 4,843 4,914
2010 2011 2012 2013 2014 2015 2016
Global Sales Trend (Unit: 1,000 vehicles)
Brand Value Growth (Unit: US$ in Billions)
Source : Company data (Retail sales excluding CKD sales)
Initial Quality Study (Unit: number of problems per unit)
Vehicle Dependability Study (Unit: number of problems per unit)
Source : J.D. Power
141
169 188 158
133
14 16 15 9
3
2013 2014 2015 2016 2017
(Ranks among non-premium)
Source : Interbrand
5.0 6.0 7.5 9.0 10.4 11.3 12.5
9.3%
19.3%
24.4% 20.5%
15.6%
8.5% 11.1%
0%
5%
10%
15%
20%
25%
30%
0
5
10
15
20
25
2010 2011 2012 2013 2014 2015 2016
HMC Brand Value (Billion US$) HMC Value Growth (%)
Focus on Value Growth Strategy
(U$ 5B in ‘10 → 12.5B in ’16, 149%↑)
1. Balanced Growth
(Ranks among non-premium)
Source : J.D. Power
107 106
94 95 92
9 5 1 2 2
2012 2013 2014 2015 2016
5
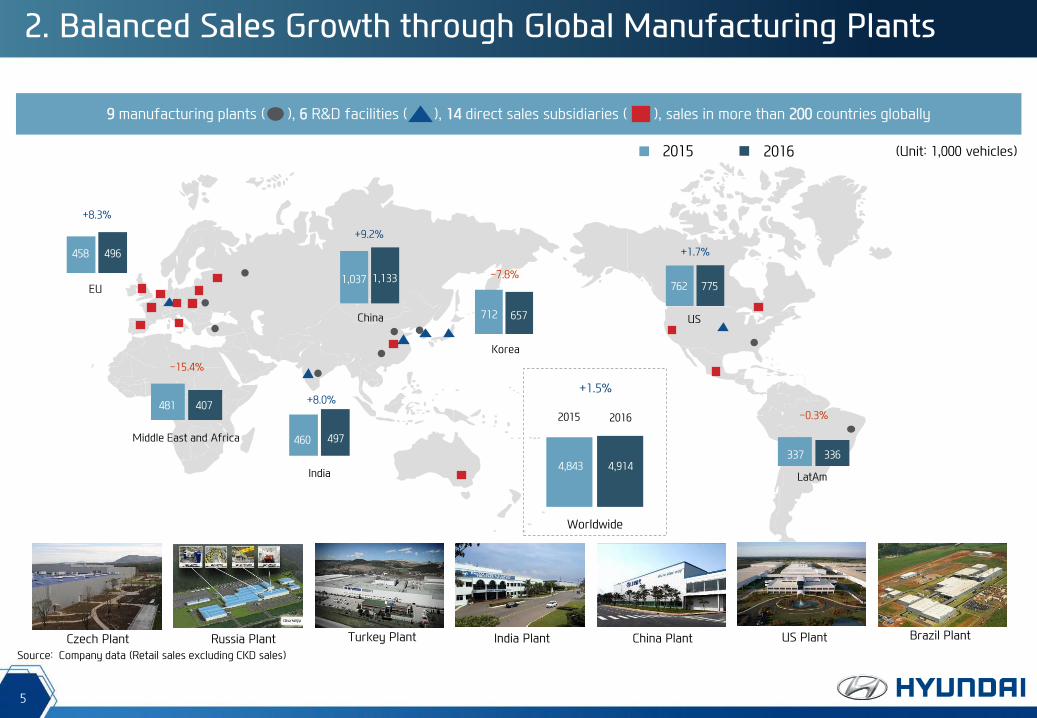
2. Balanced Sales Growth through Global Manufacturing Plants
(Unit: 1,000 vehicles) 2015 2016
Turkey Plant India Plant China Plant US Plant Czech Plant Russia Plant
US
775 762
Korea
657 712
EU
496 458
India
497 460
China
1,133 1,037
Worldwide
2015 2016
4,843 4,914
9 manufacturing plants ( ), 6 R&D facilities ( ), 14 direct sales subsidiaries ( ), sales in more than 200 countries globally
Source: Company data (Retail sales excluding CKD sales)
Brazil Plant
+1.5%
-7.8%
+9.2%
+8.3%
+8.0%
+1.7%
LatAm
336 337
-0.3%
Middle East and Africa
407 481
-15.4%
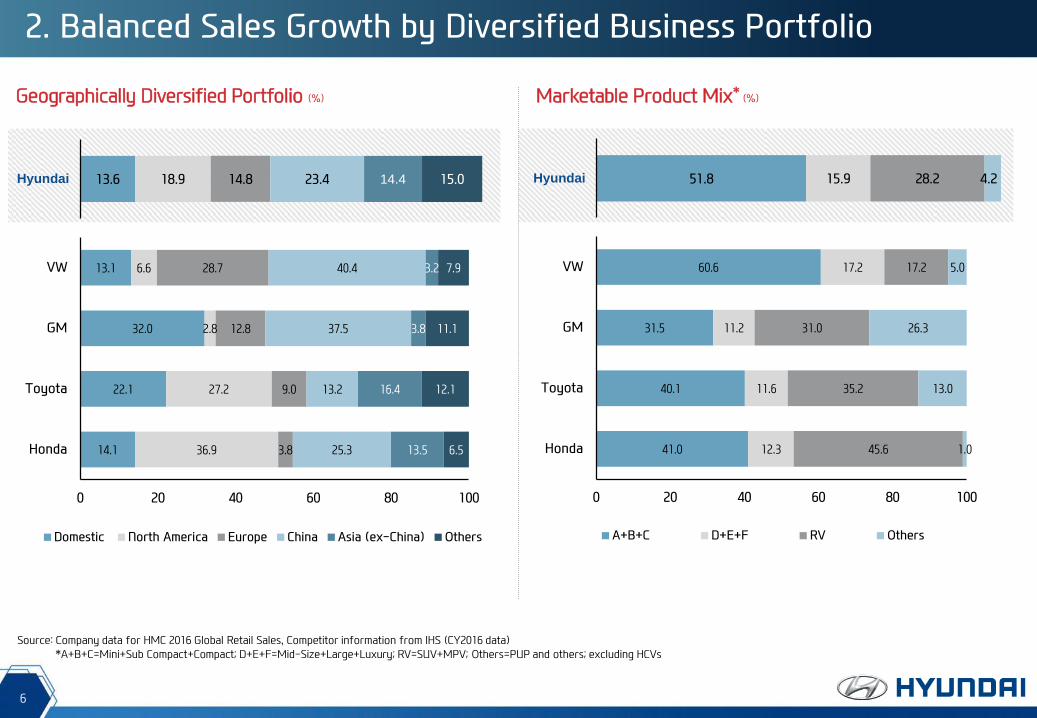
2. Balanced Sales Growth by Diversified Business Portfolio
6
Geographically Diversified Portfolio (%) Marketable Product Mix* (%)
14.1
22.1
32.0
13.1
36.9
27.2
2.8
6.6
3.8
9.0
12.8
28.7
25.3
13.2
37.5
40.4
13.5
16.4
3.8
3.2
6.5
12.1
11.1
7.9
0 20 40 60 80 100
Honda
Toyota
GM
VW
Domestic North America Europe China Asia (ex-China) Others
Source: Company data for HMC 2016 Global Retail Sales, Competitor information from IHS (CY2016 data)
*A+B+C=Mini+Sub Compact+Compact; D+E+F=Mid-Size+Large+Luxury; RV=SUV+MPV; Others=PUP and others; excluding HCVs
13.6 18.9 14.8 23.4 14.4 15.0 Hyundai
41.0
40.1
31.5
60.6
12.3
11.6
11.2
17.2
45.6
35.2
31.0
17.2
1.0
13.0
26.3
5.0
0 20 40 60 80 100
Honda
Toyota
GM
VW
A+B+C D+E+F RV Others
51.8 15.9 28.2 4.2 Hyundai
7
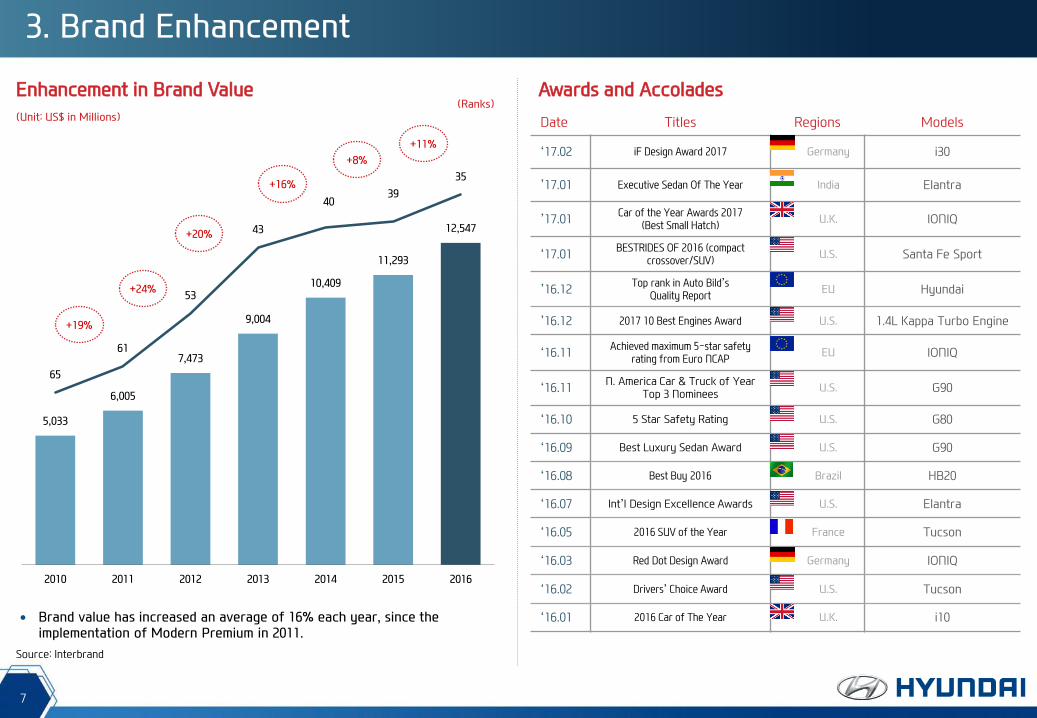
3. Brand Enhancement
5,033
6,005
7,473
9,004
10,409
11,293
12,547
65
61
53
43
40 39
35
2010 2011 2012 2013 2014 2015 2016
Enhancement in Brand Value (Ranks)
(Unit: US$ in Millions)
+19%
Brand value has increased an average of 16% each year, since the implementation of Modern Premium in 2011.
Awards and Accolades
+20%
+24%
+16%
+8%
+11%
Date Titles Regions Models
‘17.02 iF Design Award 2017 Germany i30
’17.01 Executive Sedan Of The Year India Elantra
’17.01 Car of the Year Awards 2017
(Best Small Hatch) U.K. IONIQ
‘17.01 BESTRIDES OF 2016 (compact
crossover/SUV) U.S. Santa Fe Sport
’16.12 Top rank in Auto Bild’s
Quality Report EU Hyundai
’16.12 2017 10 Best Engines Award U.S. 1.4L Kappa Turbo Engine
‘16.11 Achieved maximum 5-star safety
rating from Euro NCAP EU IONIQ
‘16.11 N. America Car & Truck of Year
Top 3 Nominees U.S. G90
‘16.10 5 Star Safety Rating U.S. G80
‘16.09 Best Luxury Sedan Award U.S. G90
‘16.08 Best Buy 2016 Brazil HB20
‘16.07 Int’l Design Excellence Awards U.S. Elantra
‘16.05 2016 SUV of the Year France Tucson
‘16.03 Red Dot Design Award Germany IONIQ
‘16.02 Drivers’ Choice Award U.S. Tucson
‘16.01 2016 Car of The Year U.K. i10
Source: Interbrand
8
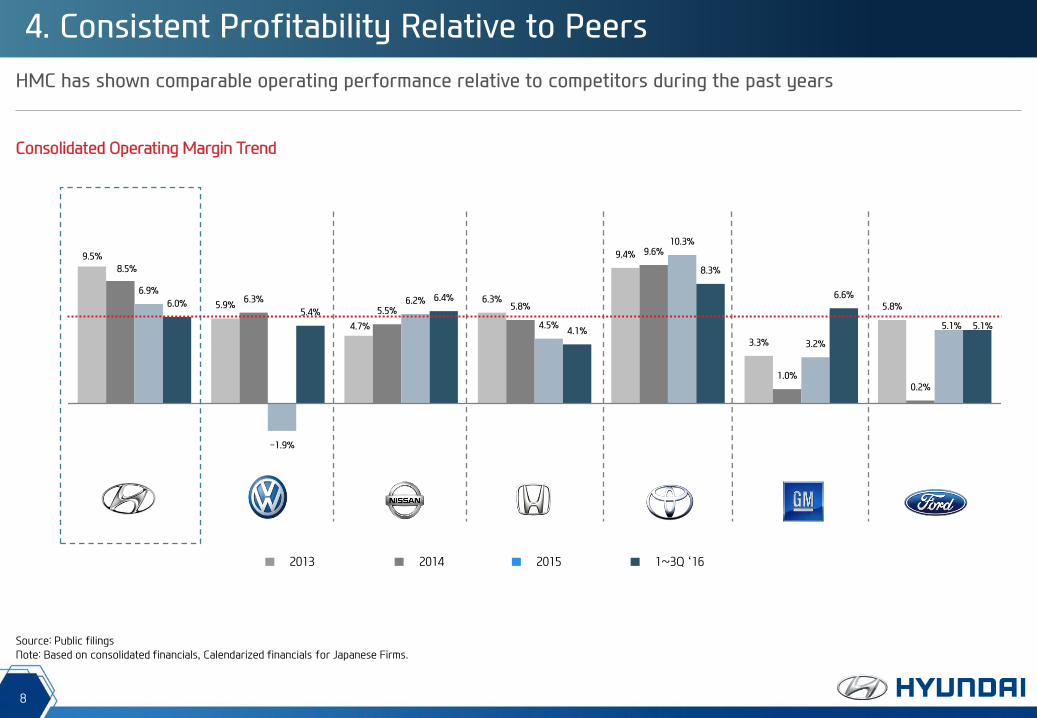
4. Consistent Profitability Relative to Peers
HMC has shown comparable operating performance relative to competitors during the past years
Source: Public filings
Note: Based on consolidated financials, Calendarized financials for Japanese Firms.
Consolidated Operating Margin Trend
9.5%
5.9%
4.7%
6.3%
9.4%
3.3%
5.8%
8.5%
6.3% 5.5% 5.8%
9.6%
1.0% 0.2%
6.9%
-1.9%
6.2%
4.5%
10.3%
3.2%
5.1%
6.0% 5.4%
6.4%
4.1%
8.3%
6.6%
5.1%
1~3Q ‘16 2013 2014 2015

10
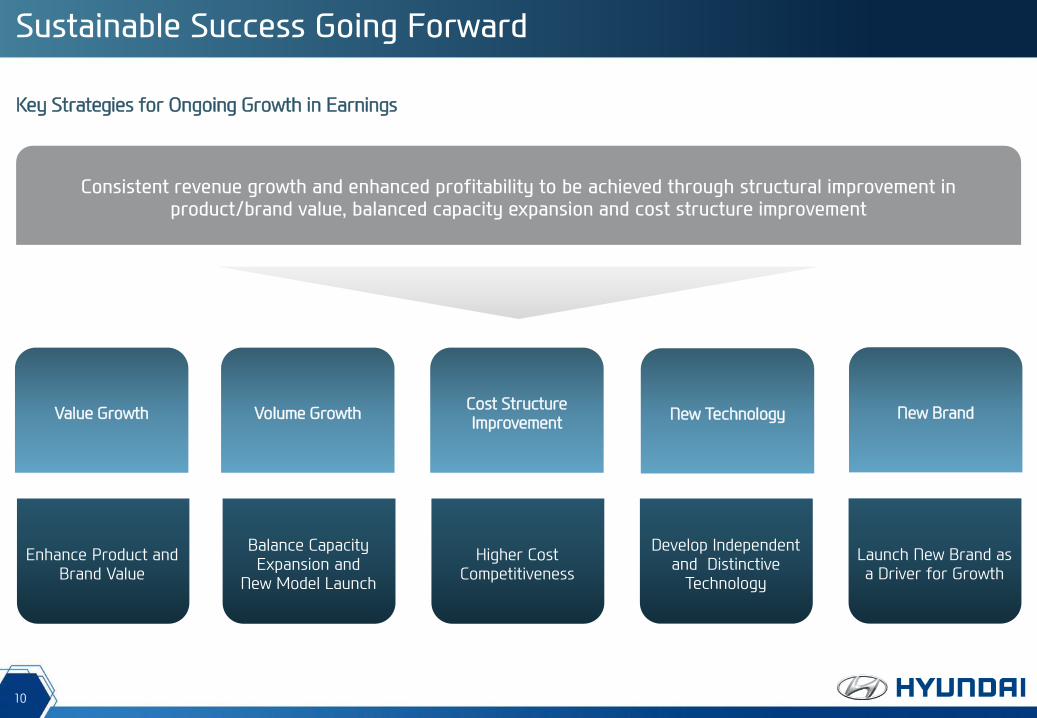
Sustainable Success Going Forward
Key Strategies for Ongoing Growth in Earnings
Consistent revenue growth and enhanced profitability to be achieved through structural improvement in product/brand value, balanced capacity expansion and cost structure improvement
Volume Growth Value Growth Cost Structure Improvement
New Technology
Balance Capacity Expansion and
New Model Launch
Enhance Product and Brand Value
Higher Cost Competitiveness
Develop Independent and Distinctive
Technology
New Brand
Launch New Brand as a Driver for Growth
11
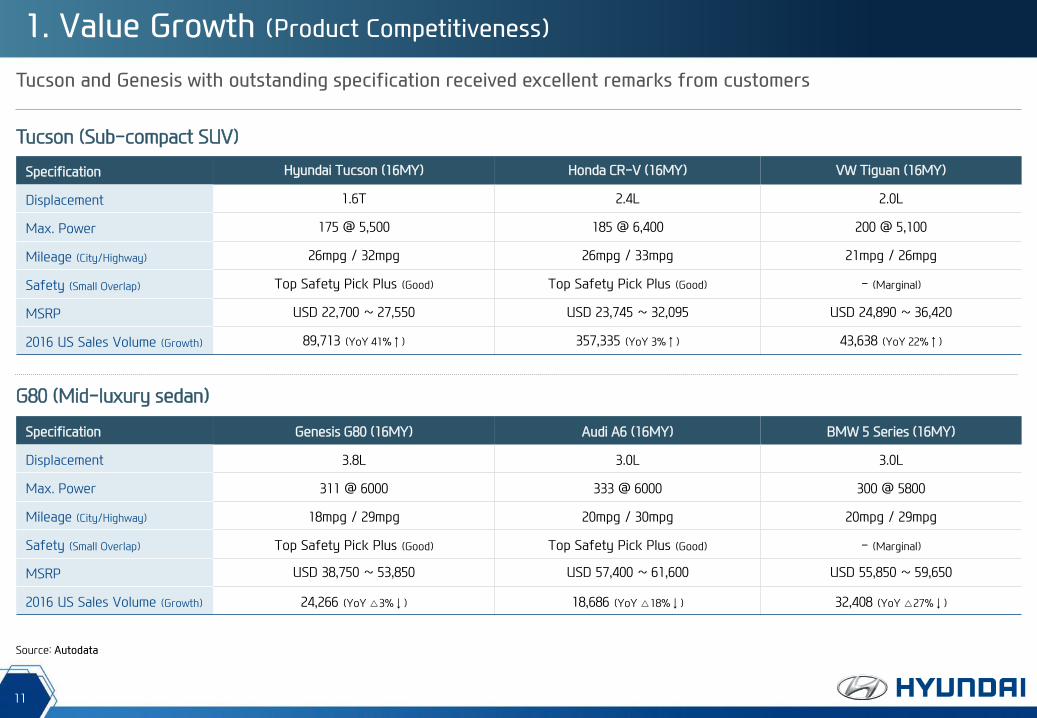
1. Value Growth (Product Competitiveness)
Tucson and Genesis with outstanding specification received excellent remarks from customers
Tucson (Sub-compact SUV)
G80 (Mid-luxury sedan)
Specification Hyundai Tucson (16MY) Honda CR-V (16MY) VW Tiguan (16MY)
Displacement 1.6T 2.4L 2.0L
Max. Power 175 @ 5,500 185 @ 6,400 200 @ 5,100
Mileage (City/Highway) 26mpg / 32mpg 26mpg / 33mpg 21mpg / 26mpg
Safety (Small Overlap) Top Safety Pick Plus (Good) Top Safety Pick Plus (Good) - (Marginal)
MSRP USD 22,700 ~ 27,550 USD 23,745 ~ 32,095 USD 24,890 ~ 36,420
2016 US Sales Volume (Growth) 89,713 (YoY 41%↑) 357,335 (YoY 3%↑) 43,638 (YoY 22%↑)
Specification Genesis G80 (16MY) Audi A6 (16MY) BMW 5 Series (16MY)
Displacement 3.8L 3.0L 3.0L
Max. Power 311 @ 6000 333 @ 6000 300 @ 5800
Mileage (City/Highway) 18mpg / 29mpg 20mpg / 30mpg 20mpg / 29mpg
Safety (Small Overlap) Top Safety Pick Plus (Good) Top Safety Pick Plus (Good) - (Marginal)
MSRP USD 38,750 ~ 53,850 USD 57,400 ~ 61,600 USD 55,850 ~ 59,650
2016 US Sales Volume (Growth) 24,266 (YoY △3%↓) 18,686 (YoY △18%↓) 32,408 (YoY △27%↓)
Source: Autodata
12
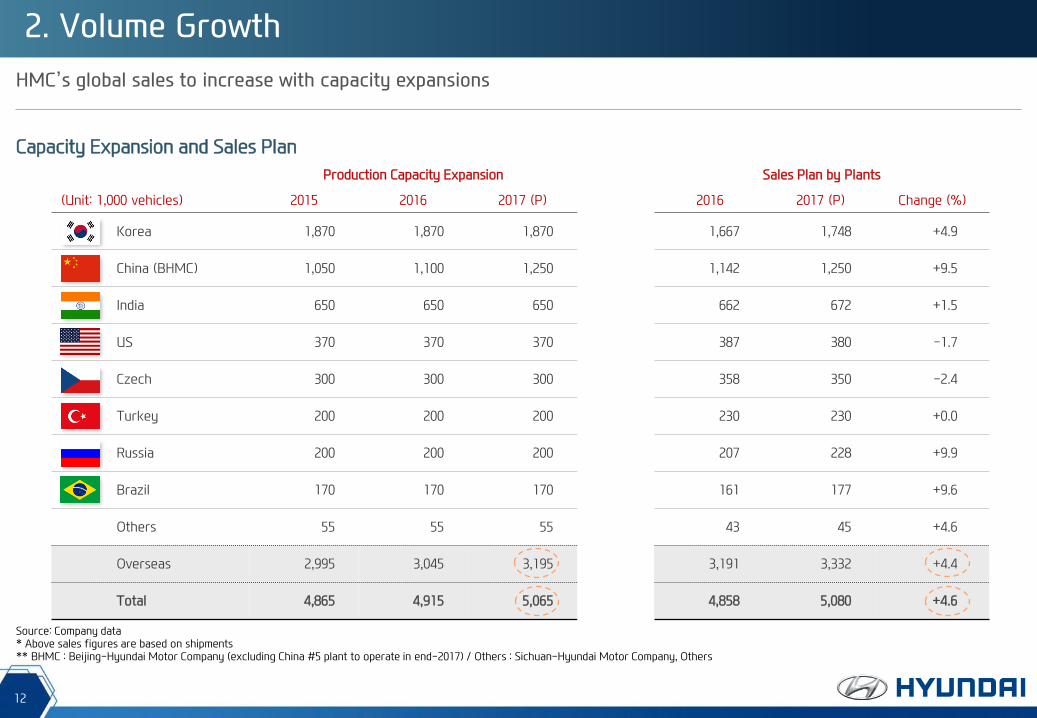
2. Volume Growth
HMC’s global sales to increase with capacity expansions
Capacity Expansion and Sales Plan
Source: Company data * Above sales figures are based on shipments ** BHMC : Beijing-Hyundai Motor Company (excluding China #5 plant to operate in end-2017) / Others : Sichuan-Hyundai Motor Company, Others
Production Capacity Expansion Sales Plan by Plants
(Unit: 1,000 vehicles) 2015 2016 2017 (P) 2016 2017 (P) Change (%)
Korea 1,870 1,870 1,870 1,667 1,748 +4.9
China (BHMC) 1,050 1,100 1,250 1,142 1,250 +9.5
India 650 650 650 662 672 +1.5
US 370 370 370 387 380 -1.7
Czech 300 300 300 358 350 -2.4
Turkey 200 200 200 230 230 +0.0
Russia 200 200 200 207 228 +9.9
Brazil 170 170 170 161 177 +9.6
Others 55 55 55 43 45 +4.6
Overseas 2,995 3,045 3,195 3,191 3,332 +4.4
Total 4,865 4,915 5,065 4,858 5,080 +4.6

40
33
19
2002 2009 2013
13
Platform integration will reduce development costs and deliver greater economies of scale
Integration Schedule Reduction of Model Development Time
Models per Type of Platform Increasing portion of models with integrated platform
2002 2009 2011 2015
Integrated Platforms 0 6 6 6
Total No. of Platforms 22 18 11 6
Total No. of Models 28 32 36 48
Avg. of 40 months → 19 months
Source: Company Data
Micro-Small Small-Mid Mid-Large LCV FR-Mid FR-Large
Mass Production
New 91%
Old 9%
2014 2012
Old 38%
New 75%
Old 25%
2015
New 87%
Old 13%
3. Cost Structure Improvement (Platform Integration)
Niche Market
Platform Integration
14
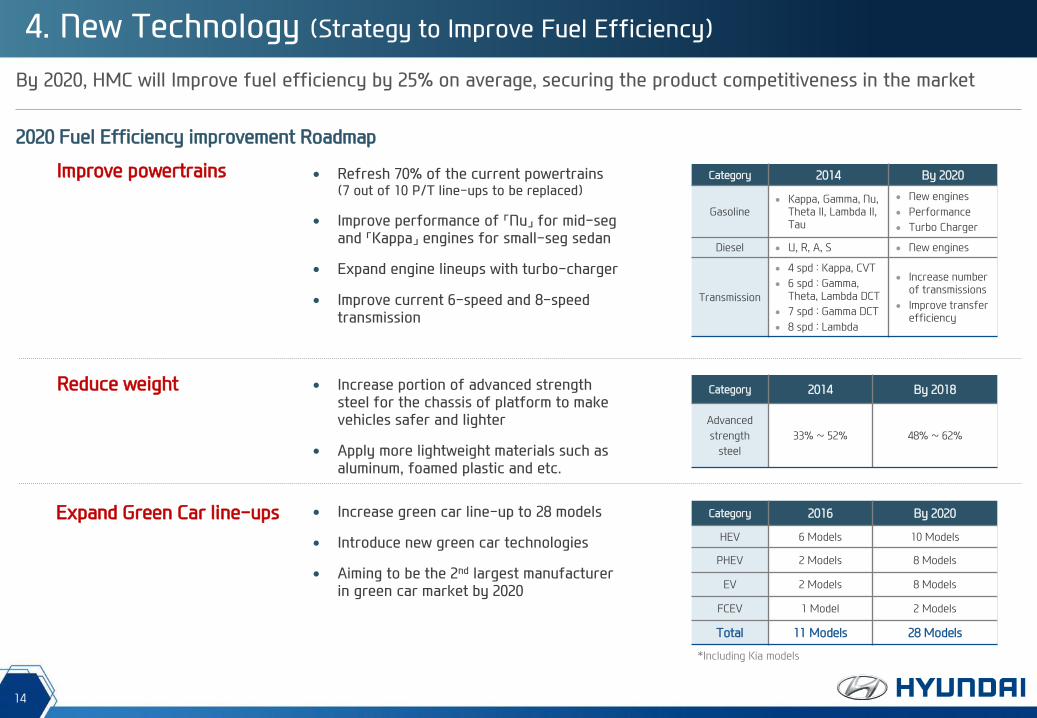
By 2020, HMC will Improve fuel efficiency by 25% on average, securing the product competitiveness in the market
2020 Fuel Efficiency improvement Roadmap
Improve powertrains
Reduce weight
Expand Green Car line-ups
Refresh 70% of the current powertrains (7 out of 10 P/T line-ups to be replaced)
Improve performance of 「Nu」 for mid-seg and 「Kappa」 engines for small-seg sedan
Expand engine lineups with turbo-charger
Improve current 6-speed and 8-speed transmission
Increase portion of advanced strength steel for the chassis of platform to make vehicles safer and lighter
Apply more lightweight materials such as aluminum, foamed plastic and etc.
Increase green car line-up to 28 models
Introduce new green car technologies
Aiming to be the 2nd largest manufacturer in green car market by 2020
Category 2014 By 2020
Gasoline Kappa, Gamma, Nu,
Theta II, Lambda II, Tau
New engines
Performance
Turbo Charger
Diesel U, R, A, S New engines
Transmission
4 spd : Kappa, CVT
6 spd : Gamma, Theta, Lambda DCT
7 spd : Gamma DCT
8 spd : Lambda
Increase number of transmissions
Improve transfer efficiency
Category 2014 By 2018
Advanced
strength
steel
33% ~ 52% 48% ~ 62%
Category 2016 By 2020
HEV 6 Models 10 Models
PHEV 2 Models 8 Models
EV 2 Models 8 Models
FCEV 1 Model 2 Models
Total 11 Models 28 Models
*Including Kia models
4. New Technology (Strategy to Improve Fuel Efficiency)
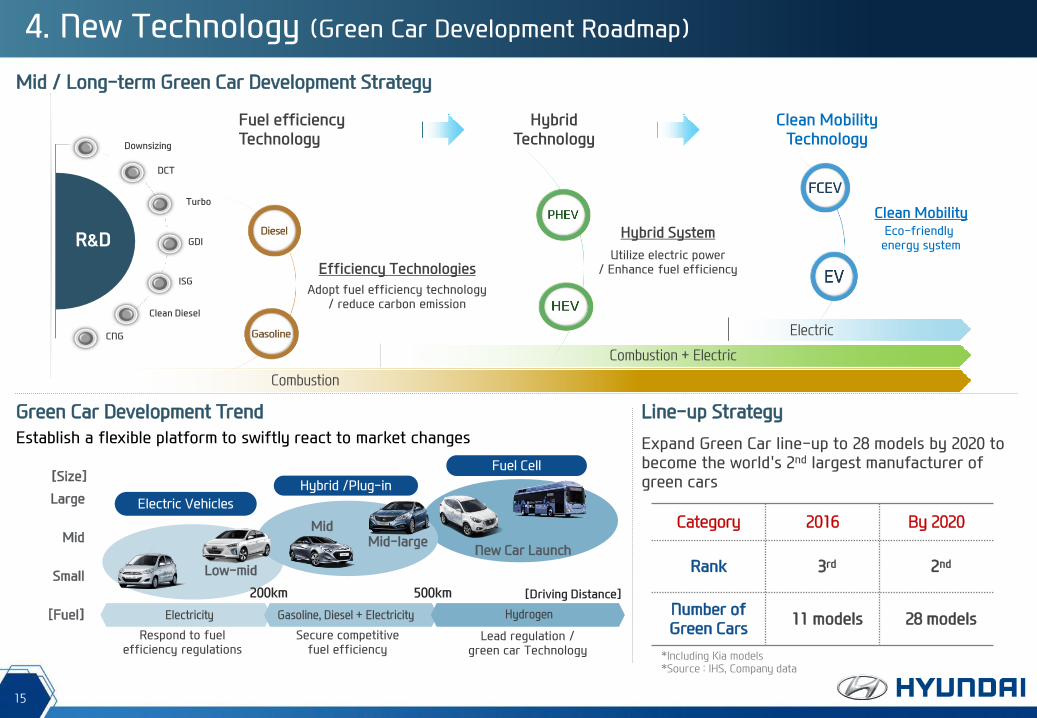
15
Mid / Long-term Green Car Development Strategy
Combustion
Electric
Combustion + Electric
Green Car Development Trend
Establish a flexible platform to swiftly react to market changes
[Fuel]
Respond to fuel efficiency regulations
Secure competitive fuel efficiency
Lead regulation / green car Technology
[Size]
Small
Mid
Large
Expand Green Car line-up to 28 models by 2020 to become the world's 2nd largest manufacturer of green cars
Line-up Strategy
Category 2016 By 2020
Rank 3rd 2nd
Number of Green Cars
11 models 28 models
4. New Technology (Green Car Development Roadmap)
Low-mid
Mid
New Car Launch Mid-large
*Including Kia models *Source : IHS, Company data
16
Electric Motor
Powered by advanced lithium-ion battery
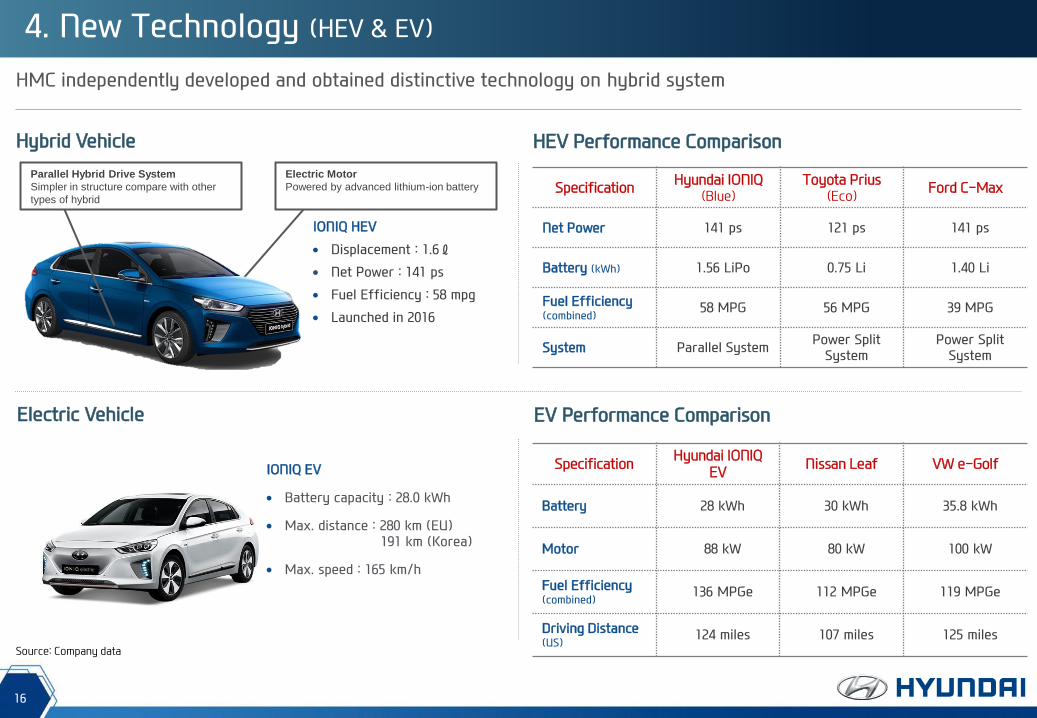
4. New Technology (HEV & EV)
HMC independently developed and obtained distinctive technology on hybrid system
Parallel Hybrid Drive System
Simpler in structure compare with other
types of hybrid
Specification Hyundai IONIQ
(Blue) Toyota Prius
(Eco) Ford C-Max
Net Power 141 ps 121 ps 141 ps
Battery (kWh) 1.56 LiPo 0.75 Li 1.40 Li
Fuel Efficiency (combined)
58 MPG 56 MPG 39 MPG
System Parallel System Power Split
System Power Split
System
IONIQ HEV
Displacement : 1.6ℓ
Net Power : 141 ps
Fuel Efficiency : 58 mpg
Launched in 2016
Hybrid Vehicle HEV Performance Comparison
Source: Company data
Electric Vehicle EV Performance Comparison
IONIQ EV
Battery capacity : 28.0 kWh
Max. distance : 280 km (EU) 191 km (Korea)
Max. speed : 165 km/h
Specification Hyundai IONIQ
EV Nissan Leaf VW e-Golf
Battery 28 kWh 30 kWh 35.8 kWh
Motor 88 kW 80 kW 100 kW
Fuel Efficiency (combined)
136 MPGe 112 MPGe 119 MPGe
Driving Distance (US)
124 miles 107 miles 125 miles
17
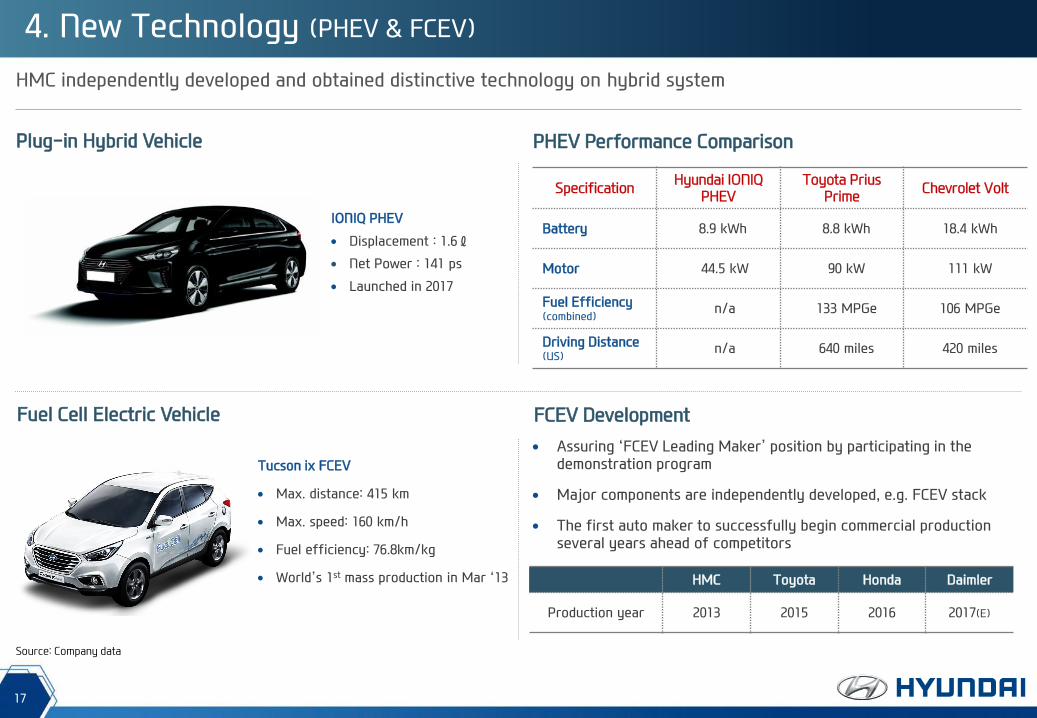
4. New Technology (PHEV & FCEV)
HMC independently developed and obtained distinctive technology on hybrid system
Plug-in Hybrid Vehicle PHEV Performance Comparison
Source: Company data
Fuel Cell Electric Vehicle FCEV Development
HMC Toyota Honda Daimler
Production year 2013 2015 2016 2017(E)
Assuring ‘FCEV Leading Maker’ position by participating in the demonstration program
Major components are independently developed, e.g. FCEV stack
The first auto maker to successfully begin commercial production several years ahead of competitors
Tucson ix FCEV
Max. distance: 415 km
Max. speed: 160 km/h
Fuel efficiency: 76.8km/kg
World’s 1st mass production in Mar ‘13
IONIQ PHEV
Displacement : 1.6ℓ
Net Power : 141 ps
Launched in 2017
Specification Hyundai IONIQ
PHEV Toyota Prius
Prime Chevrolet Volt
Battery 8.9 kWh 8.8 kWh 18.4 kWh
Motor 44.5 kW 90 kW 111 kW
Fuel Efficiency (combined)
n/a 133 MPGe 106 MPGe
Driving Distance (US)
n/a 640 miles 420 miles
18
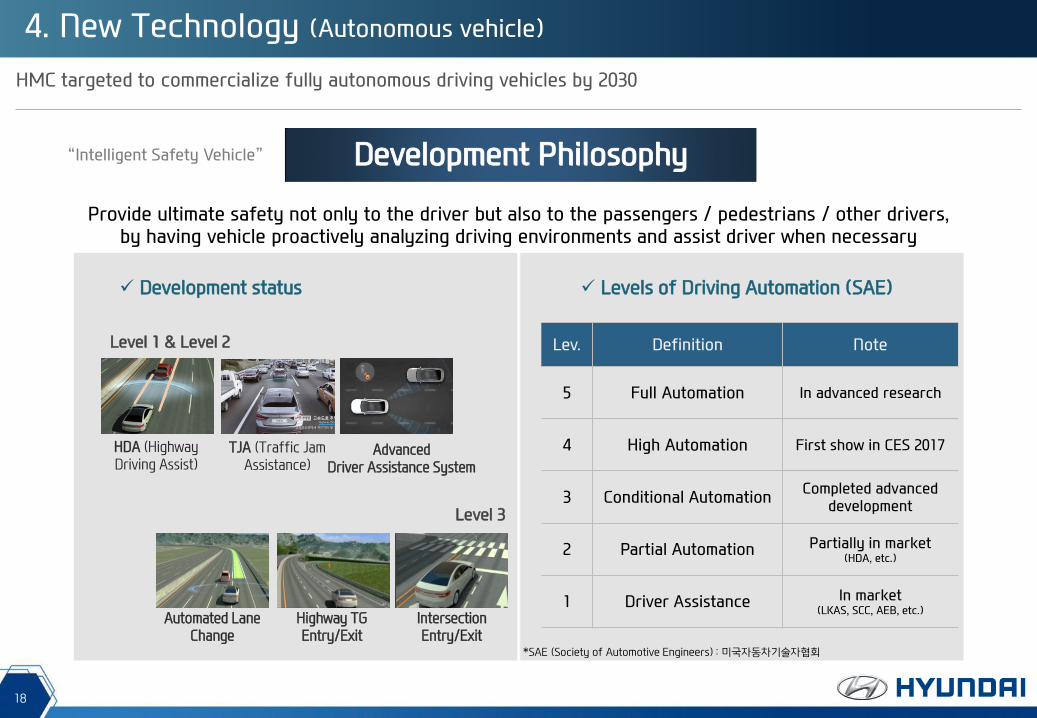
4. New Technology (Autonomous vehicle)
HMC targeted to commercialize fully autonomous driving vehicles by 2030
Development Philosophy
Level 1 & Level 2
Development status Levels of Driving Automation (SAE)
“Intelligent Safety Vehicle”
Automated Lane Change
Intersection Entry/Exit
Highway TG Entry/Exit
HDA (Highway Driving Assist)
TJA (Traffic Jam Assistance)
Advanced Driver Assistance System
Level 3
Provide ultimate safety not only to the driver but also to the passengers / pedestrians / other drivers, by having vehicle proactively analyzing driving environments and assist driver when necessary
Lev. Definition Note
5 Full Automation In advanced research
4 High Automation First show in CES 2017
3 Conditional Automation Completed advanced
development
2 Partial Automation Partially in market (HDA, etc.)
1 Driver Assistance In market (LKAS, SCC, AEB, etc.)
*SAE (Society of Automotive Engineers) : 미국자동차기술자협회
19
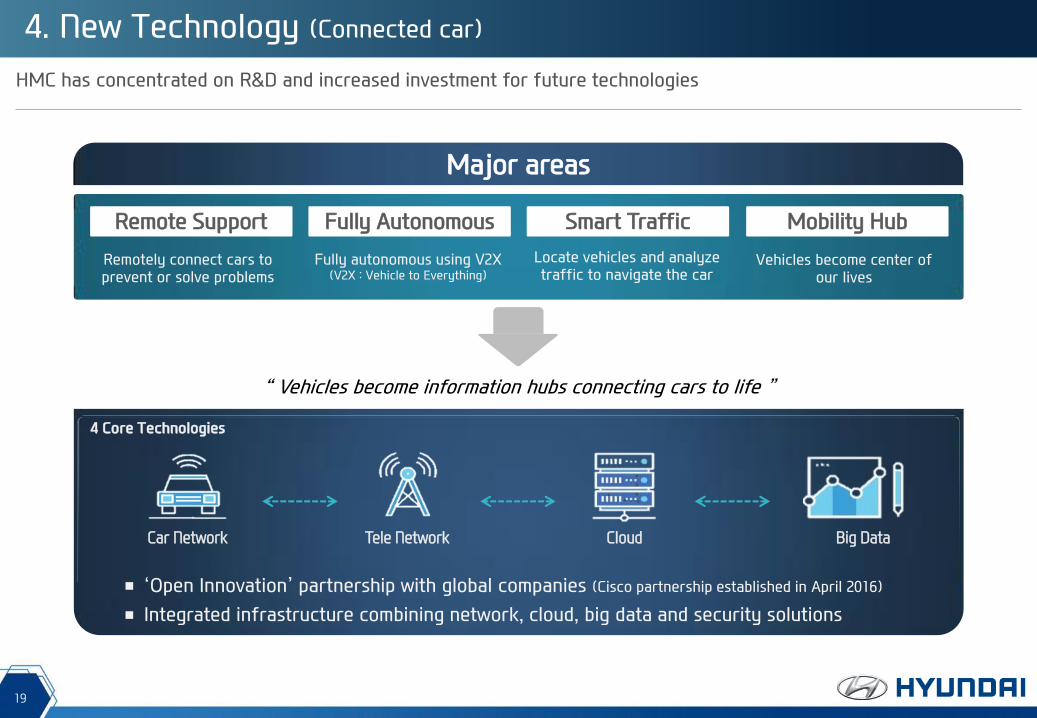
4. New Technology (Connected car)
HMC has concentrated on R&D and increased investment for future technologies
Remote Support Fully Autonomous Smart Traffic Mobility Hub
Major areas
Remotely connect cars to prevent or solve problems
Fully autonomous using V2X (V2X : Vehicle to Everything)
Locate vehicles and analyze traffic to navigate the car
Vehicles become center of our lives
Car Network Tele Network Cloud Big Data
■ ‘Open Innovation’ partnership with global companies (Cisco partnership established in April 2016)
■ Integrated infrastructure combining network, cloud, big data and security solutions
4 Core Technologies
“ Vehicles become information hubs connecting cars to life ”
20
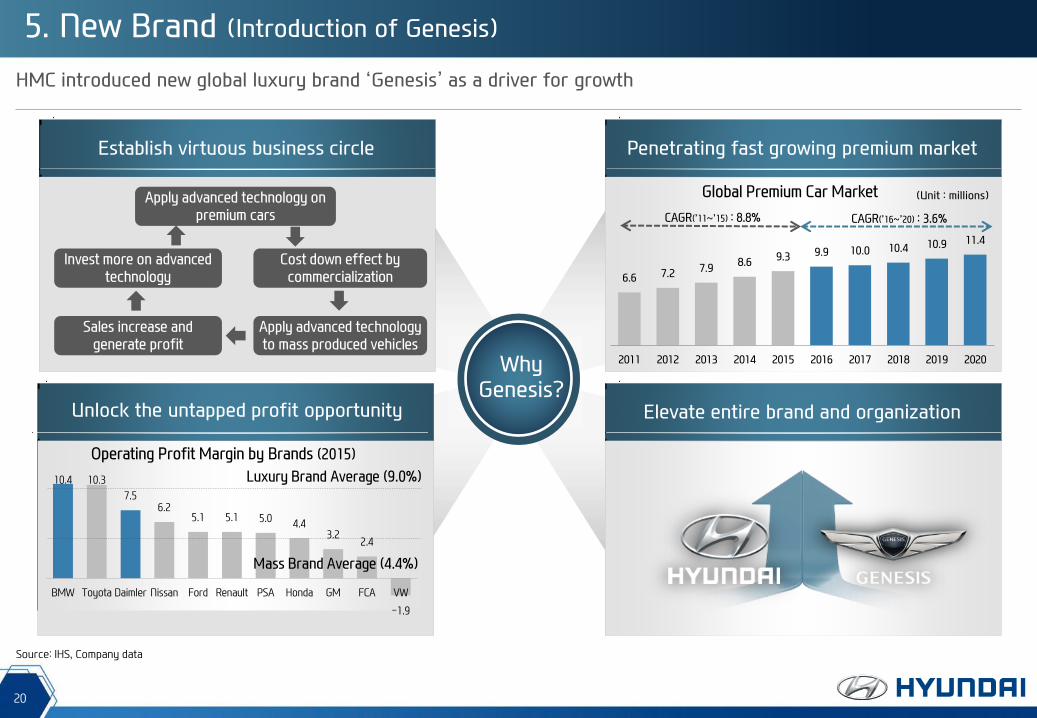
HMC introduced new global luxury brand ‘Genesis’ as a driver for growth
Why Genesis?
Unlock the untapped profit opportunity Elevate entire brand and organization
10.4 10.3
7.5 6.2
5.1 5.1 5.0 4.4
3.2 2.4
-1.9
BMW Toyota Daimler Nissan Ford Renault PSA Honda GM FCA VW
Penetrating fast growing premium market Establish virtuous business circle
6.6 7.2 7.9 8.6
9.3 9.9 10.0 10.4 10.9 11.4
2011 2012 2013 2014 2015 2016 2017 2018 2019 2020
(Unit : millions)
Source: IHS, Company data
5. New Brand (Introduction of Genesis)
21
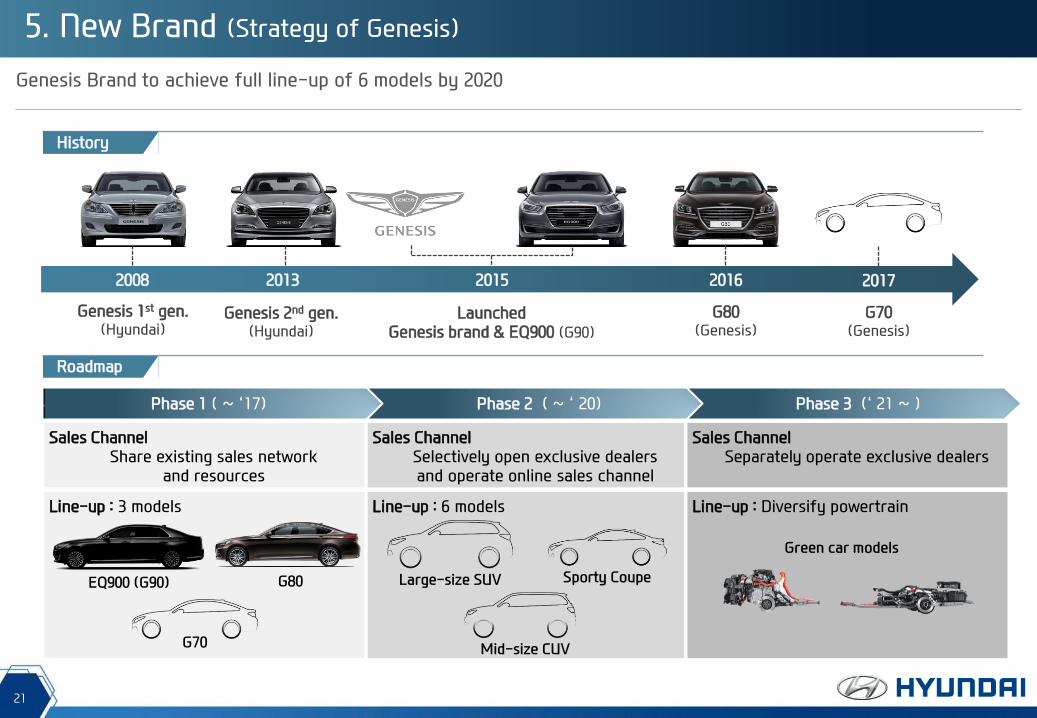
Genesis Brand to achieve full line-up of 6 models by 2020
Genesis 1st gen. (Hyundai)
Genesis 2nd gen. (Hyundai)
Launched Genesis brand & EQ900 (G90)
G80 (Genesis)
Phase 3 (‘ 21 ~ ) Phase 2 ( ~ ‘ 20) Phase 1 ( ~ ‘17)
Line-up : 3 models
Sales Channel Share existing sales network
and resources
Line-up : 6 models
Sales Channel Selectively open exclusive dealers and operate online sales channel
Line-up : Diversify powertrain
Sales Channel Separately operate exclusive dealers
2008 2013 2015 2016
History
Roadmap
5. New Brand (Strategy of Genesis)
G70 (Genesis)
2017

22
N will bring racetrack-capable vehicles to customers who truly love cars
5. New Brand (High Performance Vehicle, N sub-brand)
Three Principles of N brand Major Concept Models
RM16
Displacement: 2.0T GDI
Max. Power: 300 PS
Max. Torque: 39kg.m
N 2025 Vision Gran Turismo
Displacement: Hydrogen Fuel Cell
Max. Power: 884 PS
Balanced Performance
Delivers the value of harmonized performance
Emotional Delight
Maximize driver’s emotional delight of driving
Inspired Technology
Technology originated from WRC
RM14 Concept RM 16 Concept
Vision Gran Turismo
Introduce N sub-brand
Project RM (Racing Midship)
Inception of R&D N sub-brand launch
2014 2015 2012 - 2016 2017
1st N sub-brand model to be launched
24
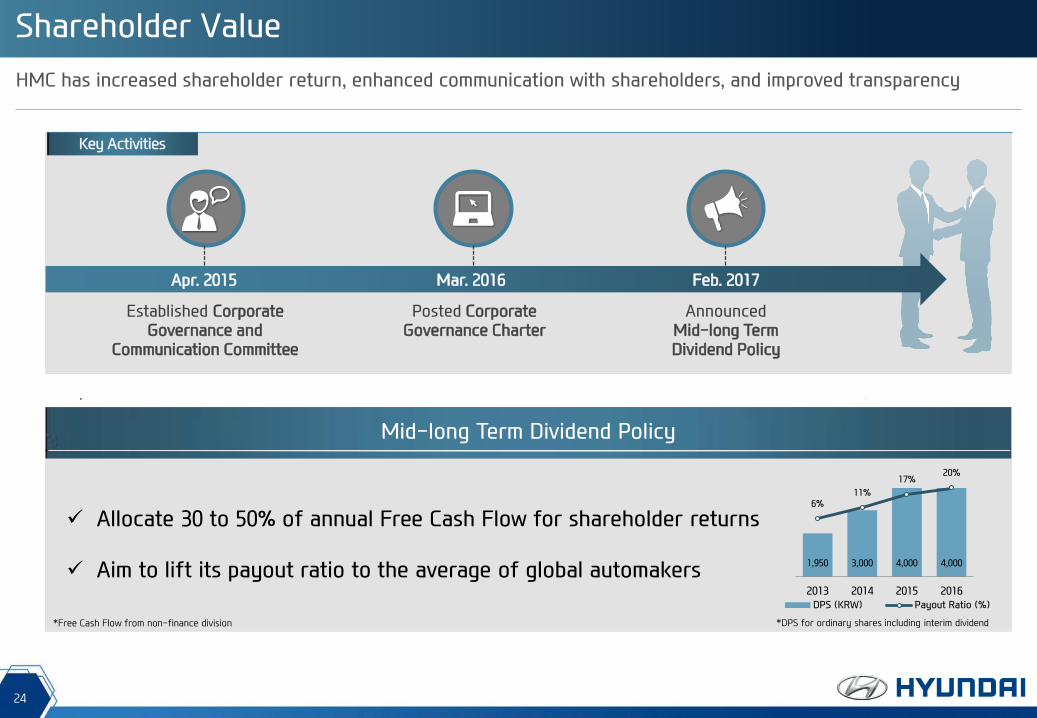
Shareholder Value
HMC has increased shareholder return, enhanced communication with shareholders, and improved transparency
Key Activities
Mid-long Term Dividend Policy
Allocate 30 to 50% of annual Free Cash Flow for shareholder returns
Aim to lift its payout ratio to the average of global automakers 1,950 3,000 4,000 4,000
6% 11%
17% 20%
-20%
-10%
0%
10%
20%
30%
0
1000
2000
3000
4000
5000
2013 2014 2015 2016
DPS (KRW) Payout Ratio (%)
*DPS for ordinary shares including interim dividend
Established Corporate Governance and
Communication Committee
Posted Corporate Governance Charter
Announced Mid-long Term Dividend Policy
Apr. 2015 Mar. 2016 Feb. 2017
*Free Cash Flow from non-finance division
26
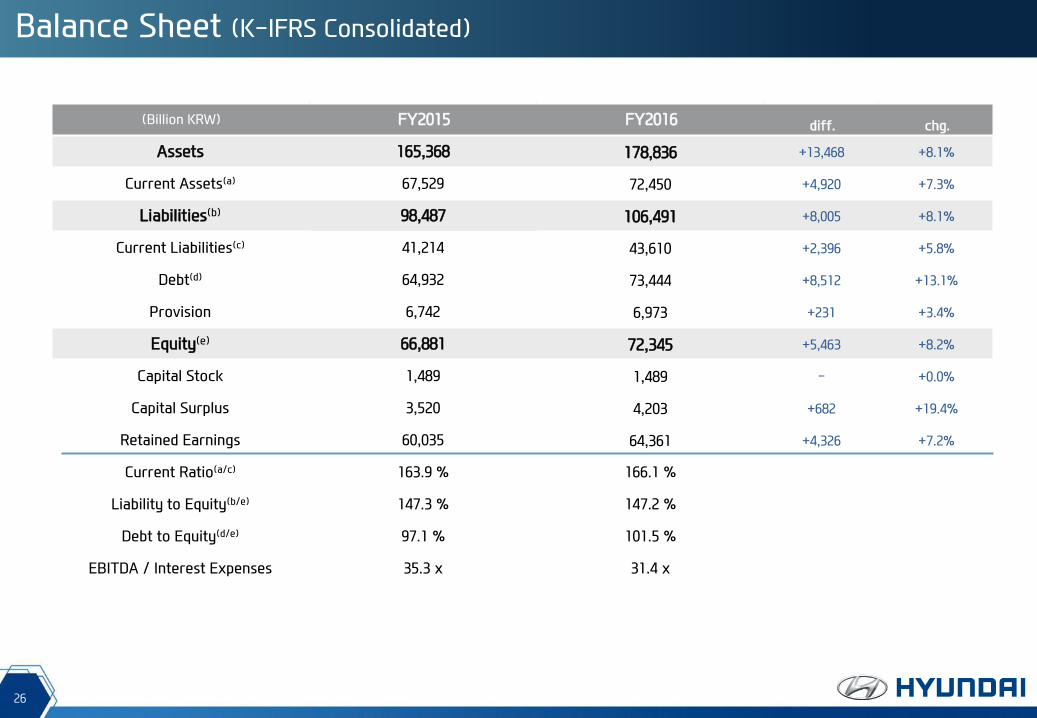
Balance Sheet (K-IFRS Consolidated)
(Billion KRW) FY2015 FY2016 diff. chg.
Assets 165,368 178,836 +13,468 +8.1%
Current Assets(a) 67,529 72,450 +4,920 +7.3%
Liabilities(b) 98,487 106,491 +8,005 +8.1%
Current Liabilities(c) 41,214 43,610 +2,396 +5.8%
Debt(d) 64,932 73,444 +8,512 +13.1%
Provision 6,742 6,973 +231 +3.4%
Equity(e) 66,881 72,345 +5,463 +8.2%
Capital Stock 1,489 1,489 - +0.0%
Capital Surplus 3,520 4,203 +682 +19.4%
Retained Earnings 60,035 64,361 +4,326 +7.2%
Current Ratio(a/c) 163.9 % 166.1 %
Liability to Equity(b/e) 147.3 % 147.2 %
Debt to Equity(d/e) 97.1 % 101.5 %
EBITDA / Interest Expenses 35.3 x 31.4 x
27
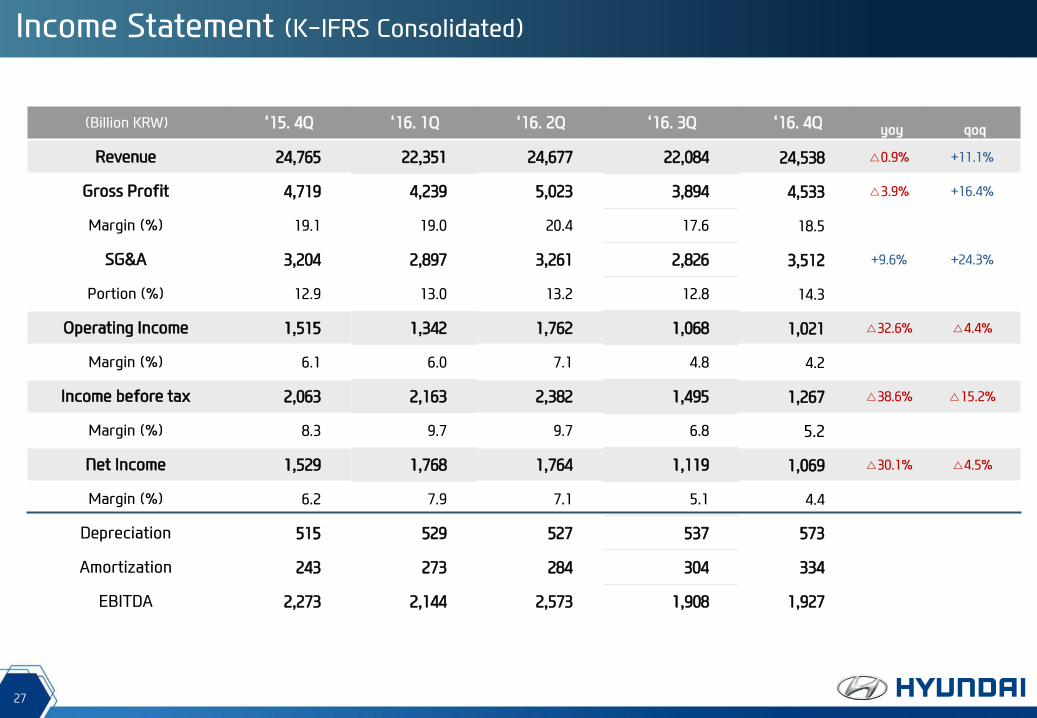
Income Statement (K-IFRS Consolidated)
(Billion KRW) ‘15. 4Q ‘16. 1Q ‘16. 2Q ‘16. 3Q ‘16. 4Q yoy qoq
Revenue 24,765 22,351 24,677 22,084 24,538 △0.9% +11.1%
Gross Profit 4,719 4,239 5,023 3,894 4,533 △3.9% +16.4%
Margin (%) 19.1 19.0 20.4 17.6 18.5
SG&A 3,204 2,897 3,261 2,826 3,512 +9.6% +24.3%
Portion (%) 12.9 13.0 13.2 12.8 14.3
Operating Income 1,515 1,342 1,762 1,068 1,021 △32.6% △4.4%
Margin (%) 6.1 6.0 7.1 4.8 4.2
Income before tax 2,063 2,163 2,382 1,495 1,267 △38.6% △15.2%
Margin (%) 8.3 9.7 9.7 6.8 5.2
Net Income 1,529 1,768 1,764 1,119 1,069 △30.1% △4.5%
Margin (%) 6.2 7.9 7.1 5.1 4.4
Depreciation 515 529 527 537 573
Amortization 243 273 284 304 334
EBITDA 2,273 2,144 2,573 1,908 1,927