Embed Size (px)
Citation preview
Multiple Myeloma
María-Victoria Mateos University Hospital of Salamanca- IBSAL
Salamanca. Spain
University of Salamanca
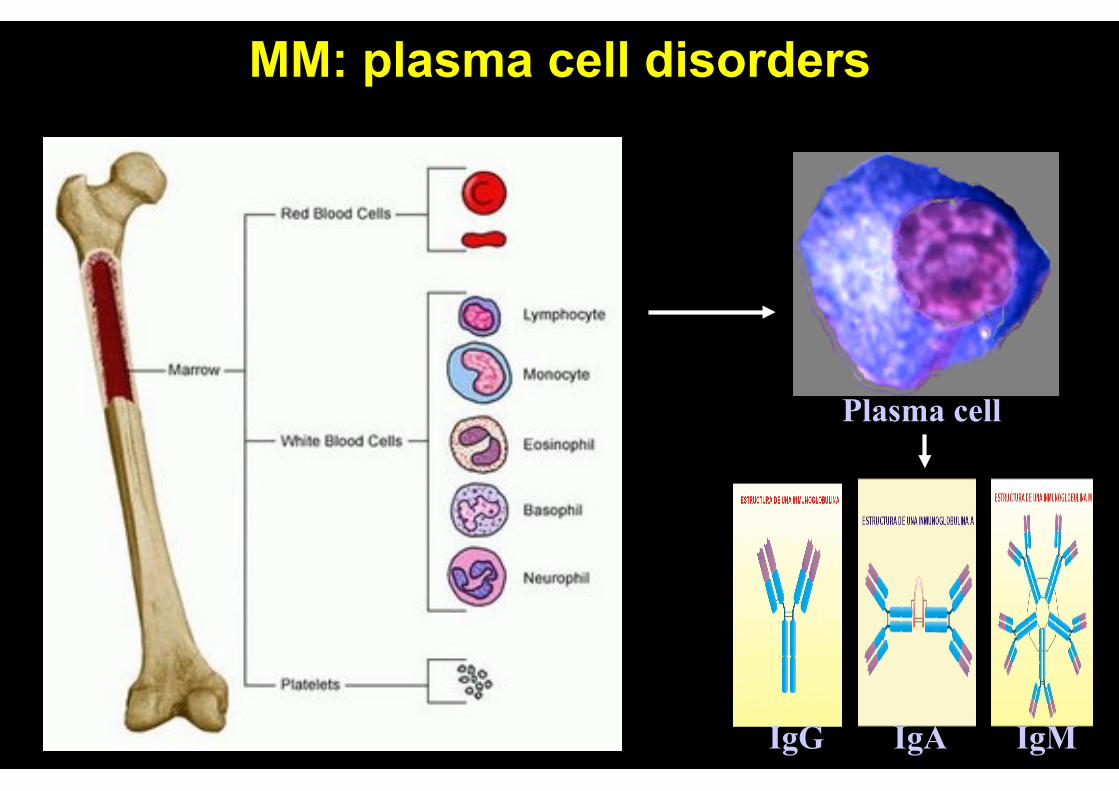
Plasma cell
MM: plasma cell disorders
IgG IgA IgM
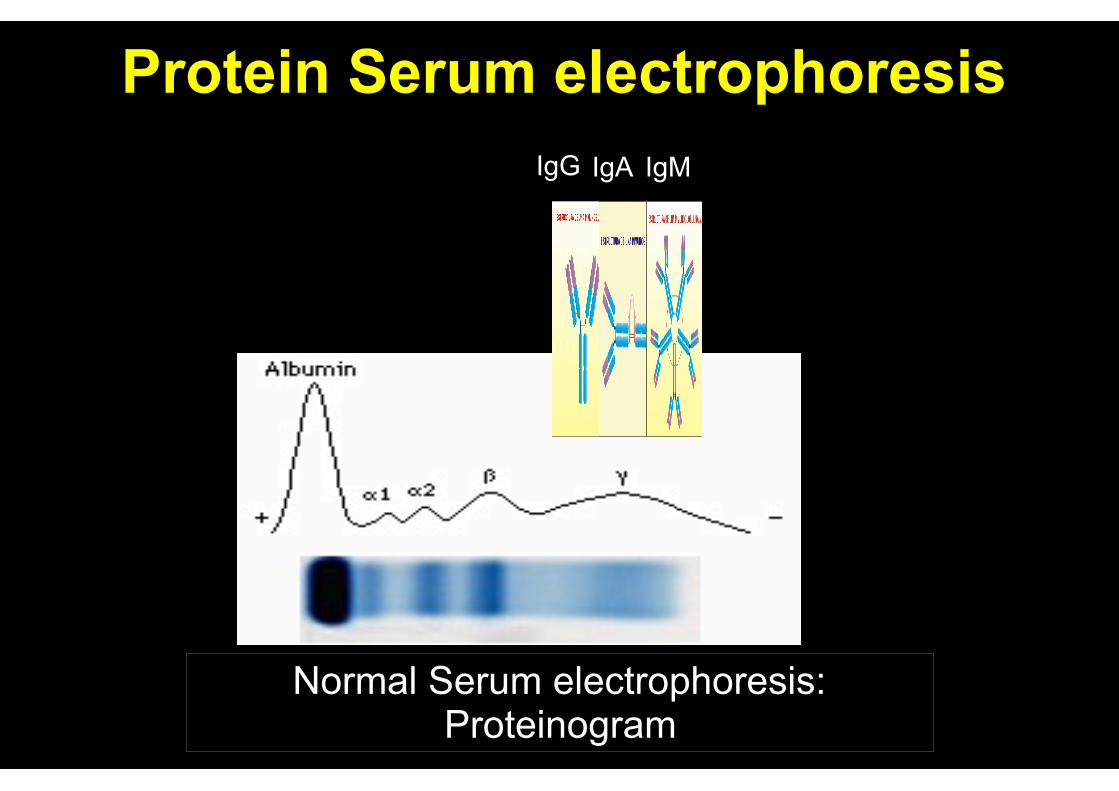
Protein Serum electrophoresis
Normal Serum electrophoresis: Proteinogram
IgG IgA IgM

Normal serum electrophoresis Serum M-protein: Monoclonal protein, M-spike
IgG IgA IgM
IgG IgG IgG IgG
Protein Serum electrophoresis
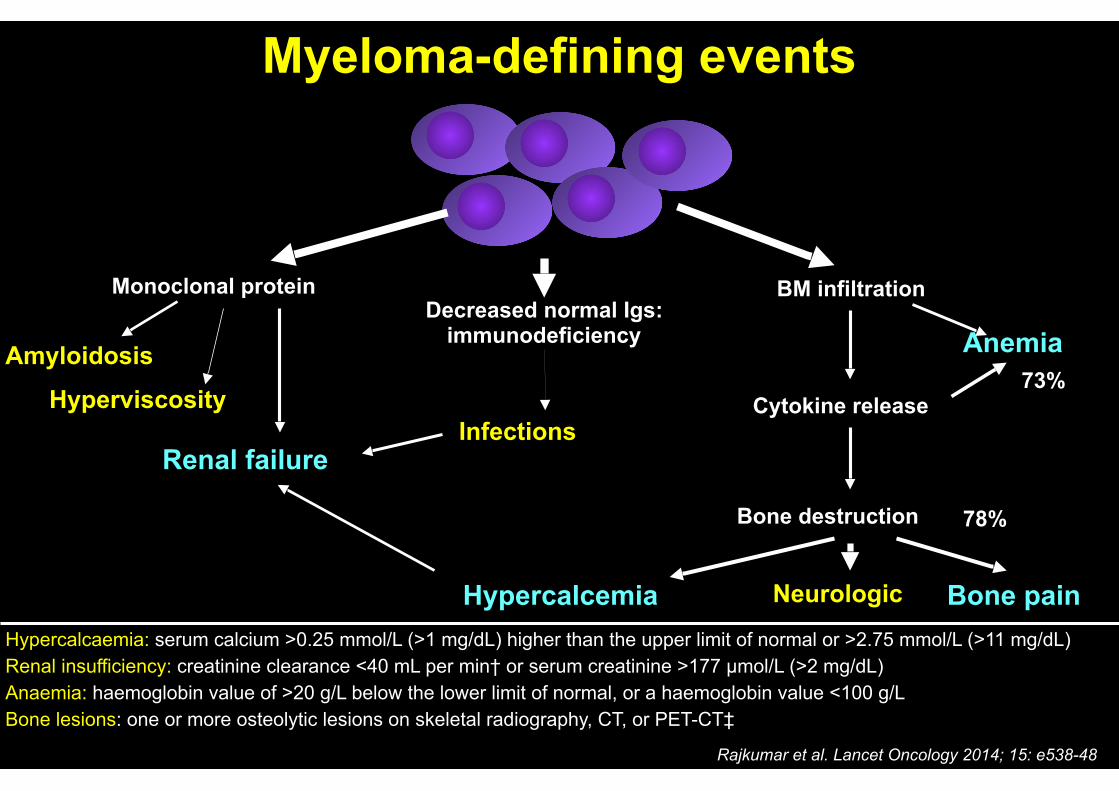
Myeloma-defining events
Decreased normal Igs: immunodeficiency
Monoclonal protein BM infiltration
Cytokine release
Bone destruction
Infections
Anemia
Hypercalcemia Bone pain
Amyloidosis
Hyperviscosity
Renal failure
Neurologic
78%
73%
Hypercalcaemia: serum calcium >0.25 mmol/L (>1 mg/dL) higher than the upper limit of normal or >2.75 mmol/L (>11 mg/dL) Renal insufficiency: creatinine clearance <40 mL per min† or serum creatinine >177 µmol/L (>2 mg/dL) Anaemia: haemoglobin value of >20 g/L below the lower limit of normal, or a haemoglobin value <100 g/L Bone lesions: one or more osteolytic lesions on skeletal radiography, CT, or PET-CT‡
Rajkumar et al. Lancet Oncology 2014; 15: e538-48
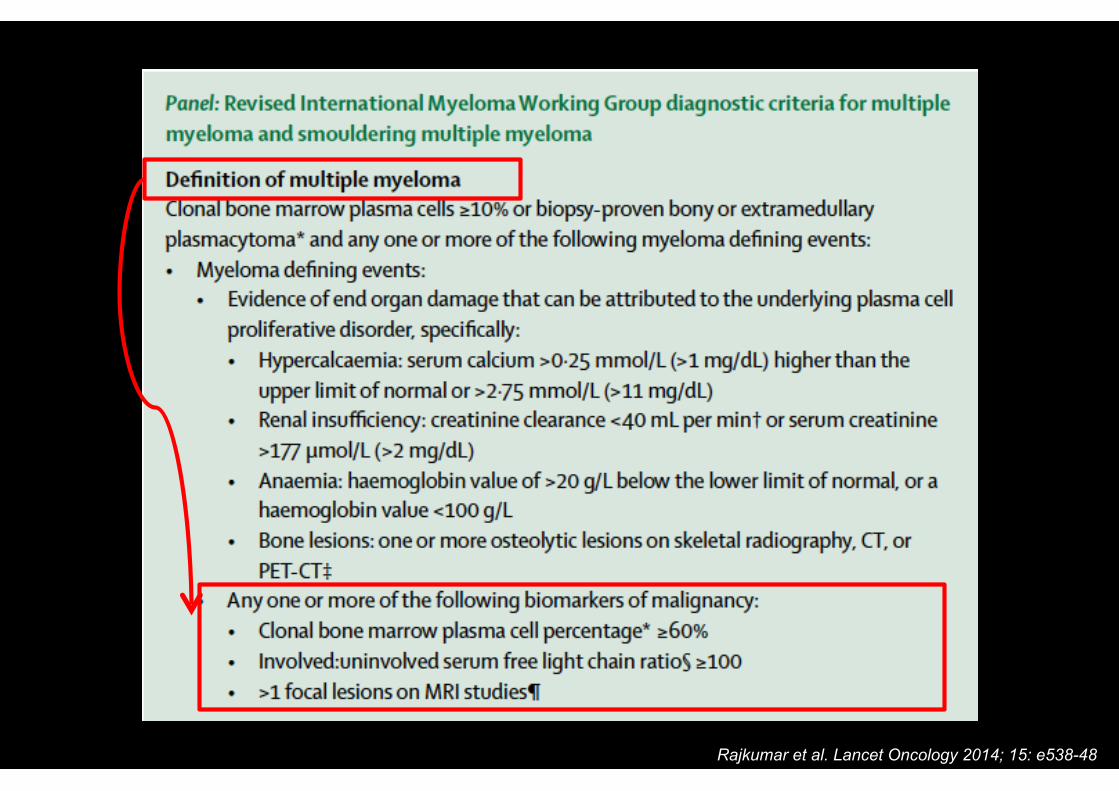
Rajkumar et al. Lancet Oncology 2014; 15: e538-48
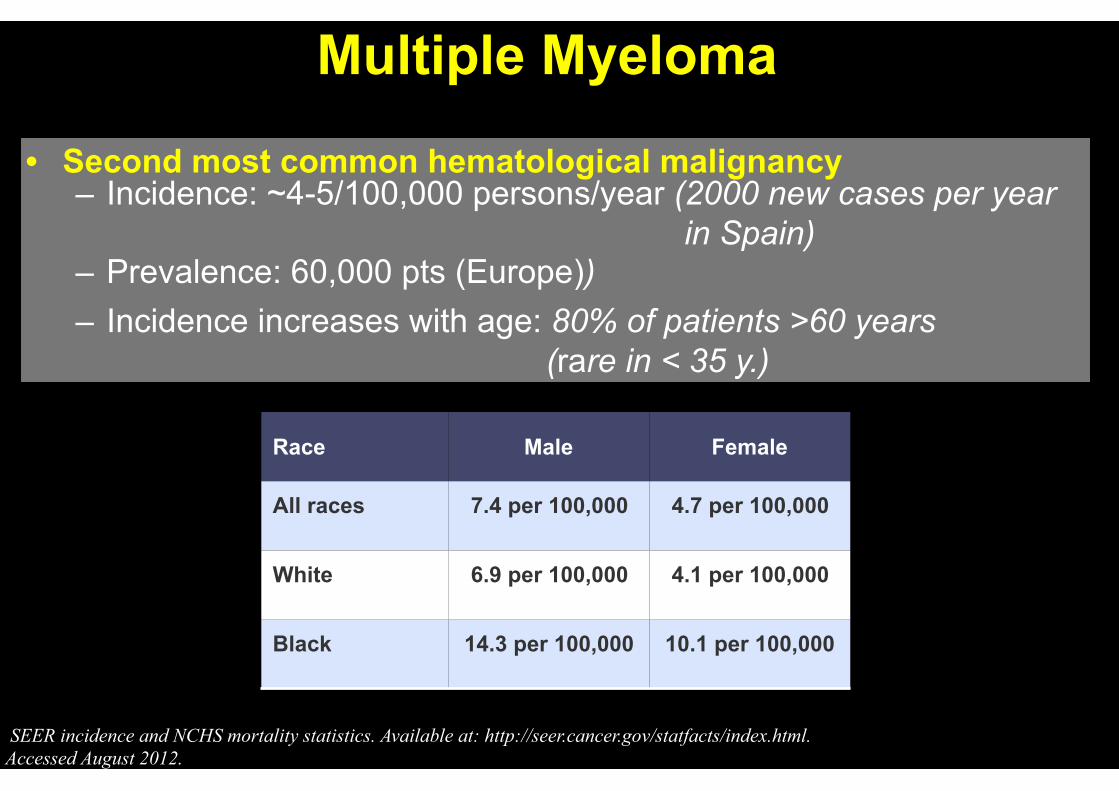
• Second most common hematological malignancy – Incidence: ~4-5/100,000 persons/year (2000 new cases per year in Spain) – Prevalence: 60,000 pts (Europe)) – Incidence increases with age: 80% of patients >60 years (rare in < 35 y.)
Multiple Myeloma
Race Male Female
All races 7.4 per 100,000 4.7 per 100,000
White 6.9 per 100,000 4.1 per 100,000
Black 14.3 per 100,000 10.1 per 100,000
SEER incidence and NCHS mortality statistics. Available at: http://seer.cancer.gov/statfacts/index.html. Accessed August 2012.
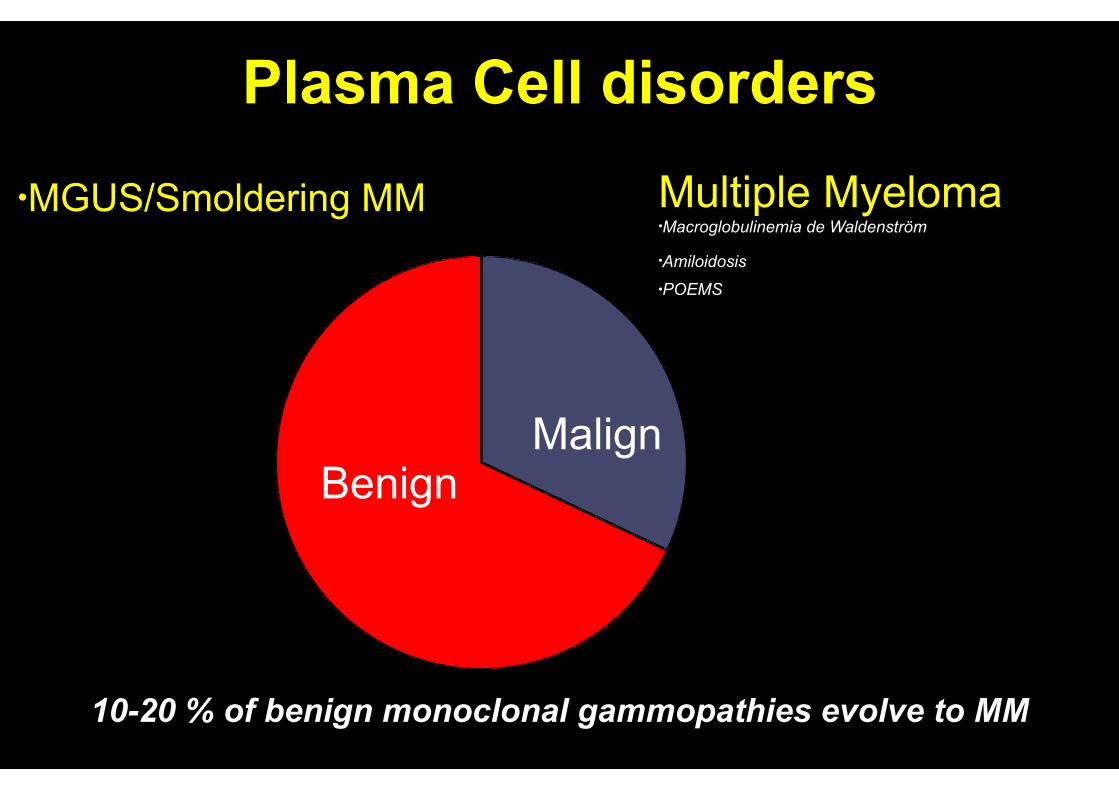
Plasma Cell disorders
MalignBenign
10-20 % of benign monoclonal gammopathies evolve to MM
Multiple Myeloma •Macroglobulinemia de Waldenström
•Amiloidosis •POEMS
•MGUS/Smoldering MM
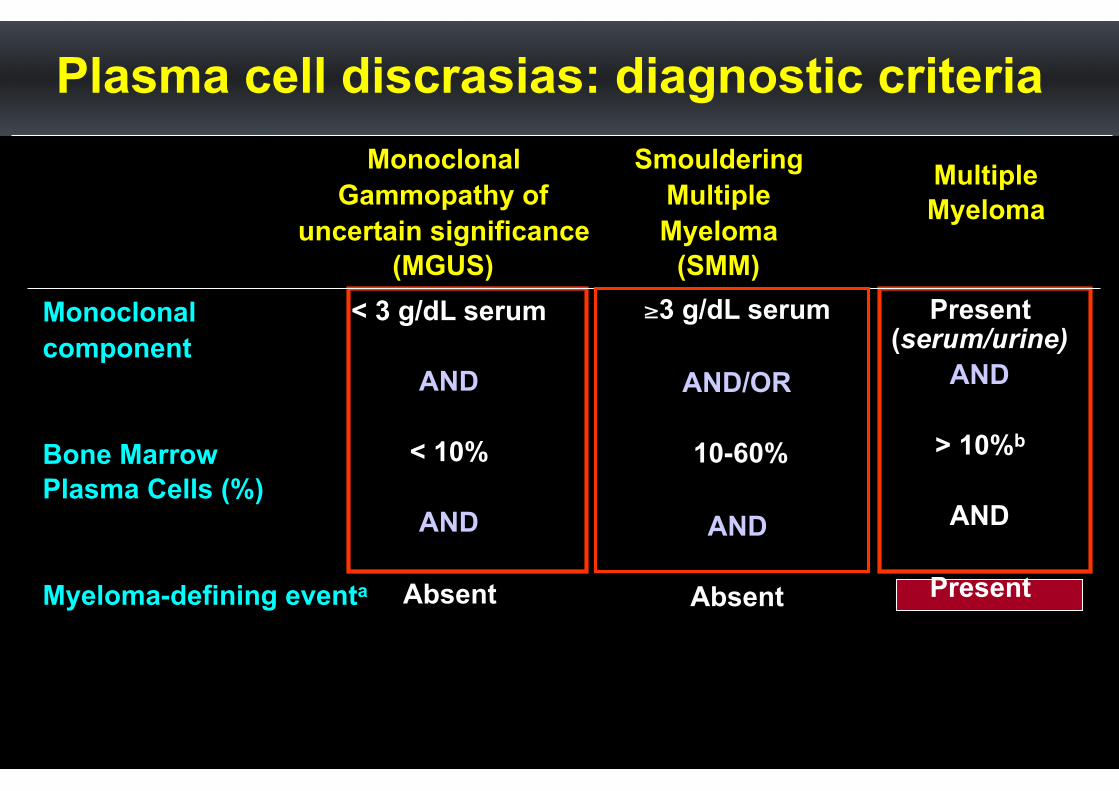
< 3 g/dL serum
AND
< 10%
AND
Absent
Monoclonal Gammopathy of
uncertain significance (MGUS)
Present(serum/urine)
AND
> 10%b
AND
Present
Multiple Myeloma
≥3 g/dL serum
AND/OR
10-60%
AND
Absent
Smouldering Multiple Myeloma
(SMM)Monoclonal component
Bone Marrow Plasma Cells (%)
Myeloma-defining eventa
Plasma cell discrasias: diagnostic criteria
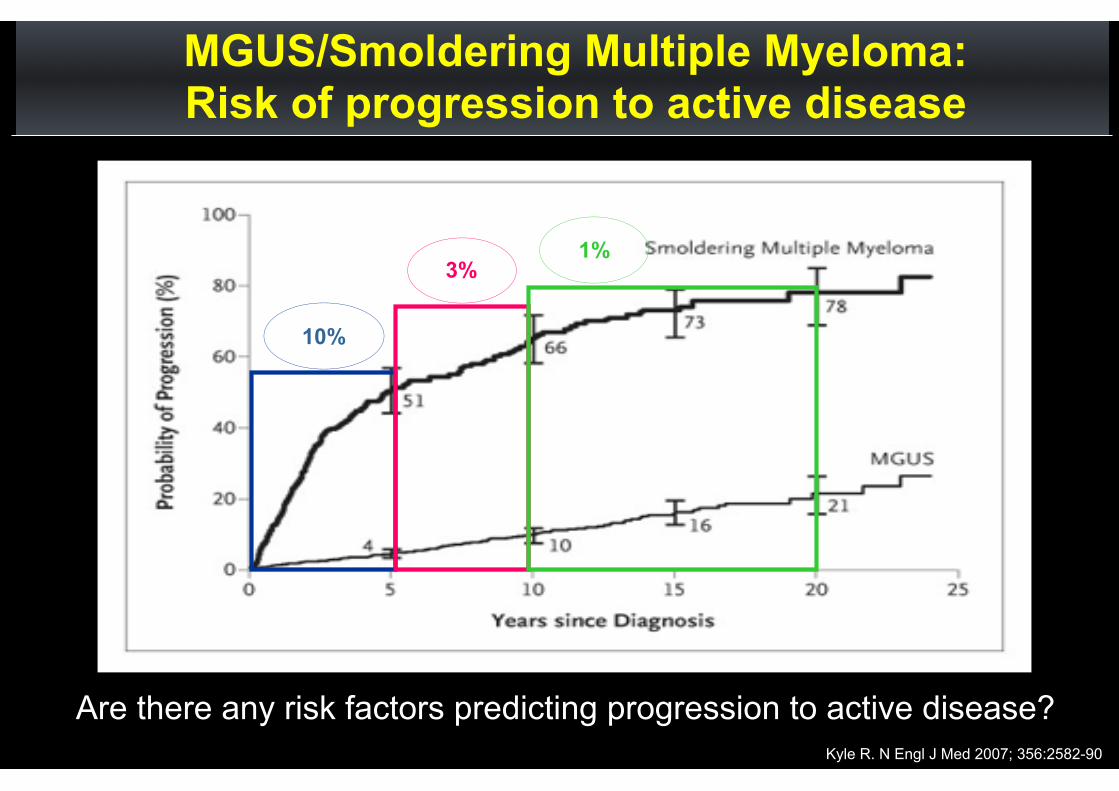
MGUS/Smoldering Multiple Myeloma: Risk of progression to active disease
Kyle R. N Engl J Med 2007; 356:2582-90
10%
3%1%
Are there any risk factors predicting progression to active disease?
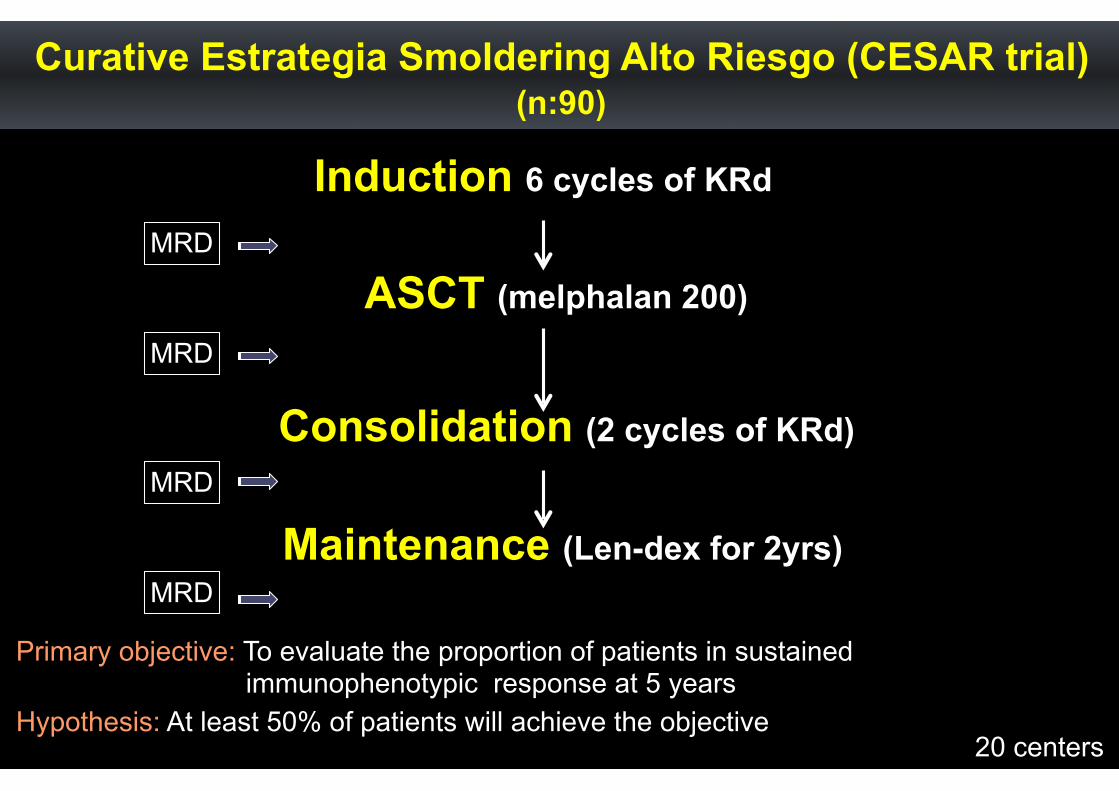
Curative Estrategia Smoldering Alto Riesgo (CESAR trial) (n:90)
Induction 6 cycles of KRd
ASCT (melphalan 200)
Maintenance (Len-dex for 2yrs)
Consolidation (2 cycles of KRd)
Primary objective: To evaluate the proportion of patients in sustained immunophenotypic response at 5 years Hypothesis: At least 50% of patients will achieve the objective
20 centers
MRD
MRD
MRD
MRD

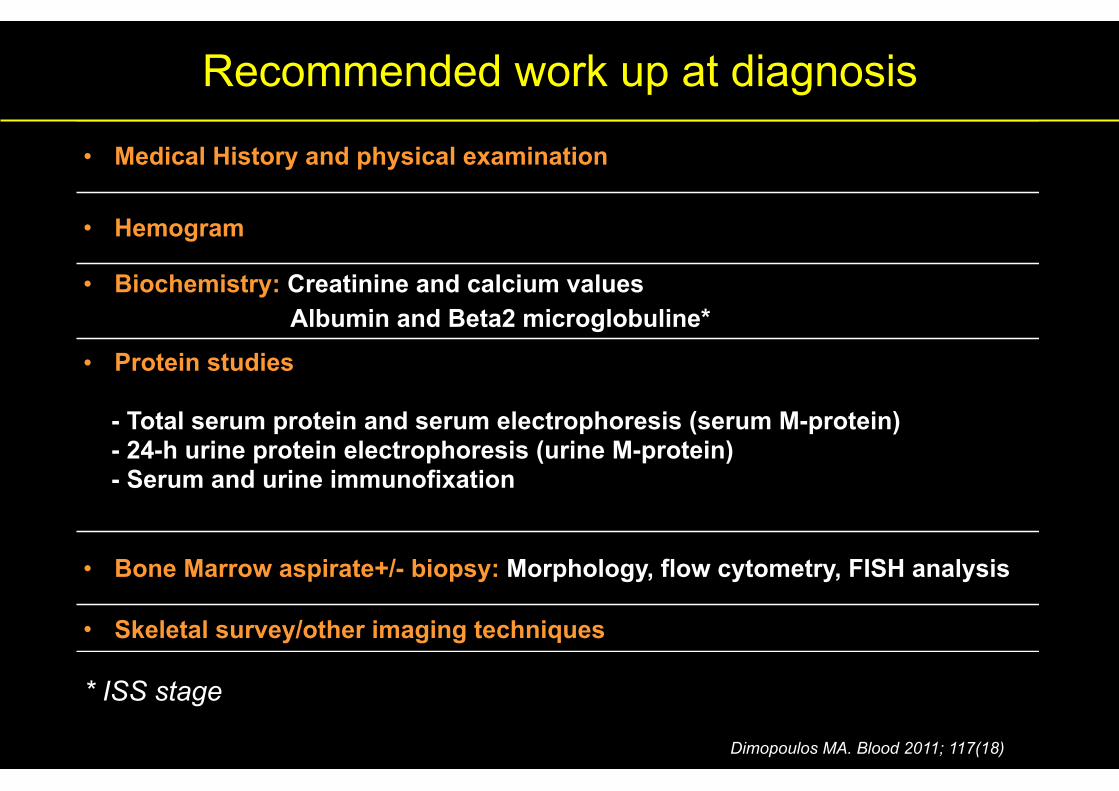
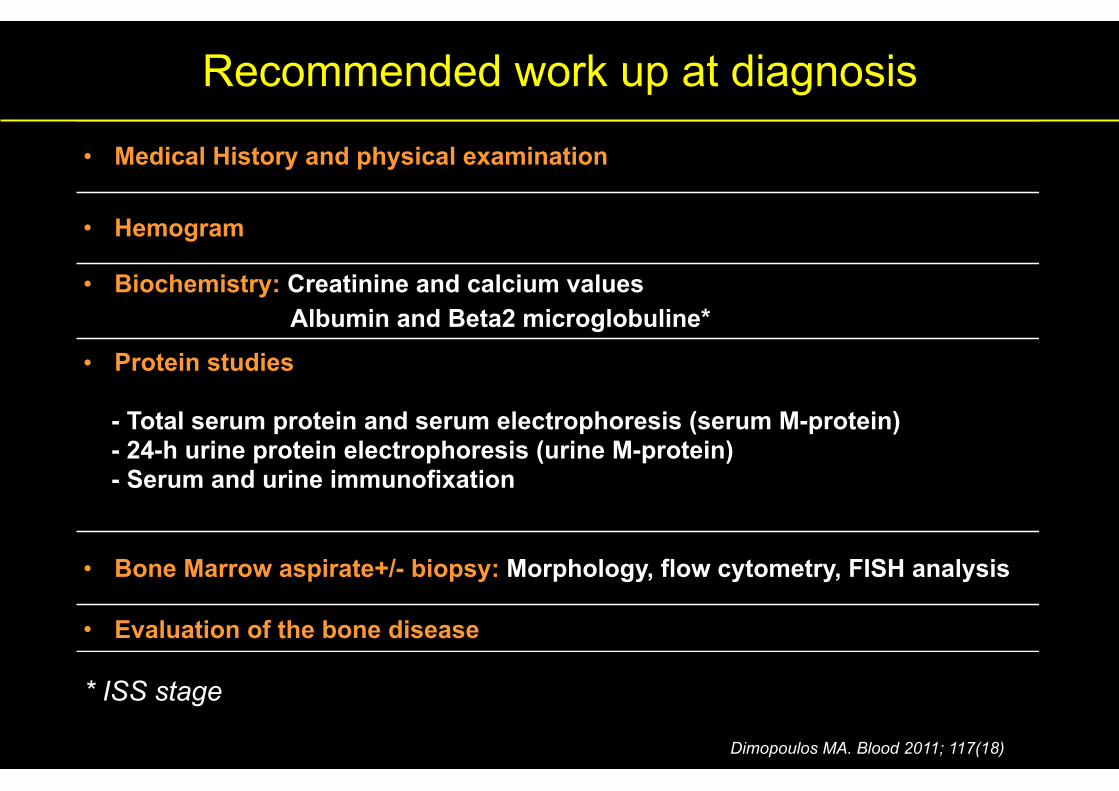
Recommended work up at diagnosis
• Medical History and physical examination
• Hemogram
• Biochemistry: Creatinine and calcium values Albumin and Beta2 microglobuline*
• Protein studies
- Total serum protein and serum electrophoresis (serum M-protein) - 24-h urine protein electrophoresis (urine M-protein) - Serum and urine immunofixation
• Bone Marrow aspirate+/- biopsy: Morphology, flow cytometry, FISH analysis
• Skeletal survey/other imaging techniques
Dimopoulos MA. Blood 2011; 117(18)
* ISS stage
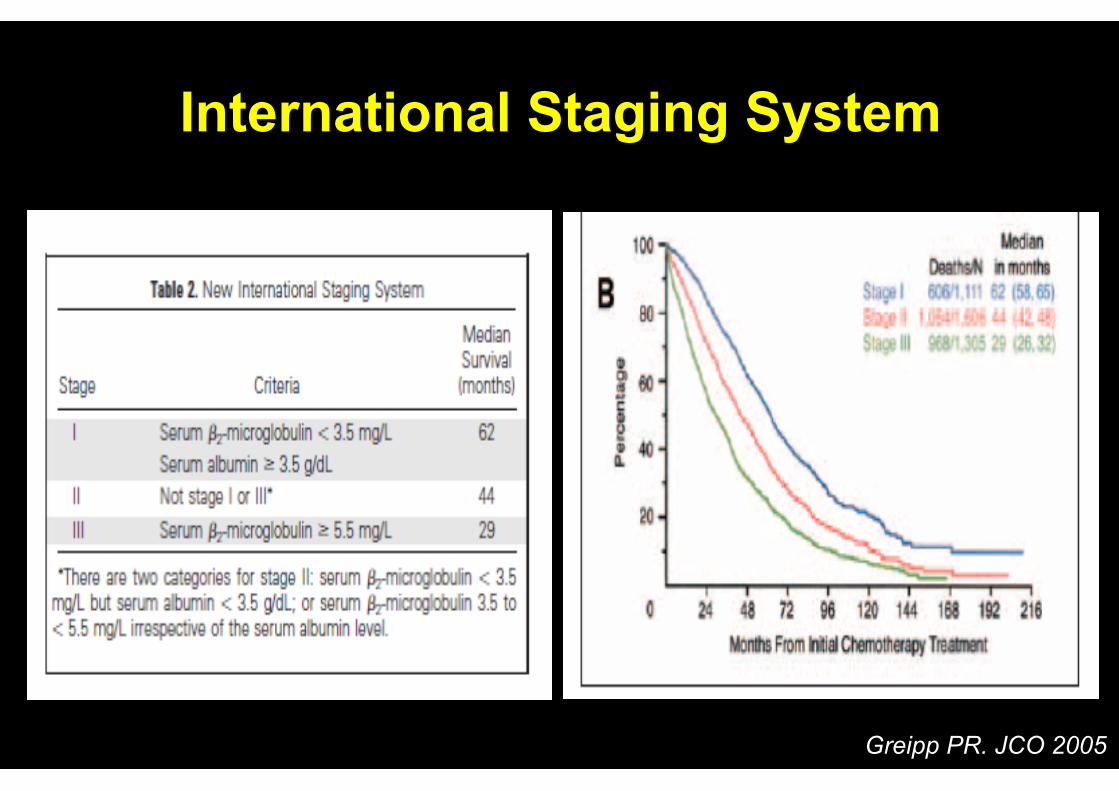
International Staging System
Greipp PR. JCO 2005

Recommended work up at diagnosis
• Medical History and physical examination
• Hemogram
• Biochemistry: Creatinine and calcium values Albumin and Beta2 microglobuline*
• Protein studies
- Total serum protein and serum electrophoresis (serum M-protein) - 24-h urine protein electrophoresis (urine M-protein) - Serum and urine immunofixation
• Bone Marrow aspirate+/- biopsy: Morphology, flow cytometry, FISH analysis
• Skeletal survey/other imaging techniques
Dimopoulos MA. Blood 2011; 117(18)
* ISS stage
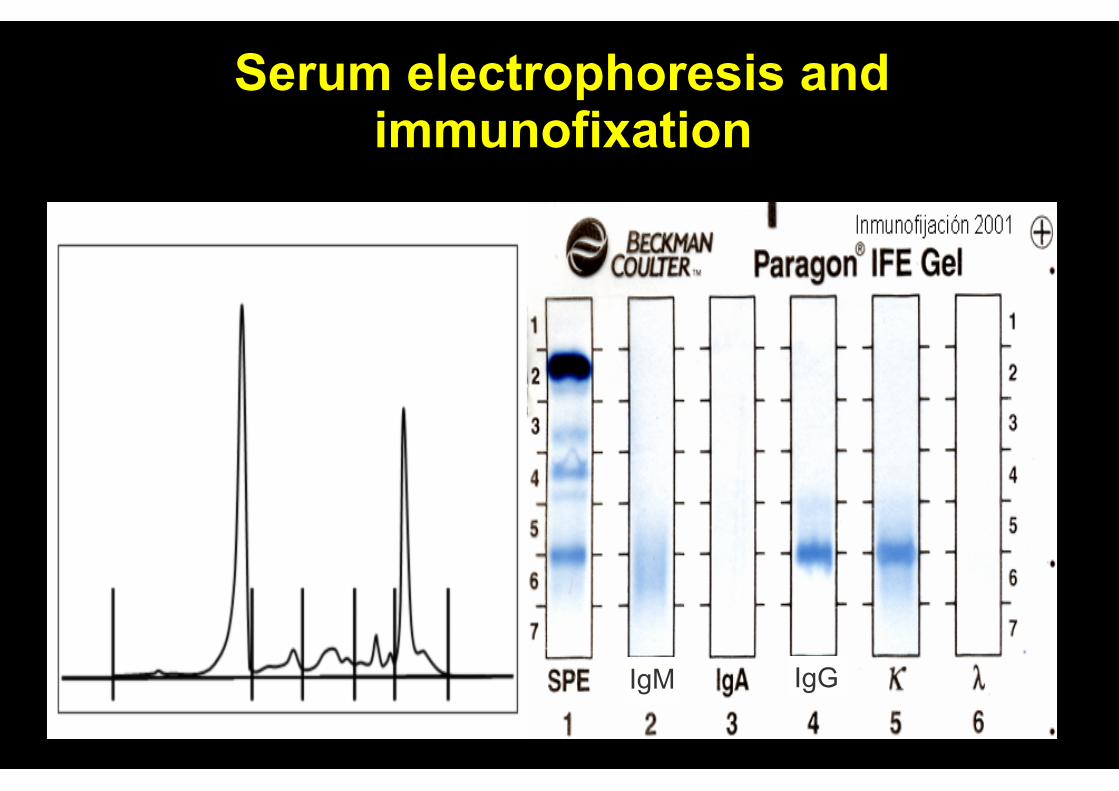
Serum electrophoresis and immunofixation
IgGIgM
Recommended work up at diagnosis
• Medical History and physical examination
• Hemogram
• Biochemistry: Creatinine and calcium values Albumin and Beta2 microglobuline*
• Protein studies
- Total serum protein and serum electrophoresis (serum M-protein) - 24-h urine protein electrophoresis (urine M-protein) - Serum and urine immunofixation
• Bone Marrow aspirate+/- biopsy: Morphology, flow cytometry, FISH analysis
• Skeletal survey/other imaging techniques
Dimopoulos MA. Blood 2011; 117(18)
* ISS stage
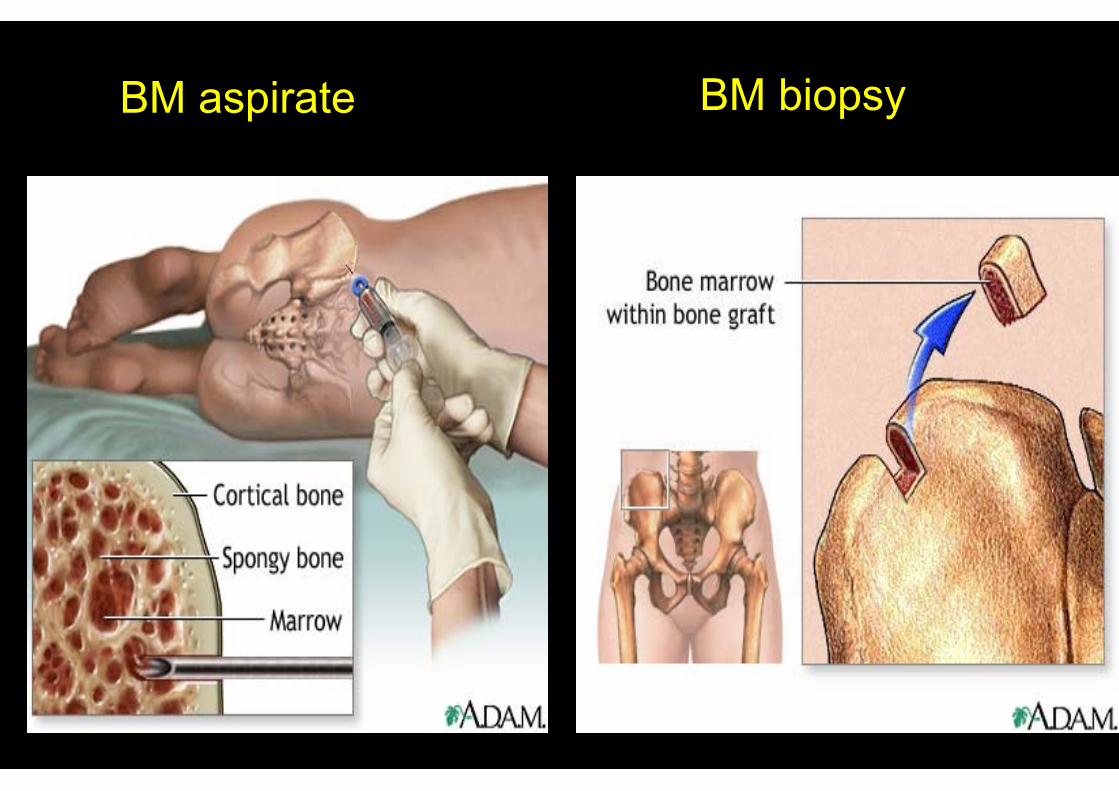
BM aspirate BM biopsy

BM aspirate: morphology
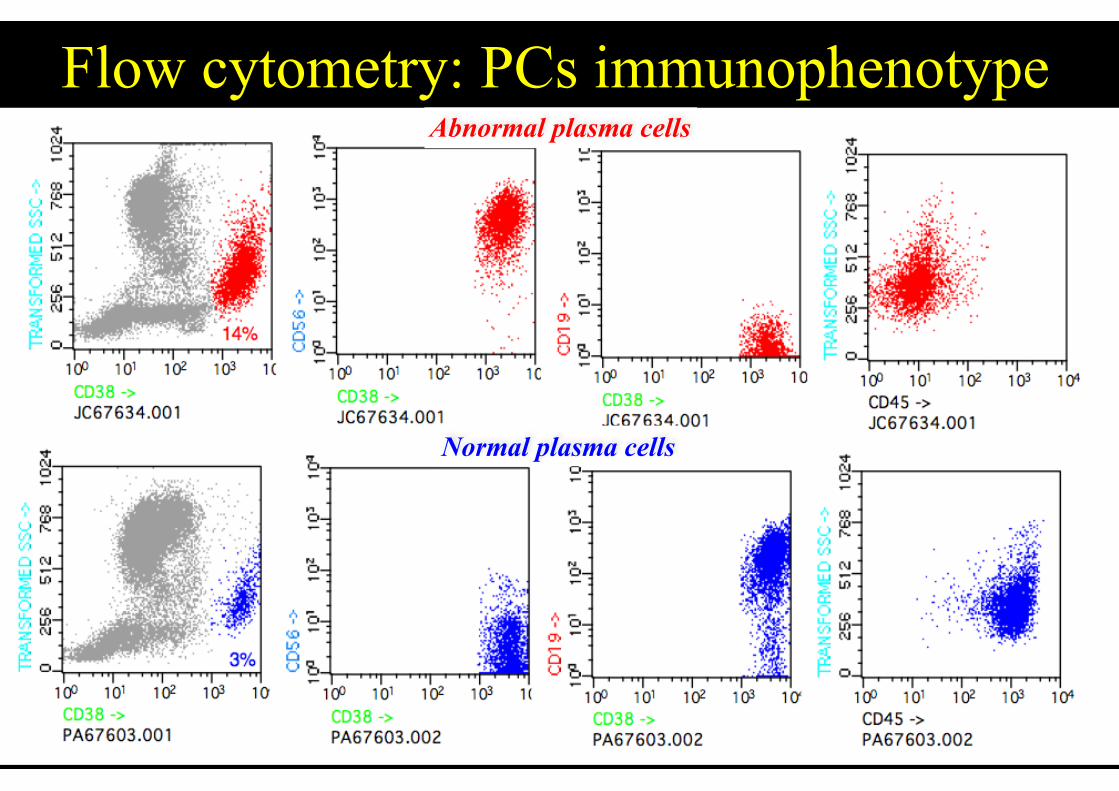
Flow cytometry: PCs immunophenotypeAbnormal plasma cells
Normal plasma cells
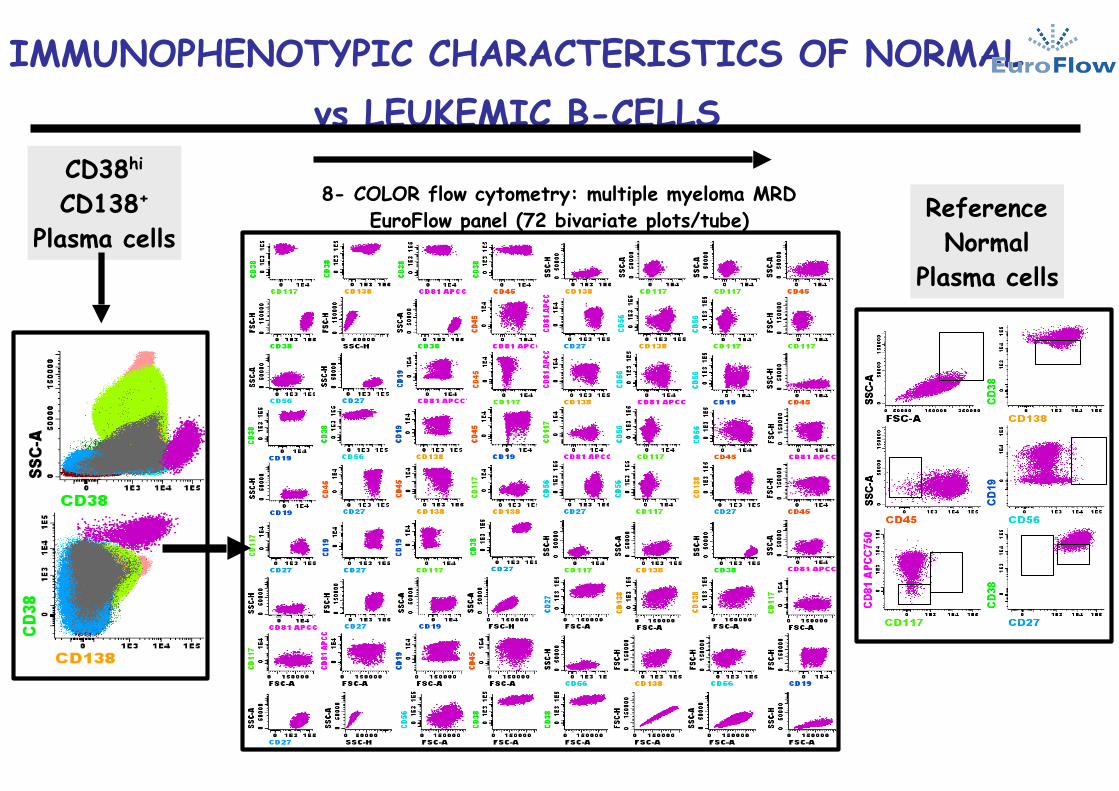
IMMUNOPHENOTYPIC CHARACTERISTICS OF NORMAL vs LEUKEMIC B-CELLS
CD38hi CD138+
Plasma cells
8- COLOR flow cytometry: multiple myeloma MRD EuroFlow panel (72 bivariate plots/tube) Reference
Normal Plasma cells
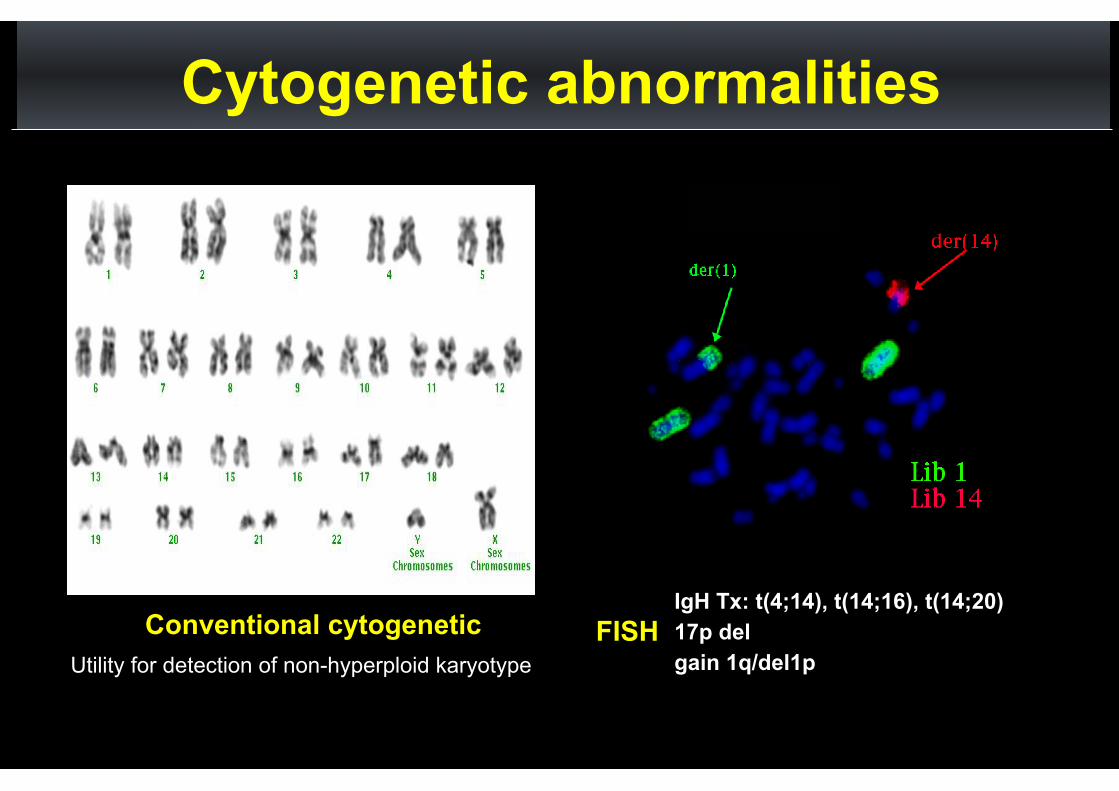
FISHConventional cytogenetic Utility for detection of non-hyperploid karyotype
Cytogenetic abnormalities
IgH Tx: t(4;14), t(14;16), t(14;20) 17p del gain 1q/del1p
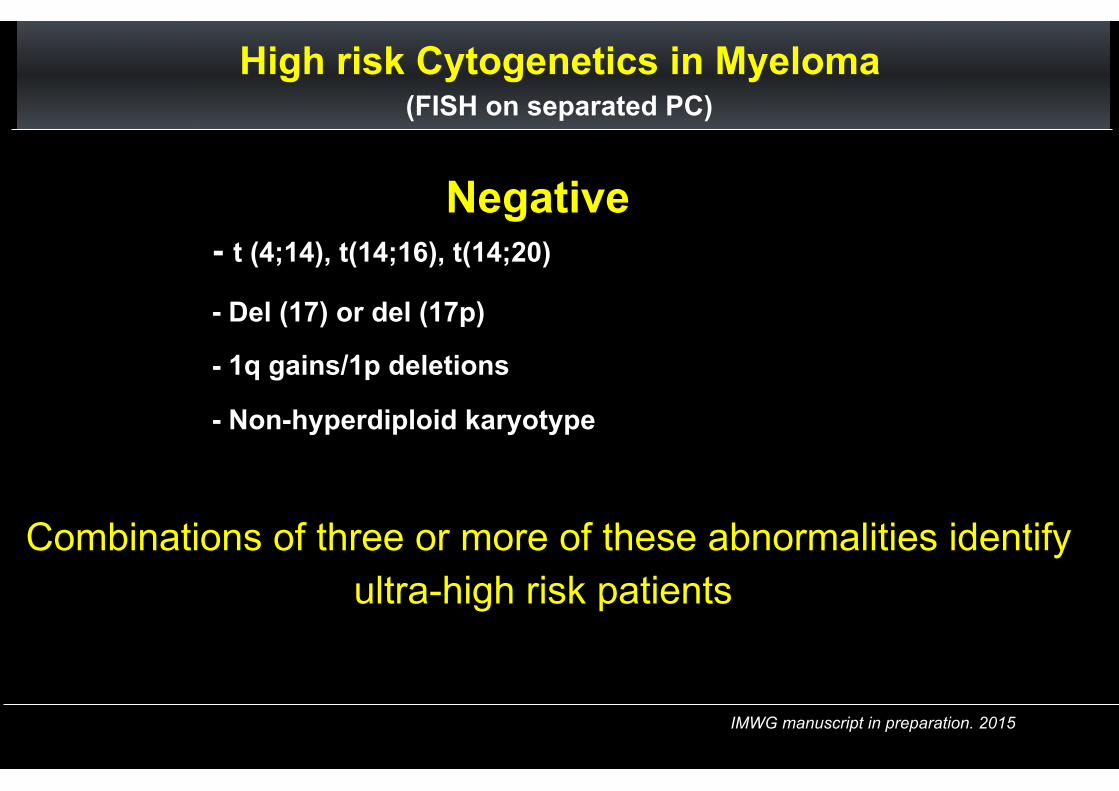
High risk Cytogenetics in Myeloma (FISH on separated PC)
Negative - t (4;14), t(14;16), t(14;20)
- Del (17) or del (17p)
- 1q gains/1p deletions
- Non-hyperdiploid karyotype
IMWG manuscript in preparation. 2015
Combinations of three or more of these abnormalities identify ultra-high risk patients
Recommended work up at diagnosis
• Medical History and physical examination
• Hemogram
• Biochemistry: Creatinine and calcium values Albumin and Beta2 microglobuline*
• Protein studies
- Total serum protein and serum electrophoresis (serum M-protein) - 24-h urine protein electrophoresis (urine M-protein) - Serum and urine immunofixation
• Bone Marrow aspirate+/- biopsy: Morphology, flow cytometry, FISH analysis
• Evaluation of the bone disease
Dimopoulos MA. Blood 2011; 117(18)
* ISS stage
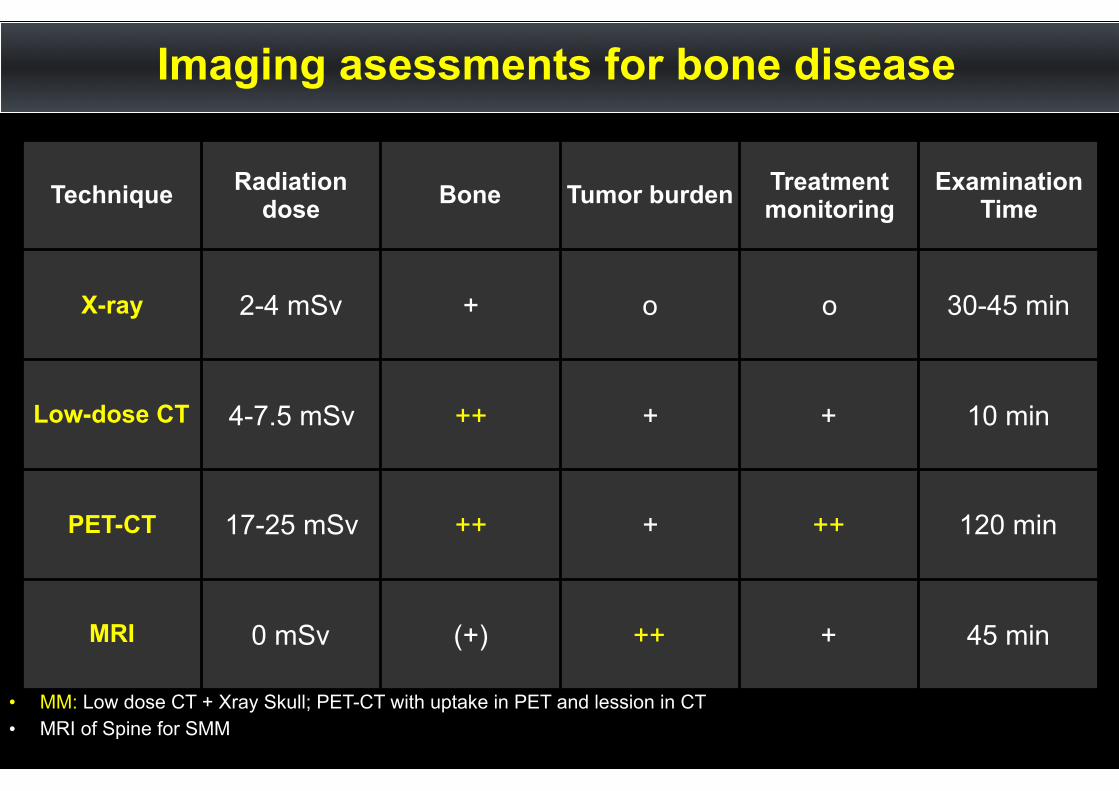
Technique Radiation dose Bone Tumor burden Treatment
monitoringExamination
Time
X-ray 2-4 mSv + o o 30-45 min
Low-dose CT 4-7.5 mSv ++ + + 10 min
PET-CT 17-25 mSv ++ + ++ 120 min
MRI 0 mSv (+) ++ + 45 min
Imaging asessments for bone disease
• MM: Low dose CT + Xray Skull; PET-CT with uptake in PET and lession in CT • MRI of Spine for SMM
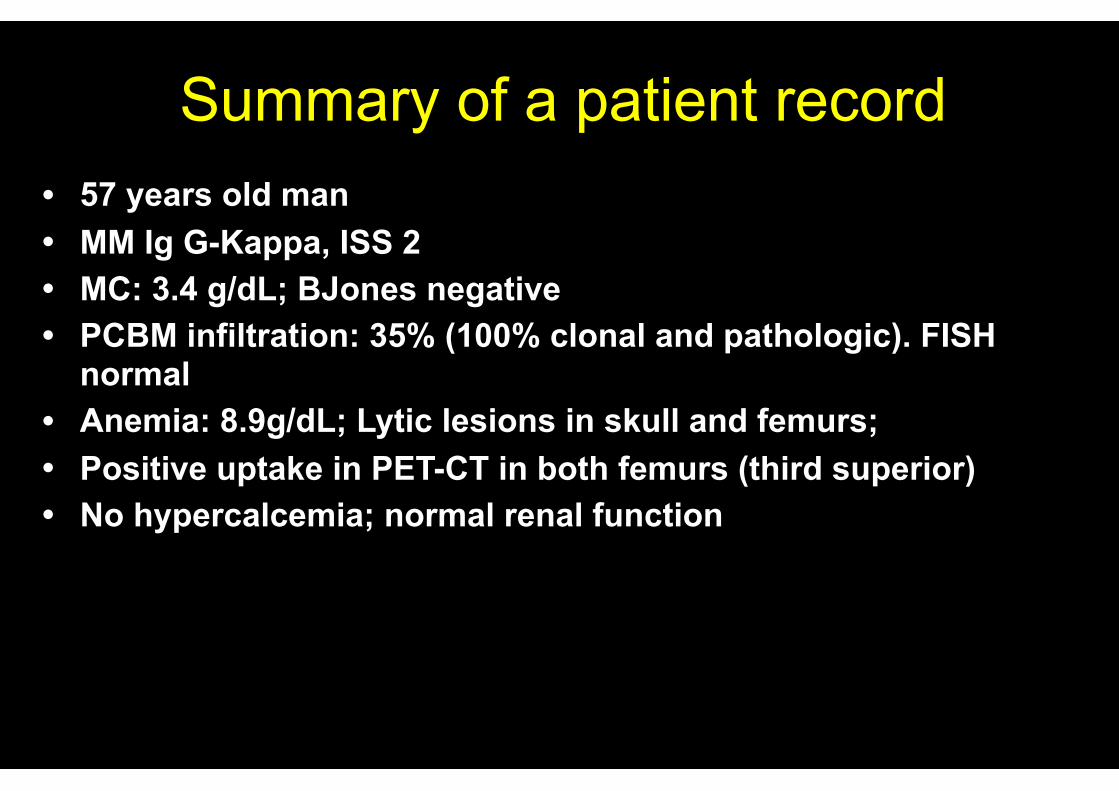
Summary of a patient record• 57 years old man • MM Ig G-Kappa, ISS 2 • MC: 3.4 g/dL; BJones negative • PCBM infiltration: 35% (100% clonal and pathologic). FISH
normal • Anemia: 8.9g/dL; Lytic lesions in skull and femurs; • Positive uptake in PET-CT in both femurs (third superior) • No hypercalcemia; normal renal function
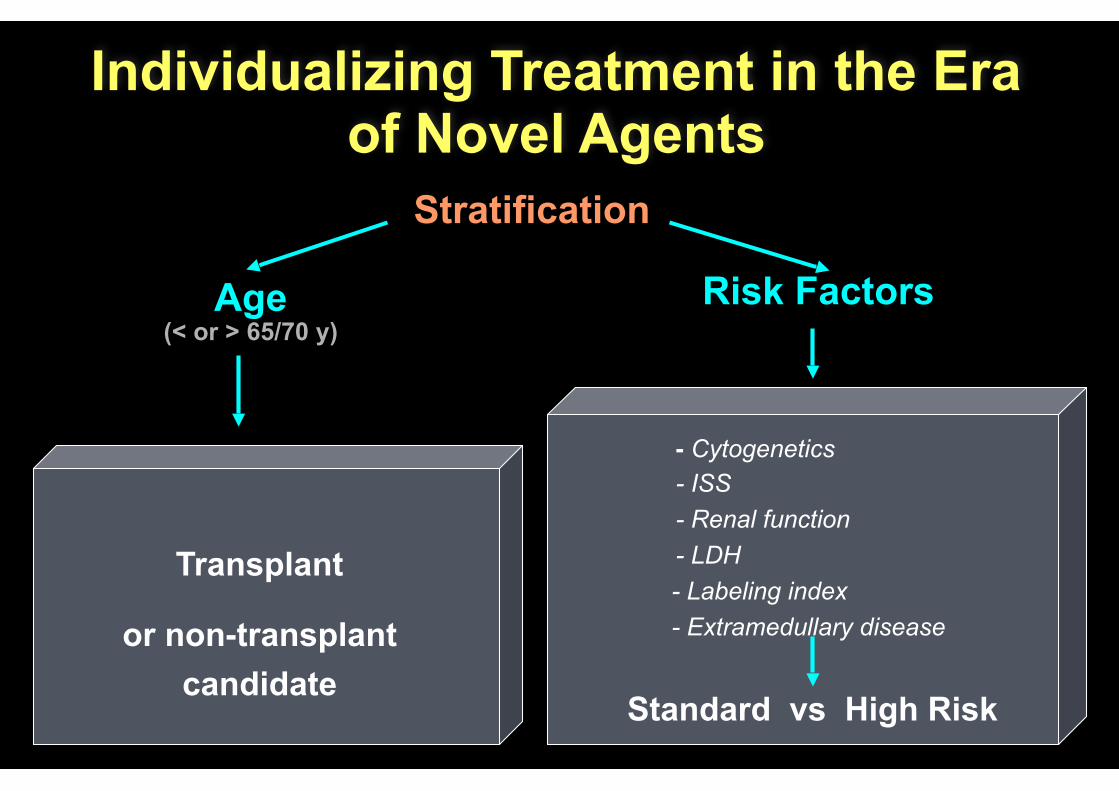
Individualizing Treatment in the Era
of Novel Agents
Transplant
or non-transplant candidate
- Cytogenetics - ISS - Renal function - LDH - Labeling index - Extramedullary disease
Standard vs High Risk
Stratification
Risk FactorsAge (< or > 65/70 y)
➢ Current Status and future directions
- The newly diagnosed
-The Transplant candidate patient (Young)
-The Non-Transplant candidate patient (Elderly)
Myeloma Treatment

Management of NDMM: Role of depth of response
Depth of response is related to TTP, PFS and OS
Depth of response Time to progression
MRPR
VGPRnCR
CRsCR
Treatment Initiation
TimeiCR
Niesvizky R, et al. Br J Haematol. 2008;143(1):46-53. Harousseau JL, et al. Haematologica. 2010;95(10):1738-1744. Dimopoulos MA, et al. Leukemia. 2010;24(10):1769-1778.
MR, minimal response; sCR, stringent complete response; iCR, immunophenotypic CR; TTP, time to progression.
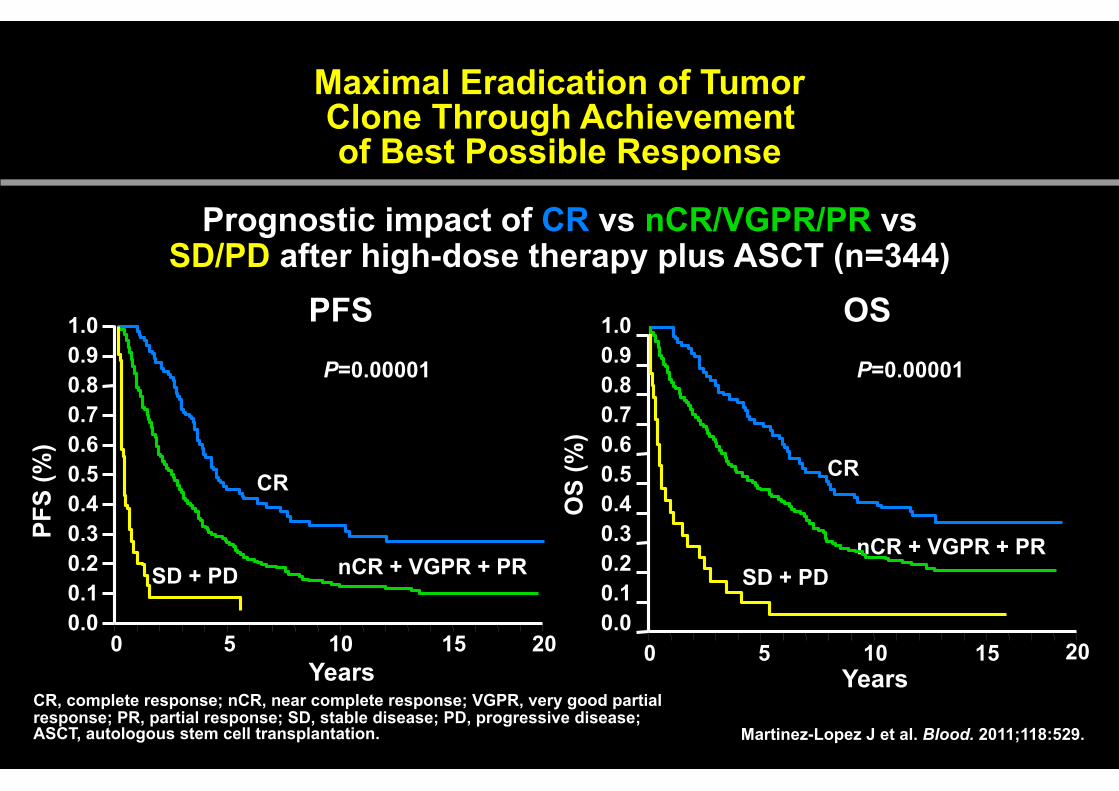
Maximal Eradication of Tumor Clone Through Achievement of Best Possible Response
Prognostic impact of CR vs nCR/VGPR/PR vs SD/PD after high-dose therapy plus ASCT (n=344)
PFS OS
Martinez-Lopez J et al. Blood. 2011;118:529.
CR
nCR + VGPR + PRSD + PD
CR
nCR + VGPR + PRSD + PD
0 5 10 15 20
0.10.20.3
0.5
0.91.0
0.80.70.6
0.4
0.0
Years
PFS
(%)
P=0.00001
0 5 10 15 20Years
OS
(%)
P=0.00001
0.10.20.3
0.5
0.91.0
0.80.70.6
0.4
0.0
CR, complete response; nCR, near complete response; VGPR, very good partial response; PR, partial response; SD, stable disease; PD, progressive disease; ASCT, autologous stem cell transplantation.
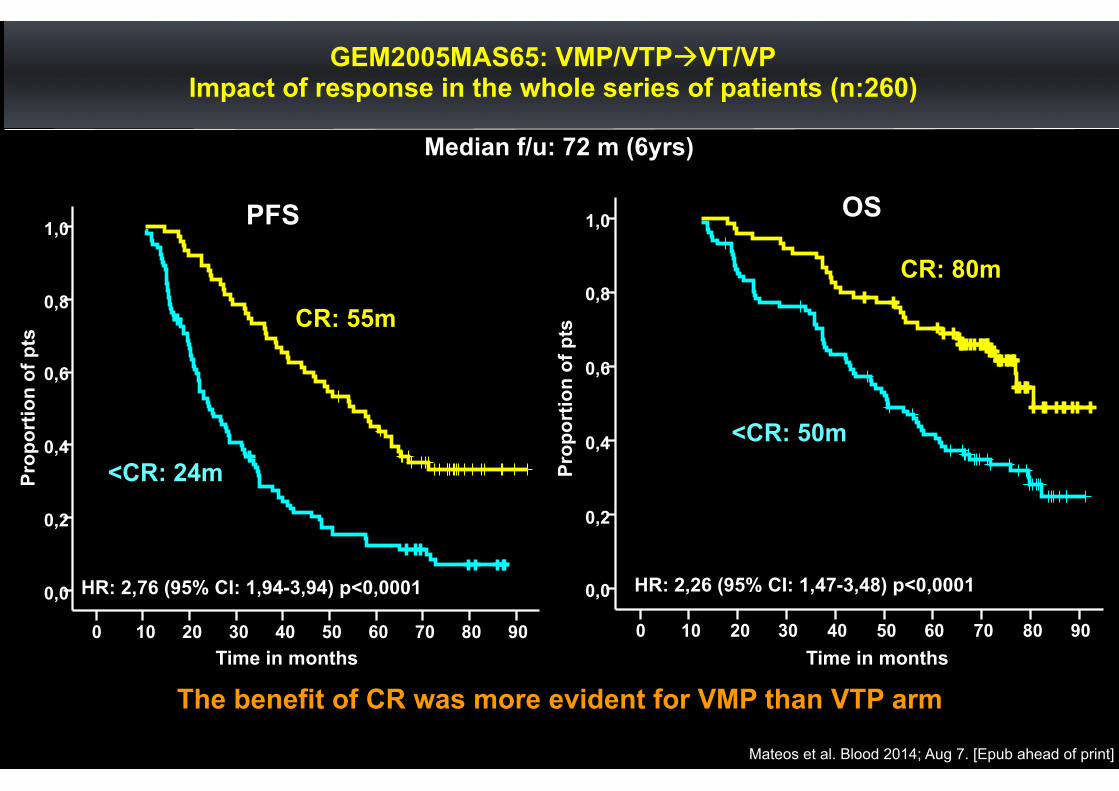
GEM2005MAS65: VMP/VTP!VT/VP Impact of response in the whole series of patients (n:260)
Prop
ortio
n of
pts
Time in months
<CR: 24m
CR: 55m
PFS
Time in months
<CR: 50m
CR: 80m
OS
HR: 2,76 (95% CI: 1,94-3,94) p<0,0001Pr
opor
tion
of p
ts
HR: 2,26 (95% CI: 1,47-3,48) p<0,0001
Median f/u: 72 m (6yrs)
9080706050403020100
1,0
0,8
0,6
0,4
0,2
0,0
9080706050403020100
1,0
0,8
0,6
0,4
0,2
0,0
The benefit of CR was more evident for VMP than VTP arm
Mateos et al. Blood 2014; Aug 7. [Epub ahead of print]
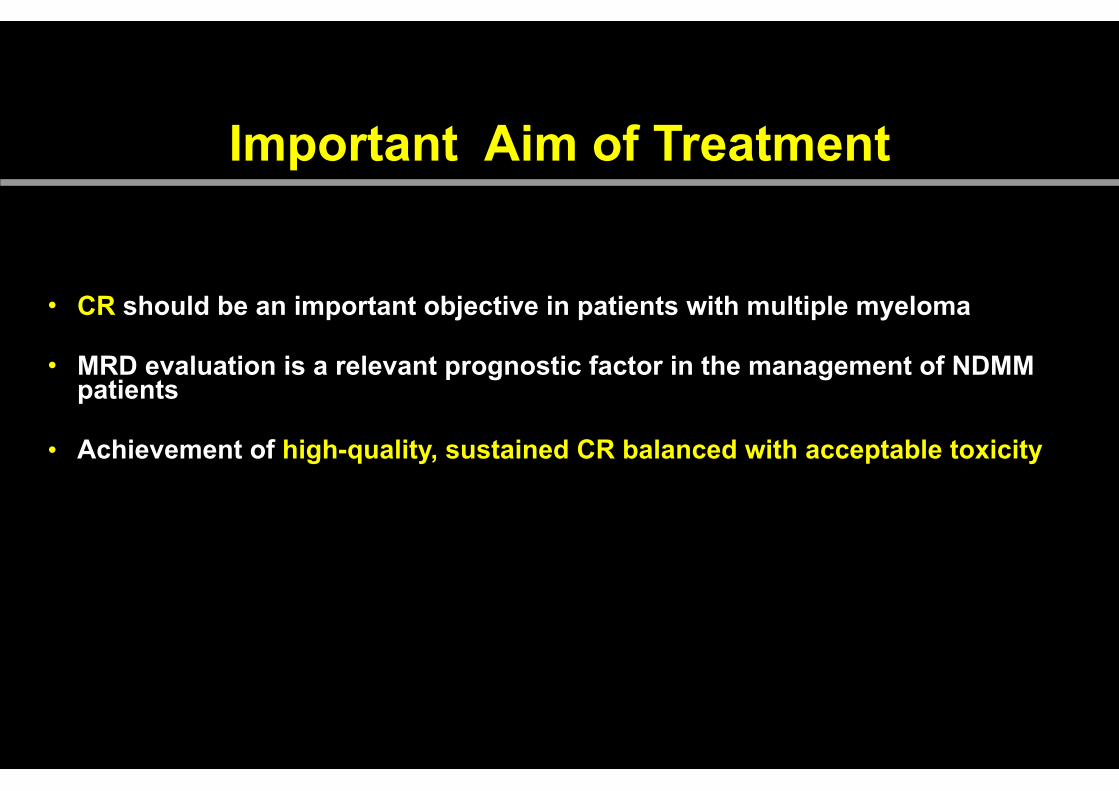
Important Aim of Treatment
• CR should be an important objective in patients with multiple myeloma
• MRD evaluation is a relevant prognostic factor in the management of NDMM patients
• Achievement of high-quality, sustained CR balanced with acceptable toxicity
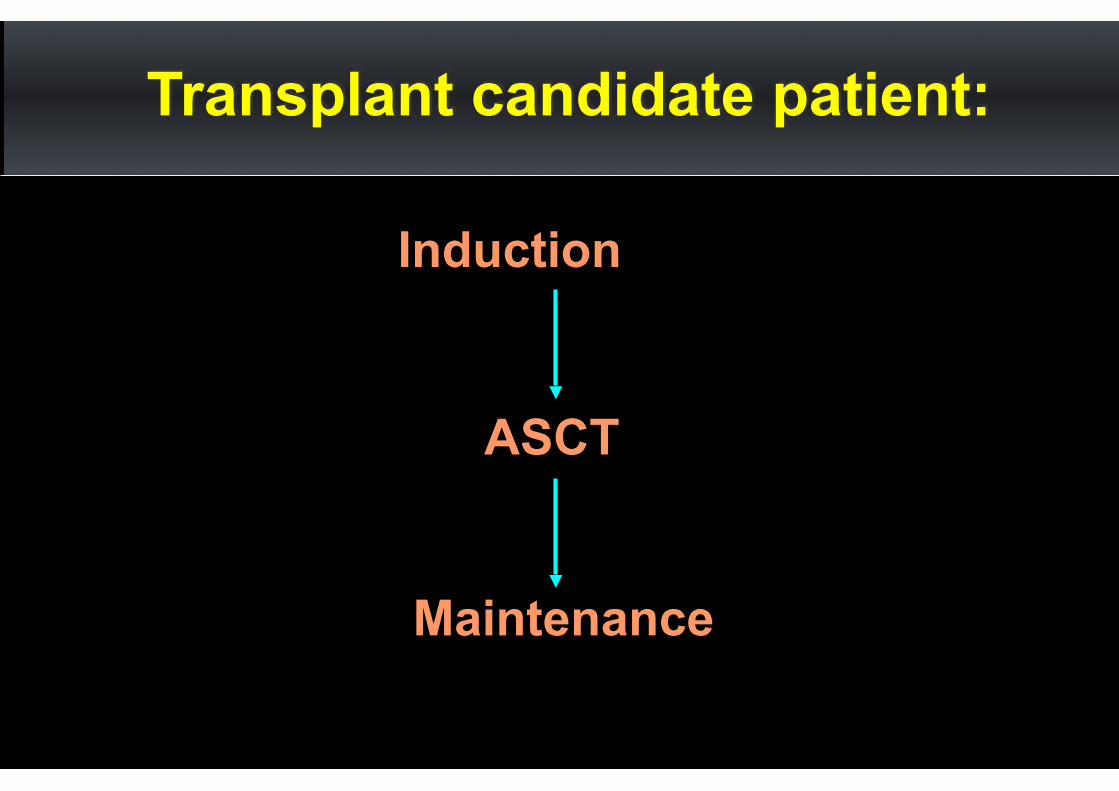
Transplant candidate patient:
Induction
ASCT
Maintenance
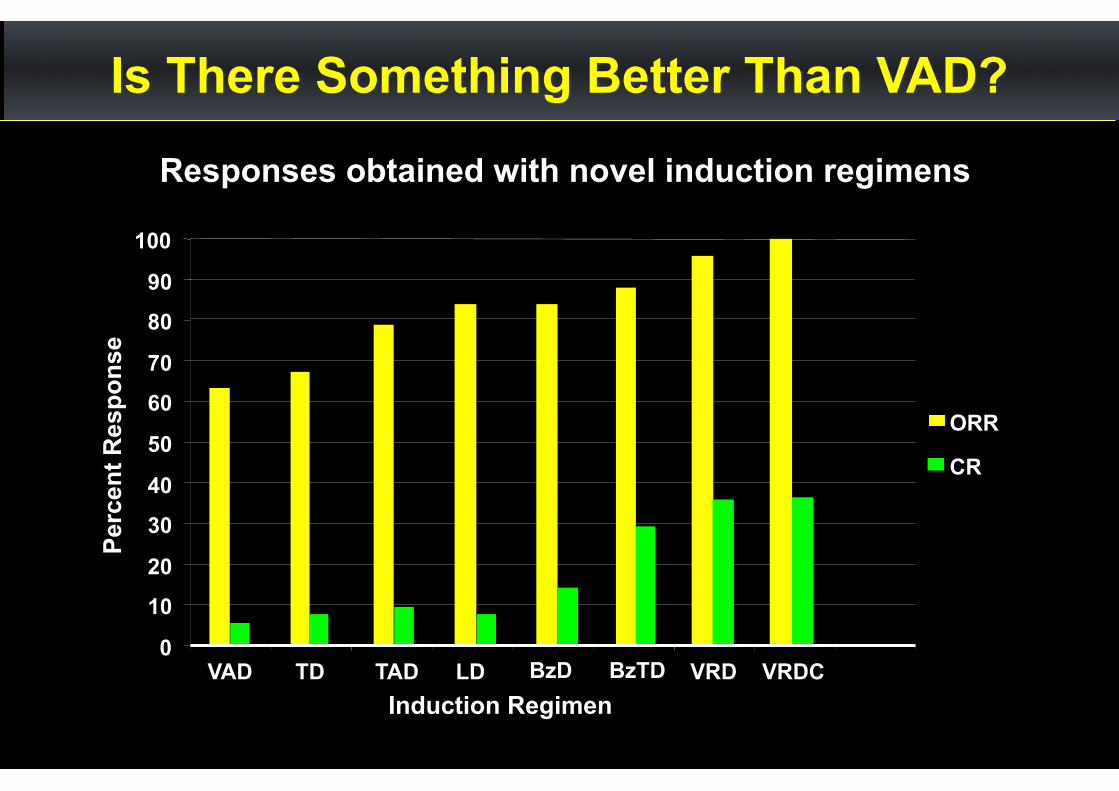
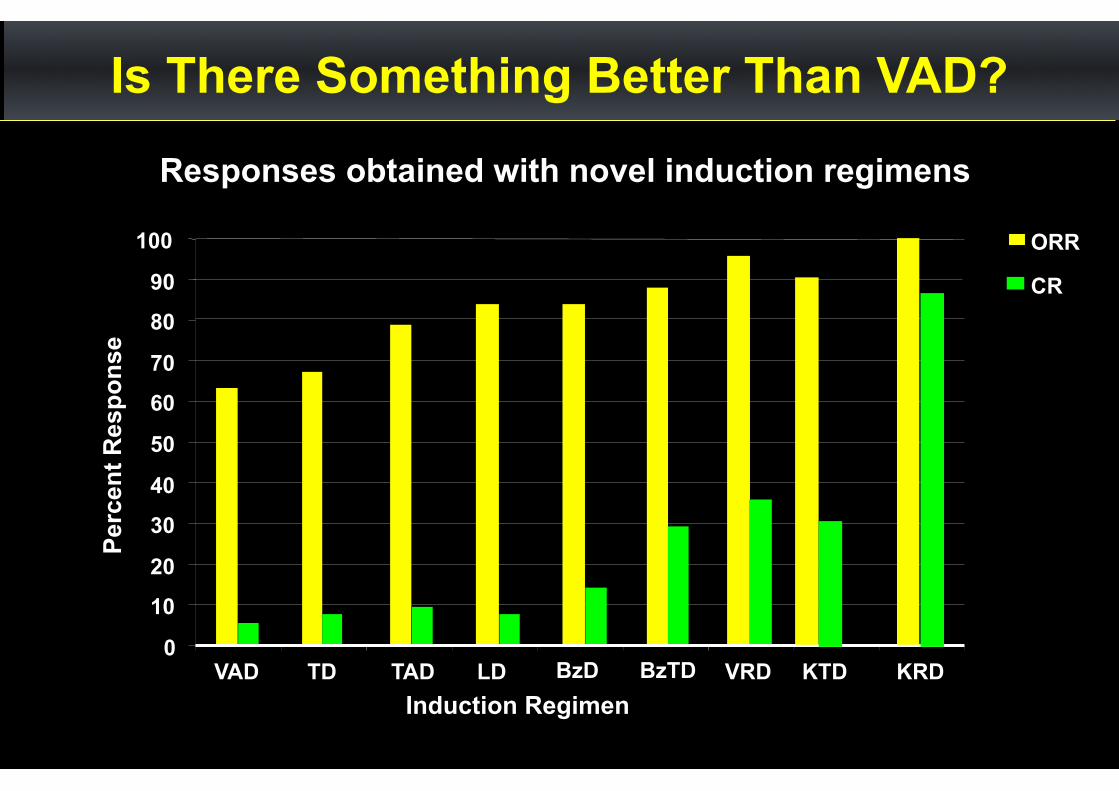
Responses obtained with novel induction regimens
0
10
20
30
40
50
60
70
80
90
100
VAD TD TAD LD BzD BzTD VRD VRDCInduction Regimen
Perc
ent R
espo
nse
ORR
CR
Is There Something Better Than VAD?
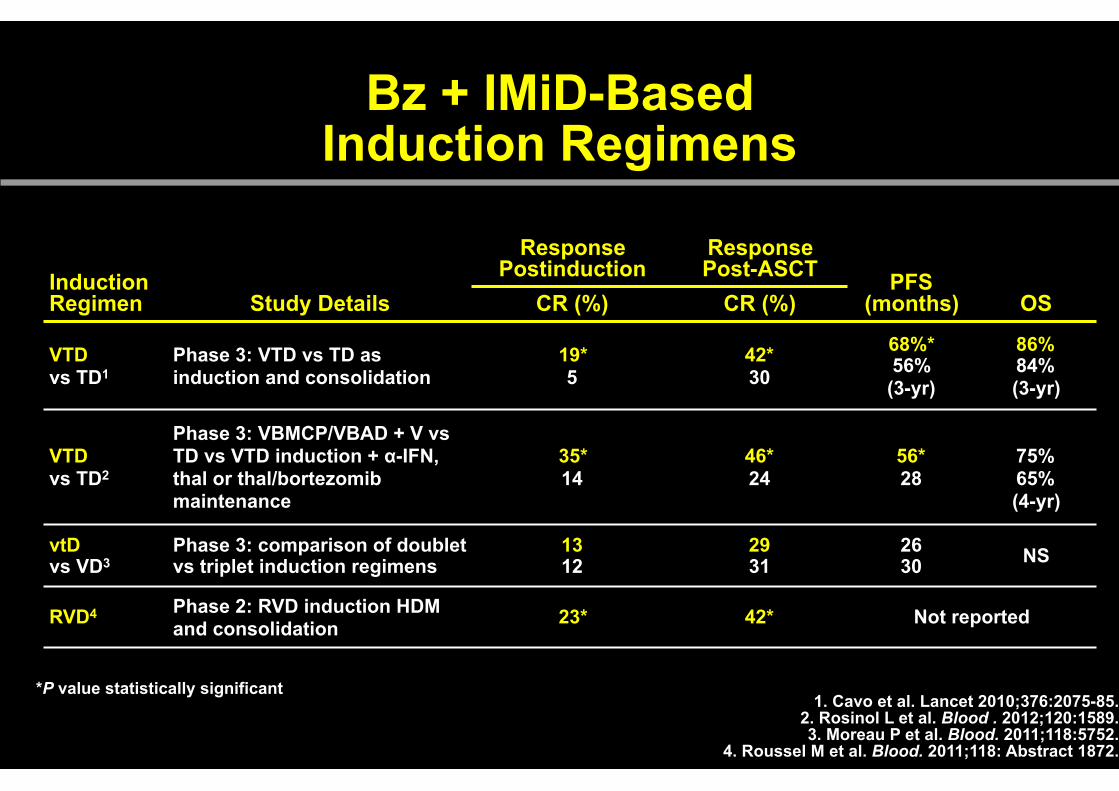
Bz + IMiD-Based Induction Regimens
Induction Regimen Study Details
Response Postinduction
Response Post-ASCT PFS
(months) OSCR (%) CR (%)
VTD vs TD1
Phase 3: VTD vs TD as induction and consolidation
19* 5
42* 30
68%* 56% (3-yr)
86% 84% (3-yr)
VTD vs TD2
Phase 3: VBMCP/VBAD + V vs TD vs VTD induction + α-IFN, thal or thal/bortezomib maintenance
35* 14
46* 24
56* 28
75% 65% (4-yr)
vtD vs VD3
Phase 3: comparison of doublet vs triplet induction regimens
13 12
29 31
26 30 NS
RVD4 Phase 2: RVD induction HDM and consolidation 23* 42* Not reported
1. Cavo et al. Lancet 2010;376:2075-85. 2. Rosinol L et al. Blood . 2012;120:1589. 3. Moreau P et al. Blood. 2011;118:5752.
4. Roussel M et al. Blood. 2011;118: Abstract 1872.
*P value statistically significant
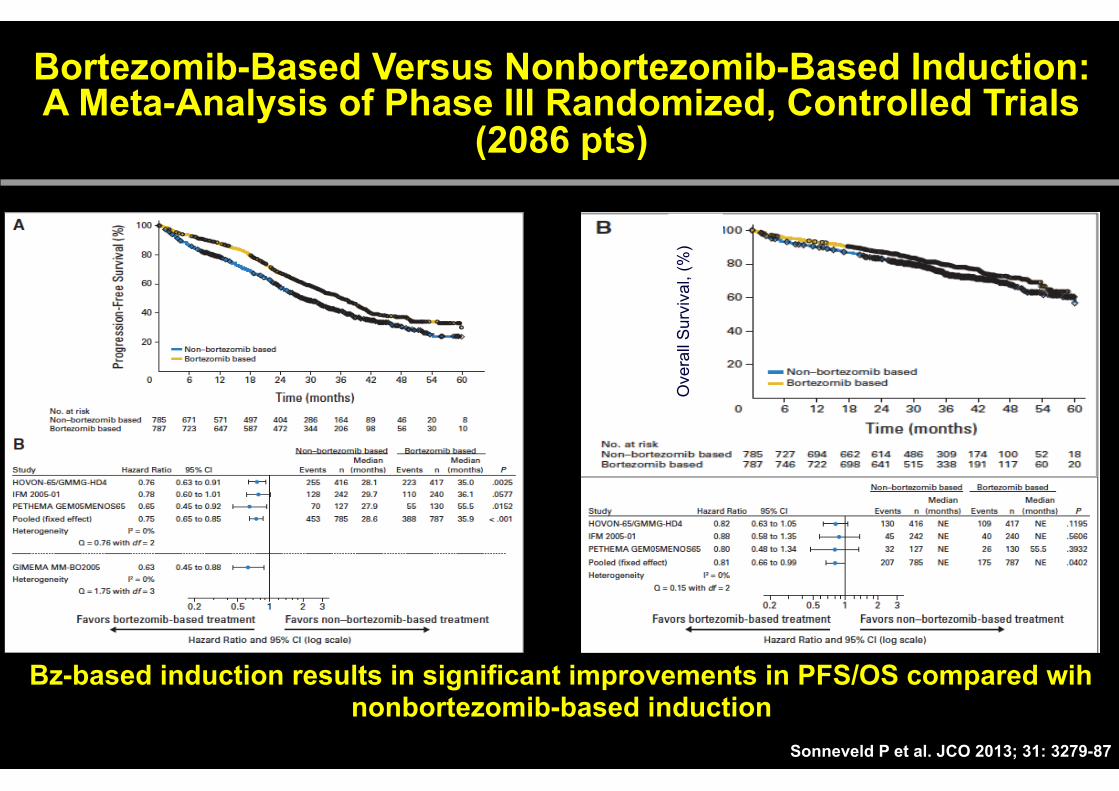
Bortezomib-Based Versus Nonbortezomib-Based Induction: A Meta-Analysis of Phase III Randomized, Controlled Trials
(2086 pts)
Ove
rall
Sur
viva
l, (%
)
Sonneveld P et al. JCO 2013; 31: 3279-87
Bz-based induction results in significant improvements in PFS/OS compared wih nonbortezomib-based induction
Responses obtained with novel induction regimens
0
10
20
30
40
50
60
70
80
90
100
VAD TD TAD LD BzD BzTD VRD KTDInduction Regimen
Perc
ent R
espo
nse
ORR
CR
Is There Something Better Than VAD?
KRD
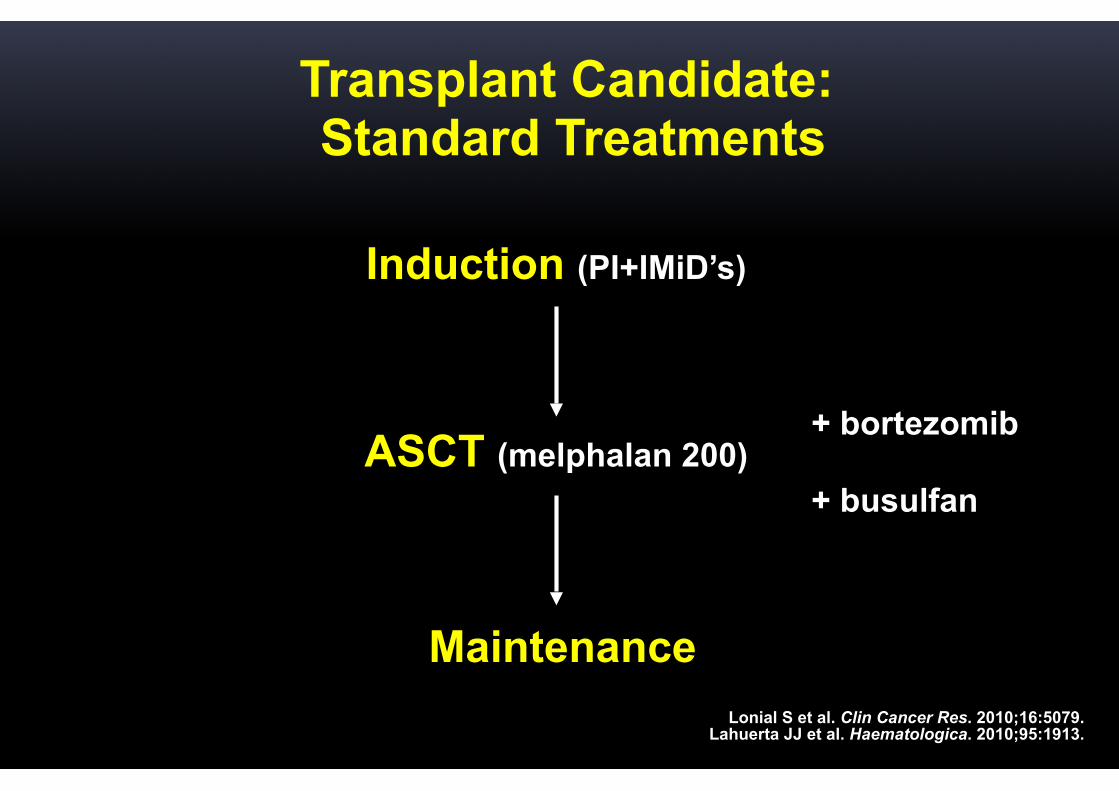
Induction (PI+IMiD’s)
ASCT (melphalan 200)
Maintenance
Transplant Candidate: Standard Treatments
+ bortezomib
+ busulfan
Lonial S et al. Clin Cancer Res. 2010;16:5079.Lahuerta JJ et al. Haematologica. 2010;95:1913.
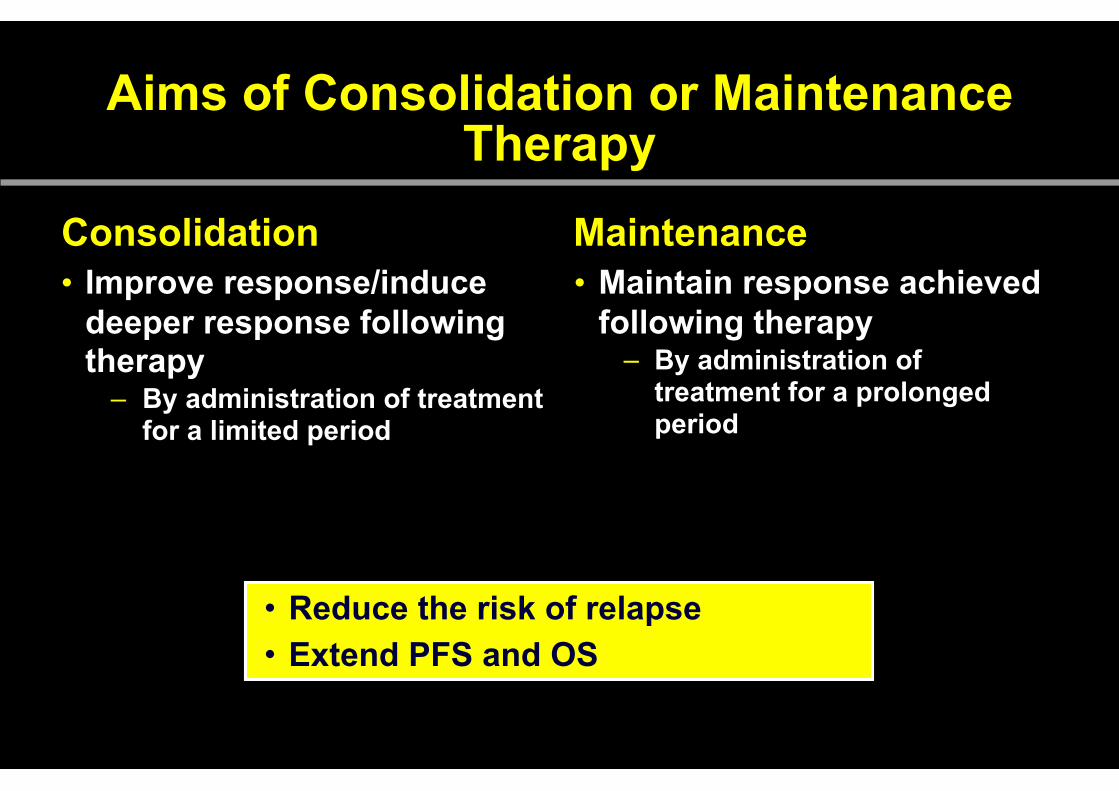
Aims of Consolidation or Maintenance Therapy
Consolidation• Improve response/induce
deeper response following therapy
– By administration of treatment for a limited period
Maintenance• Maintain response achieved
following therapy – By administration of
treatment for a prolonged period
• Reduce the risk of relapse • Extend PFS and OS
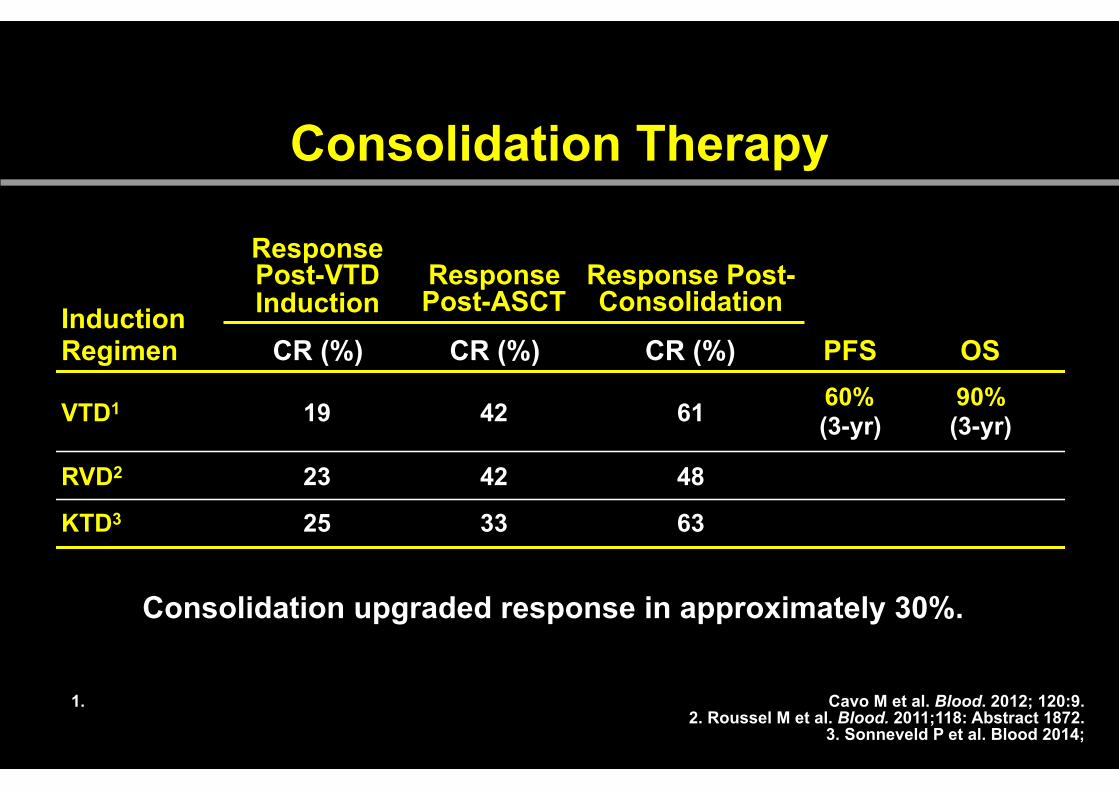
Consolidation Therapy
Induction Regimen
Response Post-VTD Induction
Response Post-ASCT
Response Post-Consolidation
PFS OSCR (%) CR (%) CR (%)
VTD1 19 42 61 60% (3-yr)
90% (3-yr)
RVD2 23 42 48
KTD3 25 33 63
1. Cavo M et al. Blood. 2012; 120:9.2. Roussel M et al. Blood. 2011;118: Abstract 1872.
3. Sonneveld P et al. Blood 2014;
Consolidation upgraded response in approximately 30%.
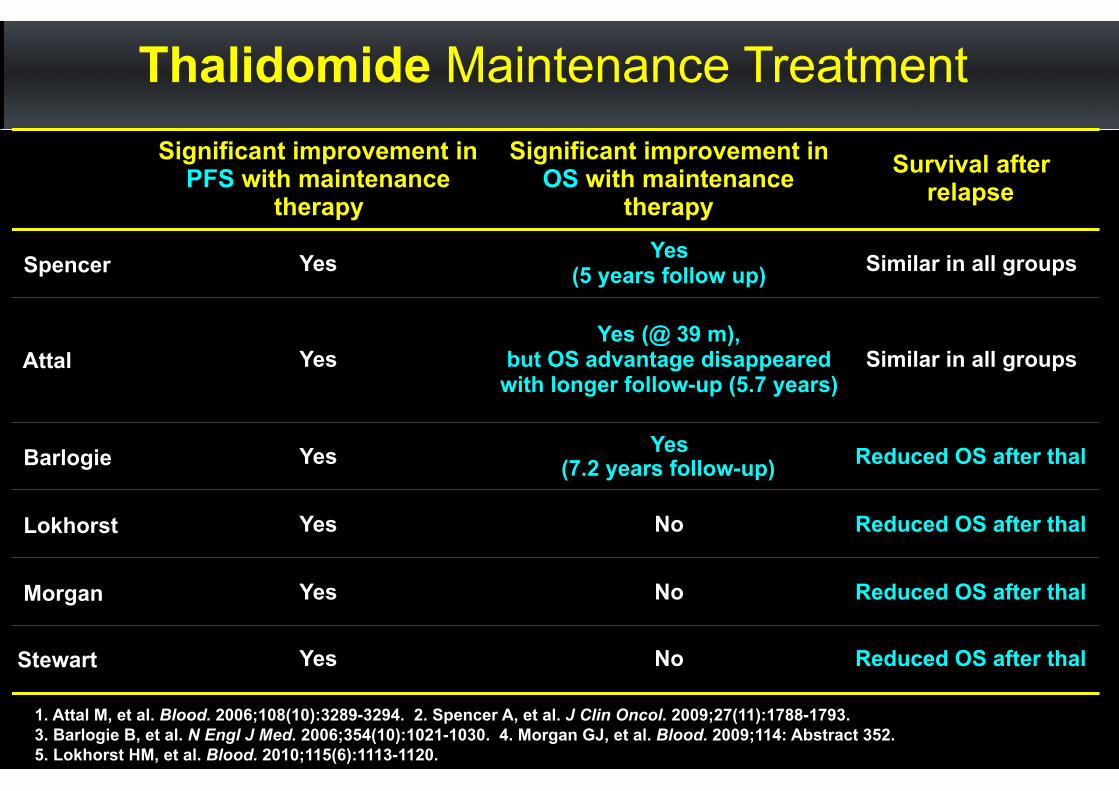
Thalidomide Maintenance Treatment
1. Attal M, et al. Blood. 2006;108(10):3289-3294. 2. Spencer A, et al. J Clin Oncol. 2009;27(11):1788-1793. 3. Barlogie B, et al. N Engl J Med. 2006;354(10):1021-1030. 4. Morgan GJ, et al. Blood. 2009;114: Abstract 352. 5. Lokhorst HM, et al. Blood. 2010;115(6):1113-1120.
Significant improvement in PFS with maintenance
therapy
Significant improvement in OS with maintenance
therapySurvival after
relapse
Spencer Yes Yes (5 years follow up) Similar in all groups
Attal YesYes (@ 39 m),
but OS advantage disappeared with longer follow-up (5.7 years)
Similar in all groups
Barlogie Yes Yes (7.2 years follow-up) Reduced OS after thal
Lokhorst Yes No Reduced OS after thal
Morgan Yes No Reduced OS after thal
Stewart Yes No Reduced OS after thal

Lenalidomide vs Placebo After ASCTPFS From Randomization
OS: >70% at 4 y in both arms
IFM 2005-02[1]
OS: 35 vs 53 deaths, P=0.03
1. Attal M et al. N Engl J Med. 2012;366:1782. 2. McCarthy PL et al. N Engl J Med. 2012;366:1770.
CALGB 100104[2]
P<0.001
25
100
75
50
0
PFS
(%)
0 6 12 18 24 30 36 42 48Months of Follow-up
Placebo(med 23 mos)
Lenalidomide (med 41 mos)
Two-sided P<0.001
0.4
1.0
0.8
0.6
0.0Pr
obab
ility
of P
FS0 10 20 30 40 50 60 70
Months Since Autologous HSCT
Placebo(med 27 mos)
Lenalidomide (med 46 mos)
0.2
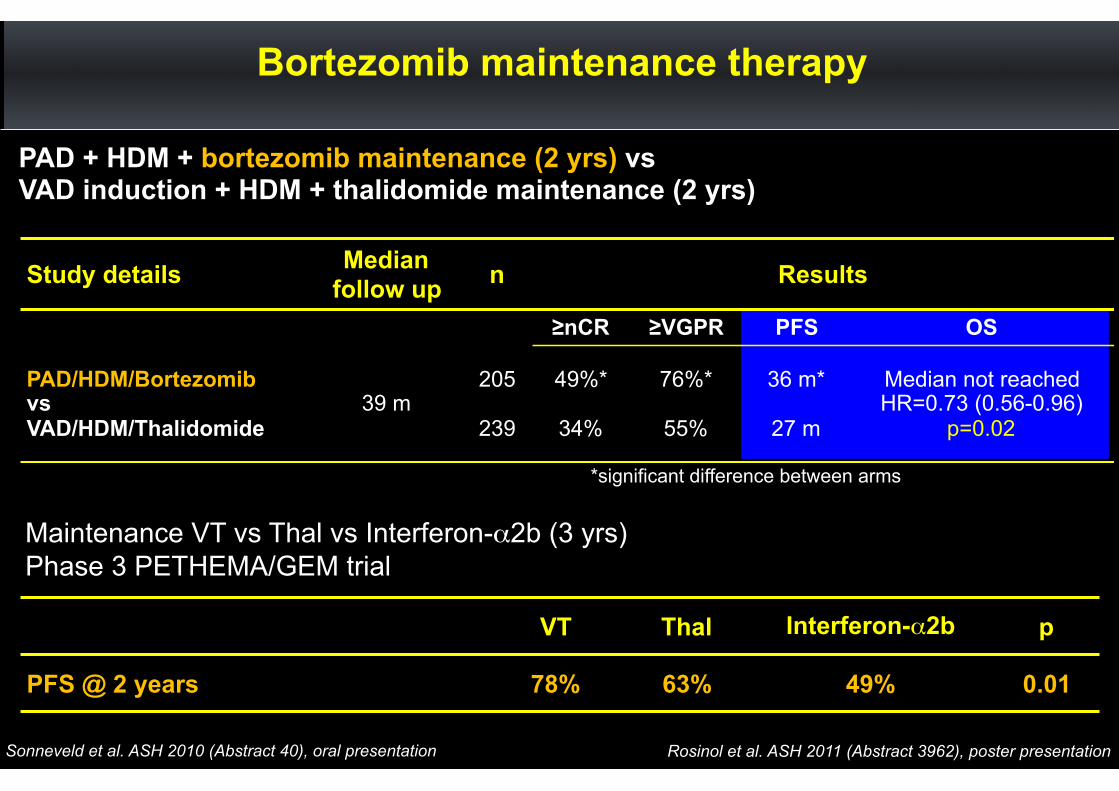
Bortezomib maintenance therapy
Study details Median follow up n Results
≥nCR ≥VGPR PFS OS
PAD/HDM/Bortezomib vs VAD/HDM/Thalidomide
39 m205
239
49%*
34%
76%*
55%
36 m*
27 m
Median not reached HR=0.73 (0.56-0.96)
p=0.02
Sonneveld et al. ASH 2010 (Abstract 40), oral presentation
PAD + HDM + bortezomib maintenance (2 yrs) vs VAD induction + HDM + thalidomide maintenance (2 yrs)
*significant difference between arms
VT Thal Interferon-α2b p
PFS @ 2 years 78% 63% 49% 0.01
Maintenance VT vs Thal vs Interferon-α2b (3 yrs)Phase 3 PETHEMA/GEM trial
Rosinol et al. ASH 2011 (Abstract 3962), poster presentation

Best response to treatment in phase 2 patients receiving maintenance with ixazomib after Ird as induction (n=21)
0 %
25 %
50 %
75 %
100 %
Best response to induction Best response overall
19 %5 %
33 %
19 %
10 %
48 %
29 %29 %
SDMRPRVGPRnCRCRsCR
• n=5
• n=2
• 10 (48%) patients improved their response during maintenance: • 2 VGPR to nCR, 5 VGPR to CR, 1 VGPR to sCR, and 2 CR to sCR
n=2
n=1
Kumar et al. ASH 2014 (Abstract 82), oral presentation
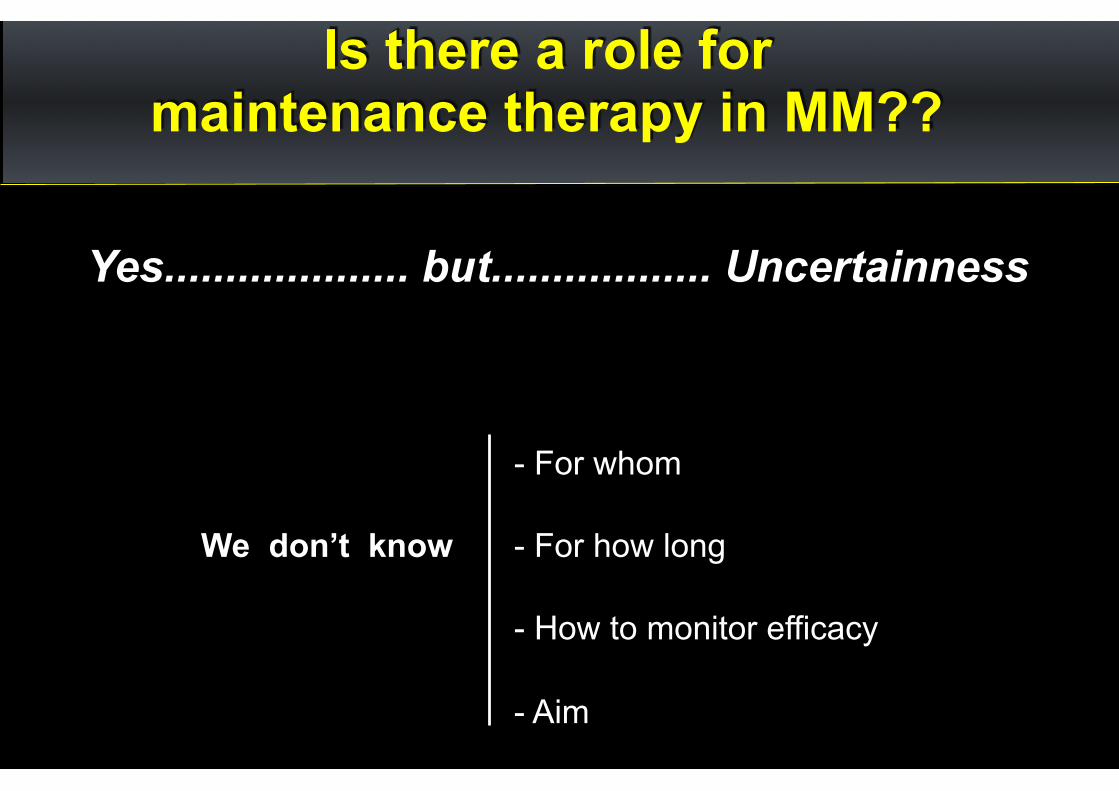
Yes.................... but.................. Uncertainness
- For whom
We don’t know - For how long
- How to monitor efficacy
- Aim
Is there a role for maintenance therapy in MM??
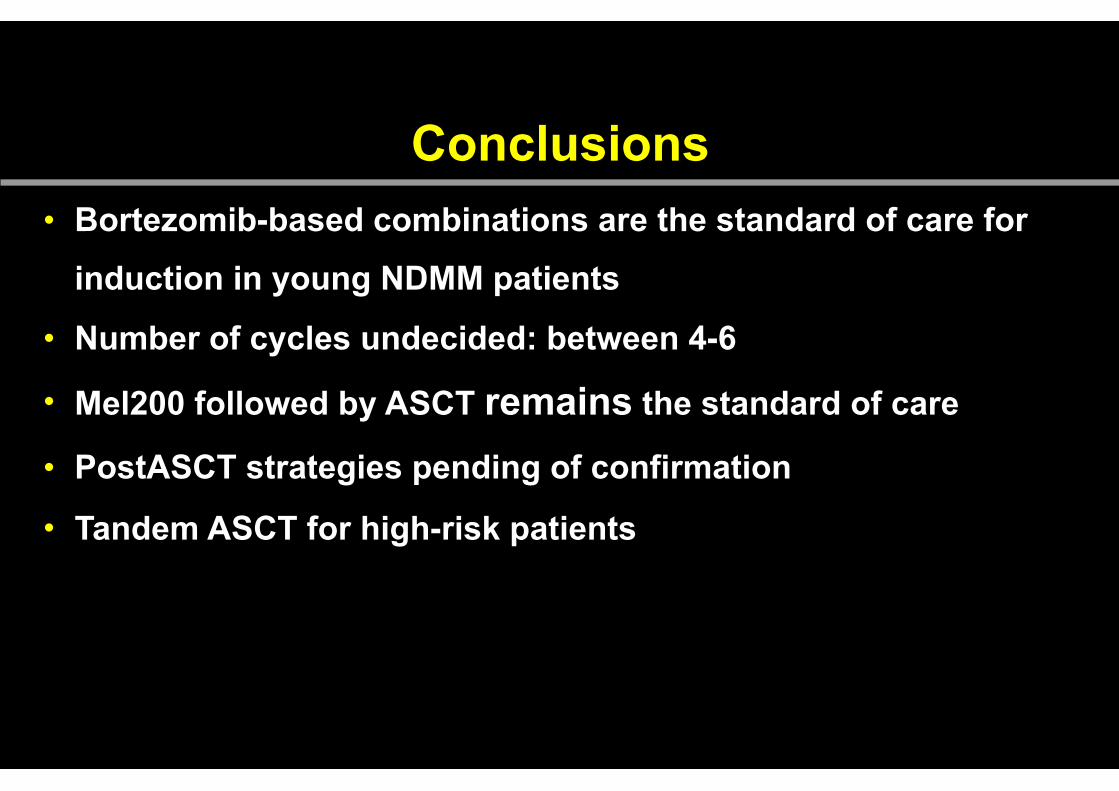
Conclusions• Bortezomib-based combinations are the standard of care for
induction in young NDMM patients
• Number of cycles undecided: between 4-6
• Mel200 followed by ASCT remains the standard of care
• PostASCT strategies pending of confirmation
• Tandem ASCT for high-risk patients
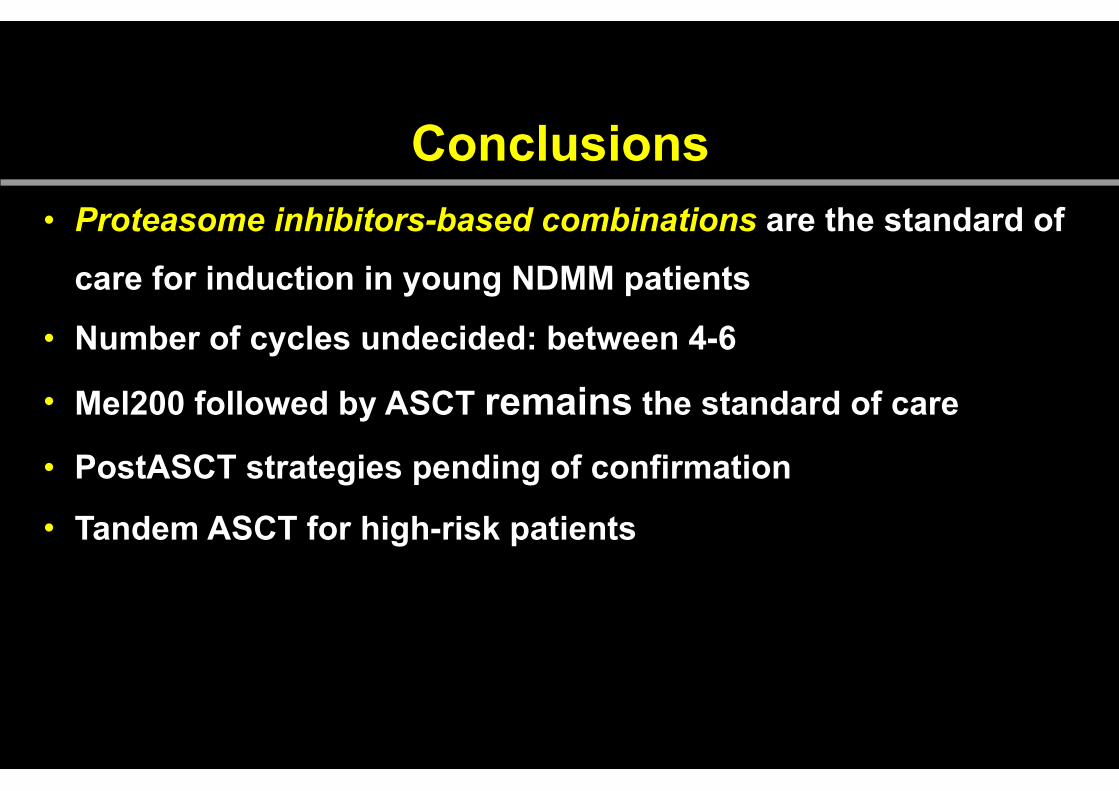
Conclusions• Proteasome inhibitors-based combinations are the standard of
care for induction in young NDMM patients
• Number of cycles undecided: between 4-6
• Mel200 followed by ASCT remains the standard of care
• PostASCT strategies pending of confirmation
• Tandem ASCT for high-risk patients

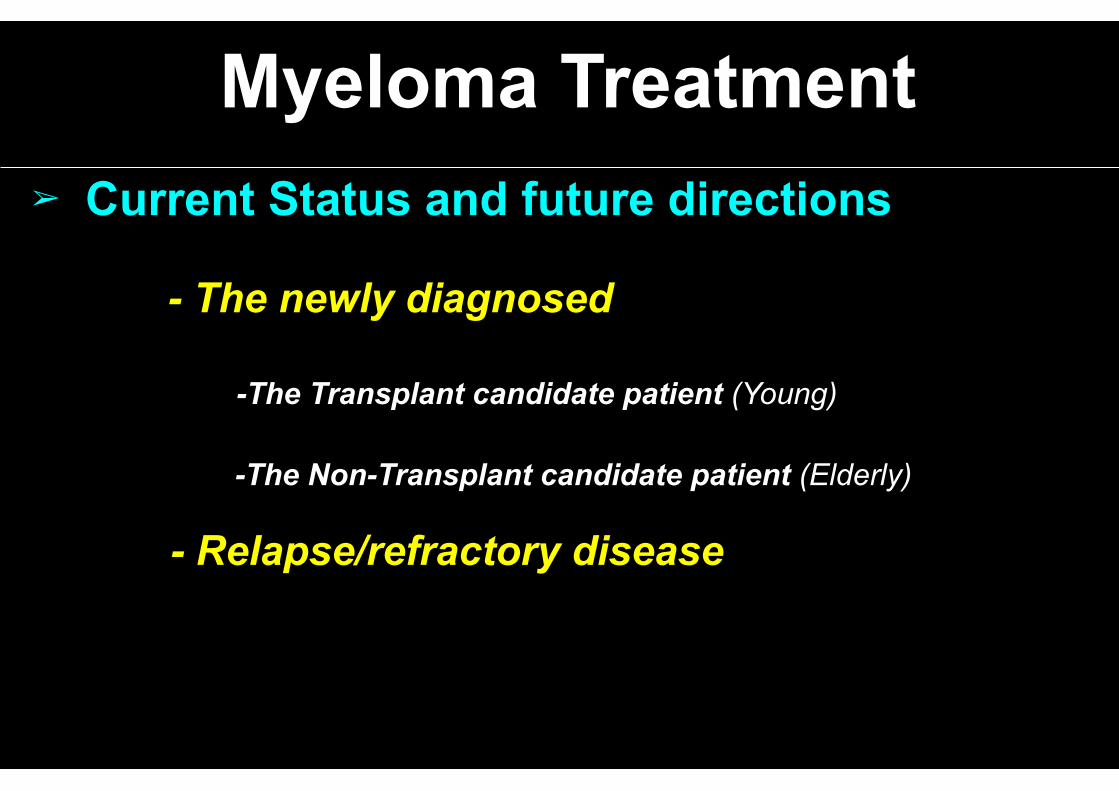
➢ Current Status and future directions
- The newly diagnosed
-The Transplant candidate patient (Young)
-The Non-Transplant candidate patient (Elderly)
Myeloma Treatment
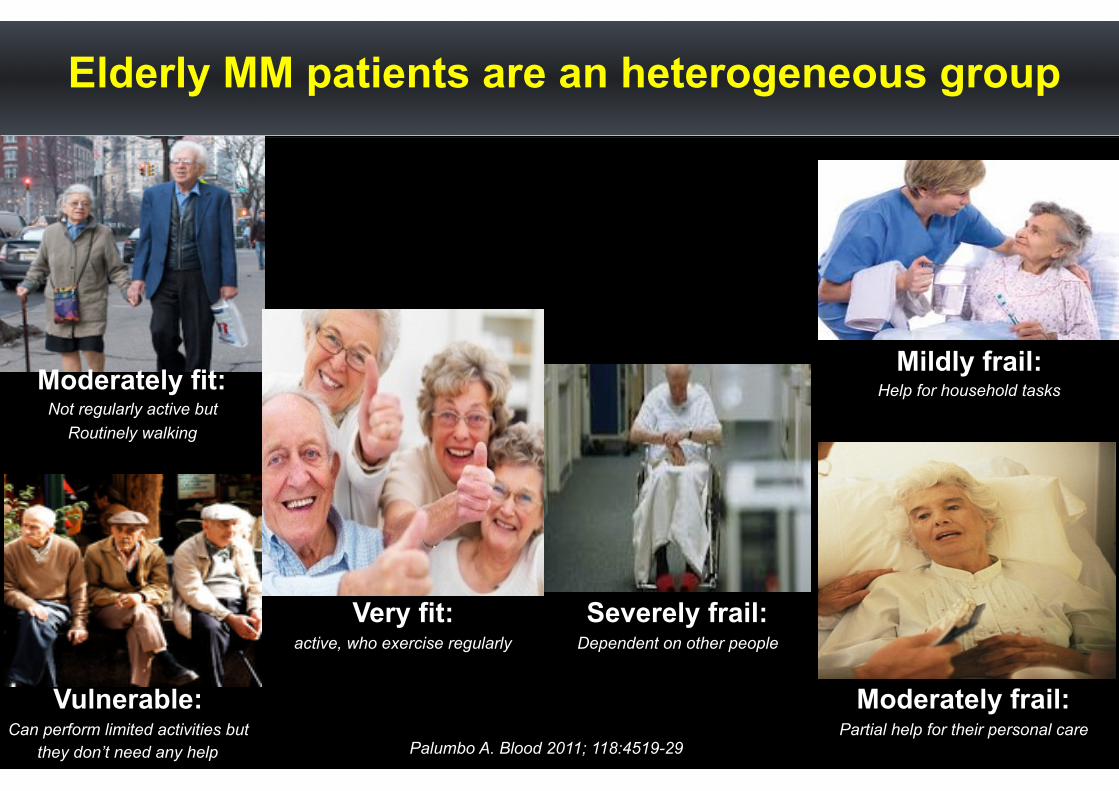
Elderly MM patients are an heterogeneous group
Very fit: active, who exercise regularly
Moderately fit: Not regularly active but
Routinely walking
Vulnerable: Can perform limited activities but
they don’t need any help
Mildly frail: Help for household tasks
Moderately frail: Partial help for their personal care
Severely frail: Dependent on other people
Palumbo A. Blood 2011; 118:4519-29
➢ Current Status and future directions
- The newly diagnosed
-The Transplant candidate patient (Young)
-The Non-Transplant candidate patient (Elderly)
- Relapse/refractory disease
Myeloma Treatment
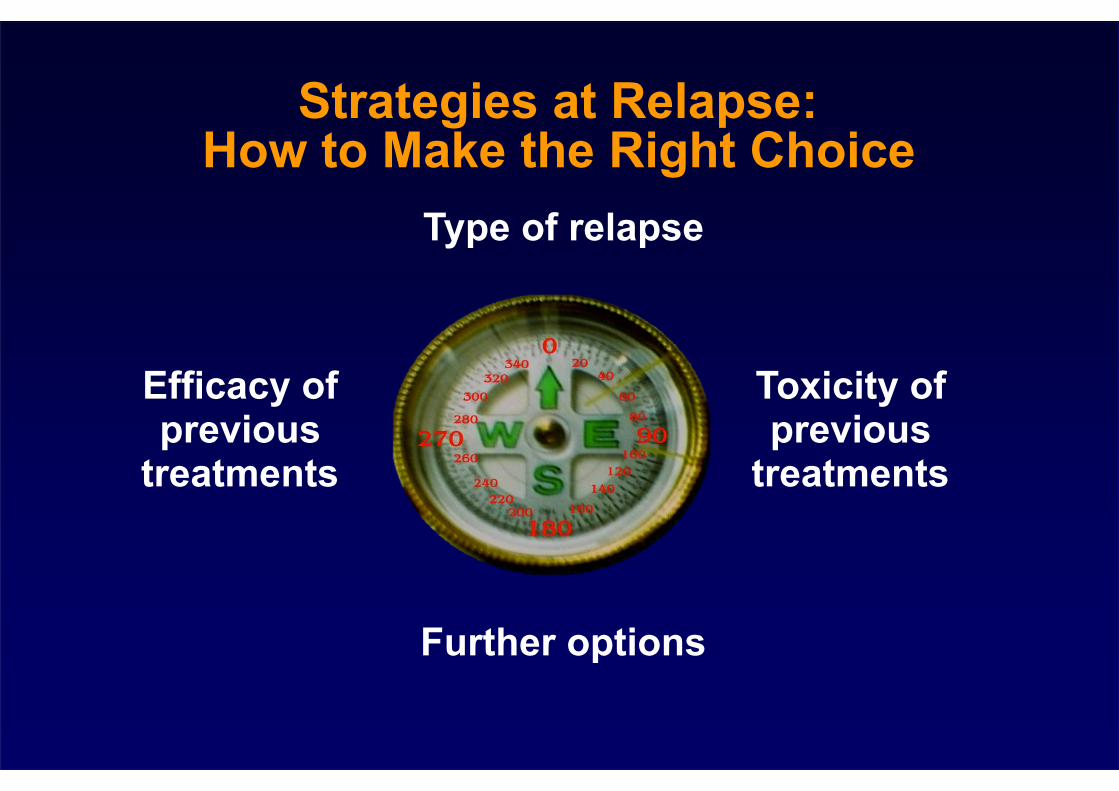
Type of relapse
Further options
Efficacy of previous
treatments
Toxicity of previous
treatments
Strategies at Relapse: How to Make the Right Choice
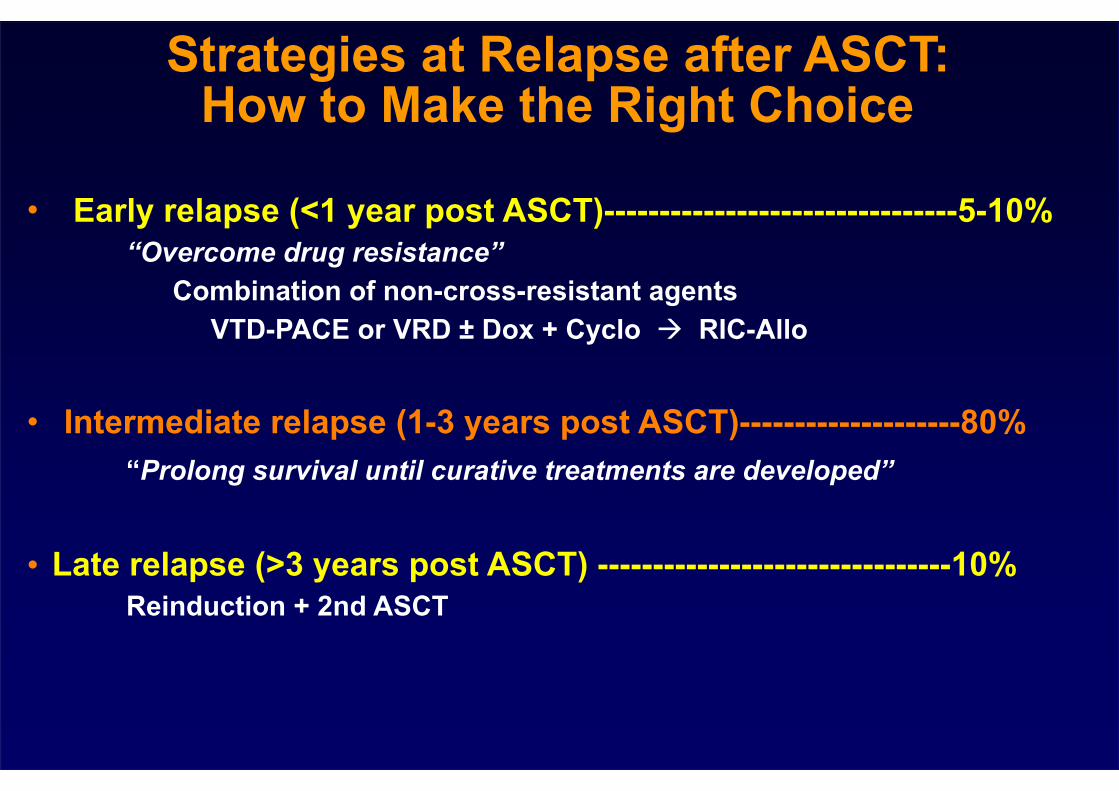
• Early relapse (<1 year post ASCT)--------------------------------5-10% “Overcome drug resistance” Combination of non-cross-resistant agents VTD-PACE or VRD ± Dox + Cyclo ! RIC-Allo
• Intermediate relapse (1-3 years post ASCT)--------------------80% “Prolong survival until curative treatments are developed”
• Late relapse (>3 years post ASCT) --------------------------------10% Reinduction + 2nd ASCT
Strategies at Relapse after ASCT: How to Make the Right Choice
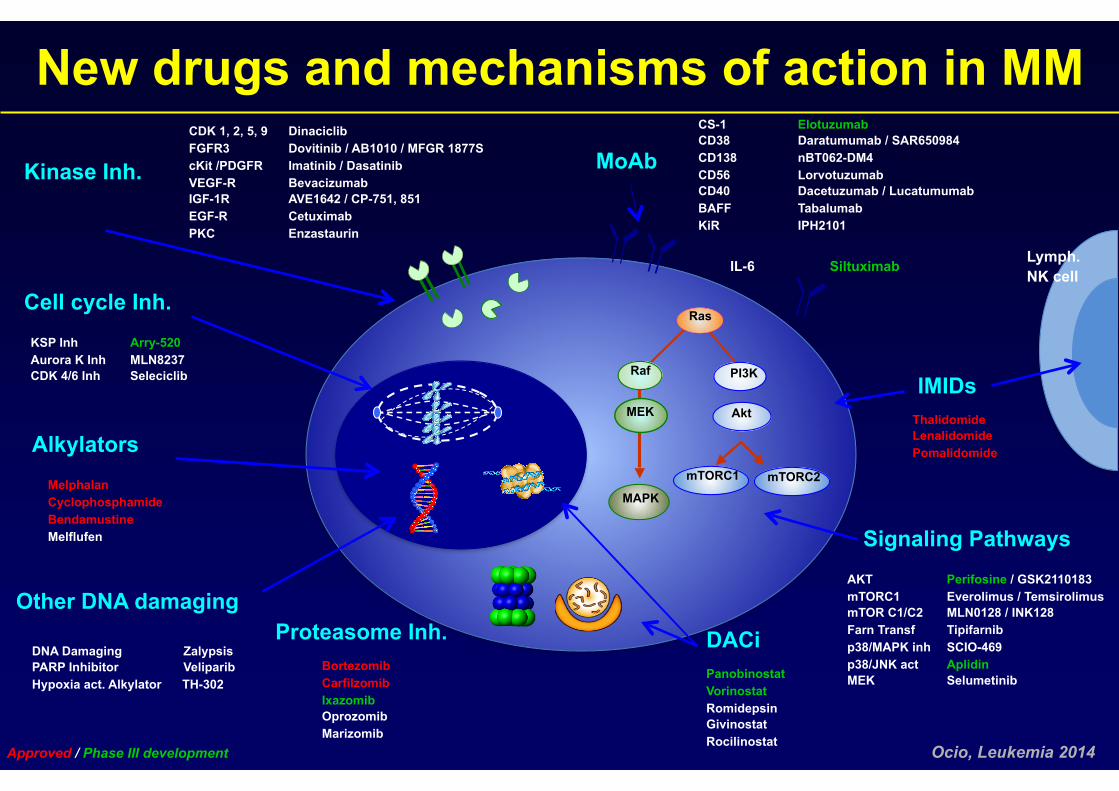
Ocio, Leukemia 2014
New drugs and mechanisms of action in MM
Bortezomib Carfilzomib Ixazomib Oprozomib Marizomib
Proteasome Inh.
Melphalan Cyclophosphamide Bendamustine Melflufen
Alkylators
DNA Damaging Zalypsis PARP Inhibitor Veliparib Hypoxia act. Alkylator TH-302
Other DNA damaging
Lymph. NK cell
Approved / Phase III development
Thalidomide Lenalidomide Pomalidomide
IMIDs
KSP Inh Arry-520 Aurora K Inh MLN8237 CDK 4/6 Inh Seleciclib
Cell cycle Inh.
Panobinostat Vorinostat Romidepsin Givinostat Rocilinostat
DACi
MoAb
CS-1 Elotuzumab CD38 Daratumumab / SAR650984 CD138 nBT062-DM4 CD56 Lorvotuzumab CD40 Dacetuzumab / Lucatumumab BAFF Tabalumab KiR IPH2101
IL-6 Siltuximab
AKT Perifosine / GSK2110183 mTORC1 Everolimus / Temsirolimus mTOR C1/C2 MLN0128 / INK128 Farn Transf Tipifarnib p38/MAPK inh SCIO-469 p38/JNK act Aplidin MEK Selumetinib
Signaling Pathways
Raf
MEK
MAPK
PI3K
Akt
Ras
mTORC1 mTORC2
Kinase Inh.
CDK 1, 2, 5, 9 Dinaciclib FGFR3 Dovitinib / AB1010 / MFGR 1877S cKit /PDGFR Imatinib / Dasatinib VEGF-R Bevacizumab IGF-1R AVE1642 / CP-751, 851 EGF-R Cetuximab PKC Enzastaurin
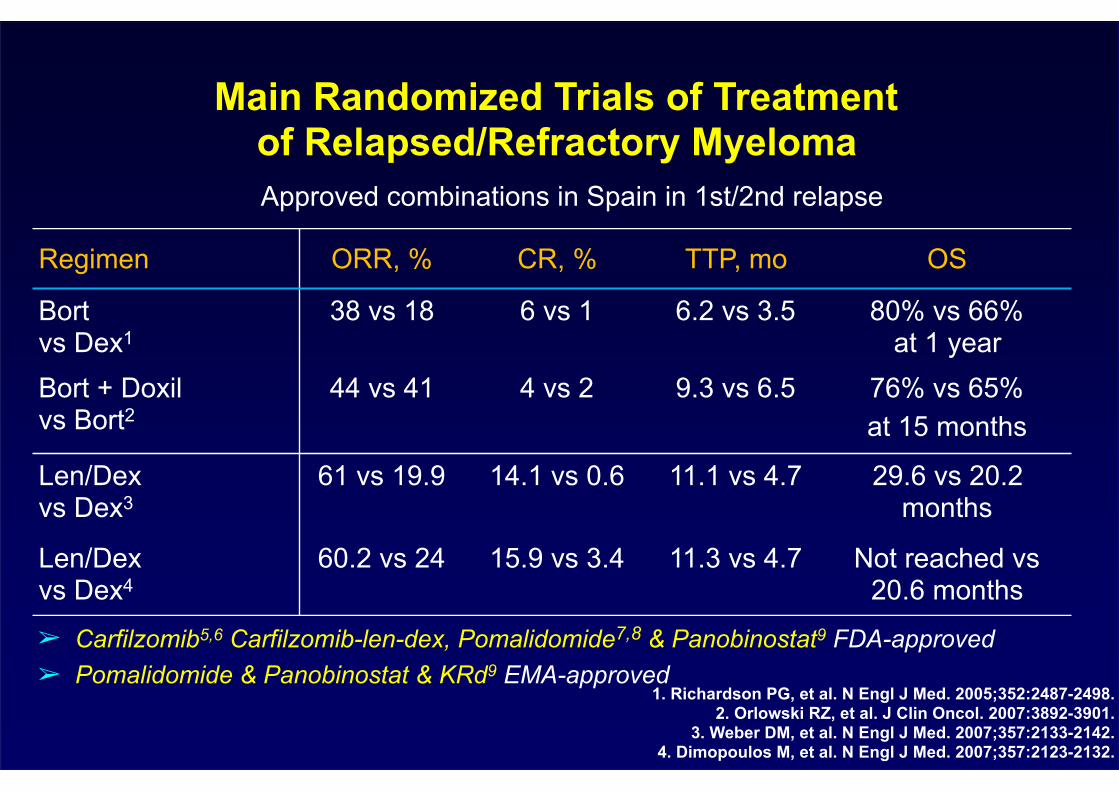
Main Randomized Trials of Treatment of Relapsed/Refractory Myeloma
Regimen ORR, % CR, % TTP, mo OS
Bort vs Dex1
38 vs 18 6 vs 1 6.2 vs 3.5 80% vs 66%at 1 year
Bort + Doxil vs Bort2
44 vs 41 4 vs 2 9.3 vs 6.5 76% vs 65% at 15 months
Len/Dex vs Dex3
61 vs 19.9 14.1 vs 0.6 11.1 vs 4.7 29.6 vs 20.2 months
Len/Dex vs Dex4
60.2 vs 24 15.9 vs 3.4 11.3 vs 4.7 Not reached vs 20.6 months
1. Richardson PG, et al. N Engl J Med. 2005;352:2487-2498. 2. Orlowski RZ, et al. J Clin Oncol. 2007:3892-3901.
3. Weber DM, et al. N Engl J Med. 2007;357:2133-2142. 4. Dimopoulos M, et al. N Engl J Med. 2007;357:2123-2132.
Approved combinations in Spain in 1st/2nd relapse
➢ Carfilzomib5,6 Carfilzomib-len-dex, Pomalidomide7,8 & Panobinostat9 FDA-approved ➢ Pomalidomide & Panobinostat & KRd9 EMA-approved
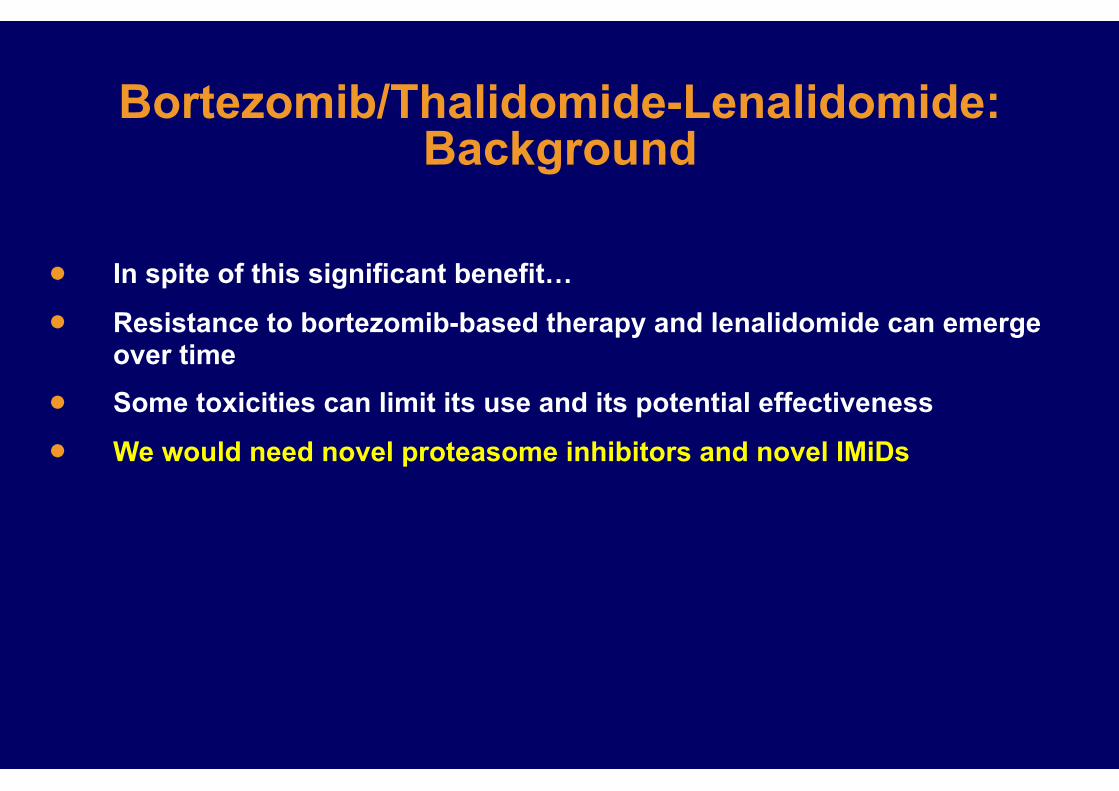
Bortezomib/Thalidomide-Lenalidomide: Background
• In spite of this significant benefit…
• Resistance to bortezomib-based therapy and lenalidomide can emerge over time
• Some toxicities can limit its use and its potential effectiveness
• We would need novel proteasome inhibitors and novel IMiDs
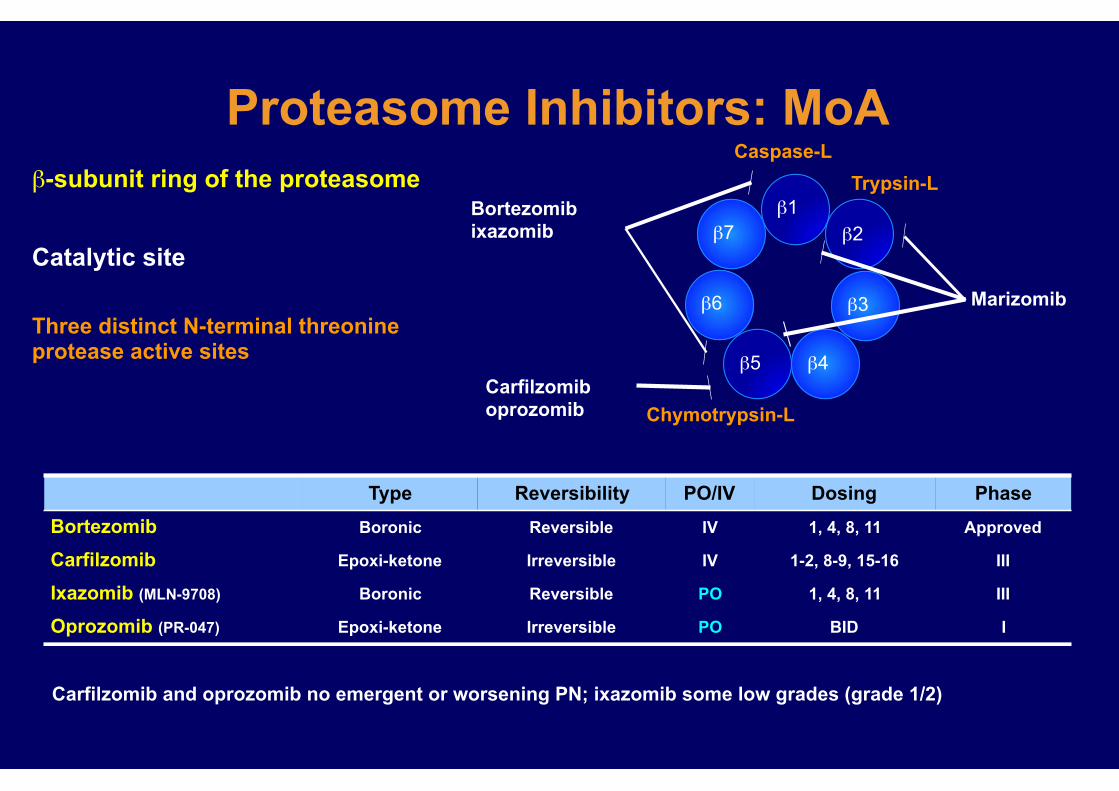
Proteasome Inhibitors: MoAβ-subunit ring of the proteasome
Type Reversibility PO/IV Dosing PhaseBortezomib Boronic Reversible IV 1, 4, 8, 11 Approved
Carfilzomib Epoxi-ketone Irreversible IV 1-2, 8-9, 15-16 III
Ixazomib (MLN-9708) Boronic Reversible PO 1, 4, 8, 11 III
Oprozomib (PR-047) Epoxi-ketone Irreversible PO BID I
Three distinct N-terminal threonine protease active sites
Catalytic site
Caspase-L
β7β1
β2
β6
β5 β4
β3
Trypsin-L
Chymotrypsin-LCarfilzomib oprozomib
Marizomib
Bortezomib ixazomib
Carfilzomib and oprozomib no emergent or worsening PN; ixazomib some low grades (grade 1/2)
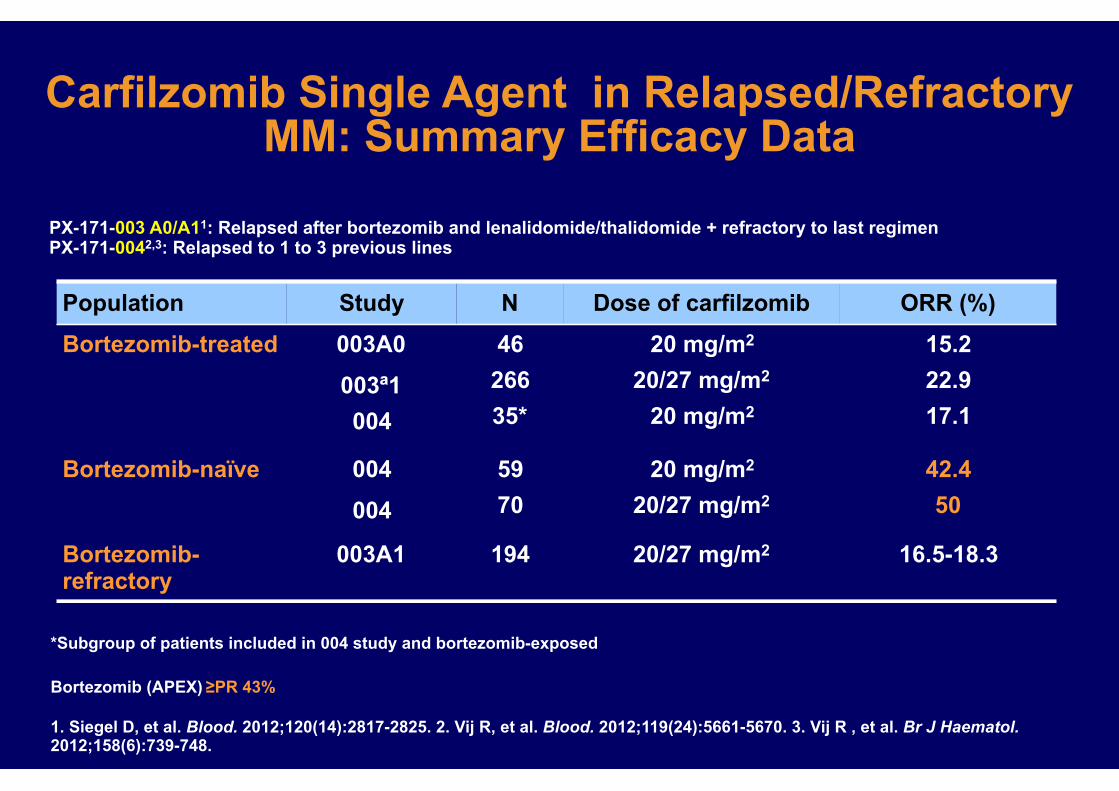
Carfilzomib Single Agent in Relapsed/Refractory MM: Summary Efficacy Data
Bortezomib (APEX) ≥PR 43%
PX-171-003 A0/A11: Relapsed after bortezomib and lenalidomide/thalidomide + refractory to last regimen PX-171-0042,3: Relapsed to 1 to 3 previous lines
1. Siegel D, et al. Blood. 2012;120(14):2817-2825. 2. Vij R, et al. Blood. 2012;119(24):5661-5670. 3. Vij R , et al. Br J Haematol. 2012;158(6):739-748.
Population Study N Dose of carfilzomib ORR (%)
Bortezomib-treated 003A0
003ª1 004
46 266 35*
20 mg/m2
20/27 mg/m2
20 mg/m2
15.2 22.9 17.1
Bortezomib-naïve 004
004
59 70
20 mg/m2
20/27 mg/m2
42.4 50
Bortezomib-refractory
003A1 194 20/27 mg/m2 16.5-18.3
*Subgroup of patients included in 004 study and bortezomib-exposed
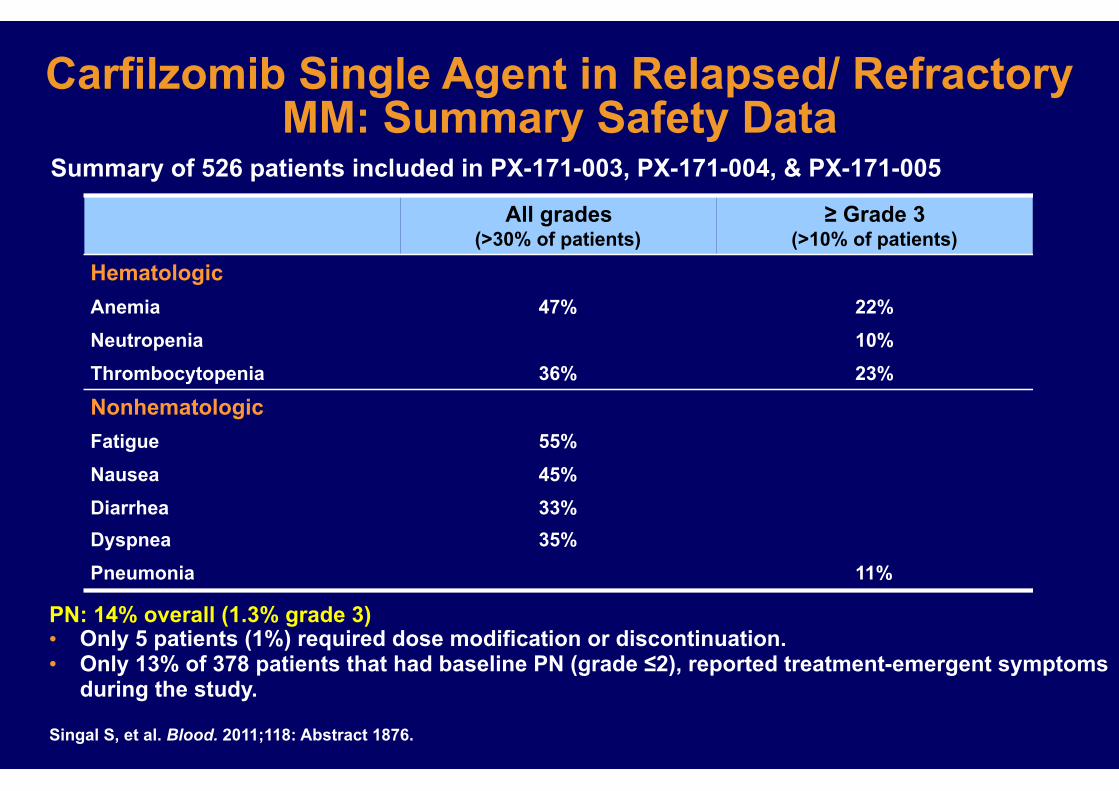
Summary of 526 patients included in PX-171-003, PX-171-004, & PX-171-005
Singal S, et al. Blood. 2011;118: Abstract 1876.
Carfilzomib Single Agent in Relapsed/ Refractory MM: Summary Safety Data
All grades (>30% of patients)
≥ Grade 3 (>10% of patients)
HematologicAnemia 47% 22%Neutropenia 10%Thrombocytopenia 36% 23%
NonhematologicFatigue 55%Nausea 45%Diarrhea 33%Dyspnea 35%Pneumonia 11%
PN: 14% overall (1.3% grade 3) • Only 5 patients (1%) required dose modification or discontinuation. • Only 13% of 378 patients that had baseline PN (grade ≤2), reported treatment-emergent symptoms
during the study.
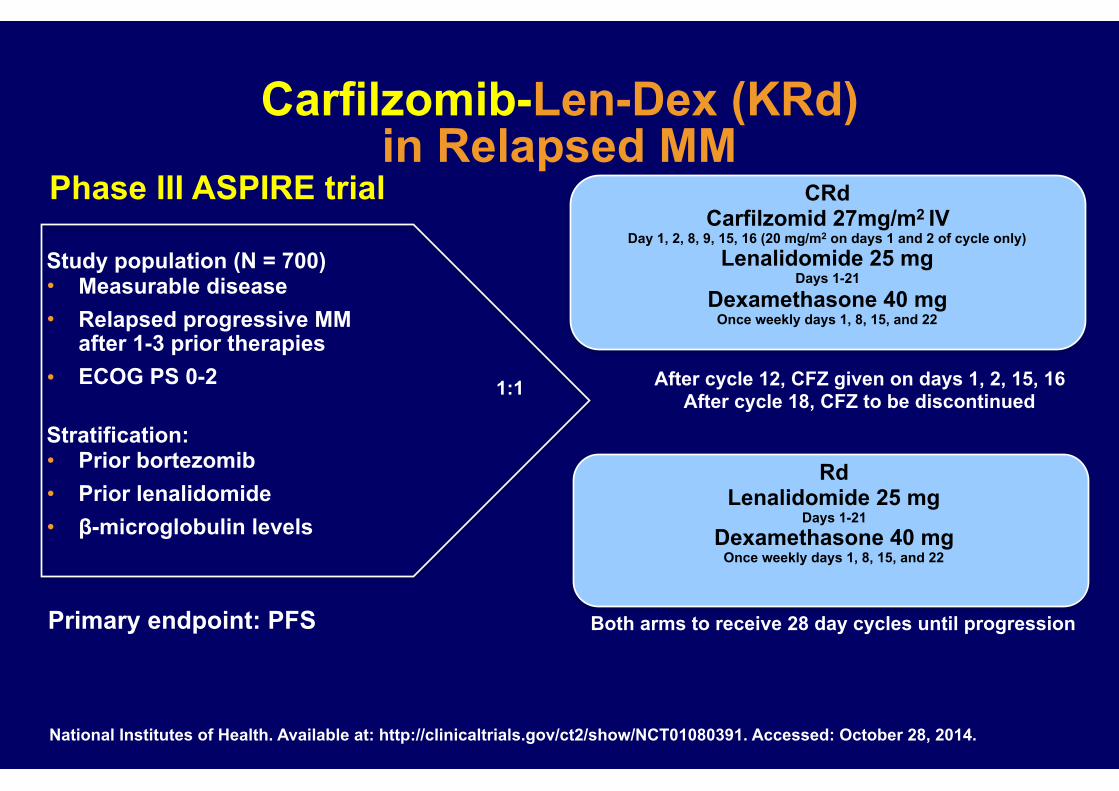
Study population (N = 700) • Measurable disease • Relapsed progressive MM
after 1-3 prior therapies • ECOG PS 0-2
Stratification: • Prior bortezomib • Prior lenalidomide • β-microglobulin levels
1:1
CRd Carfilzomid 27mg/m2 IV
Day 1, 2, 8, 9, 15, 16 (20 mg/m2 on days 1 and 2 of cycle only) Lenalidomide 25 mg
Days 1-21 Dexamethasone 40 mg
Once weekly days 1, 8, 15, and 22
Rd Lenalidomide 25 mg
Days 1-21 Dexamethasone 40 mg
Once weekly days 1, 8, 15, and 22
After cycle 12, CFZ given on days 1, 2, 15, 16 After cycle 18, CFZ to be discontinued
Both arms to receive 28 day cycles until progressionPrimary endpoint: PFS
National Institutes of Health. Available at: http://clinicaltrials.gov/ct2/show/NCT01080391. Accessed: October 28, 2014.
Carfilzomib-Len-Dex (KRd) in Relapsed MM
Phase III ASPIRE trial
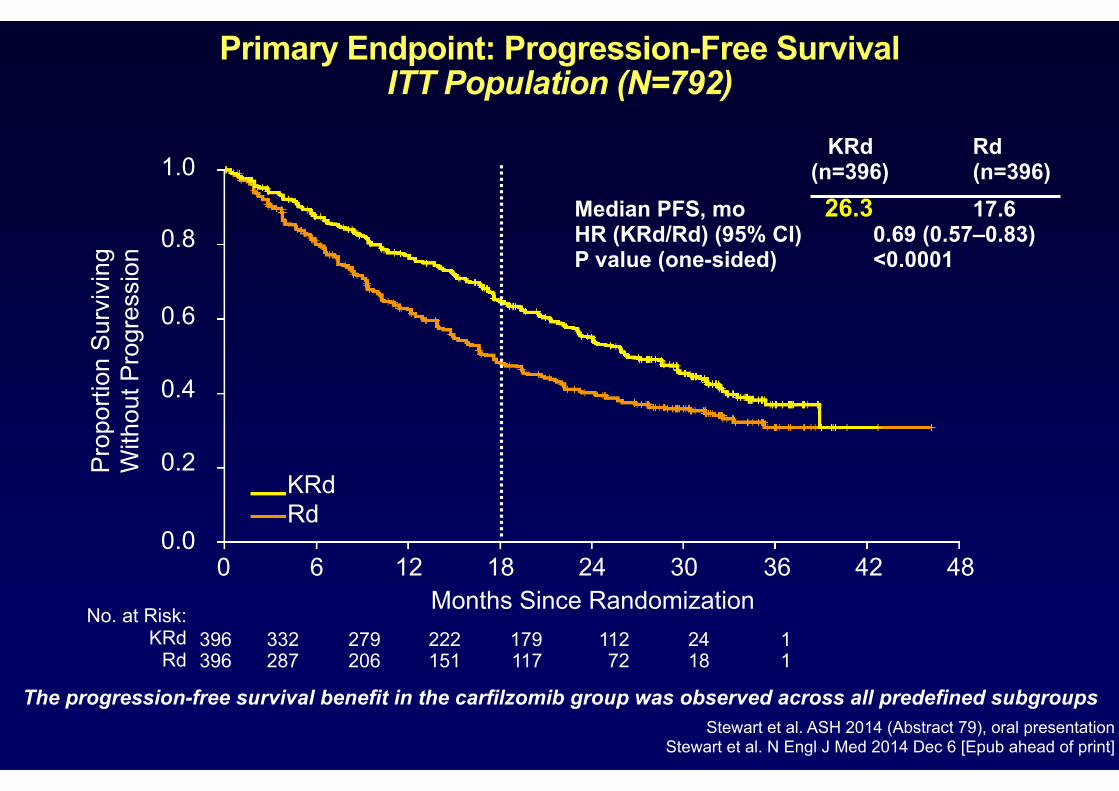
Primary Endpoint: Progression-Free SurvivalITT Population (N=792)
1.0
0.8
0.6
0.4
0.2
0.0
Pro
porti
on S
urvi
ving
W
ithou
t Pro
gres
sion
KRd Rd
0 6 12 18 24 30 36 42 48Months Since Randomization
KRd Rd (n=396) (n=396) Median PFS, mo 26.3 17.6 HR (KRd/Rd) (95% CI) 0.69 (0.57–0.83) P value (one-sided) <0.0001
No. at Risk: KRd
Rd396 332 279 222 179 112 24 1 396 287 206 151 117 72 18 1
The progression-free survival benefit in the carfilzomib group was observed across all predefined subgroups Stewart et al. ASH 2014 (Abstract 79), oral presentation
Stewart et al. N Engl J Med 2014 Dec 6 [Epub ahead of print]

Proteasome Inhibitors: MoAβ-subunit ring of the proteasome
Type Reversibility PO/IV Dosing PhaseBortezomib Boronic Reversible IV 1, 4, 8, 11 Approved
Carfilzomib Epoxi-ketone Irreversible IV 1-2, 8-9, 15-16 III
Ixazomib (MLN-9708) Boronic Reversible PO 1, 4, 8, 11 III
Oprozomib (PR-047) Epoxi-ketone Irreversible PO BID I
Three distinct N-terminal threonine protease active sites
Catalytic site
Caspase-L
β7β1
β2
β6
β5 β4
β3
Trypsin-L
Chymotrypsin-LCarfilzomib oprozomib
Marizomib
Bortezomib ixazomib
Carfilzomib and oprozomib no emergent or worsening PN; ixazomib some low grades (grade 1/2)
NNH
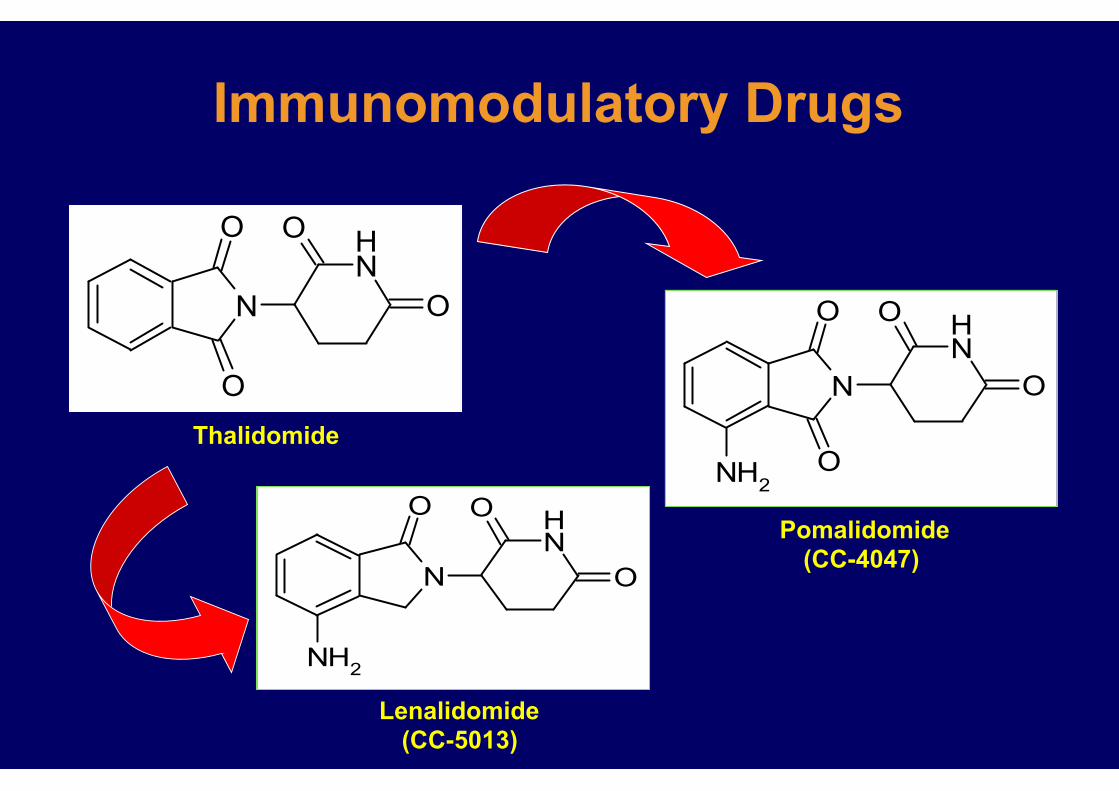
O
O O
O
NH2
NNHO
O
O
O
Lenalidomide (CC-5013)
Pomalidomide (CC-4047)
NNHO O
O
NH2
Thalidomide
Immunomodulatory Drugs
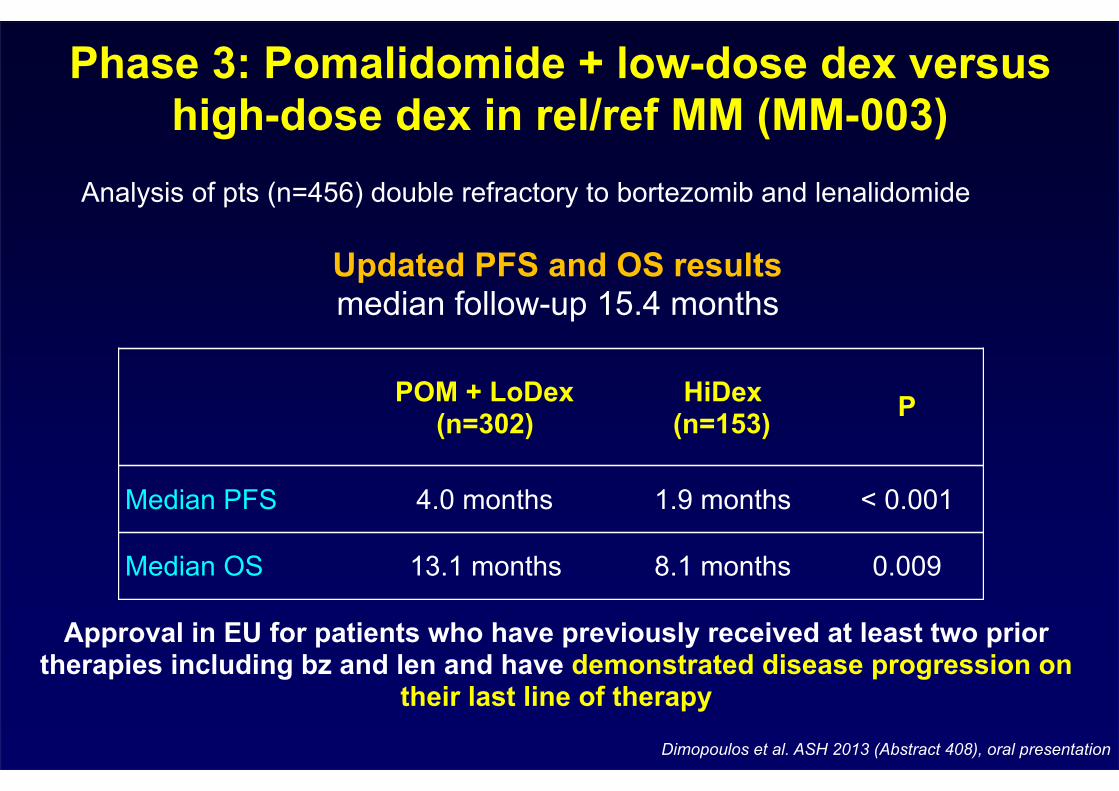
Phase 3: Pomalidomide + low-dose dex versus high-dose dex in rel/ref MM (MM-003)
POM + LoDex (n=302)
HiDex (n=153) P
Median PFS 4.0 months 1.9 months < 0.001
Median OS 13.1 months 8.1 months 0.009
Dimopoulos et al. ASH 2013 (Abstract 408), oral presentation
Updated PFS and OS results median follow-up 15.4 months
Approval in EU for patients who have previously received at least two prior therapies including bz and len and have demonstrated disease progression on
their last line of therapy
Analysis of pts (n=456) double refractory to bortezomib and lenalidomide

Pomalidomide combinations
Phase 2: Pom-Dex vs Pom-Cyclo-Dex
(n=34)1
Phase 2: Pom-Bortezomib-Dex
(n=47)2
Pom-Dex Pom-Cyclo-Dex p PVDORR, % 38.9 64.7 0.03 85
≥ VGPR, % 13.8 11.8 NA 45
PFS, months 4.4 9.5 0.1078 10.7
OS, months 16.8 Not reached 0.1308 EFS of 94% at 12m
1. Baz et al. ASH 2014 (Abstract 303), oral presentation 2. Lacy et al. ASH 2014 (Abstract 304), oral presentation
Cyclophosphamide dose: 400 mg po days 1, 8 and 15
At least 2 prior lines & Len-refractory 1-4 prior lines & Len-refractory
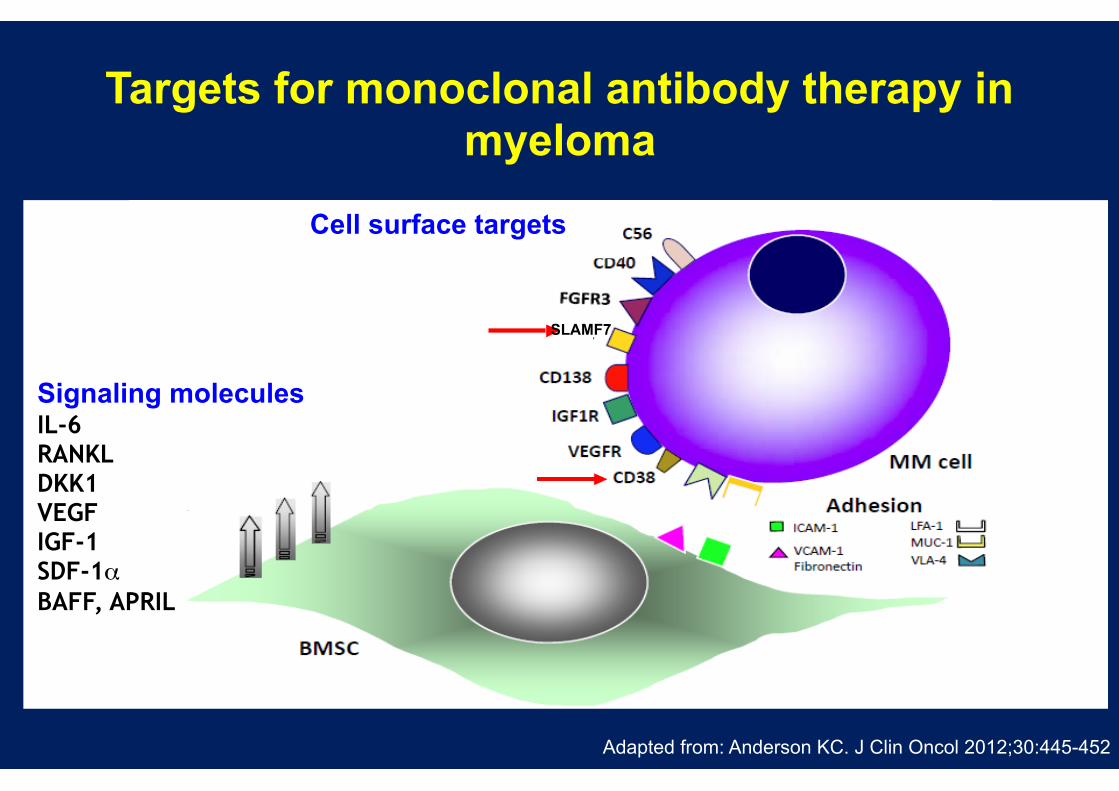
Targets for monoclonal antibody therapy in myeloma
Adapted from: Anderson KC. J Clin Oncol 2012;30:445-452
Cell surface targets
Signaling molecules IL-6 RANKL DKK1 VEGF IGF-1 SDF-1α BAFF, APRIL
SLAMF7

ELOQUENT-2 Co-primary endpoint: progression-free survival
Lonial S, et al. N Engl J Med 2015; doi:10.1056/NEJMoa1505654. PFS analysis used the primary definition of PFS.
E-Ld-treated patients had a 30% reduction in the risk of disease progression or death;
treatment difference at 1 and 2 years was 11% and 14%, respectively
E-Ld
Ld
0.0
0.2
0.4
0.6
0.8
1.0
380 2 4 6 8 10 12 14 16 18 20 22 24 26 28 30 32 34 36No. of patients at risk: E-Ld Ld
321 325
303 295
279 249
259 216
232 192
215 173
195 158
178 141
157 123
143 106
128 89
117 72
85 48
59 36
42 21
32 13
12 7
7 2
57%
68%
27%
41%
1-year PFS 2-year PFS
PFS (mo.)
Prob
abili
ty p
rogr
essi
on fr
ee
0 0
1 0
E-Ld Ld
Hazard ratio = 0.70 (95% CI, 0.57–0.85) P=0.0004
Median PFS (95% CI)
19.4 mo. (16.6–22.2)
14.9 mo. (12.1–17.2)

Targets for monoclonal antibody therapy in myeloma
Adapted from: Anderson KC. J Clin Oncol 2012;30:445-452
Cell surface targets
Signaling molecules IL-6 RANKL DKK1 VEGF IGF-1 SDF-1α BAFF, APRIL
SLAMF7
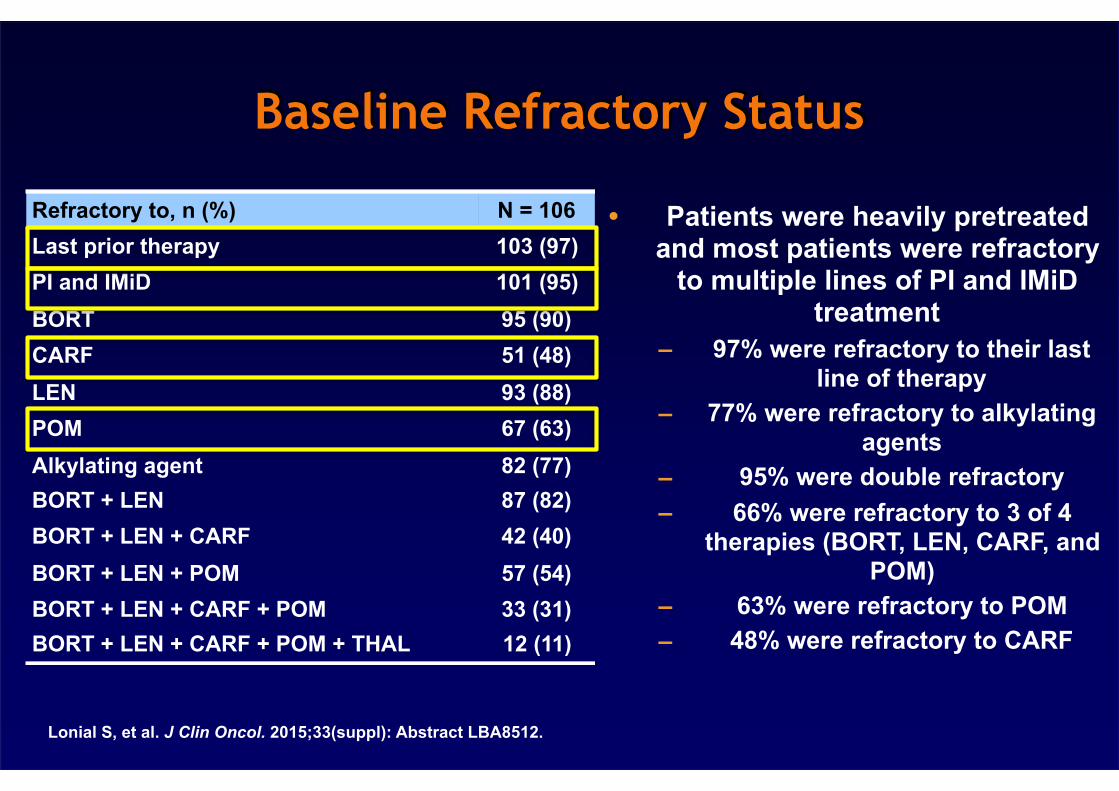
Baseline Refractory Status
• Patients were heavily pretreated and most patients were refractory
to multiple lines of PI and IMiD treatment
– 97% were refractory to their last line of therapy
– 77% were refractory to alkylating agents
– 95% were double refractory – 66% were refractory to 3 of 4
therapies (BORT, LEN, CARF, and POM)
– 63% were refractory to POM – 48% were refractory to CARF
Refractory to, n (%) N = 106Last prior therapy 103 (97)PI and IMiD 101 (95)BORT 95 (90)CARF 51 (48)LEN 93 (88)POM 67 (63)Alkylating agent 82 (77)BORT + LEN 87 (82)BORT + LEN + CARF 42 (40)BORT + LEN + POM 57 (54)BORT + LEN + CARF + POM 33 (31)BORT + LEN + CARF + POM + THAL 12 (11)
Lonial S, et al. J Clin Oncol. 2015;33(suppl): Abstract LBA8512.

Overall Response Rate
• ORR was 29% (95% CI, 21-39) in patients receiving 16 mg/kg DARA
• Stringent complete response (sCR) in 3% of patients (95% CI, 0.6-8.0)
• VGFR or better achieved in 12% (95% CI, 7-20) of patients
• Clinical benefit rate (ORR + MR) was 34% (95% CI, 25-44)
Lonial S, et al. J Clin Oncol. 2015;33(suppl): Abstract LBA8512.
Ove
rall
Res
pons
e R
ate,
%
35
30
25
20
15
10
5
016 mg/kg
ORR = 29%sCR
n = 3 (3%)
VGPR n = 10 (9%)
PR n = 18 (17%)
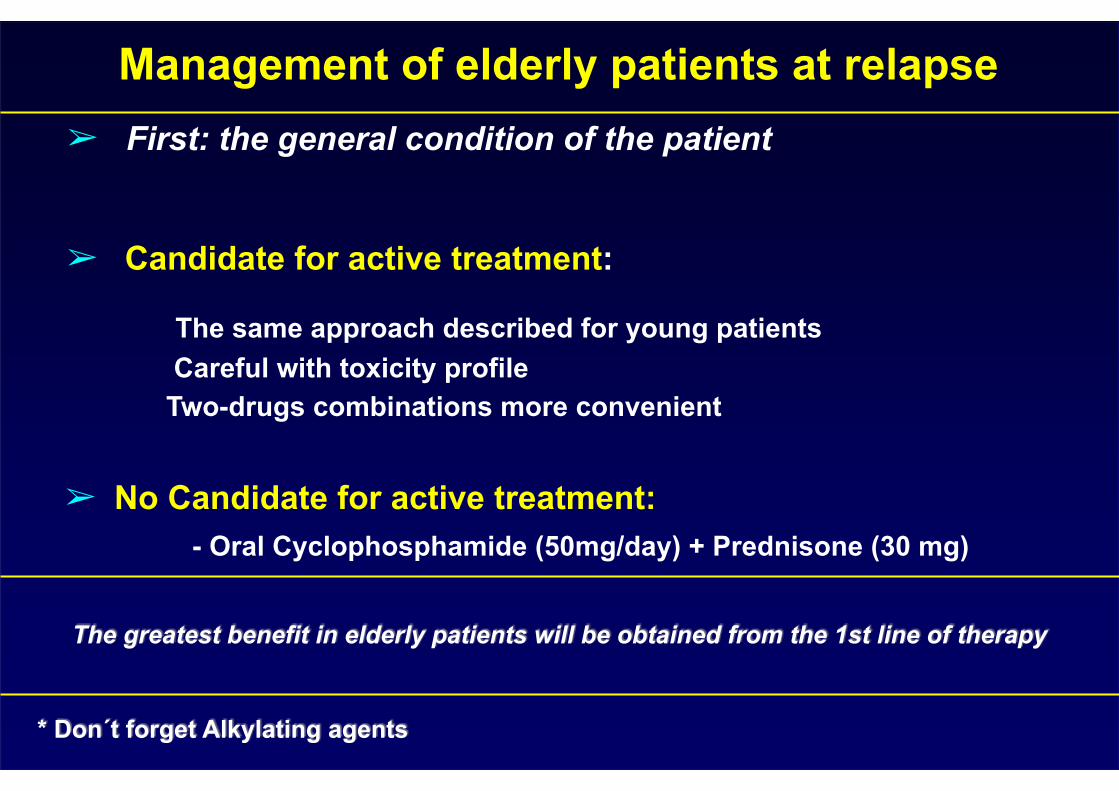
➢ First: the general condition of the patient
➢ Candidate for active treatment:
The same approach described for young patients Careful with toxicity profile Two-drugs combinations more convenient
➢ No Candidate for active treatment: - Oral Cyclophosphamide (50mg/day) + Prednisone (30 mg)
* Don´t forget Alkylating agents
Management of elderly patients at relapse
The greatest benefit in elderly patients will be obtained from the 1st line of therapy
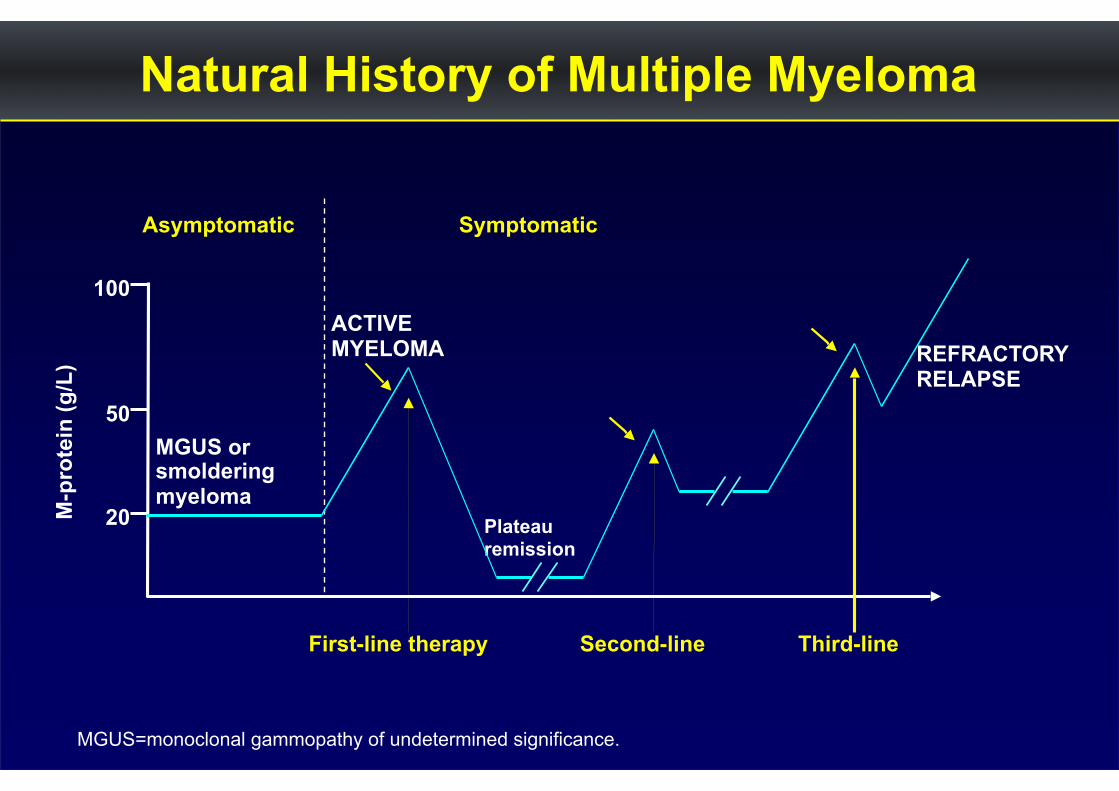
Natural History of Multiple Myeloma
MGUS or smoldering myeloma
Asymptomatic Symptomatic
ACTIVE MYELOMA
M-p
rote
in (g
/L)
20
50
100
REFRACTORY RELAPSE
First-line therapy
Plateau remission
Second-line Third-line
MGUS=monoclonal gammopathy of undetermined significance.

Ocio, Leukemia 2014
New drugs and mechanisms of action in MM
Bortezomib Carfilzomib Ixazomib Oprozomib Marizomib
Proteasome Inh.
Melphalan Cyclophosphamide Bendamustine Melflufen
Alkylators
DNA Damaging Zalypsis PARP Inhibitor Veliparib Hypoxia act. Alkylator TH-302
Other DNA damaging
Lymph. NK cell
Approved / Phase III development
Thalidomide Lenalidomide Pomalidomide
IMIDs
KSP Inh Arry-520 Aurora K Inh MLN8237 CDK 4/6 Inh Seleciclib
Cell cycle Inh.
Panobinostat Vorinostat Romidepsin Givinostat Rocilinostat
DACi
MoAb
CS-1 Elotuzumab CD38 Daratumumab / SAR650984 CD138 nBT062-DM4 CD56 Lorvotuzumab CD40 Dacetuzumab / Lucatumumab BAFF Tabalumab KiR IPH2101
IL-6 Siltuximab
AKT Perifosine / GSK2110183 mTORC1 Everolimus / Temsirolimus mTOR C1/C2 MLN0128 / INK128 Farn Transf Tipifarnib p38/MAPK inh SCIO-469 p38/JNK act Aplidin MEK Selumetinib
Signaling Pathways
Raf
MEK
MAPK
PI3K
Akt
Ras
mTORC1 mTORC2
Kinase Inh.
CDK 1, 2, 5, 9 Dinaciclib FGFR3 Dovitinib / AB1010 / MFGR 1877S cKit /PDGFR Imatinib / Dasatinib VEGF-R Bevacizumab IGF-1R AVE1642 / CP-751, 851 EGF-R Cetuximab PKC Enzastaurin
Acknowledgments
Investigators including cases in trials of the Spanish Myeloma Group, and most of all, the patients!