Embed Size (px)
Citation preview
7/31/2019 Market Outlook 080612
http://slidepdf.com/reader/full/market-outlook-080612 1/12
Market Outlook
June 8, 2012
www.angelbroking.com
Market Outlook
June 8, 2012
Dealer’s Diary
The Indian markets are expected to open in the red tracing negative opening inmost of the Asian bourses and the SGX Nifty. Asian stocks were trading lower aftercomments by Federal Reserve Chairman Ben S. Bernanke overshadowed China’s
first interest-rate cut since 2008.
The People’s Bank of China has lowered its benchmark lending and deposit ratesby 25 basis points. The announcement, two days before China is due to reportinflation, investment and output figures, may signal that the economy is weakerthan the government expected. Bernanke said the central bank will need to assessconditions before deciding if more measures are needed to stoke an economythreatened by Europe’s debt crisis and U.S. budget cuts.
Meanwhile Indian shares extended recent gains on Thursday after the rupeebreached the 55 mark to hit a two-week high against the dollar reflecting a returnof appetite for risk. Talks of the government giving a big push to infrastructuredevelopment bolstered sentiments. Although there were reports of the UnionCabinet deferring a decision on the Pension Bill due to lack of consensus, thebenchmark indices ended the trading day with significant gains.
Markets TodayThe trend deciding level for the day is 16,617 /5,039 levels. If NIFTY trades abovethis level during the first half-an-hour of trade then we may witness a further rallyup to 16,713 – 16,777/ 5,070 – 5,091 levels. However, if NIFTY trades below16,617/5,039 levels for the first half-an-hour of trade then it may correct up to16,552 – 16,456/ 5,018 – 4,987 levels.
Indices S2 S1 PIVO T R1 R2SENSEX 16,45 6 16,552 16,617 16,713 16,777
NIFTY 4,987 5,018 5,039 5,070 5,091
N ews Analysis China cut borrowing costs RIL plans a capex of
`
100,000cr over next 4 years L&T bags orders worth
`
2,410crRefer detailed news analysis on the following page
Net Inflow s (June 06, 2012)`
cr Purch Sales Net MTD YTD
FII 3,329 3,160 169 (1,173) 40,765MFs 831 361 470 817 (5,649)
FII Der ivatives (June 07 , 2012)`
cr Purch Sales Net Open Interest
Index Futures 2,165 1,034 1,132 8,544
Stock Futures 1,640 999 641 22,150
Gainers / LosersGainers Losers
Company Price (`
) chg (%) Company Price (`
) chg (%)
Shree Renuka Sugars 28 7.6 Tata Comm. 220 (2.6)
Reliance Capital 337 7.2 IRB Infrastructure 120 (2.0)
India Infoline 55 6.2 Wipro 401 (1.9)
IVRCL Ltd. 44 5.5 HPCL 295 (1.9)
Zee Entertainment 137 5.0 Indian Oil Corp. 250 (1.8)
Domestic Indices Chg (%) (Pts) (Close)
BSE Sensex 1.2 194.8 16,649
Nifty 1.1 52.6 5,050
MID CAP 0.7 42.9 5,975SMALL CAP 0.5 29.0 6,314
BSE HC 0.3 20.1 6,636
BSE PSU 0.5 34.9 6,911
BANKEX 2.1 236.7 11,455
AUTO 1.3 119.9 9,187
METAL 1.3 133.8 10,269
OIL & GAS 0.6 43.7 7,743
BSE IT 0.4 20.6 5,659
Global Indices Chg (%) (Pts) (Close)
Dow Jones 0.4 46.2 12,461NASDAQ (0.5) (13.7) 2,831
FTSE 1.2 63.7 5,448
Nikkei 1.2 106.2 8,640
Hang Seng 0.9 157.8 18,678
Straits Times (0.1) (1.6) 2,759
Shanghai Com (0.7) (16.4) 2,293
Indian ADRs Chg (%) (Pts) (Close)
INFY (2.4) (1.1) $43.9
WIT (1.2) (0.1) $8.9IBN 0.1 0.0 $30.1
HDB 3.3 1.0 $30.7
Advances / Declines BSE NSE
Advances 1,527 848
Declines 1,172 589
Unchanged 125 101
Volumes (`
cr)
BSE 2,177
NSE 10,686
7/31/2019 Market Outlook 080612
http://slidepdf.com/reader/full/market-outlook-080612 2/12
www.angelbroking.com
Market OutlookJune 8, 2012
China cut borrowing costs
China reduced interest rates for the first time since 2008 and loosened controls onbanks’ lending and deposit rates, in its bid to combat a deepening slowdown as
Europe’s ongoing debt crisis threatens global growth. The one-year lending rateand one-year deposit rate were reduced by 25bps to 6.31%, and 3.25%,respectively. Banks are now given more leeway to offer upto 10% higher thanbenchmark deposit rate to depositors and to charge upto 20% lower than the keybenchmark lending rate (previously 10%).
RIL plans a capex of`
100,000cr over next 4 years
Reliance Industries (RIL) conducted its Annual General Meeting (AGM) for FY2012.With cash and equivalents of ~
`
80,000cr as of March 31, 2012 on RIL’s balance
sheet, Chairman Mr. Mukesh Ambani announced that the company plans to invest`
100,000cr across business segments over the coming four years. It targets toinvest ~ US$3.5bn on shale gas. On its core petrochemical business, RIL aims toincrease its capacity to 25mn tonnes from the current 15mn tonnes and also investin operational efficiency projects. RIL aims to become a market leader in retailbusiness and targets to achieve top-line of
`
40,000-50,000cr over the next three-four years (current top-line
`
7,600cr). Further RIL informed that although KG D6production has declined over the past one year to 34mmscmd, it aims to raisetotal gas production to 60mmscmd by 2015. On profitability front, Mr. Ambanisaid that RIL aimed to double its operating profits in the coming five years. RIL hasbought back 2.79cr shares at a cost of
`
1,929cr under its share-buybackprogram. Alongside decline in KG D6 gas output, deployment of huge cash pilewas amongst the key concerns on the stock. Clarity over deployment of cash ispositive in our view. We maintain our Buy rating on the stock with a target price of`
879 .
L&T bags orders worth`
2,410cr
L&T’s construction arm has won`
2,410cr new orders across various businessesduring April-June 2012. The Buildings and Factories IC has secured new ordersworth
`
1,921cr. The orders are from leading developers for the construction of
major residential towers across various cities in the northern part of the country.L&T Infrastructure IC has won orders to the tune of
`
345cr for the design andconstruction of viaducts and three elevated stations from Delhi Metro RailCorporation which also includes additional orders from various ongoing projects.Water effluent and treatment business has bagged new orders worth
`
244cr fromBangalore Water Supply and Sewerage Board for upgrading the existing waterdistribution systems including additional orders from various ongoing projects.
At the CMP of`
1,277, the stock is trading at 16.7x FY2014E earnings and 2.4xFY2014E P/ BV on a standalone basis. We have used the SOTP methodology tovalue the company to capture all its business initiatives and investments/ stakes in
different businesses. Ascribing separate values to its parent business on a P/ E basisand investments in subsidiaries on P/ E, P/ BV and mcap basis, our target priceworks out to
`
1,553, which provides 21.6% upside from current levels. Werecommend Buy on the stock .
7/31/2019 Market Outlook 080612
http://slidepdf.com/reader/full/market-outlook-080612 3/12
www.angelbroking.com
Market OutlookJune 8, 2012
Economic and Poli tical N ews
People’s Bank of China cuts interest rates as economy continues to slide Monsoon 36% below average in first week: IMD PM's push for infra sector to boost investor confidence: CII Cabinet defers decision on pension reforms bill
Corporate N ews Tata Steel to set up
`
30,000cr plant in Karnataka Suzlon to invest
`
15,000cr to set up a 2,500 MW wind farm in Karnataka Dr Reddy's launches generic Parkinson's disease tablets in US BHEL commissions 250MW unit at UP thermal power project Jubiliant Life Sciences to invest ~
`
1,000cr across businesses in KarnatakaSource: Economic Times, Business Standard, Business Line, Financial Express, Mint
7/31/2019 Market Outlook 080612
http://slidepdf.com/reader/full/market-outlook-080612 4/12
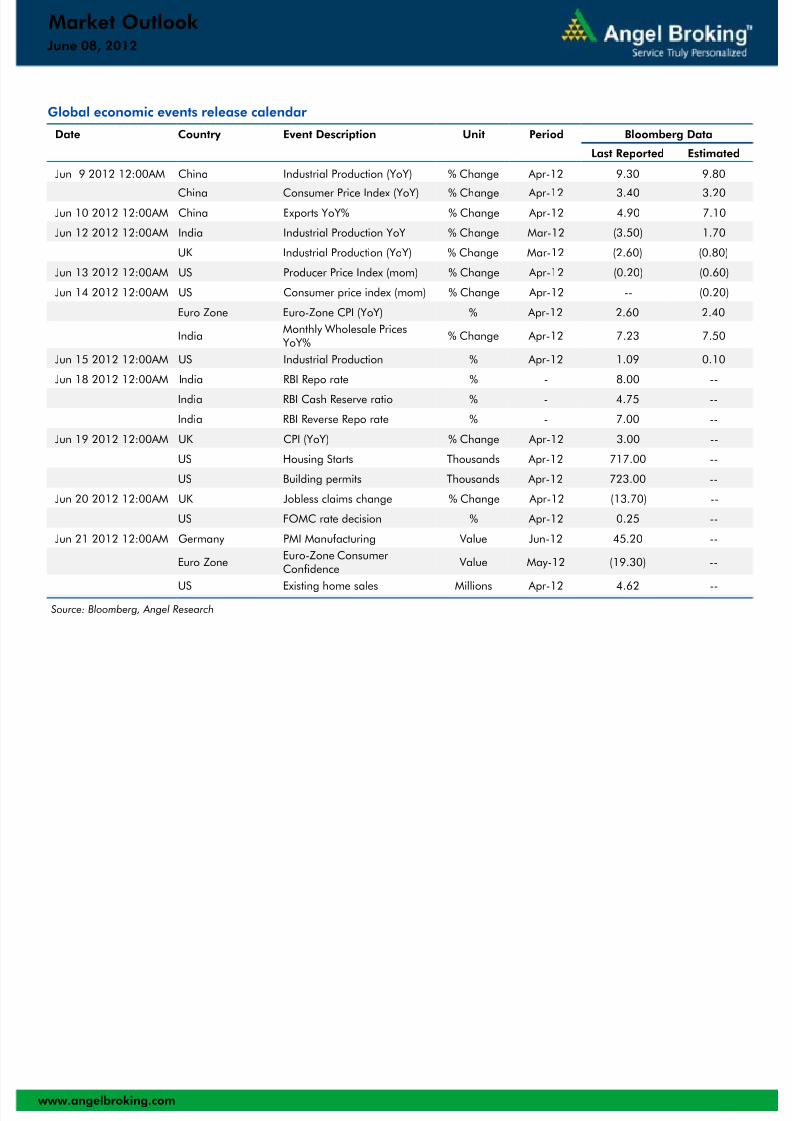
Global economic events release calendar
Date Country Event Description Unit Period Bloomberg Data
Last Reported Estimated
Jun 9 2012 12:00AM China Industrial Production (YoY) % Change Apr-12 9.30 9.80
China Consumer Price Index (YoY) % Change Apr-12 3.40 3.20Jun 10 2012 12:00AM China Exports YoY% % Change Apr-12 4.90 7.10
Jun 12 2012 12:00AM India Industrial Production YoY % Change Mar-12 (3.50) 1.70
UK Industrial Production (YoY) % Change Mar-12 (2.60) (0.80)
Jun 13 2012 12:00AM US Producer Price Index (mom) % Change Apr-12 (0.20) (0.60)
Jun 14 2012 12:00AM US Consumer price index (mom) % Change Apr-12 -- (0.20)
Euro Zone Euro-Zone CPI (YoY) % Apr-12 2.60 2.40
India Monthly Wholesale PricesYoY% % Change Apr-12 7.23 7.50
Jun 15 2012 12:00AM US Industrial Production % Apr-12 1.09 0.10
Jun 18 2012 12:00AM India RBI Repo rate % - 8.00 --
India RBI Cash Reserve ratio % - 4.75 --
India RBI Reverse Repo rate % - 7.00 --
Jun 19 2012 12:00AM UK CPI (YoY) % Change Apr-12 3.00 --
US Housing Starts Thousands Apr-12 717.00 --
US Building permits Thousands Apr-12 723.00 --
Jun 20 2012 12:00AM UK Jobless claims change % Change Apr-12 (13.70) --
US FOMC rate decision % Apr-12 0.25 --
Jun 21 2012 12:00AM Germany PMI Manufacturing Value Jun-12 45.20 --
Euro Zone Euro-Zone ConsumerConfidence Value May-12 (19.30) --
US Existing home sales Millions Apr-12 4.62 -- Source: Bloomberg, Angel Research
www.angelbroking.com
June 08, 2012
Market Outlook
7/31/2019 Market Outlook 080612
http://slidepdf.com/reader/full/market-outlook-080612 5/12
Market StrategyJune 8 , 2012
www.angelbroking.com
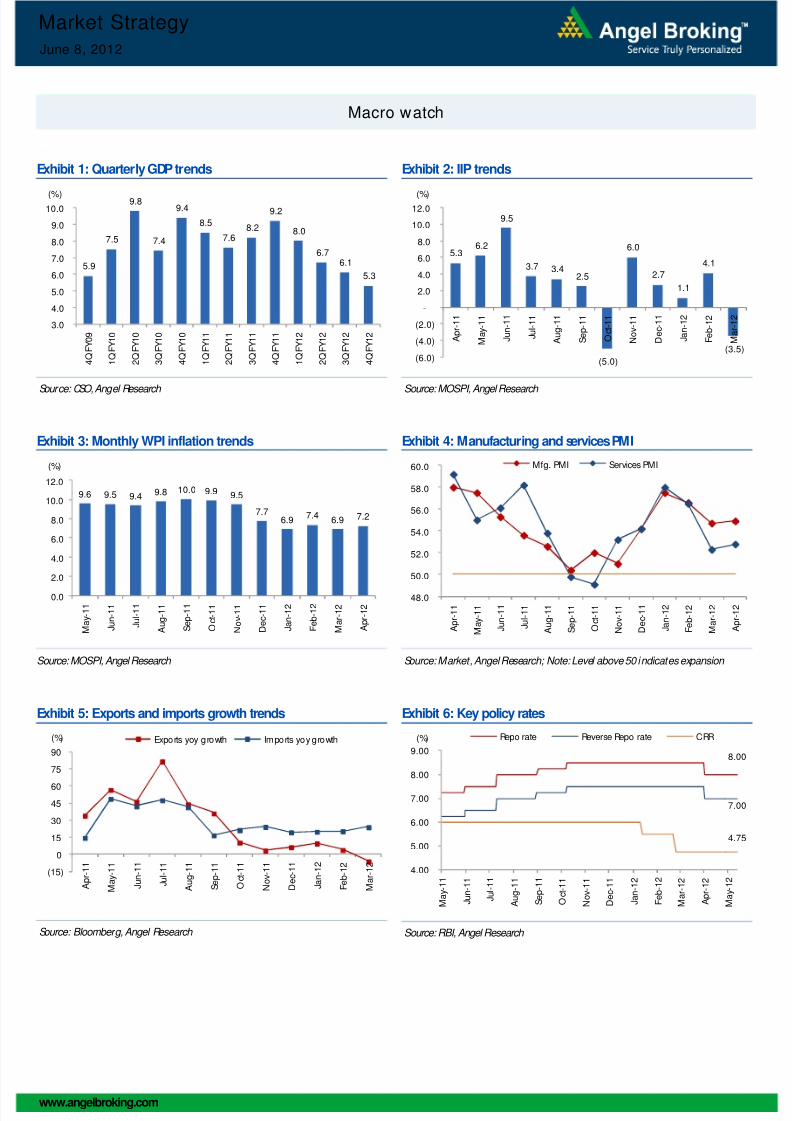
Macro watch
Exhibit 1: Quarterly GDP trends
5.9
7.5
9.8
7.4
9.4
8.5
7.68.2
9.2
8.0
6.76.1
5.3
3.0
4.0
5.0
6.0
7.0
8.0
9.0
10.0
4 Q F Y 0 9
1 Q F Y 1 0
2 Q F Y 1 0
3 Q F Y 1 0
4 Q F Y 1 0
1 Q F Y 1 1
2 Q F Y 1 1
3 Q F Y 1 1
4 Q F Y 1 1
1 Q F Y 1 2
2 Q F Y 1 2
3 Q F Y 1 2
4 Q F Y 1 2
(%)
Source: CSO, Angel Research
Exhibit 2: IIP trends
5.36.2
9.5
3.7 3.42.5
(5.0)
6.0
2.71.1
4.1
(3.5)(6.0)
(4.0)
(2.0)
-
2.0
4.0
6.0
8.0
10.0
12.0
A p r - 1 1
M a y - 1 1
J u n - 1
1
J u l - 1 1
A u g - 1
1
S e p - 1
1
O c t - 1 1
N o v - 1 1
D e c - 1 1
J a n - 1
2
F e b - 1
2
M a r - 1 2
(%)
Source: MOSPI, Angel Research
Exhibit 3: Monthly WPI inflation trends
9.6 9.5 9.4 9.8 10.0 9.9 9.5
7.76.9 7.4 6.9 7.2
0.0
2.0
4.0
6.0
8.0
10.0
12.0
M a y - 1 1
J u n - 1
1
J u l - 1 1
A u g - 1
1
S e p - 1
1
O c t - 1 1
N o v - 1 1
D e c - 1 1
J a n - 1
2
F e b - 1
2
M a r - 1 2
A p r - 1 2
(%)
Source: MOSPI, Angel Research
Exhibit 4: Manufacturing and services PMI
48.0
50.0
52.0
54.0
56.0
58.0
60.0
A p r - 1 1
M a y - 1 1
J u n - 1
1
J u l - 1 1
A u g - 1
1
S e p - 1
1
O c t - 1 1
N o v - 1 1
D e c - 1 1
J a n - 1
2
F e b - 1
2
M a r - 1 2
A p r - 1 2
Mfg. PMI Services PMI
Source: Market, Angel Research; Note: Level above 50 indicates expansion
Exhibit 5: Exports and imports growth trends
(15)
0
15
30
45
60
75
90
A p r - 1 1
M a y - 1 1
J u n - 1
1
J u l - 1 1
A u g - 1
1
S e p - 1
1
O c t - 1 1
N o v - 1 1
D e c - 1 1
J a n - 1
2
F e b - 1
2
M a r - 1 2
Exports yoy growth Imports yoy growth(%)
Source: Bloomberg, Angel Research
Exhibit 6: Key policy rates
8.00
7.00
4.75
4.00
5.00
6.00
7.00
8.00
9.00
M a y - 1 1
J u n - 1
1
J u l - 1 1
A u g - 1
1
S e p - 1
1
O c t - 1 1
N o v - 1 1
D e c - 1 1
J a n - 1
2
F e b - 1
2
M a r - 1 2
A p r - 1 2
M a y - 1 2
Repo rate Reverse Repo rate CRR(%)
Source: RBI, Angel Research
7/31/2019 Market Outlook 080612
http://slidepdf.com/reader/full/market-outlook-080612 6/12
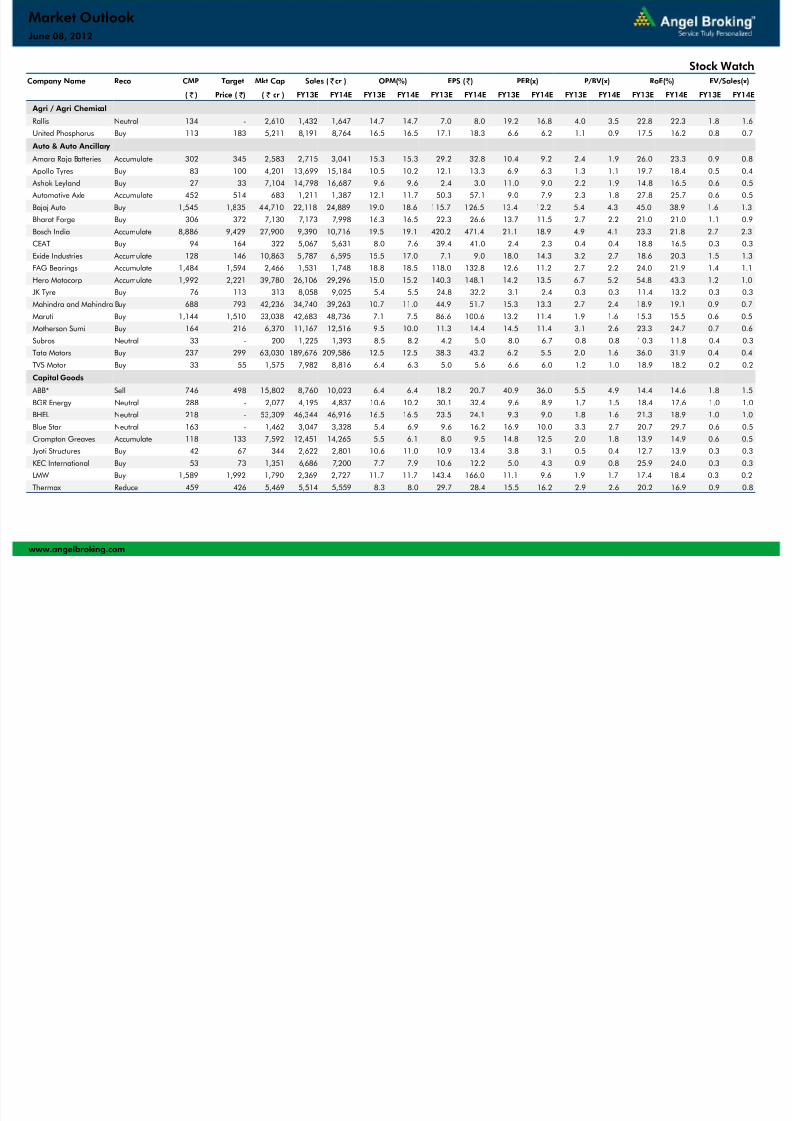
Company Name Reco CMP Target Mkt Cap Sales ( cr ) OPM(%) EPS ( ) PER(x) P/BV(x) RoE(%) EV/Sales(x)
( ) Price ( ) ( cr ) FY13E FY14E FY13E FY14E FY13E FY14E FY13E FY14E FY13E FY14E FY13E FY14E FY13E FY14E
Agri / Agri Chemical
Rallis Neutral 134 - 2,610 1,432 1,647 14.7 14.7 7.0 8.0 19.2 16.8 4.0 3.5 22.8 22.3 1.8 1.6United Phosphorus Buy 113 183 5,211 8,191 8,764 16.5 16.5 17.1 18.3 6.6 6.2 1.1 0.9 17.5 16.2 0.8 0.7
Auto & Auto Ancillary
Amara Raja Batteries Accumulate 302 345 2,583 2,715 3,041 15.3 15.3 29.2 32.8 10.4 9.2 2.4 1.9 26.0 23.3 0.9 0.8
Apollo Tyres Buy 83 100 4,201 13,699 15,184 10.5 10.2 12.1 13.3 6.9 6.3 1.3 1.1 19.7 18.4 0.5 0.4 Ashok Leyland Buy 27 33 7,104 14,798 16,687 9.6 9.6 2.4 3.0 11.0 9.0 2.2 1.9 14.8 16.5 0.6 0.5
Automotive Axle Accumulate 452 514 683 1,211 1,387 12.1 11.7 50.3 57.1 9.0 7.9 2.3 1.8 27.8 25.7 0.6 0.5Bajaj Auto Buy 1,545 1,835 44,710 22,118 24,889 19.0 18.6 115.7 126.5 13.4 12.2 5.4 4.3 45.0 38.9 1.6 1.3Bharat Forge Buy 306 372 7,130 7,173 7,998 16.3 16.5 22.3 26.6 13.7 11.5 2.7 2.2 21.0 21.0 1.1 0.9
Bosch India Accumulate 8,886 9,429 27,900 9,390 10,716 19.5 19.1 420.2 471.4 21.1 18.9 4.9 4.1 23.3 21.8 2.7 2.3CEAT Buy 94 164 322 5,067 5,631 8.0 7.6 39.4 41.0 2.4 2.3 0.4 0.4 18.8 16.5 0.3 0.3
Exide Industries Accumulate 128 146 10,863 5,787 6 ,595 15.5 17.0 7.1 9.0 18.0 14.3 3.2 2.7 18.6 20.3 1.5 1.3FAG Bearings Accumulate 1,484 1,594 2,466 1,531 1,748 18.8 18.5 118.0 132.8 12.6 11.2 2.7 2.2 24.0 21.9 1.4 1.1
Hero Motocorp Accumulate 1,992 2,221 39,780 26,106 29,296 15.0 15.2 140.3 148.1 14.2 13.5 6.7 5.2 54.8 43.3 1.2 1.0JK Tyre Buy 76 113 313 8,058 9,025 5.4 5.5 24.8 32.2 3.1 2.4 0.3 0.3 11.4 13.2 0.3 0.3Mahindra and Mahindra Buy 688 793 42,236 34,740 39,263 10.7 11.0 44.9 51.7 15.3 13.3 2.7 2.4 18.9 19.1 0.9 0.7
Maruti Buy 1,144 1,510 33,038 42,683 48,736 7.1 7.5 86.6 100.6 13.2 11.4 1.9 1.6 15.3 15.5 0.6 0.5Motherson Sumi Buy 164 216 6,370 11,167 12,516 9.5 10.0 11.3 14.4 14.5 11.4 3.1 2.6 23.3 24.7 0.7 0.6
Subros Neutral 33 - 200 1,225 1,393 8.5 8.2 4.2 5.0 8.0 6.7 0.8 0.8 10.3 11.8 0.4 0.3Tata Motors Buy 237 299 63,030 189,676 209,586 12.5 12.5 38.3 43.2 6.2 5.5 2.0 1.6 36.0 31.9 0.4 0.4
TVS Motor Buy 33 55 1,575 7,982 8,816 6.4 6.3 5.0 5.6 6.6 6.0 1.2 1.0 18.9 18.2 0.2 0.2
Capital Goods
ABB* Sell 746 498 15,802 8,760 10,023 6.4 6.4 18.2 20.7 40.9 36.0 5.5 4.9 14.4 14.6 1.8 1.5BGR Energy Neutral 288 - 2,077 4,195 4,837 10.6 10.2 30.1 32.4 9.6 8.9 1.7 1.5 18.4 17.6 1.0 1.0BHEL Neutral 218 - 53,309 46,344 46,916 16.5 16.5 23.5 24.1 9.3 9.0 1.8 1.6 21.3 18.9 1.0 1.0
Blue Star Neutral 163 - 1,462 3,047 3,328 5.4 6.9 9.6 16.2 16.9 10.0 3.3 2.7 20.7 29.7 0.6 0.5Crompton Greaves Accumulate 118 133 7,592 12,451 14,265 5.5 6.1 8.0 9.5 14.8 12.5 2.0 1.8 13.9 14.9 0.6 0.5Jyoti Structures Buy 42 67 344 2,622 2,801 10.6 11.0 10.9 13.4 3.8 3.1 0.5 0.4 12.7 13.9 0.3 0.3
KEC International Buy 53 73 1,351 6,686 7,200 7.7 7.9 10.6 12.2 5.0 4.3 0.9 0.8 25.9 24.0 0.3 0.3LMW Buy 1,589 1,992 1,790 2,369 2,727 11.7 11.7 143.4 166.0 11.1 9.6 1.9 1.7 17.4 18.4 0.3 0.2
Thermax Reduce 459 426 5,469 5,514 5,559 8.3 8.0 29.7 28.4 15.5 16.2 2.9 2.6 20.2 16.9 0.9 0.8
www.angelbroking.com
June 08, 2012
Market Outlook
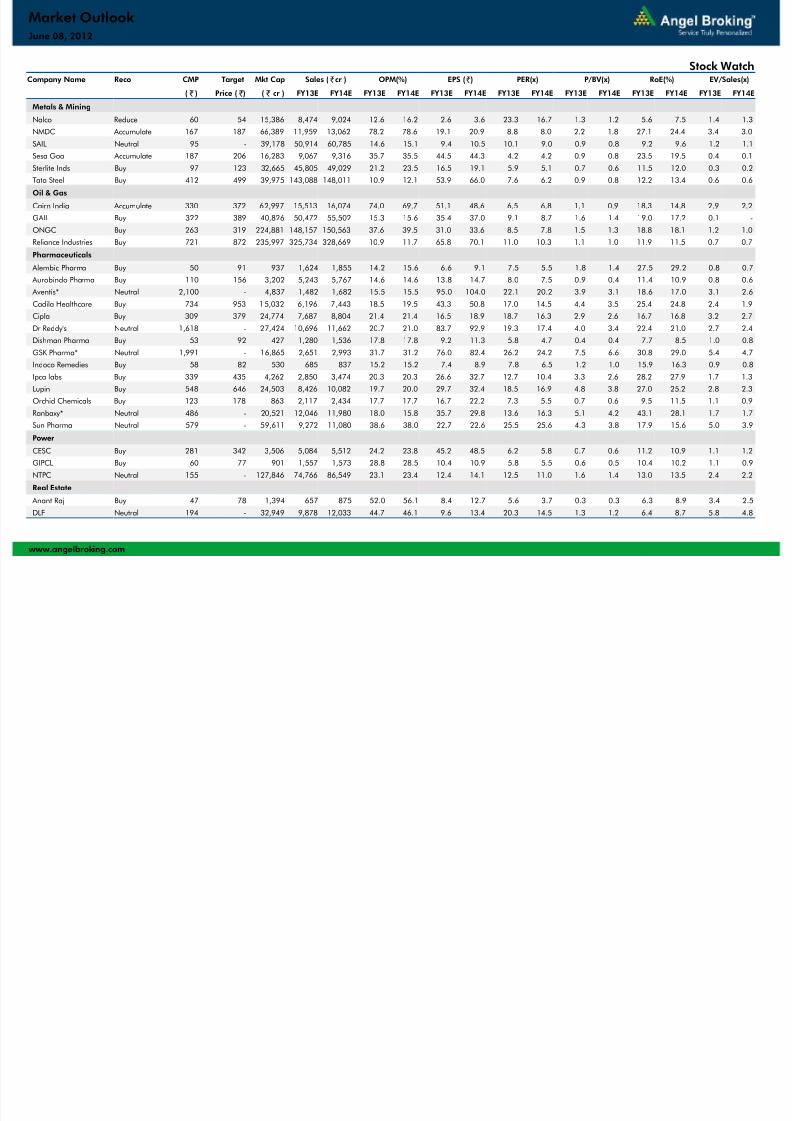
Stock Watch
7/31/2019 Market Outlook 080612
http://slidepdf.com/reader/full/market-outlook-080612 7/12
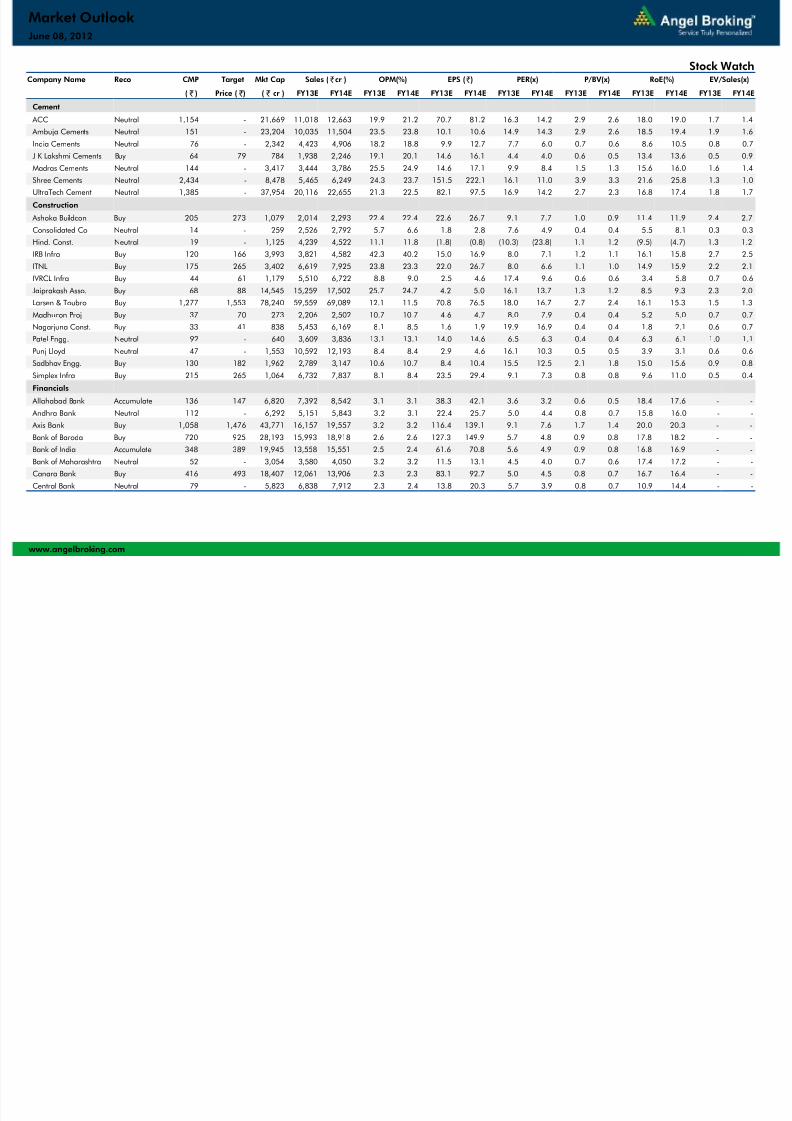
Company Name Reco CMP Target Mkt Cap Sales ( cr ) OPM(%) EPS ( ) PER(x) P/BV(x) RoE(%) EV/Sales(x)
( ) Price ( ) ( cr ) FY13E FY14E FY13E FY14E FY13E FY14E FY13E FY14E FY13E FY14E FY13E FY14E FY13E FY14E
Cement
ACC Neutral 1,154 - 21,669 11,018 12,663 19.9 21.2 70.7 81.2 16.3 14.2 2.9 2.6 18.0 19.0 1.7 1.4 Ambuja Cements Neutral 151 - 23,204 10,035 11,504 23.5 23.8 10.1 10.6 14.9 14.3 2.9 2.6 18.5 19.4 1.9 1.6
India Cements Neutral 76 - 2,342 4,423 4,906 18.2 18.8 9.9 12.7 7.7 6.0 0.7 0.6 8.6 10.5 0.8 0.7J K Lakshmi Cements Buy 64 79 784 1,938 2,246 19.1 20.1 14.6 16.1 4.4 4.0 0.6 0.5 13.4 13.6 0.5 0.9
Madras Cements Neutral 144 - 3,417 3,444 3,786 25.5 24.9 14.6 17.1 9.9 8.4 1.5 1.3 15.6 16.0 1.6 1.4Shree Cements Neutral 2,434 - 8,478 5,465 6,249 24.3 23.7 151.5 222.1 16.1 11.0 3.9 3.3 21.6 25.8 1.3 1.0
UltraTech Cement Neutral 1,385 - 37,954 20,116 22,655 21.3 22.5 82.1 97.5 16.9 14.2 2.7 2.3 16.8 17.4 1.8 1.7Construction
Ashoka Buildcon Buy 205 273 1,079 2,014 2,293 22.4 22.4 22.6 26.7 9.1 7.7 1.0 0.9 11.4 11.9 2.4 2.7
Consolidated Co Neutral 14 - 259 2,526 2,792 5.7 6.6 1.8 2.8 7.6 4.9 0.4 0.4 5.5 8.1 0.3 0.3Hind. Const. Neutral 19 - 1,125 4,239 4,522 11.1 11.8 (1.8) (0.8) (10.3) (23.8) 1.1 1.2 (9.5) (4.7) 1.3 1.2IRB Infra Buy 120 166 3,993 3,821 4,582 42.3 40.2 15.0 16.9 8.0 7.1 1.2 1.1 16.1 15.8 2.7 2.5
ITNL Buy 175 265 3,402 6,619 7,925 23.8 23.3 22.0 26.7 8.0 6.6 1.1 1.0 14.9 15.9 2.2 2.1IVRCL Infra Buy 44 61 1,179 5,510 6,722 8.8 9.0 2.5 4.6 17.4 9.6 0.6 0.6 3.4 5.8 0.7 0.6
Jaiprakash Asso. Buy 68 88 14,545 15,259 17,502 25.7 24.7 4.2 5.0 16.1 13.7 1.3 1.2 8.5 9.3 2.3 2.0Larsen & Toubro Buy 1,277 1,553 78,240 59,559 69,089 12.1 11.5 70.8 76.5 18.0 16.7 2.7 2.4 16.1 15.3 1.5 1.3
Madhucon Proj Buy 37 70 273 2,206 2,502 10.7 10.7 4.6 4.7 8.0 7.9 0.4 0.4 5.2 5.0 0.7 0.7Nagarjuna Const. Buy 33 41 838 5,453 6,169 8.1 8.5 1.6 1.9 19.9 16.9 0.4 0.4 1.8 2.1 0.6 0.7Patel Engg. Neutral 92 - 640 3,609 3,836 13.1 13.1 14.0 14.6 6.5 6.3 0.4 0.4 6.3 6.1 1.0 1.1
Punj Lloyd Neutral 47 - 1,553 10,592 12,193 8.4 8.4 2.9 4.6 16.1 10.3 0.5 0.5 3.9 3.1 0.6 0.6Sadbhav Engg. Buy 130 182 1,962 2,789 3,147 10.6 10.7 8.4 10.4 15.5 12.5 2.1 1.8 15.0 15.6 0.9 0.8
Simplex Infra Buy 215 265 1,064 6,732 7,837 8.1 8.4 23.5 29.4 9.1 7.3 0.8 0.8 9.6 11.0 0.5 0.4
Financials Allahabad Bank Accumulate 136 147 6,820 7,392 8,542 3.1 3.1 38.3 42.1 3.6 3.2 0.6 0.5 18.4 17.6 - -
Andhra Bank Neutral 112 - 6,292 5,151 5,843 3.2 3.1 22.4 25.7 5.0 4.4 0.8 0.7 15.8 16.0 - - Axis Bank Buy 1,058 1,476 43,771 16,157 19,557 3.2 3.2 116.4 139.1 9.1 7.6 1.7 1.4 20.0 20.3 - -
Bank of Baroda Buy 720 925 28,193 15,993 18,918 2.6 2.6 127.3 149.9 5.7 4.8 0.9 0.8 17.8 18.2 - -Bank of India Accumulate 348 389 19,945 13,558 15,551 2.5 2.4 61.6 70.8 5.6 4.9 0.9 0.8 16.8 16.9 - -
Bank of Maharashtra Neutral 52 - 3,054 3,580 4,050 3.2 3.2 11.5 13.1 4.5 4.0 0.7 0.6 17.4 17.2 - -Canara Bank Buy 416 493 18,407 12,061 13,906 2.3 2.3 83.1 92.7 5.0 4.5 0.8 0.7 16.7 16.4 - -
Central Bank Neutral 79 - 5,823 6,838 7,912 2.3 2.4 13.8 20.3 5.7 3.9 0.8 0.7 10.9 14.4 - -
www.angelbroking.com
June 08, 2012
Market Outlook
Stock Watch
7/31/2019 Market Outlook 080612
http://slidepdf.com/reader/full/market-outlook-080612 8/12
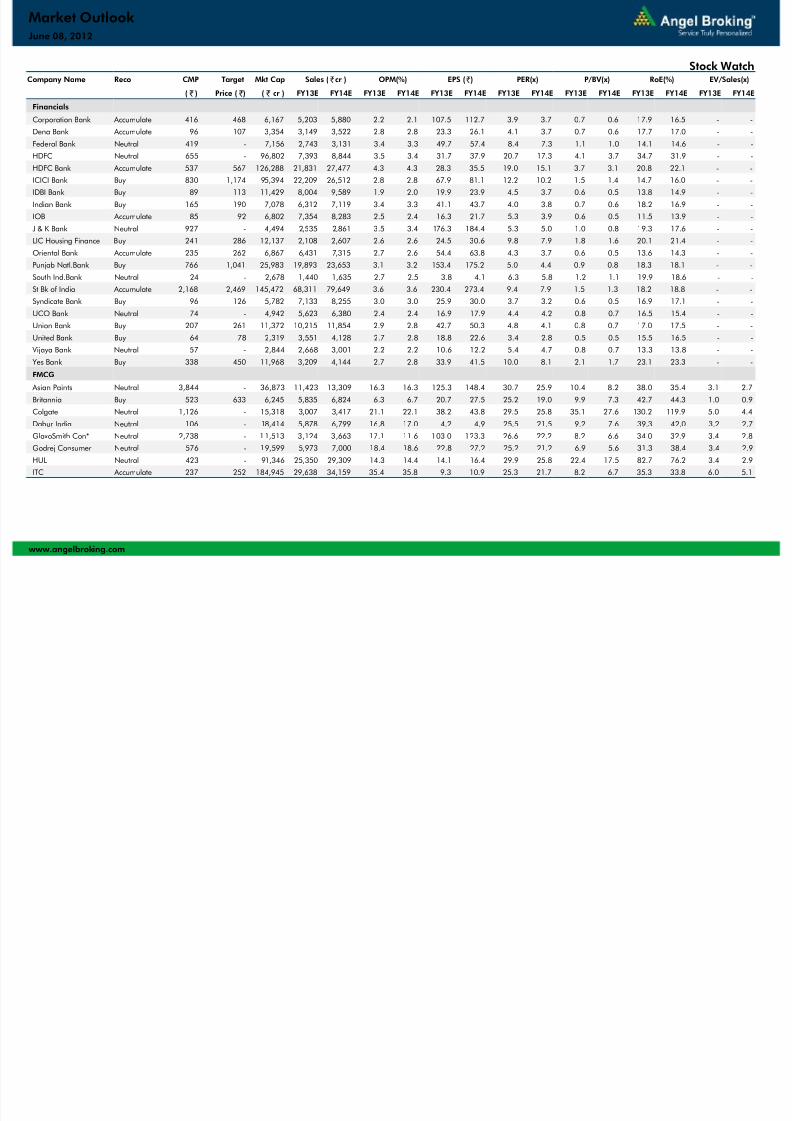
Company Name Reco CMP Target Mkt Cap Sales ( cr ) OPM(%) EPS ( ) PER(x) P/BV(x) RoE(%) EV/Sales(x)
( ) Price ( ) ( cr ) FY13E FY14E FY13E FY14E FY13E FY14E FY13E FY14E FY13E FY14E FY13E FY14E FY13E FY14E
Financials
Corporation Bank Accumulate 416 468 6,167 5,203 5,880 2.2 2.1 107.5 112.7 3.9 3.7 0.7 0.6 17.9 16.5 - -Dena Bank Accumulate 96 107 3,354 3,149 3,522 2.8 2.8 23.3 26.1 4.1 3.7 0.7 0.6 17.7 17.0 - -
Federal Bank Neutral 419 - 7,156 2,743 3,131 3.4 3.3 49.7 57.4 8.4 7.3 1.1 1.0 14.1 14.6 - -HDFC Neutral 655 - 96,802 7,393 8,844 3.5 3.4 31.7 37.9 20.7 17.3 4.1 3.7 34.7 31.9 - -
HDFC Bank Accumulate 537 567 126,288 21,831 27,477 4.3 4.3 28.3 35.5 19.0 15.1 3.7 3.1 20.8 22.1 - -ICICI Bank Buy 830 1,174 95,394 22,209 26,512 2.8 2.8 67.9 81.1 12.2 10.2 1.5 1.4 14.7 16.0 - -
IDBI Bank Buy 89 113 11,429 8,004 9,589 1.9 2.0 19.9 23.9 4.5 3.7 0.6 0.5 13.8 14.9 - -Indian Bank Buy 165 190 7,078 6,312 7,119 3.4 3.3 41.1 43.7 4.0 3.8 0.7 0.6 18.2 16.9 - -IOB Accumulate 85 92 6,802 7,354 8,283 2.5 2.4 16.3 21.7 5.3 3.9 0.6 0.5 11.5 13.9 - -
J & K Bank Neutral 927 - 4,494 2,535 2,861 3.5 3.4 176.3 184.4 5.3 5.0 1.0 0.8 19.3 17.6 - -LIC Housing Finance Buy 241 286 12,137 2,108 2,607 2.6 2.6 24.5 30.6 9.8 7.9 1.8 1.6 20.1 21.4 - -
Oriental Bank Accumulate 235 262 6,867 6,431 7,315 2.7 2.6 54.4 63.8 4.3 3.7 0.6 0.5 13.6 14.3 - -Punjab Natl.Bank Buy 766 1,041 25,983 19,893 23,653 3.1 3.2 153.4 175.2 5.0 4.4 0.9 0.8 18.3 18.1 - -
South Ind.Bank Neutral 24 - 2,678 1,440 1,635 2.7 2.5 3.8 4.1 6.3 5.8 1.2 1.1 19.9 18.6 - -St Bk of India Accumulate 2,168 2,469 145,472 68,311 79,649 3.6 3.6 230.4 273.4 9.4 7.9 1.5 1.3 18.2 18.8 - -Syndicate Bank Buy 96 126 5,782 7,133 8,255 3.0 3.0 25.9 30.0 3.7 3.2 0.6 0.5 16.9 17.1 - -
UCO Bank Neutral 74 - 4,942 5,623 6,380 2.4 2.4 16.9 17.9 4.4 4.2 0.8 0.7 16.5 15.4 - -Union Bank Buy 207 261 11,372 10,215 11,854 2.9 2.8 42.7 50.3 4.8 4.1 0.8 0.7 17.0 17.5 - -
United Bank Buy 64 78 2,319 3,551 4,128 2.7 2.8 18.8 22.6 3.4 2.8 0.5 0.5 15.5 16.5 - - Vijaya Bank Neutral 57 - 2,844 2,668 3,001 2.2 2.2 10.6 12.2 5.4 4.7 0.8 0.7 13.3 13.8 - -
Yes Bank Buy 338 450 11,968 3,209 4,144 2.7 2.8 33.9 41.5 10.0 8.1 2.1 1.7 23.1 23.3 - -
FMCG
Asian Paints Neutral 3,844 - 36,873 11,423 13,309 16.3 16.3 125.3 148.4 30.7 25.9 10.4 8.2 38.0 35.4 3.1 2.7Britannia Buy 523 633 6,245 5,835 6,824 6.3 6.7 20.7 27.5 25.2 19.0 9.9 7.3 42.7 44.3 1.0 0.9Colgate Neutral 1,126 - 15,318 3,007 3,417 21.1 22.1 38.2 43.8 29.5 25.8 35.1 27.6 130.2 119.9 5.0 4.4
Dabur India Neutral 106 - 18,414 5,878 6,799 16.8 17.0 4.2 4.9 25.5 21.5 9.2 7.6 39.3 42.0 3.2 2.7GlaxoSmith Con* Neutral 2,738 - 11,513 3,124 3,663 17.1 11.6 103.0 123.3 26.6 22.2 8.2 6.6 34.0 32.9 3.4 2.8Godrej Consumer Neutral 576 - 19,599 5,973 7,000 18.4 18.6 22.8 27.2 25.2 21.2 6.9 5.6 31.3 38.4 3.4 2.9
HUL Neutral 423 - 91,346 25,350 29,309 14.3 14.4 14.1 16.4 29.9 25.8 22.4 17.5 82.7 76.2 3.4 2.9ITC Accumulate 237 252 184,945 29,638 34,159 35.4 35.8 9.3 10.9 25.3 21.7 8.2 6.7 35.3 33.8 6.0 5.1
www.angelbroking.com
June 08, 2012
Market Outlook
Stock Watch
7/31/2019 Market Outlook 080612
http://slidepdf.com/reader/full/market-outlook-080612 9/12
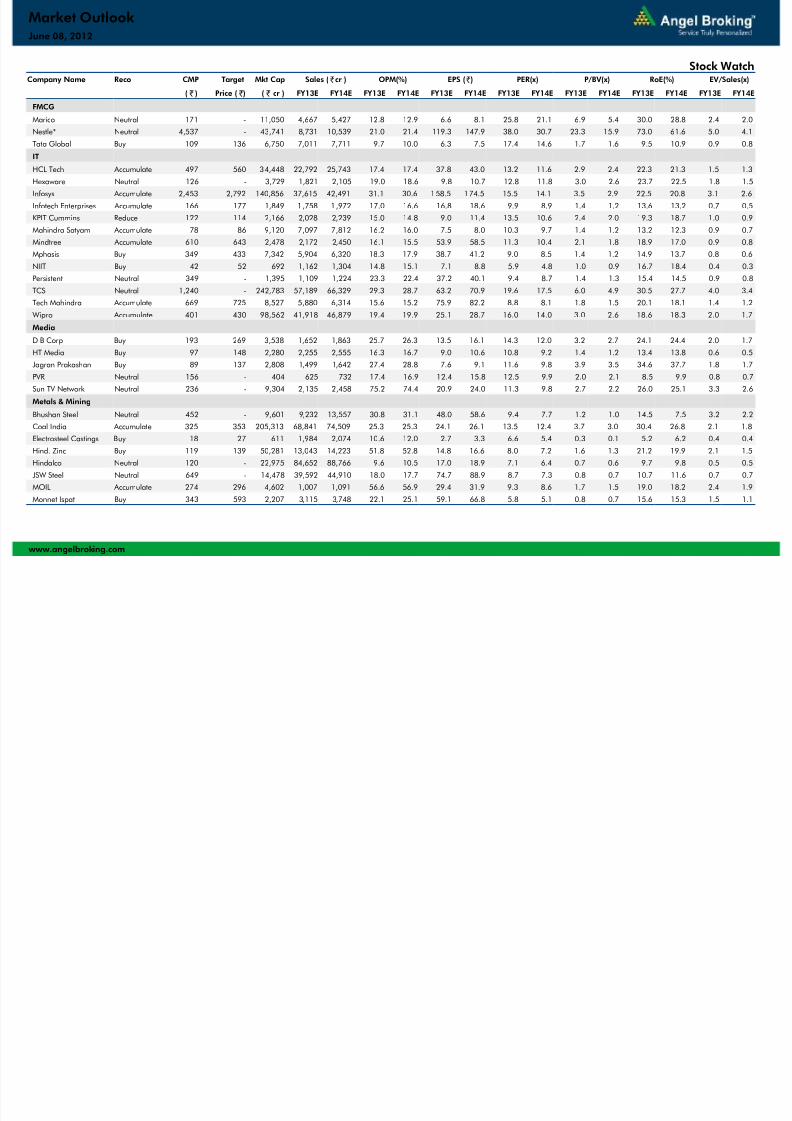
Company Name Reco CMP Target Mkt Cap Sales ( cr ) OPM(%) EPS ( ) PER(x) P/BV(x) RoE(%) EV/Sales(x)
( ) Price ( ) ( cr ) FY13E FY14E FY13E FY14E FY13E FY14E FY13E FY14E FY13E FY14E FY13E FY14E FY13E FY14E
FMCG
Marico Neutral 171 - 11,050 4,667 5,427 12.8 12.9 6.6 8.1 25.8 21.1 6.9 5.4 30.0 28.8 2.4 2.0Nestle* Neutral 4,537 - 43,741 8,731 10,539 21.0 21.4 119.3 147.9 38.0 30.7 23.3 15.9 73.0 61.6 5.0 4.1
Tata Global Buy 109 136 6,750 7,011 7,711 9.7 10.0 6.3 7.5 17.4 14.6 1.7 1.6 9.5 10.9 0.9 0.8
IT
HCL Tech Accumulate 497 560 34,448 22,792 25,743 17.4 17.4 37.8 43.0 13.2 11.6 2.9 2.4 22.3 21.3 1.5 1.3
Hexaware Neutral 126 - 3,729 1,821 2,105 19.0 18.6 9.8 10.7 12.8 11.8 3.0 2.6 23.7 22.5 1.8 1.5
Infosys Accumulate 2,453 2,792 140,856 37,615 42,491 31.1 30.6 158.5 174.5 15.5 14.1 3.5 2.9 22.5 20.8 3.1 2.6Infotech Enterprises Accumulate 166 177 1,849 1 ,758 1 ,972 17.0 16.6 16.8 18.6 9.9 8.9 1.4 1.2 13.6 13.2 0.7 0.5KPIT Cummins Reduce 122 114 2,166 2,028 2,239 15.0 14.8 9.0 11.4 13.5 10.6 2.4 2.0 19.3 18.7 1.0 0.9
Mahindra Satyam Accumulate 78 86 9,120 7,097 7,812 16.2 16.0 7.5 8.0 10.3 9.7 1.4 1.2 13.2 12.3 0.9 0.7Mindtree Accumulate 610 643 2,478 2,172 2,450 16.1 15.5 53.9 58.5 11.3 10.4 2.1 1.8 18.9 17.0 0.9 0.8Mphasis Buy 349 433 7,342 5,904 6,320 18.3 17.9 38.7 41.2 9.0 8.5 1.4 1.2 14.9 13.7 0.8 0.6
NIIT Buy 42 52 692 1,162 1,304 14.8 15.1 7.1 8.8 5.9 4.8 1.0 0.9 16.7 18.4 0.4 0.3Persistent Neutral 349 - 1,395 1,109 1,224 23.3 22.4 37.2 40.1 9.4 8.7 1.4 1.3 15.4 14.5 0.9 0.8
TCS Neutral 1,240 - 242,783 57,189 66,329 29.3 28.7 63.2 70.9 19.6 17.5 6.0 4.9 30.5 27.7 4.0 3.4Tech Mahindra Accumulate 669 725 8,527 5,880 6,314 15.6 15.2 75.9 82.2 8.8 8.1 1.8 1.5 20.1 18.1 1.4 1.2
Wipro Accumulate 401 430 98,562 41,918 46,879 19.4 19.9 25.1 28.7 16.0 14.0 3.0 2.6 18.6 18.3 2.0 1.7
Media
D B Corp Buy 193 269 3,538 1,652 1,863 25.7 26.3 13.5 16.1 14.3 12.0 3.2 2.7 24.1 24.4 2.0 1.7
HT Media Buy 97 148 2,280 2,255 2,555 16.3 16.7 9.0 10.6 10.8 9.2 1.4 1.2 13.4 13.8 0.6 0.5Jagran Prakashan Buy 89 137 2,808 1,499 1,642 27.4 28.8 7.6 9.1 11.6 9.8 3.9 3.5 34.6 37.7 1.8 1.7
PVR Neutral 156 - 404 625 732 17.4 16.9 12.4 15.8 12.5 9.9 2.0 2.1 8.5 9.9 0.8 0.7
Sun TV Network Neutral 236 - 9,304 2,135 2,458 75.2 74.4 20.9 24.0 11.3 9.8 2.7 2.2 26.0 25.1 3.3 2.6Metals & Mining
Bhushan Steel Neutral 452 - 9,601 9,232 13,557 30.8 31.1 48.0 58.6 9.4 7.7 1.2 1.0 14.5 7.5 3.2 2.2Coal India Accumulate 325 353 205,313 68,841 74,509 25.3 25.3 24.1 26.1 13.5 12.4 3.7 3.0 30.4 26.8 2.1 1.8Electrosteel Castings Buy 18 27 611 1,984 2,074 10.6 12.0 2.7 3.3 6.6 5.4 0.3 0.1 5.2 6.2 0.4 0.4
Hind. Zinc Buy 119 139 50,281 13,043 14,223 51.8 52.8 14.8 16.6 8.0 7.2 1.6 1.3 21.2 19.9 2.1 1.5Hindalco Neutral 120 - 22,975 84,652 88,766 9.6 10.5 17.0 18.9 7.1 6.4 0.7 0.6 9.7 9.8 0.5 0.5
JSW Steel Neutral 649 - 14,478 39,592 44,910 18.0 17.7 74.7 88.9 8.7 7.3 0.8 0.7 10.7 11.6 0.7 0.7MOIL Accumulate 274 296 4,602 1,007 1,091 56.6 56.9 29.4 31.9 9.3 8.6 1.7 1.5 19.0 18.2 2.4 1.9
Monnet Ispat Buy 343 593 2,207 3,115 3,748 22.1 25.1 59.1 66.8 5.8 5.1 0.8 0.7 15.6 15.3 1.5 1.1
www.angelbroking.com
June 08, 2012
Market Outlook
Stock Watch
7/31/2019 Market Outlook 080612
http://slidepdf.com/reader/full/market-outlook-080612 10/12
7/31/2019 Market Outlook 080612
http://slidepdf.com/reader/full/market-outlook-080612 11/12
Company Name Reco CMP Target Mkt Cap Sales ( cr ) OPM(%) EPS ( ) PER(x) P/BV(x) RoE(%) EV/Sales(x)
( ) Price ( ) ( cr ) FY13E FY14E FY13E FY14E FY13E FY14E FY13E FY14E FY13E FY14E FY13E FY14E FY13E FY14E
Real Estate
HDIL Buy 69 115 2,881 2,441 3,344 53.0 46.7 21.4 25.4 3.2 2.7 0.3 0.2 8.4 9.1 3.0 2.3
Telecom
Bharti Airtel Neutral 301 - 114,154 80,967 88,684 33.1 33.4 17.9 22.0 16.8 13.6 1.9 1.7 11.5 12.5 2.1 1.8
Idea Cellular Neutral 78 - 25,864 22,558 25,326 26.4 27.5 3.2 4.7 24.3 16.5 1.8 1.7 7.5 10.0 1.6 1.4Rcom Neutral 66 - 13,643 21,899 23,740 32.7 32.7 4.2 6.7 15.6 9.9 0.3 0.3 2.1 3.2 2.0 1.7
zOthers
Bajaj Electrical Buy 181 245 1,806 3,670 4,384 8.5 8.5 18.3 22.3 9.9 8.1 2.2 1.8 23.9 24.3 0.5 0.4CRISIL Neutral 1,072 - 7,519 982 1,136 34.3 34.3 34.3 40.0 31.2 26.8 14.1 11.3 50.9 46.9 7.2 6.1
Finolex Cables Buy 38 61 580 2,334 2,687 8.8 9.3 7.6 10.2 5.0 3.7 0.6 0.6 13.7 16.1 0.2 0.1Graphite India Buy 89 124 1,747 2,158 2,406 18.1 18.9 12.4 14.0 7.2 6.4 1.0 0.9 14.0 14.3 0.9 0.8
Greenply Buy 208 309 503 1,925 2,235 10.6 10.9 29.6 44.1 7.1 4.7 1.2 0.9 16.8 21.0 0.5 0.4Page Industries Neutral 2,994 - 3,339 887 1,108 18.3 18.6 95.0 120.9 31.5 24.8 16.5 13.4 57.4 59.5 3.8 3.0
Sintex Buy 56 79 1,515 4,751 5,189 16.3 16.6 13.6 15.8 4.1 3.5 0.5 0.5 12.9 13.2 0.7 0.6Siyaram Silk Mills Buy 254 392 238 1,042 1,173 12.4 12.5 66.3 78.5 3.8 3.2 0.7 0.6 21.1 20.8 0.5 0.4SpiceJet Buy 32 40 1,535 5,647 6,513 3.5 6.5 1.9 4.9 16.3 6.5 38.3 5.5 - - 0.4 0.3
Taj GVK Buy 61 108 381 300 319 35.8 36.2 7.9 9.1 7.7 6.7 1.0 0.9 13.9 14.4 1.6 1.3Goodyear Accumulate 329 374 758 1,511 1,692 7.9 9.0 31.5 41.3 10.4 8.0 2.1 1.7 21.2 23.5 0.3 0.2
HEG Buy 205 242 820 1,746 1,946 16.5 17.7 22.5 32.9 9.1 6.2 0.9 0.9 10.4 14.2 1.1 1.0Hitachi Buy 118 160 272 857 968 6.9 8.4 10.2 16.0 11.7 7.4 1.4 1.2 12.9 17.8 0.4 0.4
Honeywell Automation Accumulate 2,526 2,674 2,233 1,542 1,739 9.4 10.0 116.1 140.8 21.8 17.9 3.1 2.7 15.5 15.9Ineos ABS Accumulate 730 777 1,284 900 1,011 10.2 11.5 35.6 45.7 20.5 16.0 3.0 2.6 15.4 17.2
ITD Cementation Neutral 226 - 260 1,535 1,842 11.1 11.1 27.3 38.3 8.3 5.9 0.6 0.6 7.9 10.2 0.6 0.6
MRF Buy 10,795 13,106 4,578 12,390 14,400 10.4 11.3 1,334.6 1,638.2 8.1 6.6 1.6 1.3 16.5 17.4 0.6 0.5Relaxo Accumulate 449 478 539 1,019 1,208 11.0 10.8 44.9 53.1 10.0 8.5 2.4 1.9 27.2 25.0 0.7 0.6
Tata Sponge Buy 287 420 442 757 875 19.0 19.1 63.5 72.9 4.5 3.9 0.7 0.6 16.1 16.1 0.2 -TVS Srichakra Buy 330 462 253 1,612 1,827 9.5 9.8 72.3 92.5 4.6 3.6 1.3 1.0 33.1 32.1 0.4 0.3
Vesuvius India Accumulate 375 413 760 628 716 16.4 16.5 29.8 34.4 12.6 10.9 2.2 1.9 18.8 18.6 1.0 0.9 Abbott India Accumulate 1,449 1,628 3,080 1,661 1,918 9.7 12.0 60.7 90.4 23.9 16.0 4.9 4.0 22.0 27.3 1.6 1.3
Cera Sanitaryware Ltd Buy 249 288 315 385 444 17.2 17.4 28.9 32.0 8.6 7.8 1.8 1.5 23.4 21.1 1.0 0.9Jyothy Laboratories Buy 215 268 1,732 1,315 1,568 8.6 11.1 6.4 10.9 33.7 19.8 2.8 2.7 8.4 13.9 1.6 1.3
Force Motors Buy 457 680 596 2,346 2,753 6.7 7.0 50.9 61.9 9.0 7.4 0.5 0.5 5.5 6.3 0.2 0.2
Source: Company, Angel Research; Note: *December year end; #September year end; &October year end; Price as on June 07, 2012
www.angelbroking.com
June 08, 2012
Market Outlook
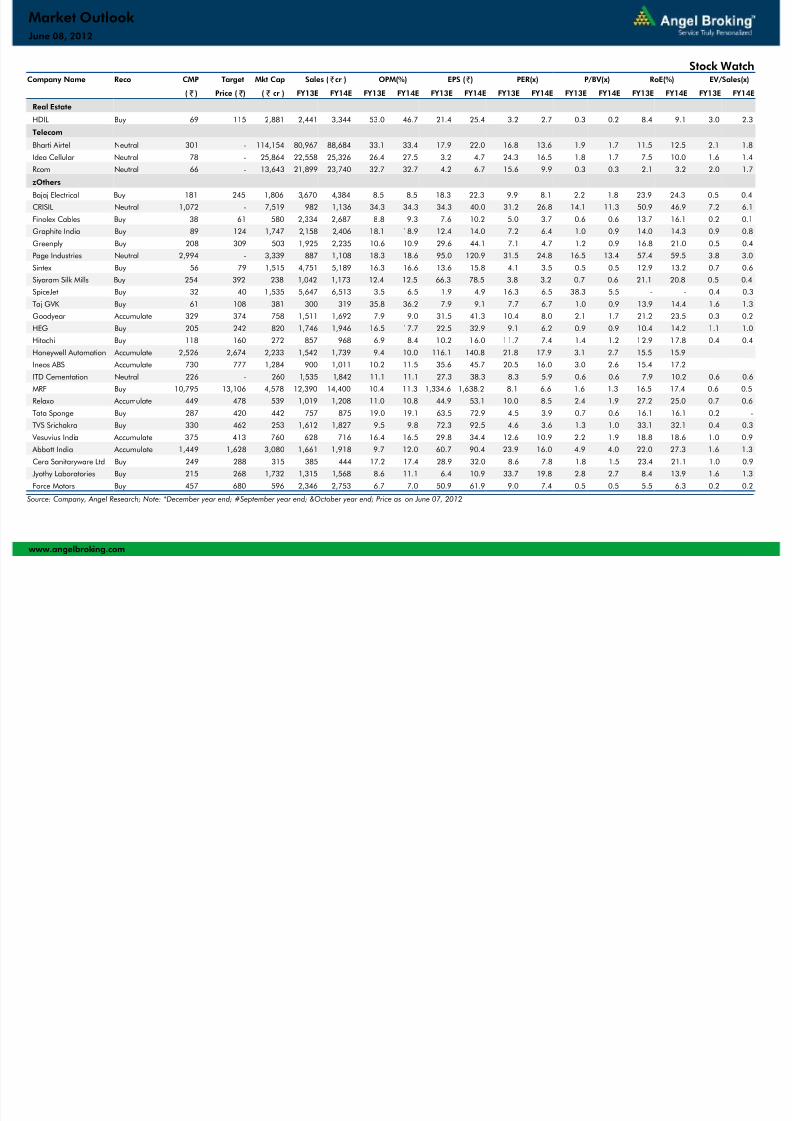
Stock Watch
7/31/2019 Market Outlook 080612
http://slidepdf.com/reader/full/market-outlook-080612 12/12
June 08, 2012
Market Outlook


![British Columbia Labour Market Outlook 2010 - 2020 · Labour Market OutlookLabour Market Outlook British Columbia Labour Market Outlook: 2010-2020 [2] B.C. Labour Market Outlook,](https://img.pdfslide.net/doc/110x75/5e167e8e481eae63a43f8127/british-columbia-labour-market-outlook-2010-2020-labour-market-outlooklabour-market.jpg)