Embed Size (px)
Citation preview
MARKOVIAN APPLICATION TO PRODUCT SWITCHING IN KENYA’S
HOTEL INDUSTRY: A SURVEY OF SHOWER GEL AND GUESTS’ SOAP
JAVAN SOLOMON OKELLO
A RESEARCH PROJECT SUBMITTED IN PARTIAL FULFILLMENT OF
THE REQUIREMENTS FOR THE AWARD OF THE DEGREE OF
MASTER OF BUSINESS ADMINISTRATION, SCHOOL OF BUSINESS,
UNIVERSITY OF NAIROBI
NOVEMBER, 2015
ii
DECLARATION
I declare that this research project is my original work and has not been presented for a
degree in any other university.
OKELLO JAVAN SOLOMON
D61/60298/2013
SIGNED…………………………………………..DATE……………………………
This Research Project has Been Submitted for Examination with My Approval as The
University Supervisor.
DR. X.N. IRAKI
LECTURER, DEPARTMENT OF MANAGEMENT SCIENCE
SCHOOL OF BUSINESS
UNIVERSITY OF NAIROBI.
SIGNED……………………………………………..DATE……………………………
iii
ACKNOWLEDGEMENT
I wish to sincerely appreciate all who assisted me during my project work. Special thanks
to my Supervisor for his inspiration and guidance during the research. I also wish to
thank the University of Nairobi, Kenyatta University and Kenya Methodist University
students who took their time to respond to my questionnaires. Much gratitude goes to Mr.
Yusuf Ajack of Data Dyne who allowed me to use their mobile application- Magpi to
collect real time electronic data for analysis.
May God Bless you all.
iv
DEDICATION
This project work is dedicated to my benevolent mentor Dr.Yasushi Sawazaki for his
continuous support and faith in my abilities. I further dedicate it to my family and friends
for their prayers and moral support.
v
TABLE OF CONTENTS
DECLARATION............................................................................................................... ii
ACKNOWLEDGEMENT ............................................................................................... iii
DEDICATION.................................................................................................................. iv
LIST OF TABLES ........................................................................................................... ix
LIST OF FIGURES .......................................................................................................... x
ABSTRACT ...................................................................................................................... xi
CHAPTER ONE ............................................................................................................... 1
INTRODUCTION............................................................................................................. 1
1.1 Background of the Study .............................................................................................. 1
1.1.1 Product Switching .......................................................................................... 1
1.1.2 Soap Industry ................................................................................................. 2
1.1.3 The Hotel Industry ..........................................................................................2
1.2 Research Problem ......................................................................................................... 4
1.3 Research Objectives ...................................................................................................... 5
1.4 Value of the Study ........................................................................................................ 5
CHAPTER TWO .............................................................................................................. 7
LITERATURE REVIEW ................................................................................................ 7
2.1 Introduction ................................................................................................................... 7
2.2. Theoretical Foundation of the Study............................................................................ 7
vi
2.2.1 The Markovian Model ................................................................................... 7
2.2.2 Product Switching .......................................................................................... 9
2.2.3: Switching Cost ............................................................................................ 10
2.3. Waste Reduction ........................................................................................................ 10
2.3.1 Waste and the Environment ......................................................................... 11
2.4. Innovations ................................................................................................................. 13
2.4.1 Creative Destruction .................................................................................... 14
2.5 The Hotel Industry ...................................................................................................... 15
2.6 The Soap Industry ....................................................................................................... 16
CHAPTER THREE ........................................................................................................ 18
3.1 Introduction ................................................................................................................. 18
3.2 Research Design.......................................................................................................... 18
3.3 Population of the Study .............................................................................................. 18
3.4 Sample Size ................................................................................................................. 19
3.5. Data Collection Procedures........................................................................................ 19
3.6. Data Analysis ............................................................................................................. 20
vii
CHAPTER FOUR ........................................................................................................... 21
DATA ANALYSIS, RESULTS, AND DISCUSSION .................................................. 21
4.1 Chapter Overview ...................................................................................................... 21
4.2 Descriptive Statistics ................................................................................................... 21
4.2.1 Showering Preferences................................................................................. 21
4.2.2 Preference by Gender ................................................................................... 22
4.2.3 Guest Soap Preference and Use ................................................................... 23
4.3 Willingness to Switch Brands ..................................................................................... 25
4.3.1 Guest Soap Loyalty ...................................................................................... 25
4.3.2 Shower Gel Loyalty ..................................................................................... 26
4.3.3 Product Switching by Gender ...................................................................... 27
4.4 Environmental and Wastage Concerns ....................................................................... 28
4.5 The Markovian Analysis ............................................................................................. 30
4.5.1 Transition States....................................................................................................... 30
4.5.2 Preference Insistence and Switching Rates .............................................................. 31
4.5.4 Computation of Steady State Probabilities of the Showering Agent preferences. (15
STEPS AHEAD FORECAST) ......................................................................................... 32
4.6 Discussion ................................................................................................................... 33
4.7 Comparison with Theory and Other Related Studies ................................................. 34
viii
CHAPTER 5 .................................................................................................................... 37
SUMMARY, CONCLUSION, AND RECOMMENDATIONS.................................. 37
5.1 Introduction ................................................................................................................. 37
5.2 Summary of Findings .................................................................................................. 37
5.3 Conclusion .................................................................................................................. 39
5.4 Recommendations ....................................................................................................... 40
5.5 Limitations of the Study.............................................................................................. 41
5.6 Further Research ......................................................................................................... 42
REFERENCES ................................................................................................................ 43
APPENDICES ................................................................................................................. 46
Appendix 1: Questionnaire ............................................................................................ 46
ix
LIST OF TABLES
Table 4.1: Willingness to switch from Guest Soap to Shower Gel ............................. 25
Table 4.1: Willingness by gender to switch from Guest soap to shower gel .............. 27
Table 4.3: Soap wastage and environmental Concerns ............................................... 29
Table 4.4: Transition States ........................................................................................... 30
Table 4.5: Switching rates .............................................................................................. 31
Table 4.6: Steady states Probabilities............................................................................ 32
Table 4.7: Steady states Probabilities ............................................................................... 32
x
LIST OF FIGURES
Figure 4.1: Showering Agents Preferences ................................................................... 22
Figure 4.2: Showering Agent preferences by gender ................................................... 23
Figure 4.3: Guest Soap Challenges ................................................................................ 24
Figure 4.4: Willingness to Switch from Shower Gel to Guest Soap ........................... 26
Figure 4.5: Willingness by gender to switch from Shower gel to Guest soap............ 28
Figure 4.6: Willingness by gender to switch from Shower gel to Guest soap............ 28
xi
ABSTRACT
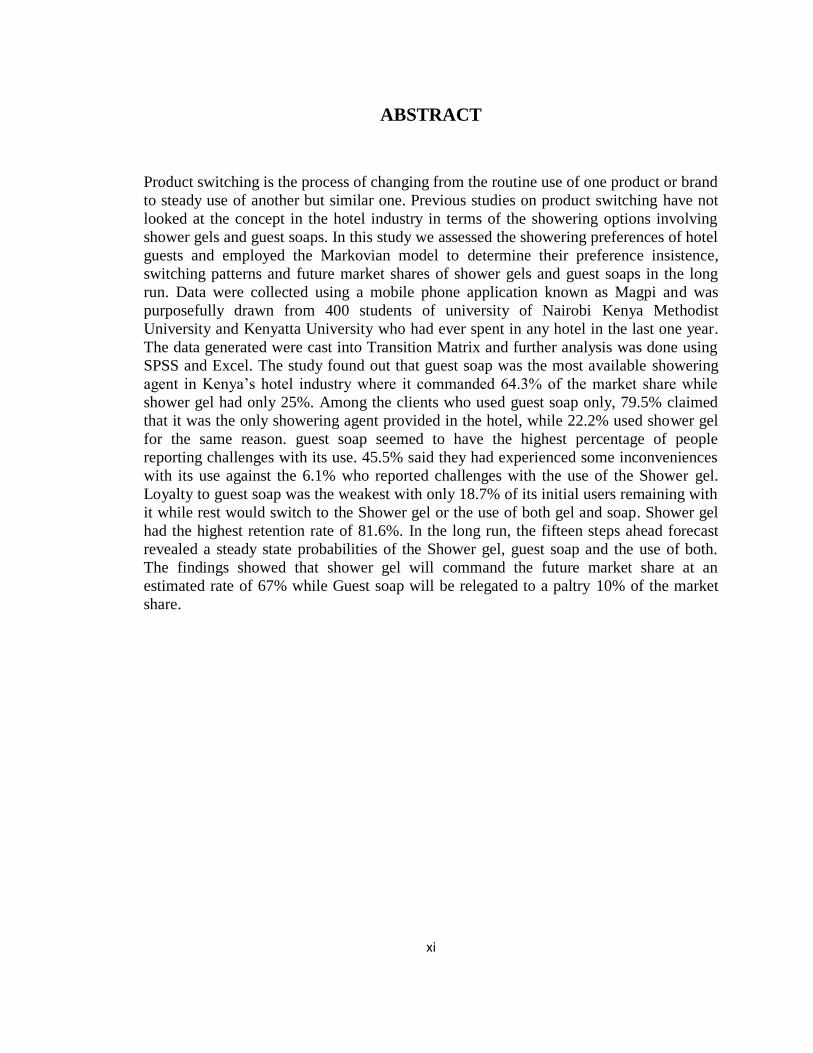
Product switching is the process of changing from the routine use of one product or brand
to steady use of another but similar one. Previous studies on product switching have not
looked at the concept in the hotel industry in terms of the showering options involving
shower gels and guest soaps. In this study we assessed the showering preferences of hotel
guests and employed the Markovian model to determine their preference insistence,
switching patterns and future market shares of shower gels and guest soaps in the long
run. Data were collected using a mobile phone application known as Magpi and was
purposefully drawn from 400 students of university of Nairobi Kenya Methodist
University and Kenyatta University who had ever spent in any hotel in the last one year.
The data generated were cast into Transition Matrix and further analysis was done using
SPSS and Excel. The study found out that guest soap was the most available showering
agent in Kenya‟s hotel industry where it commanded 64.3% of the market share while
shower gel had only 25%. Among the clients who used guest soap only, 79.5% claimed
that it was the only showering agent provided in the hotel, while 22.2% used shower gel
for the same reason. guest soap seemed to have the highest percentage of people
reporting challenges with its use. 45.5% said they had experienced some inconveniences
with its use against the 6.1% who reported challenges with the use of the Shower gel.
Loyalty to guest soap was the weakest with only 18.7% of its initial users remaining with
it while rest would switch to the Shower gel or the use of both gel and soap. Shower gel
had the highest retention rate of 81.6%. In the long run, the fifteen steps ahead forecast
revealed a steady state probabilities of the Shower gel, guest soap and the use of both.
The findings showed that shower gel will command the future market share at an
estimated rate of 67% while Guest soap will be relegated to a paltry 10% of the market
share.
1
CHAPTER ONE
INTRODUCTION
1.1 Background of the Study
The Markovian Model is one of the most efficient techniques used to predict the market
share a particular product would attain in the long term in an oligopolistic market
situation. It can also be used to estimate the brand loyalty of a product and product
switching behaviors. The model is anchored on the precept that the conditional
probability of the following state is independent of the preceding state (Uslu and Cam,
2014). In other words, the current state in a Markov chain only depends on the most
recent previous states. Analysis of the Markovian chain gives insight on how a system
transits from one integer to the next which also reflects how a consumer would switch
from one brand to the next. The model depends on the transition probability which is the
Probability of state changes representing the chances of a customer transiting from
product i to product j in the choice set (Umoh, Awa, & Ebitu, 2013).
1.1.1 Product Switching
Product switching is the process of changing from the routine use of one product or brand
to steady use of a different but similar one (Awogbemi, Oloda, & Osama, 2012). It may
also refer to an individual‟s decision to introduce or discontinue selling or using a
particular product (Timoshenko, 2015). There are barriers that may prevent an
organization or an individual from changing products. These barriers include the cost of
searching out, evaluating, learning about new products and the psychological cost of
changing from one product to another. For product switching to occur, there must be
2
external factors that push the consumers over the switching barriers. Bernard, Jensen,
Redding and Schott, (2010) identified changes in the market environment, customer
demands, government regulations, trade costs, environmental conservation and
competition as the external forces that may necessitate product dropping or picking.
1.1.2 Soap Industry
The global soap industry consists of small number of multinational companies that
include Uniliver, Colgate Palmolive, Procter and Gamble and Johnson & Johnson. On the
regional and continental front we have Beiersdorf as the reigning giants in Europe, Kao
Corporation leading in Asia- pacific, Paterson Zochonois in African and Nirma and
Godrej in South Asia (Euromonitor, 2000). In Kenya some of the leading soap
manufacturing companies include; Diamond chemicals, Uniliver Kenya, Bidco Oil
Refineries, Elephant soap industries, Premier oil mills, Jet Chemicals Ltd, Sudi Chemical
Industries, Super Duper Cosmetics Ltd, Ecolab East Africa and PZ Cussons among others
(Muthui, 2014). Market analysis on the soap industry done in 2010 revealed that soaps
and detergents together consisted of approximately 15% of the consumer expenditure in
European house hold goods (Euromonitor International Database , 2010).
1.1.3 The Hotel Industry
The hotel industry is one of the leading consumers of soap and sanitation products in the
world. However, most hotels and lodgings use guest soaps. These are small soap tablets
provided to guests overnight for the purposes of showering. The clients use the soaps
only once then the rest is disposed of. In the US alone it is estimated that more than 2
million bars of partially used hotel soap are thrown away every day (Clean the World,
3
2015). This manifest wastage has provoked the environmentalists to castigate the industry
for environmental degradation. Others have argued that such insensitive wastage is an
insult to resources noting that in Sub-Saharan Africa thousands of lives could be saved by
recycling these bars of soaps to be used for hand washing to prevent diarrheal diseases
(UNICEF, 2013). In response to these glaring facts, research done by Kasimu, Zaiton,
and Hassan, (2012) showed that some hoteliers resorted to the use of refillable soaps and
shampoo dispensers to reduce the wastages. However, this did not augur well with
sensitive clients who expressed doubts as to the hygiene and quality of the contents of the
dispensers. Others have tried recycling techniques of grinding the left over soap to use as
laundry detergent for staff uniform. Millar and Baloglu, (2011), suggested that hoteliers
need to tout the benefits of using refillable containers and educate their clients on the
disadvantages of throwing away partially used bars of soap.
It is worth noting that the loss due to this wastage is not limited to the hoteliers alone.
The manufacturers and producers of these guest soaps also invest a lot of time, labor,
transport and raw materials in making products that are later not put to meaningful
economic use. The concept of lean thinking that promotes zero tolerance to waste
therefore needs to be employed to reduce the cost of production and create more value for
the customers while using fewer resources.
4
1.2 Research Problem
Guest soap therefore poses a great challenge both to the manufacturers who go at a loss to
make a product that is not put to full economic use and to the hoteliers who have to
increase labor in collecting them every day and dumping the unused bars. They also
cause blockage of sinks and shower drainages in hotels. The guests further go at a loss
because they pay for a product that they do not wholly need. The losses and the
inconveniences of the guest soap therefore require a rethinking of its production and is a
justification enough to sweep it aside with the Schumpeter‟s gale of creative destruction.
It is against this backdrop that we want to test if the hotels clients would be willing to
switch from guest soap and adopt customized shower gels. Shower gel or body wash as
they are popularly known are bottled liquid soaps that are used for washing the body. It
consists of an emulsion of water and detergent base mixed with fragrance.
Product switching involves changing from one product to another. Awogbemi, Oloda, &
Osama, (2012) looked at the relevance of product attributes in relation to switching rates
and considered with three brands of soft drinks. They used Markov chains to establish
the brand loyalty of the consumers of the soft drinks to forecast their future market shares
in the long run. Their findings revealed that of the three drinks considered namely; Fanta,
Mirinda and Mountain-Dew, consumers showed strong brand loyalty towards Fanta.
Umoh, Awa and Ebitu, (2013) examined the application of Markov chain to test brand
switching and brand loyalty of toothpaste users in Port Harcourt, Nigeria. They gathered
data for five brands and found out that the subjects exhibited brand loyalty with Close up
and Darbur being the most preferred. However, similar study has not been done in the
5
Kenyan context and specifically on the soap industry. Uslu and Cam (2014) analyzed the
brand loyalty for consumer sport shoes in Turkey using Markov chains and found out that
students were more loyal to Adidas and Nike. In 2008, Penfold, Guillet, and Zhen, did an
exploratory study on the hotel co-branding and they discovered that coffee, TV,
toothpaste and shower gel were most preferred features to be branded in a 4 star hotel.
However, the study did not look at the switching components of these preferred features
and especially the shower gel.
All these researches made meaningful contributions. Nevertheless, there is still need to
focus specifically to the hotel industry and look at the willingness of the players in the
industry to switch from the use of guest soap to shower gel.
1.3 Research Objectives
The main objectives of the study are:
1. To assess the preferences in showering agents as used by the hotel guests and
their willingness to switch brands between guest soaps and shower gels.
2. To employ Markov chains to determine the steady-state probabilities for the guest
soap and shower gel.
1.4 Value of the Study
The findings of this study will give manufacturers of guest soap a better understanding on
the hotel guest‟s preference on showering options. They will know whether to continue
producing the guest soaps with all its challenges or to shift gears and invest more on
research and development to come up with more convenient, sustainable, and
environmental friendly alternatives.
6
The identification of the steady state probabilities for the bar soap and shower gel will
help forecast the future market shares and demands for the soaps and Gels hence help
players in the industry to plan for their productions.
7
CHAPTER TWO
LITERATURE REVIEW
2.1 Introduction
In this section we shall review the documented scholarly works that are relevant to the
soap industry, innovation, and product switching in the hotel industry. The literature
includes related studies conducted in various context and their findings, and arguments
advanced by other scholars on the issue under study in this research.
2.2. Theoretical Foundation of the Study
Among the common operations management theories noted and applicable to this study
are lean thinking, Schumpeter‟s gale of creative destruction, green innovation and
Markovian models. The research also borrows theories from other fields such as
marketing and Psychology and looks at the reasons for brand loyalty and switching.
2.2.1 The Markovian Model
Markov chain is a mathematical model for stochastic systems whose states, discrete or
continuous, are governed by a transition probability. The current state in a Markov chain
only depends on the most recent previous states. Analysis of the Markovian chain gives
insight on how a system transits from one integer to the next which also reflects how a
consumer would switch from one brand to the next. The probability of moving from state
i in nth time step would be given as (n):
Pij = P {Xn =j/X0 = i} and for single-step transition Pij = Pr {X1 = j/X0 = i}
8
The Transition probability (Pij) is defined as the probability of state changes representing
the chances of a customer transiting from brand i to brand j in the choice set (Umoh,
Awa, & Ebitu, 2013).
Markov chain is concerned with sequences of random variables, which correspond to the
states of a certain system, in such a way that the state at one time period depends only on
the one in the previous time periods (Ng & Ching, 2006). In our case we assume that in a
particular hotel there are only three options for showering. A guest may use shower gel
only, a bar of guest soap only or both. We further assume that a consumer of the bar of
guest soap only may switch to use shower gel only or both in his/her next shower with a
probability of α(> 0), while a consumer of customized shower gel only may switch to the
bar soap only or both in his/her next usage with a probability of β(> 0). A user of both
shower gel and soap may switch to using shower gel only or guest soap only in his/her
next shower with a probability of µ(>0). It will therefore behoove us to find the
probability that a user of bar soap will still remain a user of the same soap in the nth
showering and also the possible future market shares of the two showering products in
the long run. The solutions to the above hypothetical problems will be anchored on the
assumption that the future behavior of the consumer depends on his/her current situation.
We shall describe the consumer behavior by using Markov chain. Let‟s take Let X (n) be
a 2-state process (taking values of {0, 1}) of using either bar soap or shower gel: we shall
have X (n) = 0 if the consumer uses bar soap on the nth time and X (n) = 1 if the
consumer uses shower gel on the nth time. Since the future state (the showering item to
use) depends on the current state only. We can then formulate the transition matrix
9
probabilities as:
P 00 = 1 − α, P 10 = α, P 11 = 1 − β and P 01 = β.
Then the one step transition matrix would be:
From the transition matrix obtained above, it will be possible to determine both the
market environment in the future and the intensive transitional probabilities between
shower gel and bar soap (Umoh, Awa, & Ebitu, 2013).
2.2.2 Product Switching
Product switching is the process of changing from the routine use of one product or brand
to steady use of a different but similar product (Awogbemi, Oloda, & Osama, 2012).
Customer switching or defection in service environment means that that a customer
forsakes one service provider for another (Garland, 2002). This can be partial or total
defection. In total defection the customer severs all transactions with the product or firm
while in the partial case the client starts making purchases with the other competitors but
still maintains some transactions with the pioneering firm. Firms need to be aware and
guard their customers from straying to competitors brands because it costs 5 to 7 times
more to generate a new customer than to retain the current one (Boone & Kurtz, 2007).
On the other hand, Venkatesan, (1973) opined that customers love familiar stimuli hence
new products may be treated with suspicion of unfamiliarity. However with the
acquisition of knowledge, the unfamiliar becomes familiar and new products gain
acceptance. Schiffman and Kanuk, (2009) observed that consumers make either trial or
repeat purchase. The trial behavior allows firsthand experience of new brands which then
10
leads to repeat purchase if the product is perceived to be more satisfactory than the
previously familiar one. Therefore if a consumer's propensity to switch is known, then the
parameters can be modeled to forecast future market share and the relative positioning of
the competing brands (Rajkumar & Chaarlas, 2012).
2.2.3: Switching Cost
According to Bell, Auh and Smalley, (2005) Switching costs are the onetime costs that
consumers incur when they switch from one product to another. These costs include; the
cost of searching out, evaluating, learning about new products and the psychological
costs involved in changing from one product or supplier to another (Burnham, Frels, &
Mahajan, 2003). These costs act as barriers that prevent clients from switching. It gives
the pioneering products a competitive advantage over follower products (Bowman &
Gatignon, 1996).
2.3. Waste Reduction
Roos, Womack and Jones, (1990) coined the term 'lean production' to refer to a
manufacturing paradigm that emphasizes on continuous minimization of waste. It is also
known as 'lean manufacturing' or just lean. However, the concept originated from Ohno
and Shingo of Toyota hence giving it the name Toyota Production Systems. Lean
Thinking can also be viewed as a set of principles, philosophies and business processes
that enable the elimination of waste and add value to customers (Vlachos & Bogdanovic,
2013). The main objective of lean manufacturing is to reduce waste as far as human
efforts, inventory, time to market and manufacturing space is concerned. Waste may take
many forms and may be found hidden in policies, procedures, processes, product designs
11
and in operations (Seth & Gupta, 2005). Waste utilizes resources without adding value to
the product. Russell and Taylor, (1999) described waste as anything other than the
minimum amount of equipment, effort, material, parts space and time that are essential to
add value to the product. The overriding principle of lean thinking therefore is to reduce
cost through continuous improvement hence increase the firm‟s profit (Roos, Womack, &
Jones, 1990). In the hotel industry, the concept of waste reduction is not new and it is
logical to assume that lean practices can improve customer satisfaction by reducing waste
and defects from products and services offered to customers (Levy, 1997).
2.3.1 Waste and the Environment
Environmental management is the systematic approach to finding practical ways of
saving water, energy and materials and reducing negative environmental impacts. The
impacts could be cultural, ecological and or social. It also encompasses sustainability,
resource management and pollution control issues (Kirk, 1995). The concept of
environmental management is very relevant in the hotel industry. Hotels and resorts use
large amount of environmental resources such as water and energy and generate lots of
waste such as waste water and solid wastes. Research done by Muthini, Tole and Otieno,
(2003) on the solid waste pollution loads in beach hotels on the Kenyan south coast‟s
revealed that the mean per-capita waste generation rate was 1.9 kg per person per day.
Such high amount of solid waste generation has prompted researches such as Rugman
and Verbeke, (1998) to enjoin firms to undertake environmental management to avoid
colliding with forces such as stakeholder environmentalism, competitive pressures and
environmental regulations.
12
On the other hand, environmental management has had neoclassical economic opponents
whose Agency theory postulates that firms exist to mainly maximize shareholders wealth
therefore engaging in environmental management would be tantamount to misuse of
corporate resources (Friedman, 1970). However in a counter argument, Institutional
theorists maintain that external institutions exert influence on individual firms and that
the firms social objective is not always profit maximization and hence they should
engage in environmental management to meet external pressures for legitimacy and to
obtain trust of the external institutions (Hoffman,1997). Stewardship theory further lends
a voice of support for environmental management by asserting that there is a moral
responsibility for managers to do the right thing without regard to how such actions
influence corporate performance (Donaldson and Preston, 1995).
Peattie and Ratnayaka (1992) observed that environmental management allows firms to
reshape competitive rules to obtain first mover advantages. Barret, (1991) concurs by
stating that adopting environmental management forces firms to apply strict green
standards into their green products that can create differentiation strategies. Anderson and
Bateman, (2000) coined the term “environmental Champions “or “eco-champions to refer
to individuals who convince and enable organizations to turn environmental issues into
successful corporate programs and innovations. Willard, (2009) Views eco-champions as
“sustainability entrepreneurs”, hence environmental management can be seen as a source
and a drive for innovations.
13
2.4. Innovations
Innovation is the application of new and creative ideas and the implementation of
inventions (Decelle, 2004). It involves thinking creatively to generate solutions that add
value in terms of economic and social impacts. It is also critical in creating competitive
advantage and improving governance. It can redefine products, processes, and services
that involve individuals, organizations and institutions (Schilirò, 2015). Joseph
Schumpeter (1934), observed that the entrepreneur„s capacity to innovate is the
fundamental impulse that sets and keeps the capitalistic engine in motion. He stresses the
importance of radical innovations that transform existing markets and create new ones.
Moreover, intangible skills such as entrepreneurial ability, communication skills,
adaptability, and tacit knowledge contribute meaningfully to innovations and especially
in services industry.
Chen, Lai and Wen (2006) describes green innovations as the implementation of new
ideas that relate to green products or processes, including the innovations in technologies
that are involved in energy-saving, pollution-prevention, waste recycling, green product
designs or corporate environmental management. They further observe that green
innovations have become one of the most strategic tools to obtain sustainable
development in manufacturing industry because of the popular environmental trends.
Green innovations can be used to enhance product value and hence offset the costs of
environmental investments. It can also improve corporate image and make companies
more successful (Porter & Van der Linde, 1995). It can therefore be argued that
developing green innovations is a mutually beneficial solution for firms that face the
conflict between economic survival and environmental protection. Gladwin, Kennelly
14
and Krause, (1995) concurs that firms that adopt green innovations normally lead new
business models and change competitive rules to generate business opportunities. The
same view is corroborated by Hartman and Stafford, (1997) who stated that, “being green
is not a cost of doing business, but a catalyst for innovation, new market opportunities
and wealth creation”.
2.4.1 Creative Destruction
The neologism “creative destruction” was first used by Joseph Schumpeter to describe an
economy wide process which “incessantly revolutionizes the economic structure from
within, incessantly destroying the old one, incessantly creating a new one” (Schumpeter,
1950). The phenomenon occurs when something new kills or replaces something older.
For example the computers with printers replaced the type writers that were previously
omnipresent in offices. Sometimes the changes are so inevitable that the process is
metaphorically referred to as “Schumpeter‟s gale of creative destruction”. In modern
times, entrepreneurship has been singled out as one of the means to successfully navigate
the dynamic process of creative destruction. Entrepreneurial responses can be described
as: the creation and implementation of new services, the accelerated development of or
implementation of an existing idea, or the expansion of an existing service to enter a new
market (Gliedt & Parker, 2007).
15
2.5 The Hotel Industry
A hotel is a commercial establishment that provides paid lodging, meals and other guest
services on a short term or temporary basis. For an establishment to qualify as a hotel, it
must have a minimum of six letting bedrooms three of which must have a private
bathroom facility. Hotels can be classified into five divisions denoted by stars to include
1-star, 2-star, 3-star, 4-star, and 5-star (Business Dictionary, 2015).
Hotels and restaurants are major consumers of water, chemicals, energy, supplies and
disposable items. As a result it generates a significant amount of solid waste, waste water
and other environmental pollutants (Hall & Lew, 2009). Due to these concerns, the
tourism industry and the hotel sector is under mounting pressure to adopt more
environmentally friendly practices. Graci & Dodds, (2009) observed that; increasing
environmental regulations, managers ethical concerns, customer demands and the need
for better aesthetics are the reasons behind the pressures. Additional sources of pressure
was identified by Lee, Hsu, Han and Kim ,(2010) who singled out a new breed of
environmentally conscious investors and an emerging trend of green consumerism as
other influencing factors. In 2008, Deloitte report indicated that large number of business
travelers had real concerns about the environment hence raising the bar on their
expectation from the hotels in terms of environmental stewardship. The study further
revealed that 40% of the respondents were willing to pay more to stay at a green hotel.
Waste management is one of the recognized methods of environmental stewardship. It is
estimated that every international tourists in Europe generates 1 kg/per person/per day of
solid waste. In USA the number is double at 2kg/per person/per day (UNEP, 2003) while
in Kenya the waste generation per person per day in hotels stands at 1.9kg (Muthini, Tole
16
& Otieno, 2003). However, approximately 30% of these wastes generated can be
recycled or reused (Bohdanowicz, 2005). It is worth noting that poor waste disposal can
lead to water and soil pollution through leaching of contaminants.
2.6 The Soap Industry
The global soap industry consists of small number of multinational companies that are
popularly known for their strong brands. The leading global players include Uniliver,
Colgate Palmolive, Procter and Gamble and Johnson & Johnson. On the regional and
continental front we have Beiersdorf as the reigning giants in Europe, Kao Corporation
leading in Asia- pacific, Paterson Zochonois in African and Nirma and Godrej in South
Asia (Euromonitor, 2000). Market analysis on the soap industry done in 2010 revealed
that soaps and detergents together consisted of approximately 15% of the consumer
expenditure in European house hold goods (Euromonitor International Database, 2010).
Bar and liquid soaps accounted for 40% of the market of personal wash sector and 10%
of the global total personal care market. As at the year 2000, the world market for soaps
and detergent was worth $88 billion USD. Over the years, the global consumption of
soap has grown by 29%. The mature markets of North America grew by 14 % while the
regions of Middle East and Africa expanded their growth by 72% and 65% respectively
(Datamonitor, 2000). In Africa Unilever is the leading dealer in the English speaking
countries while PZ Cussons is leading in the French speaking nations. In West Africa, the
market penetration is estimated at 98% with the local manufacturers making 10-15% of
the soap used (London School of Tropical Medicine and Hygiene, 2000). In Kenya some
of the leading soap manufacturing companies include; Diamond chemicals, Uniliver
Kenya, Bidco Oil Refineries, Elephant soap industries, Premier oil mills, Jet Chemicals
17
Ltd, Sudi Chemical Industries, Super Duper Cosmetics Ltd, Ecolab East Africa and PZ
cussons among others (Muthui, 2014).
The market in the soap industry can be described as growing with cut throat competition
among the leading brands. Market expansion has been achieved through new product
development such as hand washing liquid soaps and shower gels. Moreover, growing
concerns about the environment has also led to the development eco-friendly products
that are biodegradable or contained in re-usable or refillable packets. In the recent years,
the trend to use more natural ingredients has gained momentum leading to new product
innovation such as liquid soaps, soap free synthetic detergents and no- wash soaps. These
new entrants have swayed the market in their favor from the traditional bar soaps giving
them an ever increasing share of the toilet soap market (London School of Hygiene and
Tropical Medicine, 2000).
In Europe, shower products commands the lion share of sales at 69.8%. in France,
Shower products consists of 96.5% of sales giving their clear preference for showering
over bathing. However, in UK and Russia, consumers prefer bathing to showering.
Shower gel sales account for 40.3% and 40.7% of their markets respectively (Data
Monitor 2012). In Spain However, shower products are most popular with 92% of the
population preferring them. In general, Shower gel commands 67% of shower product
usage in Europe (Kantar WorldPanel, 2013). This market is driven mostly by female
users. Although more and more men are now using the gels, it is estimated that 80% of
their products are bought by their wives. There is fear that the purchase of cosmetic
products like showers gel calls into question their manliness and associates them to
female tendencies and gays lifestyle (Data panel Europe, 2002).
18
CHAPTER THREE
RESEARCH METHODOLOGY
3.1 Introduction
In this section we shall discus the methodology that was used to gather, analyze data, and
report the results. The chapter explains the research design that was adopted for this
study, the population for this study and the methods and tools that were used to collect
and analyze the data.
3.2 Research Design
Descriptive research design was employed to study the behaviors and preferences of hotel
clients. A survey questionnaire was administered to clients who had ever spent in a hotel
in the last one year. Descriptive design was deemed appropriate as it gave a lot of
information and insights as to the clients showering agent preferences. The data collected
was then cast into Markov brand switching model to test product switching behavior
between bar soaps and shower gels.
3.3 Population of the Study
Data was collected from university students who had ever spent in any hotel in the last
one year and could remember the showering agent they used in their last stay. We opted
for university students instead of current hotel guests because it would be hard to obtain
permission from hoteliers to interview their clients. Three universities were sampled for
their convenience; University of Nairobi, Kenyatta University and Kenya Methodist
University. This is because students from these universities both undergraduates and post
graduates come from all over the country and have spent in hotels with different star
19
ratings in different parts of the country hence they offered information that reflects the
hotel industry in Kenya.
3.4 Sample Size
According to Mugenda and Mugenda (2003) the general formula deriving sample size
for a survey is:
Necessary Sample Size = (Z-score) X Standard of Deviation (1-StdDev) / (margin of
error).
At 95% confidence level, 5 standard deviation, and a margin of error (confidence
interval) of +/- 5%. The desired sample size would be;
((1.96)² x .5(.5)) / (.05)
(3.8416 x .25) / .0025
.9604 / .0025
384.16.
Based on this the researcher settled on a sample size of 400 which is above the required
minimum size to cater for non responses.
3.5. Data Collection Procedures
The study relied on primary data that was collected using questionnaire. The
questionnaire was made up of two sections. The first section dealt with demographic
matters while the second part sought to find what the client used, their preference and
willingness to switch brands. The second section formed the basis of the Markovian
matrix. Data was collected electronically using mobile phone technology application
known as Magpi. Data already entered was then exported to SPSS for further analysis. A
20
pilot study was done to pretest the questionnaire on a purposeful sample of 30
respondents to refine the questionnaire, correct inconsistencies and clear any ambiguities
before the actual survey.
3.6. Data Analysis
Since there were 3 states in the study, the state space took the following form,
S= {Shower Gel only, Guest soap only, Both Shower gel and Soap}
The states were mutually exclusive and wholly exhaustive in that a hotel guest could:
i. Use only shower gel.
ii. Use only the Guest soap.
iii. Use both shower gel and Guest soap.
The data collected about the relationship between the hotel guest‟s current choice of
showering agent and the next choice of preference was transformed into Markov
Transition Matrix probabilities to measure product switching tendencies. Further analysis
was done using descriptive statistics to get meaningful snapshots of the distribution of
measurements. The findings are presented in tables and charts for additional analysis and
comparison.
21
CHAPTER FOUR
DATA ANALYSIS, RESULTS, AND
DISCUSSION
4.1 Chapter Overview
This section considers the objectives of the research question which were to assess the
showering agent preferences and the willingness of respondents to switch brands between
shower gel and guest soap and to employ Markov chains to determine the steady-state
probabilities for the guest soap and shower gel.
To meet these objectives, data was collected from the University of Nairobi, Kenyatta
University and Kenya Methodist University students who had ever spent in any hotel in
the last one year. A total of 400 students were interviewed. This section uses descriptive
statistics to outline the findings.
4.2 Descriptive Statistics
This section addresses objective one of the research question which was to assess the
showering agent preferences and the willingness of respondents to switch brands.
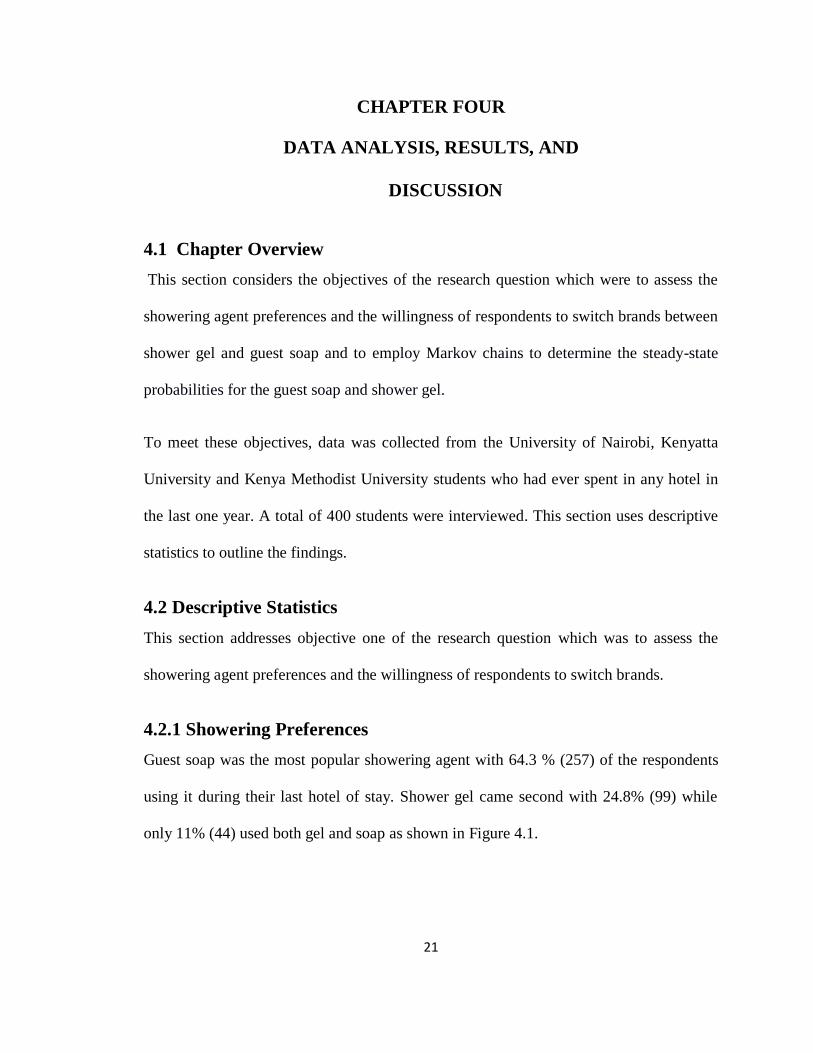
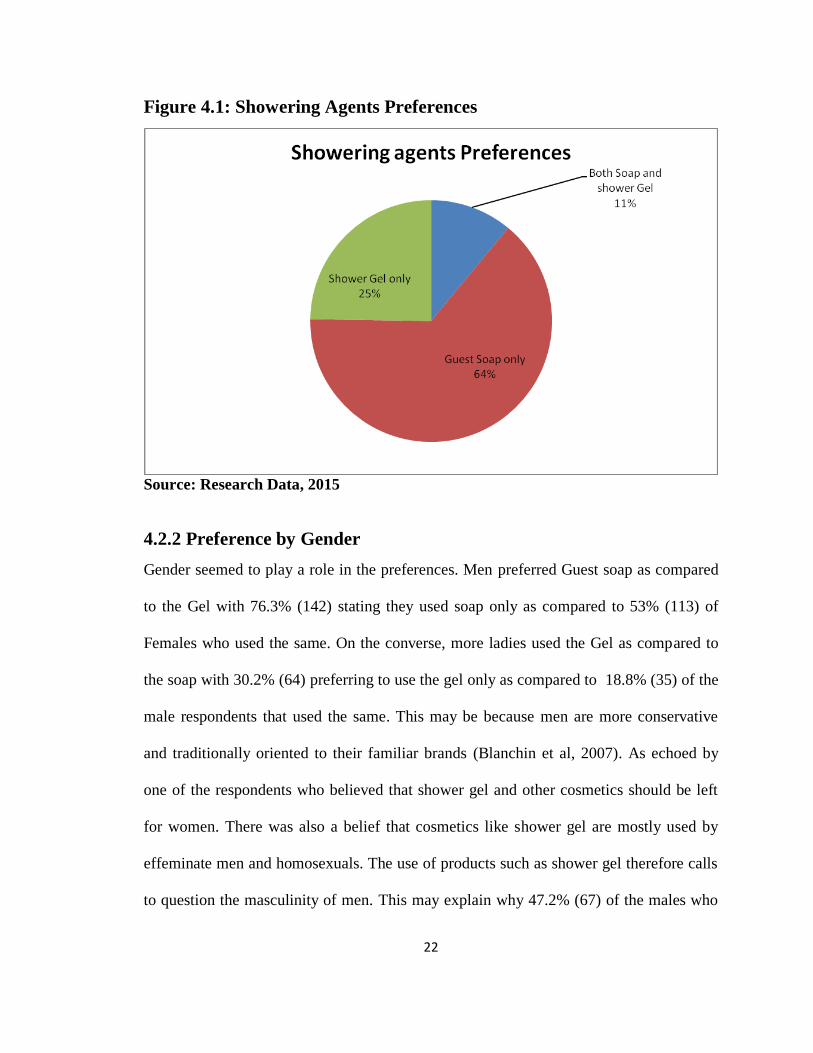
4.2.1 Showering Preferences
Guest soap was the most popular showering agent with 64.3 % (257) of the respondents
using it during their last hotel of stay. Shower gel came second with 24.8% (99) while
only 11% (44) used both gel and soap as shown in Figure 4.1.
22
Figure 4.1: Showering Agents Preferences
Source: Research Data, 2015
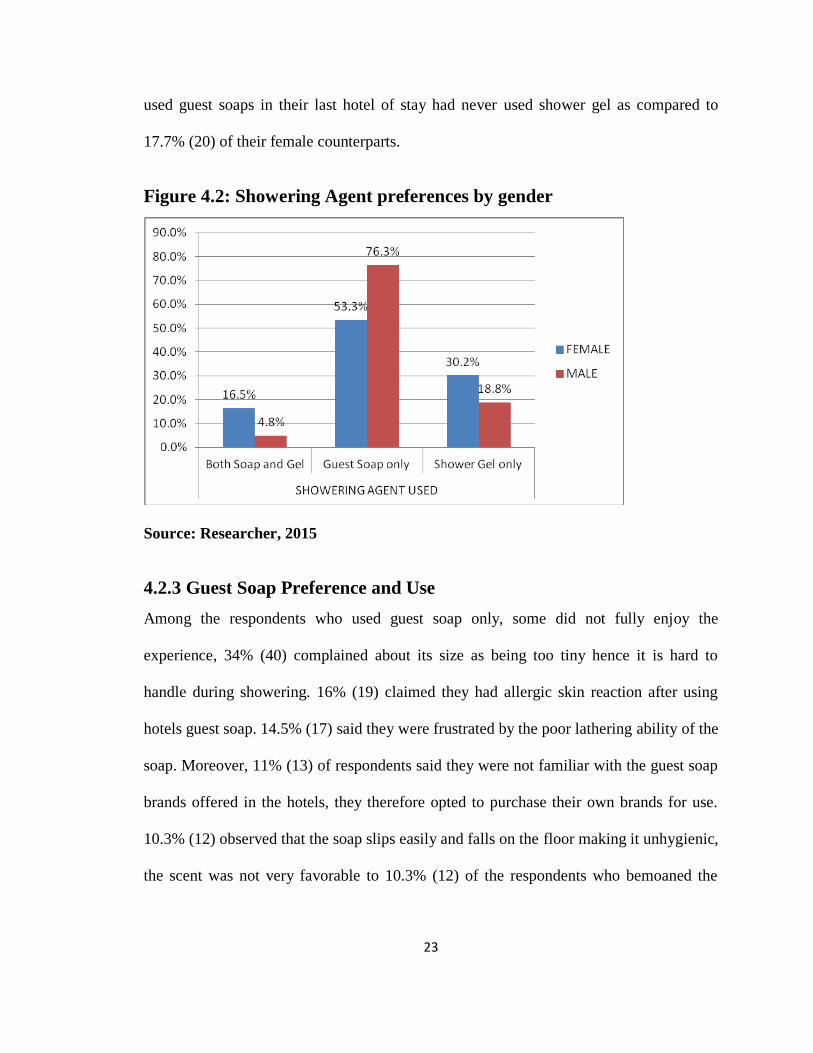
4.2.2 Preference by Gender
Gender seemed to play a role in the preferences. Men preferred Guest soap as compared
to the Gel with 76.3% (142) stating they used soap only as compared to 53% (113) of
Females who used the same. On the converse, more ladies used the Gel as compared to
the soap with 30.2% (64) preferring to use the gel only as compared to 18.8% (35) of the
male respondents that used the same. This may be because men are more conservative
and traditionally oriented to their familiar brands (Blanchin et al, 2007). As echoed by
one of the respondents who believed that shower gel and other cosmetics should be left
for women. There was also a belief that cosmetics like shower gel are mostly used by
effeminate men and homosexuals. The use of products such as shower gel therefore calls
to question the masculinity of men. This may explain why 47.2% (67) of the males who
23
used guest soaps in their last hotel of stay had never used shower gel as compared to
17.7% (20) of their female counterparts.
Figure 4.2: Showering Agent preferences by gender
Source: Researcher, 2015
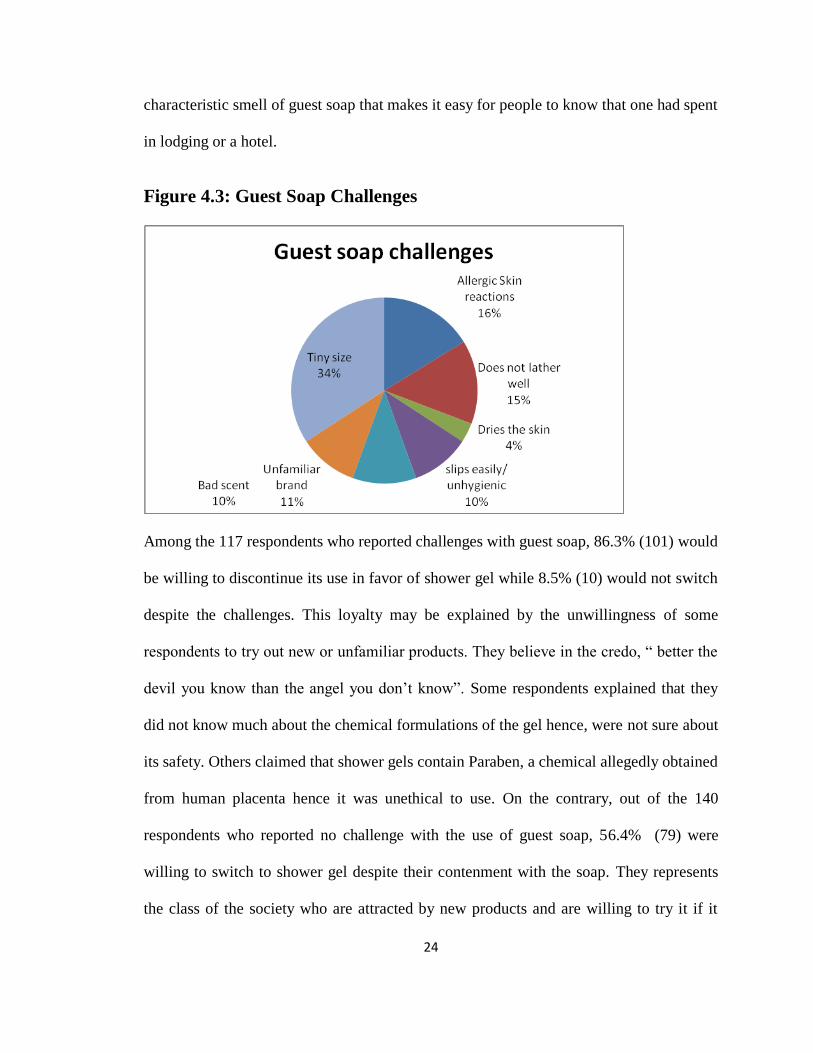
4.2.3 Guest Soap Preference and Use
Among the respondents who used guest soap only, some did not fully enjoy the
experience, 34% (40) complained about its size as being too tiny hence it is hard to
handle during showering. 16% (19) claimed they had allergic skin reaction after using
hotels guest soap. 14.5% (17) said they were frustrated by the poor lathering ability of the
soap. Moreover, 11% (13) of respondents said they were not familiar with the guest soap
brands offered in the hotels, they therefore opted to purchase their own brands for use.
10.3% (12) observed that the soap slips easily and falls on the floor making it unhygienic,
the scent was not very favorable to 10.3% (12) of the respondents who bemoaned the
24
characteristic smell of guest soap that makes it easy for people to know that one had spent
in lodging or a hotel.
Figure 4.3: Guest Soap Challenges
Among the 117 respondents who reported challenges with guest soap, 86.3% (101) would
be willing to discontinue its use in favor of shower gel while 8.5% (10) would not switch
despite the challenges. This loyalty may be explained by the unwillingness of some
respondents to try out new or unfamiliar products. They believe in the credo, “ better the
devil you know than the angel you don‟t know”. Some respondents explained that they
did not know much about the chemical formulations of the gel hence, were not sure about
its safety. Others claimed that shower gels contain Paraben, a chemical allegedly obtained
from human placenta hence it was unethical to use. On the contrary, out of the 140
respondents who reported no challenge with the use of guest soap, 56.4% (79) were
willing to switch to shower gel despite their contenment with the soap. They represents
the class of the society who are attracted by new products and are willing to try it if it
25
holds a promise of a more superior or enjoyable experience. The perception that shower
gel held such a promise was reinforced by the guest soap users who had had previous
experience with the gel.
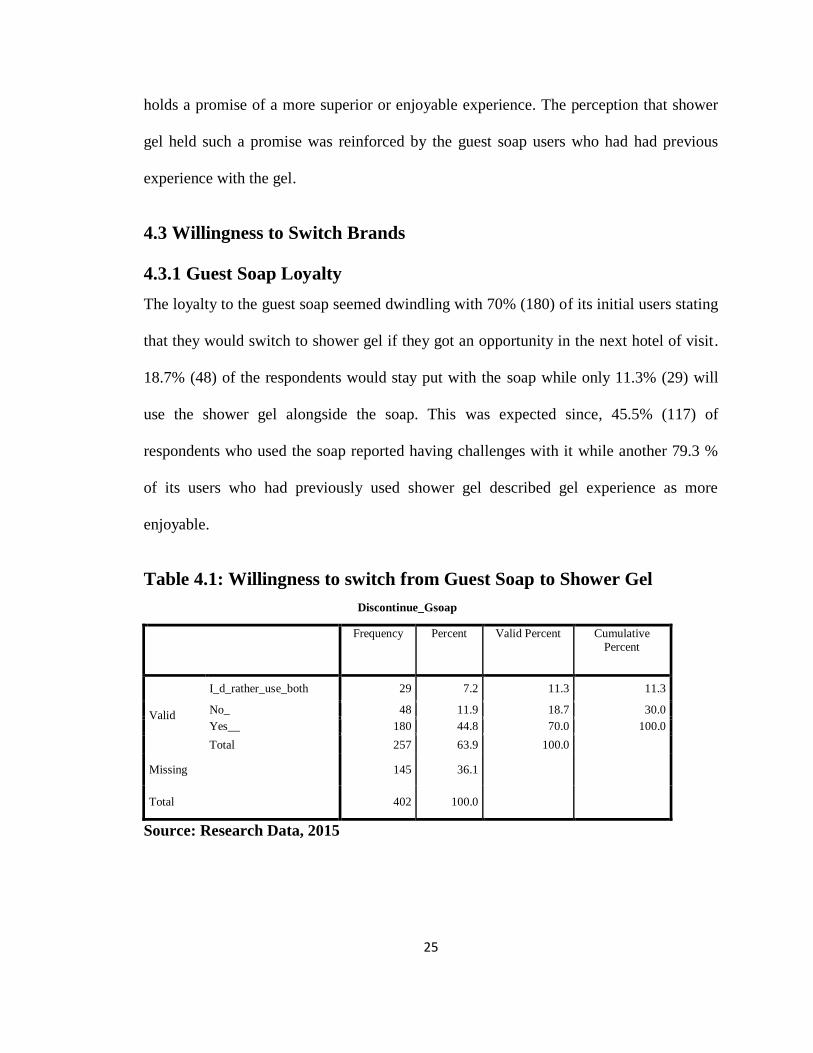
4.3 Willingness to Switch Brands
4.3.1 Guest Soap Loyalty
The loyalty to the guest soap seemed dwindling with 70% (180) of its initial users stating
that they would switch to shower gel if they got an opportunity in the next hotel of visit.
18.7% (48) of the respondents would stay put with the soap while only 11.3% (29) will
use the shower gel alongside the soap. This was expected since, 45.5% (117) of
respondents who used the soap reported having challenges with it while another 79.3 %
of its users who had previously used shower gel described gel experience as more
enjoyable.
Table 4.1: Willingness to switch from Guest Soap to Shower Gel
Discontinue_Gsoap
Frequency Percent Valid Percent Cumulative Percent
Valid
I_d_rather_use_both 29 7.2 11.3 11.3
No_ 48 11.9 18.7 30.0
Yes__ 180 44.8 70.0 100.0
Total 257 63.9 100.0
Missing 145 36.1
Total 402 100.0
Source: Research Data, 2015
26
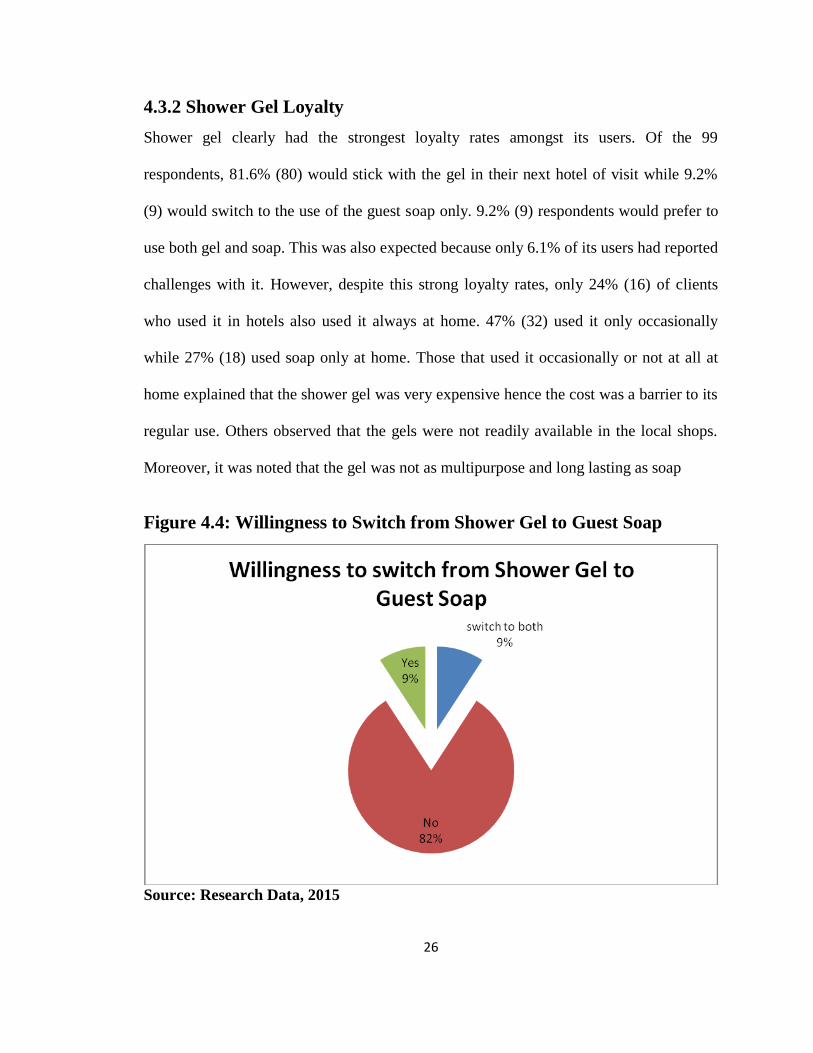
4.3.2 Shower Gel Loyalty
Shower gel clearly had the strongest loyalty rates amongst its users. Of the 99
respondents, 81.6% (80) would stick with the gel in their next hotel of visit while 9.2%
(9) would switch to the use of the guest soap only. 9.2% (9) respondents would prefer to
use both gel and soap. This was also expected because only 6.1% of its users had reported
challenges with it. However, despite this strong loyalty rates, only 24% (16) of clients
who used it in hotels also used it always at home. 47% (32) used it only occasionally
while 27% (18) used soap only at home. Those that used it occasionally or not at all at
home explained that the shower gel was very expensive hence the cost was a barrier to its
regular use. Others observed that the gels were not readily available in the local shops.
Moreover, it was noted that the gel was not as multipurpose and long lasting as soap
Figure 4.4: Willingness to Switch from Shower Gel to Guest Soap
Source: Research Data, 2015
27
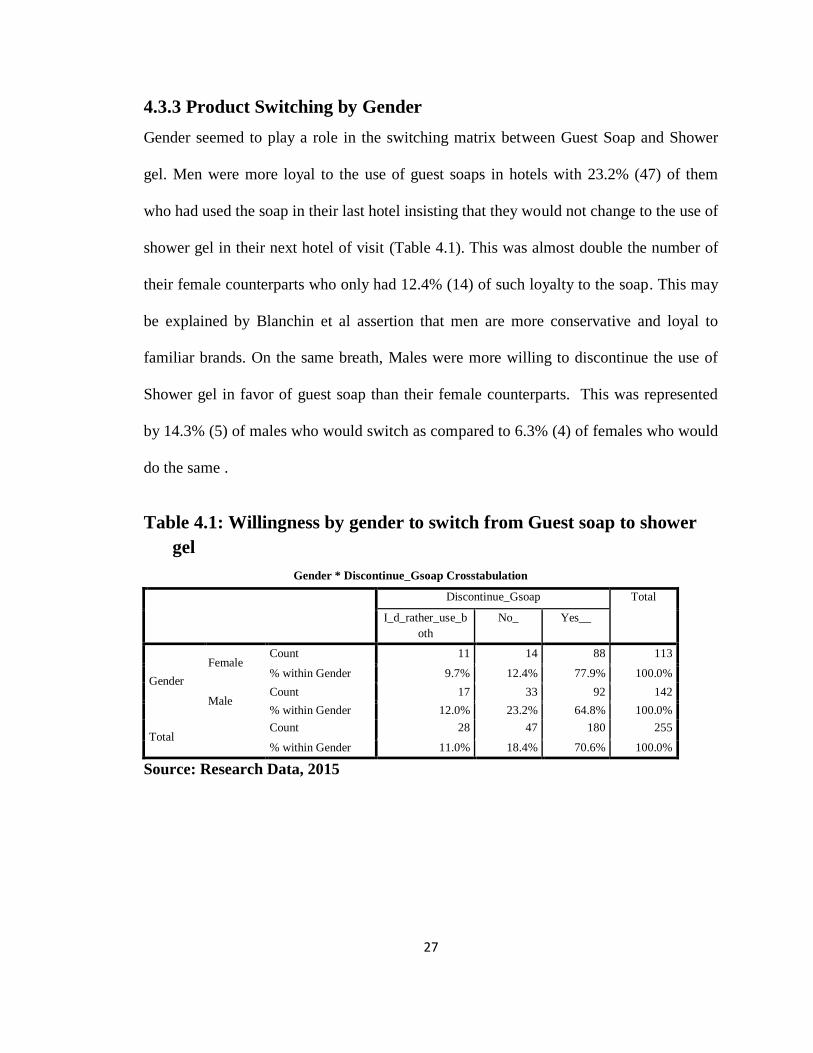
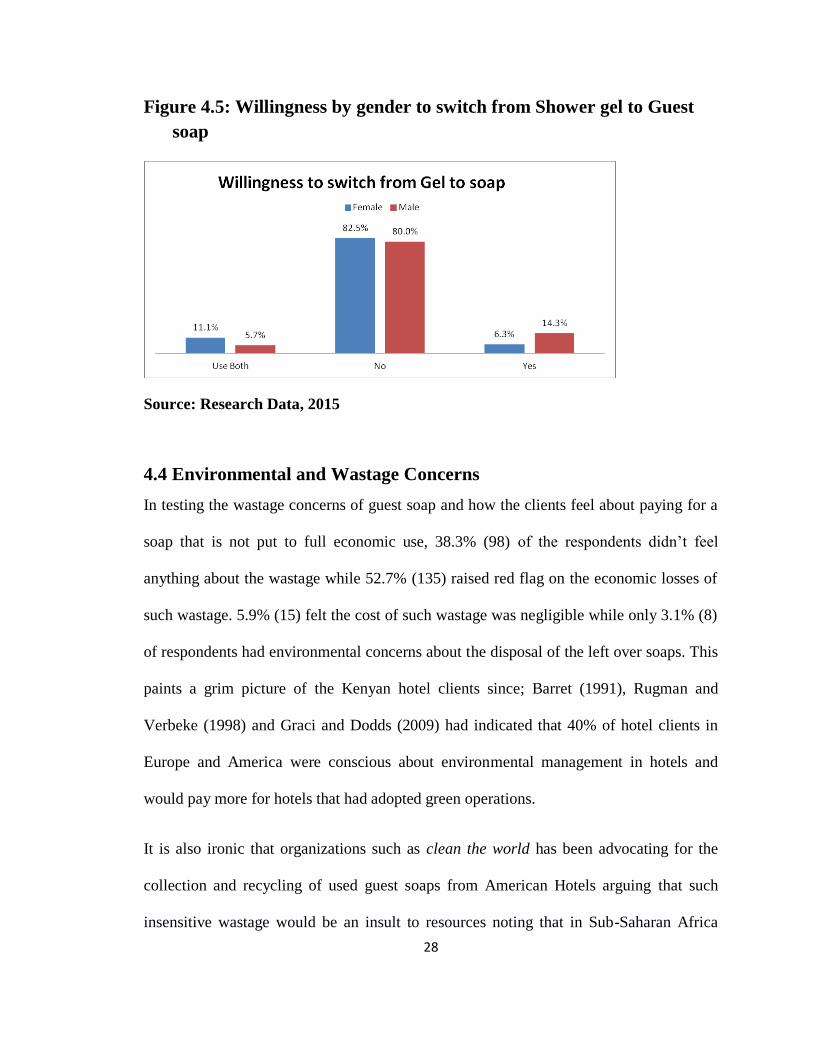
4.3.3 Product Switching by Gender
Gender seemed to play a role in the switching matrix between Guest Soap and Shower
gel. Men were more loyal to the use of guest soaps in hotels with 23.2% (47) of them
who had used the soap in their last hotel insisting that they would not change to the use of
shower gel in their next hotel of visit (Table 4.1). This was almost double the number of
their female counterparts who only had 12.4% (14) of such loyalty to the soap. This may
be explained by Blanchin et al assertion that men are more conservative and loyal to
familiar brands. On the same breath, Males were more willing to discontinue the use of
Shower gel in favor of guest soap than their female counterparts. This was represented
by 14.3% (5) of males who would switch as compared to 6.3% (4) of females who would
do the same .
Table 4.1: Willingness by gender to switch from Guest soap to shower
gel
Gender * Discontinue_Gsoap Crosstabulation
Discontinue_Gsoap Total
I_d_rather_use_b
oth
No_ Yes__
Gender
Female Count 11 14 88 113
% within Gender 9.7% 12.4% 77.9% 100.0%
Male Count 17 33 92 142
% within Gender 12.0% 23.2% 64.8% 100.0%
Total Count 28 47 180 255
% within Gender 11.0% 18.4% 70.6% 100.0%
Source: Research Data, 2015
28
Figure 4.5: Willingness by gender to switch from Shower gel to Guest
soap
Source: Research Data, 2015
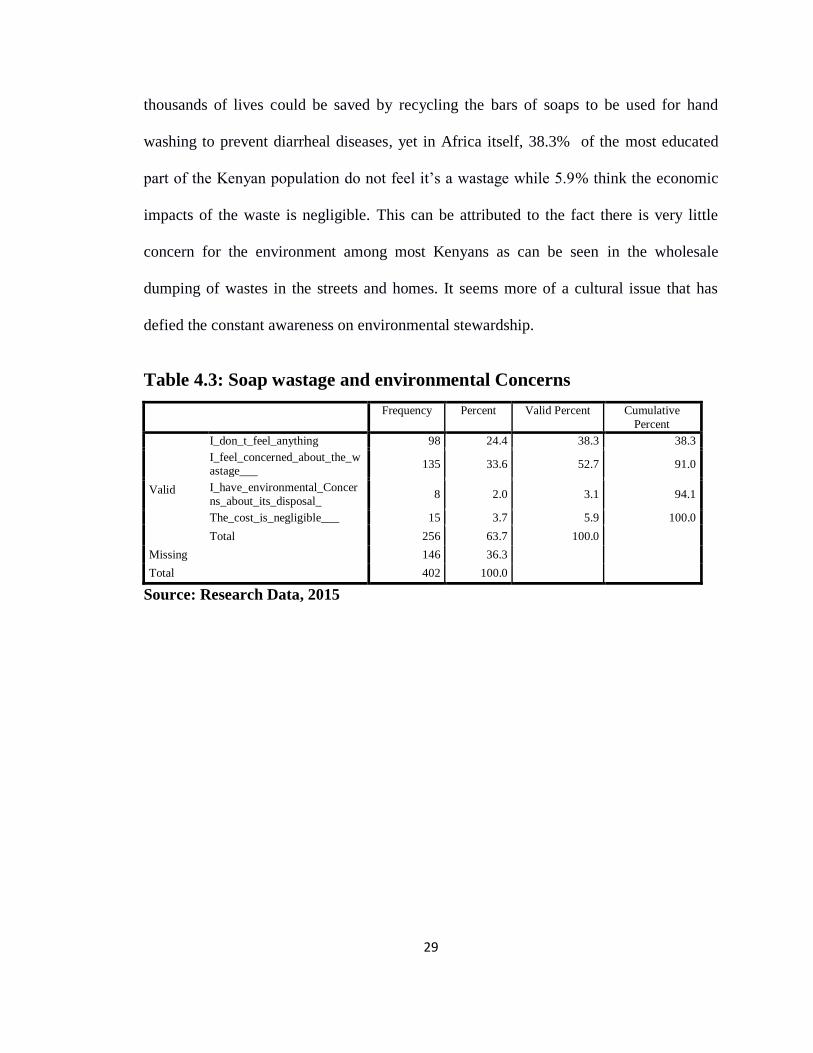
4.4 Environmental and Wastage Concerns
In testing the wastage concerns of guest soap and how the clients feel about paying for a
soap that is not put to full economic use, 38.3% (98) of the respondents didn‟t feel
anything about the wastage while 52.7% (135) raised red flag on the economic losses of
such wastage. 5.9% (15) felt the cost of such wastage was negligible while only 3.1% (8)
of respondents had environmental concerns about the disposal of the left over soaps. This
paints a grim picture of the Kenyan hotel clients since; Barret (1991), Rugman and
Verbeke (1998) and Graci and Dodds (2009) had indicated that 40% of hotel clients in
Europe and America were conscious about environmental management in hotels and
would pay more for hotels that had adopted green operations.
It is also ironic that organizations such as clean the world has been advocating for the
collection and recycling of used guest soaps from American Hotels arguing that such
insensitive wastage would be an insult to resources noting that in Sub-Saharan Africa
29
thousands of lives could be saved by recycling the bars of soaps to be used for hand
washing to prevent diarrheal diseases, yet in Africa itself, 38.3% of the most educated
part of the Kenyan population do not feel it‟s a wastage while 5.9% think the economic
impacts of the waste is negligible. This can be attributed to the fact there is very little
concern for the environment among most Kenyans as can be seen in the wholesale
dumping of wastes in the streets and homes. It seems more of a cultural issue that has
defied the constant awareness on environmental stewardship.
Table 4.3: Soap wastage and environmental Concerns
Frequency Percent Valid Percent Cumulative
Percent
Valid
I_don_t_feel_anything 98 24.4 38.3 38.3
I_feel_concerned_about_the_wastage___
135 33.6 52.7 91.0
I_have_environmental_Concer
ns_about_its_disposal_ 8 2.0 3.1 94.1
The_cost_is_negligible___ 15 3.7 5.9 100.0
Total 256 63.7 100.0 Missing 146 36.3 Total 402 100.0
Source: Research Data, 2015
30
4.5 The Markovian Analysis
In this section we shall be addressing the second objective of the study which was to
employ Markov chains to determine the steady state probabilities for the guest soap and
shower gel.
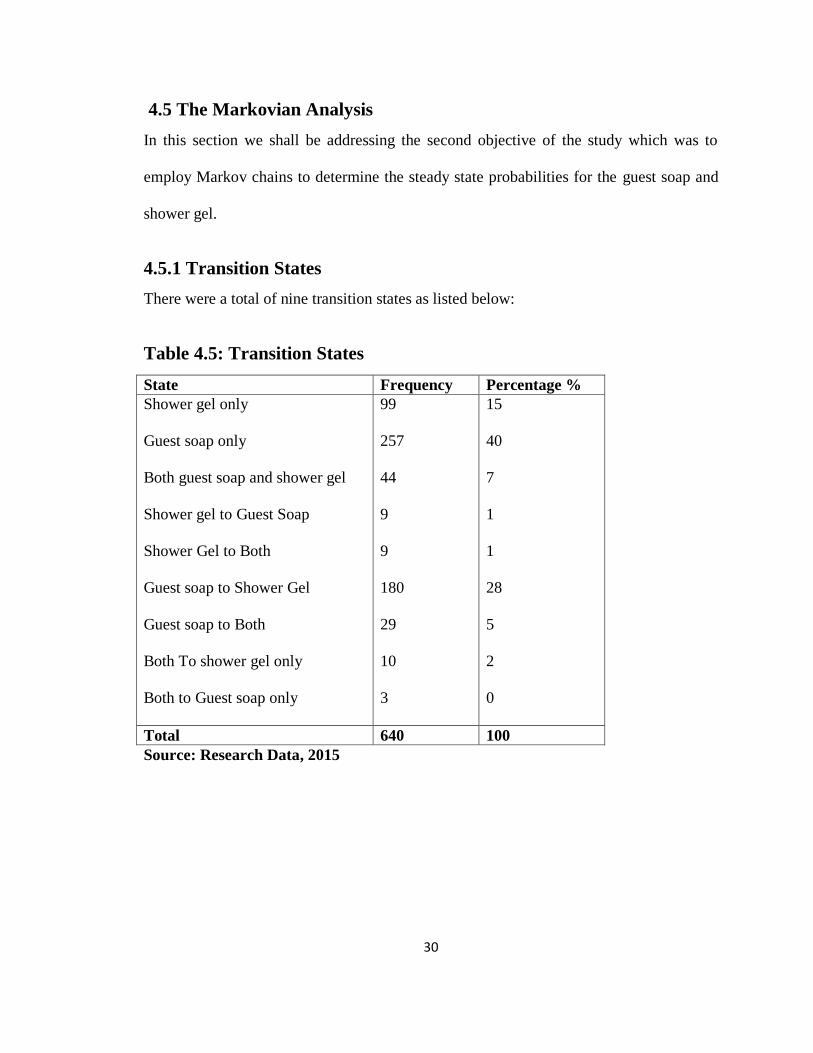
4.5.1 Transition States
There were a total of nine transition states as listed below:
Table 4.5: Transition States
State Frequency Percentage %
Shower gel only
Guest soap only
Both guest soap and shower gel
Shower gel to Guest Soap
Shower Gel to Both
Guest soap to Shower Gel
Guest soap to Both
Both To shower gel only
Both to Guest soap only
99
257
44
9
9
180
29
10
3
15
40
7
1
1
28
5
2
0
Total 640 100
Source: Research Data, 2015
31
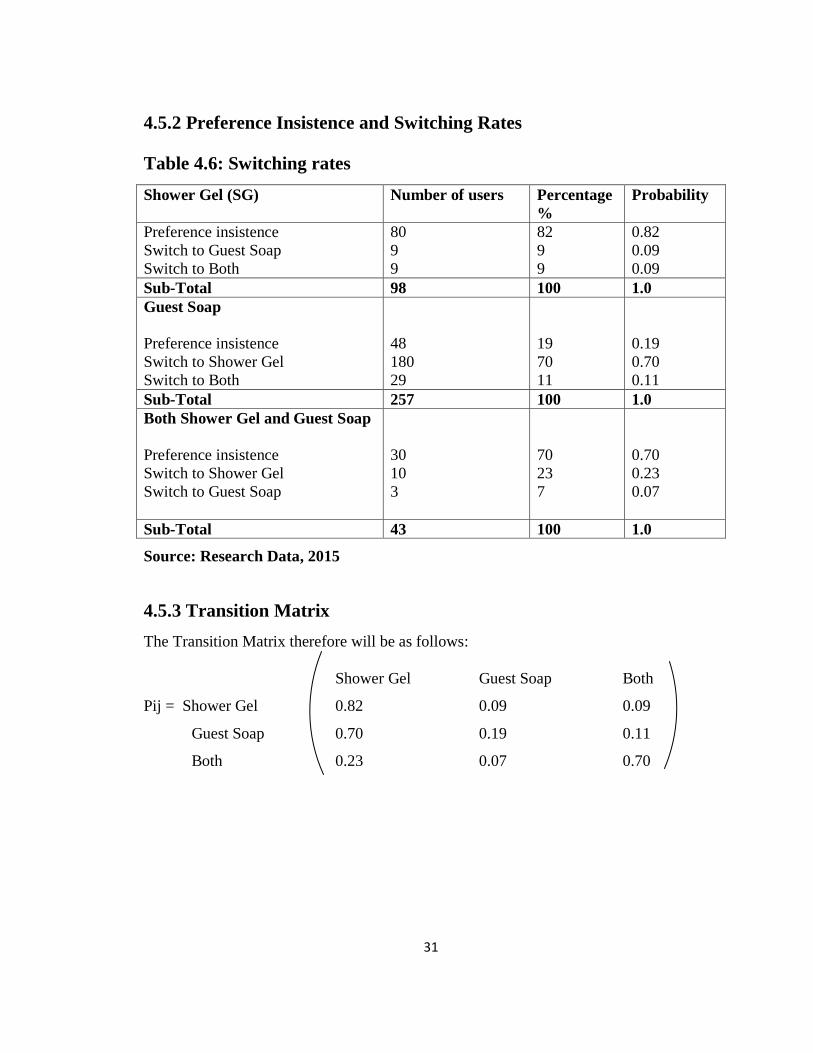
4.5.2 Preference Insistence and Switching Rates
Table 4.6: Switching rates
Shower Gel (SG) Number of users Percentage
%
Probability
Preference insistence
Switch to Guest Soap
Switch to Both
80
9
9
82
9
9
0.82
0.09
0.09
Sub-Total 98 100 1.0
Guest Soap
Preference insistence
Switch to Shower Gel
Switch to Both
48
180
29
19
70
11
0.19
0.70
0.11
Sub-Total 257 100 1.0
Both Shower Gel and Guest Soap
Preference insistence
Switch to Shower Gel
Switch to Guest Soap
30
10
3
70
23
7
0.70
0.23
0.07
Sub-Total 43 100 1.0
Source: Research Data, 2015
4.5.3 Transition Matrix
The Transition Matrix therefore will be as follows:
Shower Gel Guest Soap Both
Pij = Shower Gel 0.82 0.09 0.09
Guest Soap 0.70 0.19 0.11
Both 0.23 0.07 0.70
32
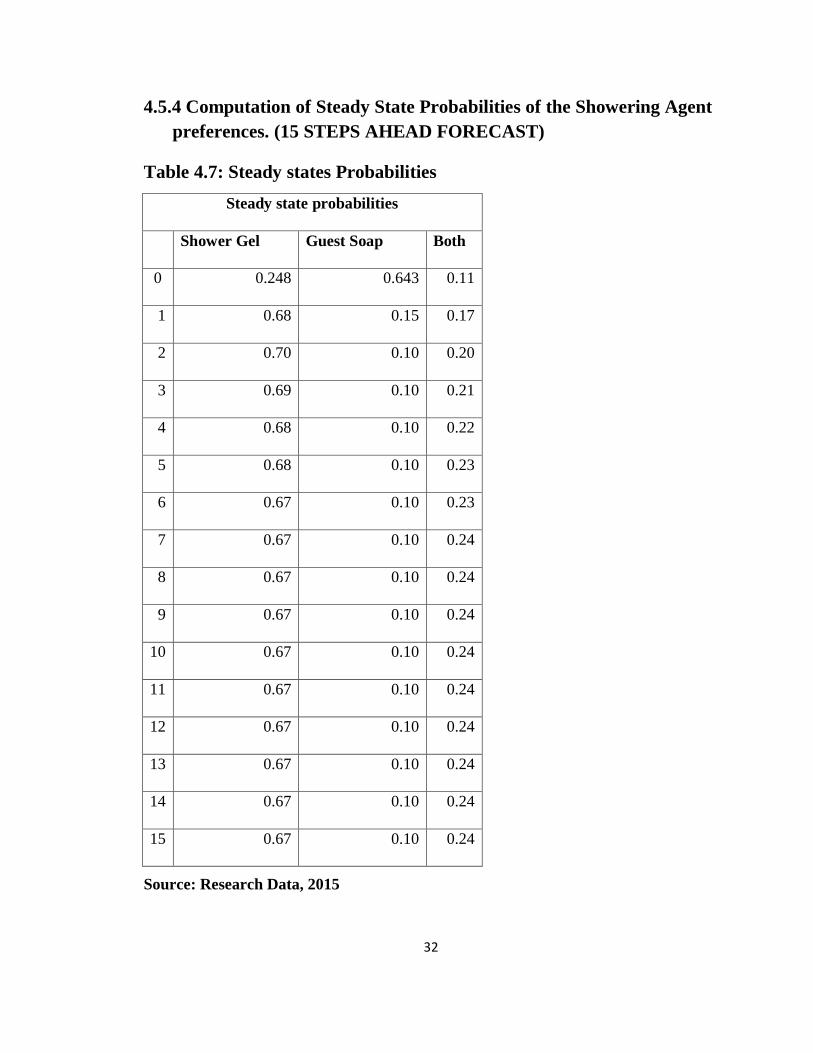
4.5.4 Computation of Steady State Probabilities of the Showering Agent
preferences. (15 STEPS AHEAD FORECAST)
Table 4.7: Steady states Probabilities
Steady state probabilities
Shower Gel Guest Soap Both
0 0.248 0.643 0.11
1 0.68 0.15 0.17
2 0.70 0.10 0.20
3 0.69 0.10 0.21
4 0.68 0.10 0.22
5 0.68 0.10 0.23
6 0.67 0.10 0.23
7 0.67 0.10 0.24
8 0.67 0.10 0.24
9 0.67 0.10 0.24
10 0.67 0.10 0.24
11 0.67 0.10 0.24
12 0.67 0.10 0.24
13 0.67 0.10 0.24
14 0.67 0.10 0.24
15 0.67 0.10 0.24
Source: Research Data, 2015
33
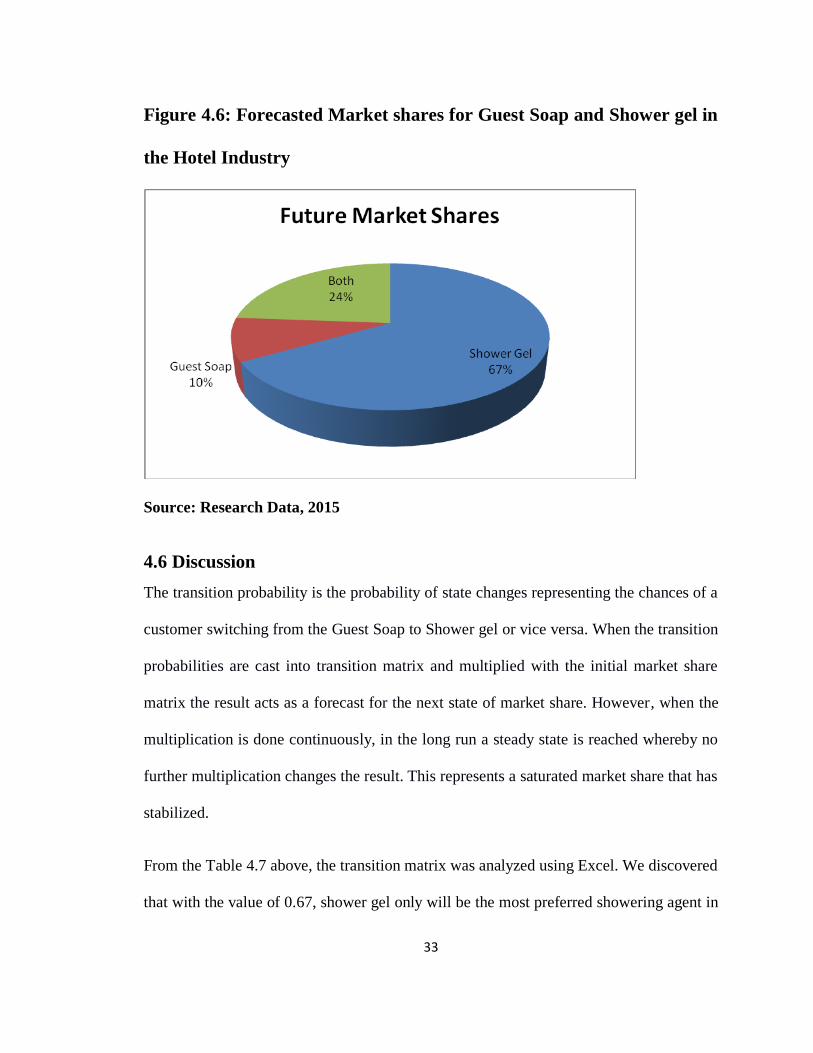
Figure 4.6: Forecasted Market shares for Guest Soap and Shower gel in
the Hotel Industry
Source: Research Data, 2015
4.6 Discussion
The transition probability is the probability of state changes representing the chances of a
customer switching from the Guest Soap to Shower gel or vice versa. When the transition
probabilities are cast into transition matrix and multiplied with the initial market share
matrix the result acts as a forecast for the next state of market share. However, when the
multiplication is done continuously, in the long run a steady state is reached whereby no
further multiplication changes the result. This represents a saturated market share that has
stabilized.
From the Table 4.7 above, the transition matrix was analyzed using Excel. We discovered
that with the value of 0.67, shower gel only will be the most preferred showering agent in
34
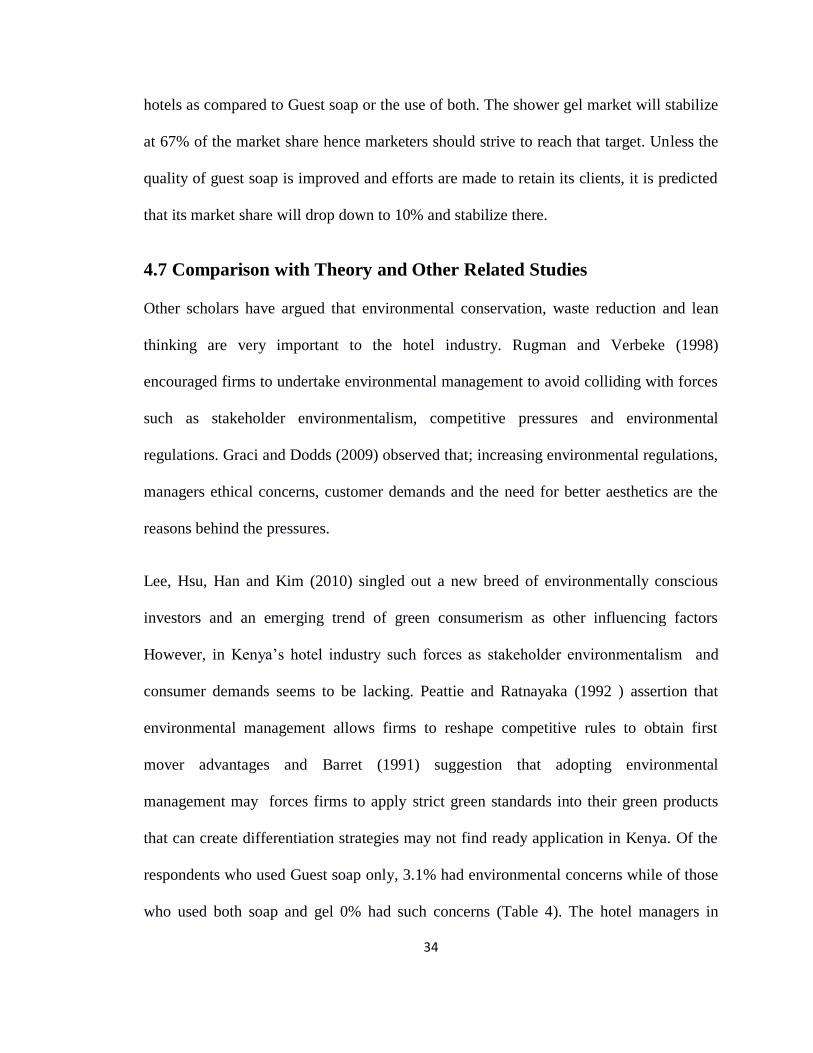
hotels as compared to Guest soap or the use of both. The shower gel market will stabilize
at 67% of the market share hence marketers should strive to reach that target. Unless the
quality of guest soap is improved and efforts are made to retain its clients, it is predicted
that its market share will drop down to 10% and stabilize there.
4.7 Comparison with Theory and Other Related Studies
Other scholars have argued that environmental conservation, waste reduction and lean
thinking are very important to the hotel industry. Rugman and Verbeke (1998)
encouraged firms to undertake environmental management to avoid colliding with forces
such as stakeholder environmentalism, competitive pressures and environmental
regulations. Graci and Dodds (2009) observed that; increasing environmental regulations,
managers ethical concerns, customer demands and the need for better aesthetics are the
reasons behind the pressures.
Lee, Hsu, Han and Kim (2010) singled out a new breed of environmentally conscious
investors and an emerging trend of green consumerism as other influencing factors
However, in Kenya‟s hotel industry such forces as stakeholder environmentalism and
consumer demands seems to be lacking. Peattie and Ratnayaka (1992 ) assertion that
environmental management allows firms to reshape competitive rules to obtain first
mover advantages and Barret (1991) suggestion that adopting environmental
management may forces firms to apply strict green standards into their green products
that can create differentiation strategies may not find ready application in Kenya. Of the
respondents who used Guest soap only, 3.1% had environmental concerns while of those
who used both soap and gel 0% had such concerns (Table 4). The hotel managers in
35
Kenya may therefore comfortably buy into the Agency theory that postulates that firms
exist to mainly maximize shareholders wealth therefore engaging in environmental
management would be tantamount to misuse of corporate resources (Friedman, 1970).
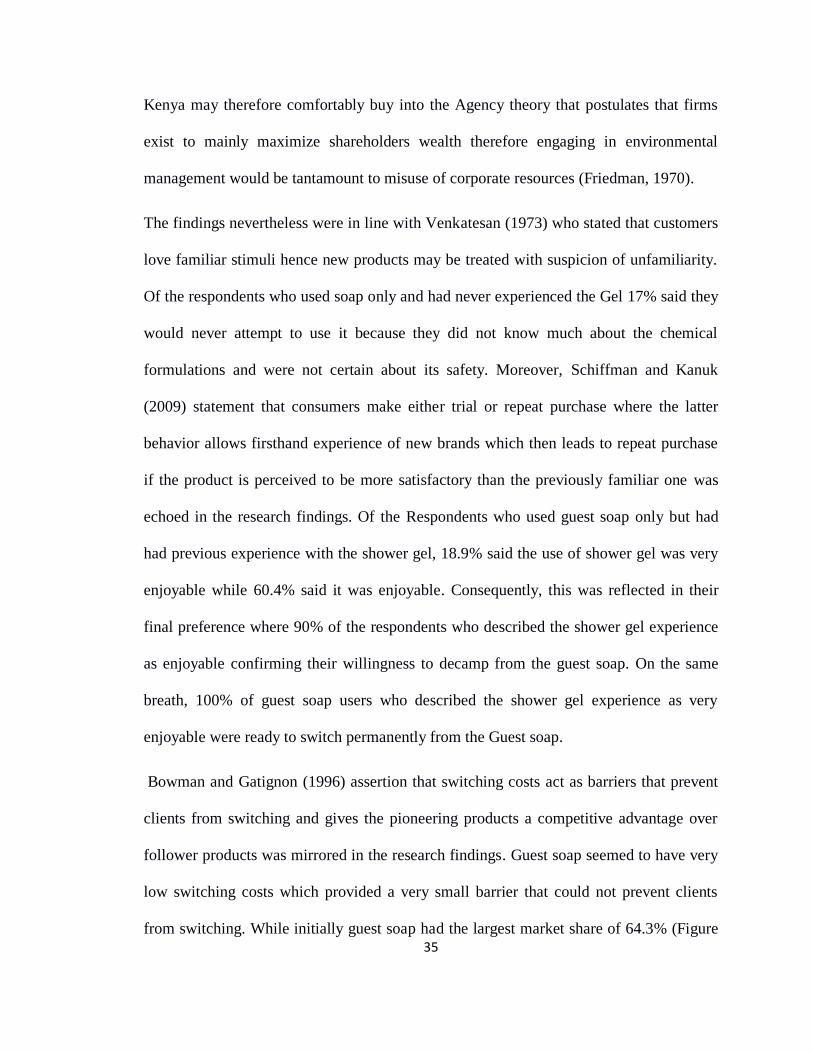
The findings nevertheless were in line with Venkatesan (1973) who stated that customers
love familiar stimuli hence new products may be treated with suspicion of unfamiliarity.
Of the respondents who used soap only and had never experienced the Gel 17% said they
would never attempt to use it because they did not know much about the chemical
formulations and were not certain about its safety. Moreover, Schiffman and Kanuk
(2009) statement that consumers make either trial or repeat purchase where the latter
behavior allows firsthand experience of new brands which then leads to repeat purchase
if the product is perceived to be more satisfactory than the previously familiar one was
echoed in the research findings. Of the Respondents who used guest soap only but had
had previous experience with the shower gel, 18.9% said the use of shower gel was very
enjoyable while 60.4% said it was enjoyable. Consequently, this was reflected in their
final preference where 90% of the respondents who described the shower gel experience
as enjoyable confirming their willingness to decamp from the guest soap. On the same
breath, 100% of guest soap users who described the shower gel experience as very
enjoyable were ready to switch permanently from the Guest soap.
Bowman and Gatignon (1996) assertion that switching costs act as barriers that prevent
clients from switching and gives the pioneering products a competitive advantage over
follower products was mirrored in the research findings. Guest soap seemed to have very
low switching costs which provided a very small barrier that could not prevent clients
from switching. While initially guest soap had the largest market share of 64.3% (Figure
36
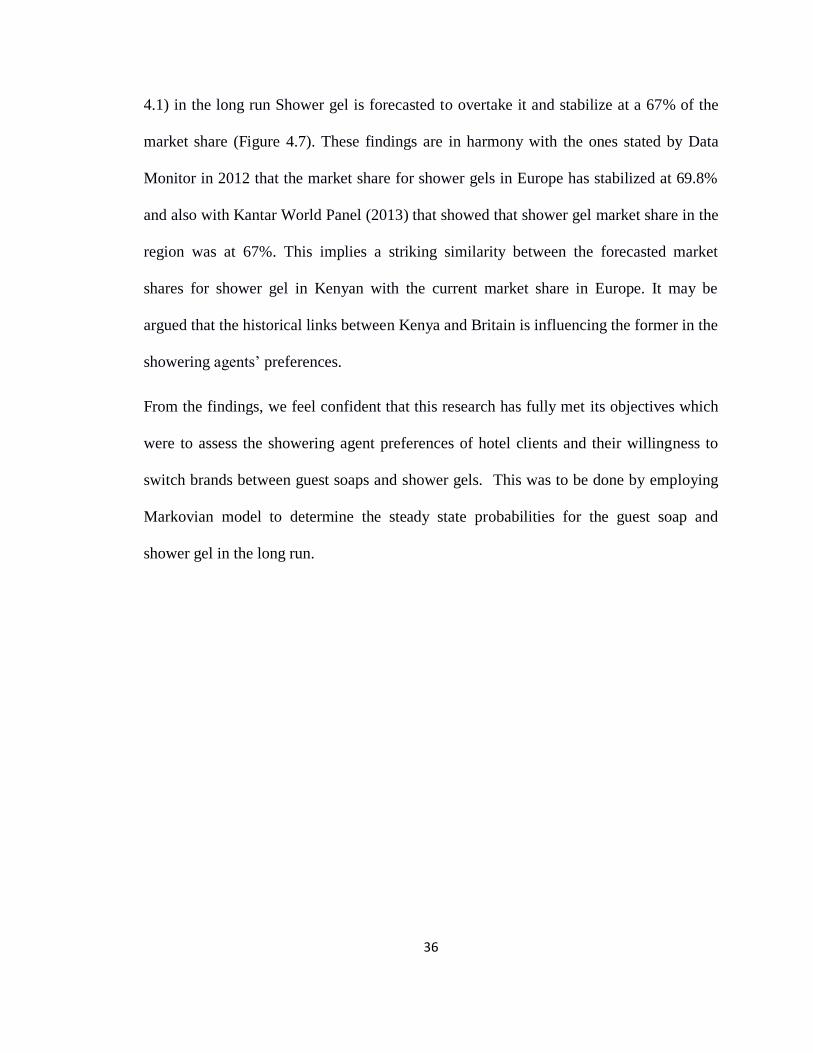
4.1) in the long run Shower gel is forecasted to overtake it and stabilize at a 67% of the
market share (Figure 4.7). These findings are in harmony with the ones stated by Data
Monitor in 2012 that the market share for shower gels in Europe has stabilized at 69.8%
and also with Kantar World Panel (2013) that showed that shower gel market share in the
region was at 67%. This implies a striking similarity between the forecasted market
shares for shower gel in Kenyan with the current market share in Europe. It may be
argued that the historical links between Kenya and Britain is influencing the former in the
showering agents‟ preferences.
From the findings, we feel confident that this research has fully met its objectives which
were to assess the showering agent preferences of hotel clients and their willingness to
switch brands between guest soaps and shower gels. This was to be done by employing
Markovian model to determine the steady state probabilities for the guest soap and
shower gel in the long run.
37
CHAPTER 5
SUMMARY, CONCLUSION, AND RECOMMENDATIONS
5.1 Introduction
This chapter provides a summary of the study findings and draws conclusion in line with
the objectives of the study. It also discusses the findings, implication to policy and their
contribution to theory and practice. It gives recommendations related to product
switching between Guest soap and Shower gel in the hotel industry. It also proposes areas
for further studies and highlights some of the study limitations.
5.2 Summary of Findings
The objectives of the study were to assess the preferences in showering agents as used by
the hotel guests and their willingness to switch brands between guest soaps and shower
gels. Markov chains were then employed to determine the steady-state probabilities for
the guest soap and shower gel.
The study found out that guest soap was the most available showering agent in Kenya‟s
hotel industry where it commanded the lion‟s share of the market share with a constant
presence in many hotels as the only provided agent for showering. Moreover, the guest
soap seemed to have the highest percentage of people reporting challenges with its use as
compared to shower gel. Major challenges cited against guest soap included its size that
was considered too tiny. It slips easily and falls on the floor making it unhygienic, the
scent was not very favorable to some while others claimed it was too hard to lather well
in water. Due to these challenges some respondents preferred buying their own soaps. On
the other hand the challenges leveled against the Shower gel included difficulty in use
38
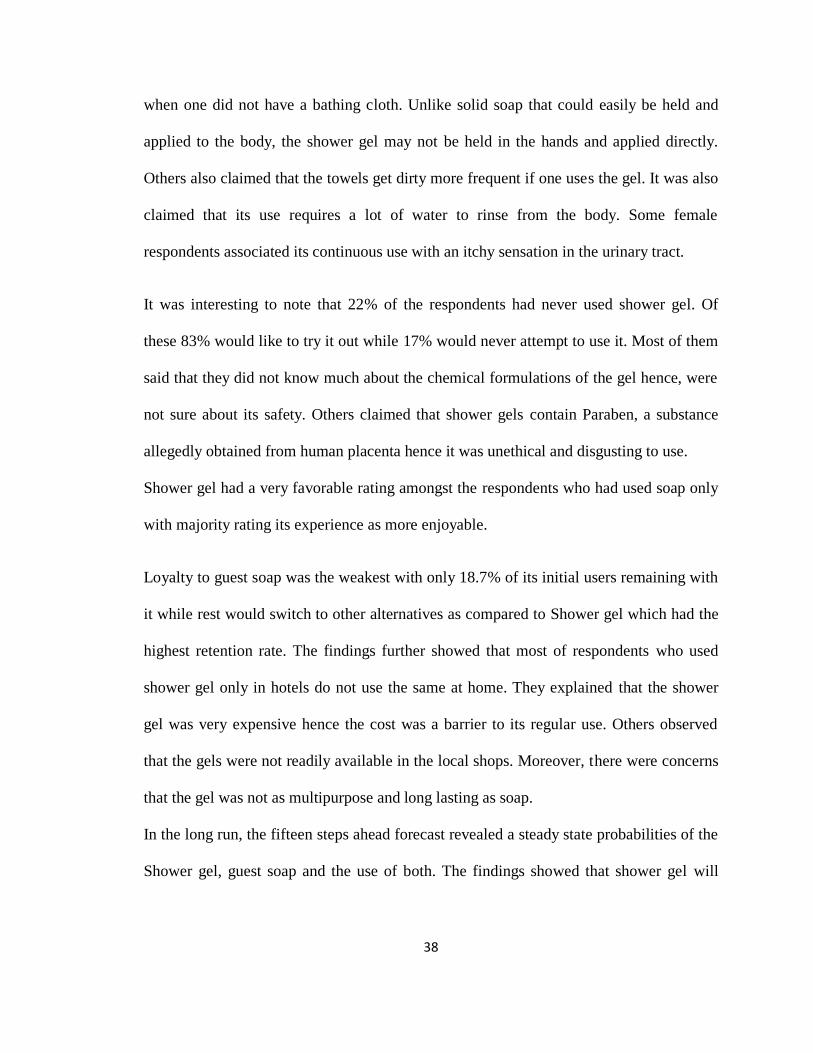
when one did not have a bathing cloth. Unlike solid soap that could easily be held and
applied to the body, the shower gel may not be held in the hands and applied directly.
Others also claimed that the towels get dirty more frequent if one uses the gel. It was also
claimed that its use requires a lot of water to rinse from the body. Some female
respondents associated its continuous use with an itchy sensation in the urinary tract.
It was interesting to note that 22% of the respondents had never used shower gel. Of
these 83% would like to try it out while 17% would never attempt to use it. Most of them
said that they did not know much about the chemical formulations of the gel hence, were
not sure about its safety. Others claimed that shower gels contain Paraben, a substance
allegedly obtained from human placenta hence it was unethical and disgusting to use.
Shower gel had a very favorable rating amongst the respondents who had used soap only
with majority rating its experience as more enjoyable.
Loyalty to guest soap was the weakest with only 18.7% of its initial users remaining with
it while rest would switch to other alternatives as compared to Shower gel which had the
highest retention rate. The findings further showed that most of respondents who used
shower gel only in hotels do not use the same at home. They explained that the shower
gel was very expensive hence the cost was a barrier to its regular use. Others observed
that the gels were not readily available in the local shops. Moreover, there were concerns
that the gel was not as multipurpose and long lasting as soap.
In the long run, the fifteen steps ahead forecast revealed a steady state probabilities of the
Shower gel, guest soap and the use of both. The findings showed that shower gel will
39
command the future market share at an estimated rate of 67% while Guest soap will be
relegated to a paltry 10% of the market share.
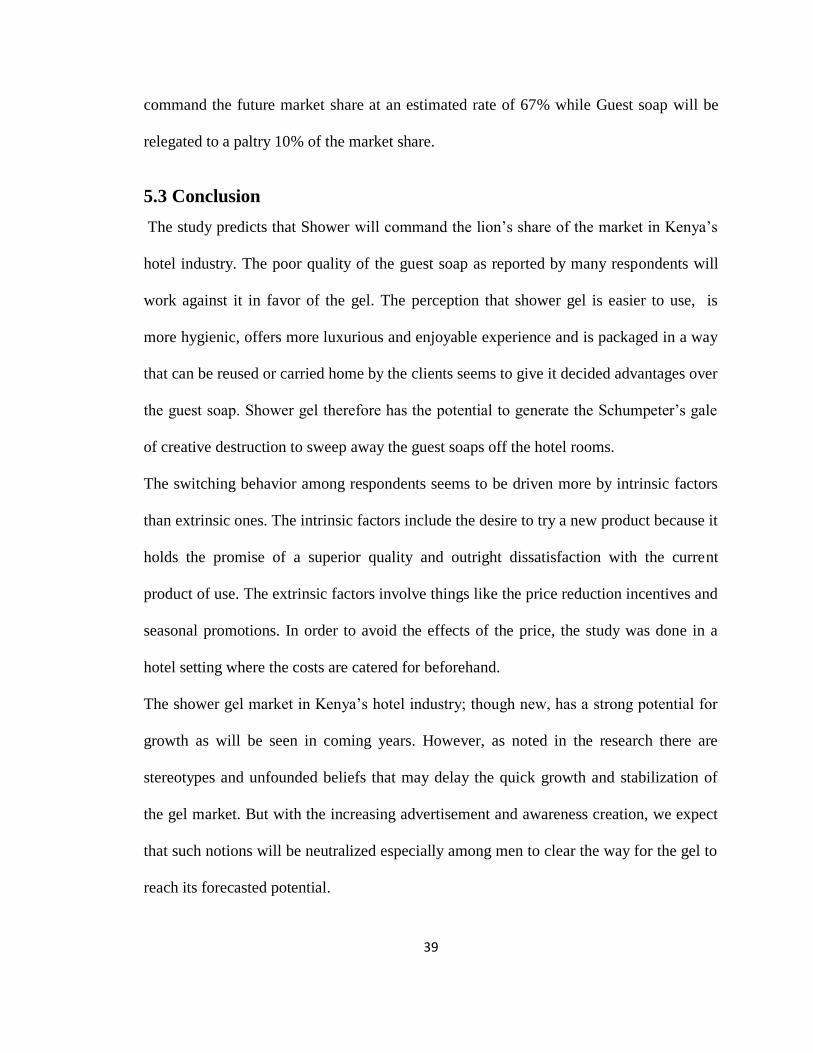
5.3 Conclusion
The study predicts that Shower will command the lion‟s share of the market in Kenya‟s
hotel industry. The poor quality of the guest soap as reported by many respondents will
work against it in favor of the gel. The perception that shower gel is easier to use, is
more hygienic, offers more luxurious and enjoyable experience and is packaged in a way
that can be reused or carried home by the clients seems to give it decided advantages over
the guest soap. Shower gel therefore has the potential to generate the Schumpeter‟s gale
of creative destruction to sweep away the guest soaps off the hotel rooms.
The switching behavior among respondents seems to be driven more by intrinsic factors
than extrinsic ones. The intrinsic factors include the desire to try a new product because it
holds the promise of a superior quality and outright dissatisfaction with the current
product of use. The extrinsic factors involve things like the price reduction incentives and
seasonal promotions. In order to avoid the effects of the price, the study was done in a
hotel setting where the costs are catered for beforehand.
The shower gel market in Kenya‟s hotel industry; though new, has a strong potential for
growth as will be seen in coming years. However, as noted in the research there are
stereotypes and unfounded beliefs that may delay the quick growth and stabilization of
the gel market. But with the increasing advertisement and awareness creation, we expect
that such notions will be neutralized especially among men to clear the way for the gel to
reach its forecasted potential.
40
5.4 Recommendations
In the Markovian product switching model used, it was clear that the switching was
caused by intrinsic factor that is dissatisfaction with the current product of use. To
prevent this, manufacturer need to invest in research and development to come up with
high quality products that will retain customers and attract new ones. Especially should
the manufacturers of guest soap invest more on the quality of the soap to lather well in
water. They should also offer different scents for the soap to avoid the characteristic
smell of guest soaps. The size is also of concern to the hotel clients should find the
optimum size and package that would be suitable for the clients. Manufacturers of shower
gel further need to research more on the complaints about allergic reactions and advise
users accordingly. They should also consider attaching a bathing cloth with the gel since
it is difficult to apply the gel directly on the body
There is need to build strong brand name loyalty that is familiar to clients to prevent
Product switching. Soap manufacturers should have a well known brand specifically
customized for hotels based on the expected quality as per the hotels star rating.
The marketers of shower gel also need to concentrate more on the males to debunk the
myths about shower gels and change their perception about its use. They should clearly
explain the safety of the chemical formulations of the gel. Shower gel has great potential
among those who have once used it hence its marketers should invest in giving out free
samples to attract new customers.
As the market share of shower gel is estimated to stabilize at 67%, the players in the
industry should closely monitor the growth of the market share and invest in new product
41
innovation and expansion of their product lines to beat the saturating market. They may
also consider venturing into nearby countries whose markets are not saturated.
5.5 Limitations of the Study
This study may be limited in that our data was collected only from university students
hence may not be accurately generalized to the whole population. We also did not
consider other aspects that may promote product switching such as level of income,
change in social class, role of new product launch and promotions among others.
We also did not look at individual brands of guest soap and shower gels. There may be
differences in quality, sizes and fragrances which respondents might have considered
differently. Another component that may have limited the study was the cultural
dimension of showering preferences. We did not consider the role culture and gender
play in the shower gel and soap market because it would have made the study too
complex for the scope and time frame available.
The cost of doing the study was also a limitation. Data collection costs, printing costs,
binding costs, transport and internet costs was a challenge based on the high sample size
used.
42
5.6 Suggestions for Further Research
We encourage future researchers to consider other variables that influence product
switching such as level of income, change in social class and role of new product launch
in conducting a similar study. We suggest that a similar study be done in the house hold
setting since ours was limited to hotel industry alone.
We also recommend that the issue of culture and gender preferences be studied as
determinants to the uptake and use of shower gels.
Future studies may also need to look at specific brands of guest soap and shower gel and
compare their individual markets shares and switching behaviors.
43
REFERENCES
Andersson, L., & Bateman. (2000). Individual Environmental Initiative: championing
natural environmental issues in US business organizations. Academy of
Management Journal, Vol. 43 No. 4, pp. 548-70
Awogbemi, C. A., Oloda, F. S., & Osama, C. K. (2012). Modeling Brand Switching in
Consumers‟ Products. Journal of Economics and Sustainable Development, 3(12),
82-86
Bell, S., Auh, S., & Smalley, K. (2005). Customer relationship dynamics: service quality
and customer loyalty in the context of varying levels of customer expertise and
switching cost. Journal of the Academy of Marketing Science, Vol. 33 No. 2, pp.
1.
Bernard, A. B., Jensen, J. B., Redding, S. J., & Schott, P. K. (2010). Wholesalers and
retailers in US trade. National Bureau of Economic Research, (long version) (No.
w15660.
Blanchin, Audrey, Cyrielle Chareyron, and Quentin Levert. "The customer behaviour in
the men's cosmetics market." Diss. University of Halmstad School of Business
and Engineering (2007).
Bohdanowicz, P. (2005). European hoteliers‟ environmental attitudes greening the
business. Cornell Hotel and Restaurant Administration Quarterly, 46(2), 188-204.
Boone, L., & Kurtz, D. (2007). Contemporary Marketing. Philadelphia: Harcourt College
Publishers.
Bowman, D., & Gatignon, H. (1996). Order of entry as a moderator of the effect of the
marketing mix on market share. Marketing Science, 15(3), 222-242.
Burnham, T., Frels, J., & Mahajan, V. (2003). Consumer switching costs: a typology,
antecedents, and consequences. Journal of the Academy of Marketing Science,
Vol. 31.
Business Dictionary. (2015). Retrieved August 20, 2015, from businessdictionary.com:
http://www.businessdictionary.com/definition/hotel.html
Chen, Y., Lai, S., & Wen, C. (2006). The influence of green innovation performance on
corporate advantage in Taiwan. Journal of Business Ethics, Vol. 67 No. 4, pp.
331-9.
Datamonitor. (2000). Retrieved from http://www.datamonitorconsumer.com/.
Data panel, Europe, TGI Europa, 2002 - 03/11/2015
Decelle, X. (2004). A conceptual and dynamic approach to innovation in tourism.
Lugano: OECD.
Deloitte Report. (2008). Deloitte Netherlands Annual report 2008/2009. Retrieved from
deloitteannualreport.nl: http://2008-
2009.deloitteannualreport.nl/downloads/cEN367_Downloads.aspx
Dodds, R., & Graci, S. (2009). Canada's tourism industry—mitigating the effects of
climate change: A lot of concern but little action. Tourism and Hospitality
Planning & Development, 6(1), 39-51.
44
Euromonitor. (2000). Euromonitor International. Retrieved from www.euromonitor.com:
http://www.euromonitor.com/bath-and-shower
Euromonitor International Database. (2010). Retrieved from
http://www.euromonitor.com.
Friedman, M. (1970, September 13). A Friedman doctrine: the social responsibility of
business is to increase its profit. New York Times Magazine, pp. 32-3.
Garland, R. (2002). Estimating customer defection in personal retail banking.
International Journal of Bank Marketing , Vol. 20 No. 7, pp. 317-24.
Gladwin, T., Kennelly, J., & Krause, T. (1995). Shifting paradigms for sustainable
development: implications for management theory and research. Academy of
Management Review , Vol. 20 No. 4, pp. 874-907.
Gliedt, T., & Parker, P. (2007). Green community entrepreneurship: creative destruction
in the social economy. International Journal of Social Economics, 34(8), 538-
553.
Hall, C. M., & Lew, A. A. (2009). Understanding and managing tourism impacts: An
integrated approach. Routledge.
Hartman, C., & Stafford, E. (1997). Green alliances: building new business with
environmental groups. Long Range Planning, Vol. 30 No. 2, pp. 184-96.
Lee, J. S., Hsu, L. T., Han, H., & Kim, Y. (2010). Understanding how Consumers view
green hotels: how a hotel's green image can influence behavioural intentions.
Journal of Sustainable Tourism, 18(7), 901-914.
Levy, D. (1997). Lean Production in an International Supply Chain. Sloan Management
Review, Vol. 38, pp. 94-102.
London School of Tropical Medicine and Hygiene. (2000). ‘The global market for soaps:
A market research report for the public-private partnership on handwashing with
soap. Retrieved from http://tinyurl.com/ohs36z
MINTEL. (2000). The UK Market for Cosmetics and Toiletries . Mintel Keynote.
Mwangi, P. M. (1983). Statistical forecasting as a method of management and control of
inventory a case for guest soap at block lodges A subsidiary of block hotels
management limited (Doctoral dissertation).
Mugenda, O. M. Mugenda. AG (2003). Research Methods, Qualitative and Quantitative
Approaches.
Muthini, M., Tole, M. P., & Otieno, D. (2003). Solid Waste Pollution Loads in Beach
Hotels in the Kenyan South Coast. Coastal Ecology, 153.
Ng, M. K., & Ching, W. K. (2006). Markov Chains: Models, Algorithms and
Applications. Springer.
Porter, M., & Van der Linde, C. (1995). Green and competitive: ending the stalemate.
Harvard Business Review, Vol. 73 No. 5, pp. 120-34.
Rajkumar, R., & Chaarlas, L. J. (2012). Brand switching in cellular phone service
industry: Impact of personal issues faced by clients. EXCEL. International
Journal of Multidisciplinary Management Studies, 2(7), 59-76.
Roos, D., Womack, J. P., & Jones, D. (1990). The Machine That Changed the World: The
Story of Lean Production. New York: Rawson/Harper Perennial.
45
Rugman, A. M., & Verbeke, A. (1998). Corporate strategy and international
environmental policy. Journal of International Business Studies, 819-833.
Russell, R., & Taylor, B. (1999). Operations Management (2nd ed.). Upper Saddle River,
NJ: Prentice Hall.
Schiffman, L., & Kanuk, L. (2009). Consumer Behaviour (9 th ed ed.). Englewood, New
Jersey: Prentice Hall.
Schilirò, D. (2015). Innovation in small and medium enterprises in the United Arab
Emirates.
Schumpeter, J. (1950). Capitalism, Socialism and Democracy. New York, NY: Harper
Torchbooks.
Schumpeter, J. A. (1934). The Theory of Economic Development. Cambridge, MA:
Harvard University Press.
Seth, D., & Gupta, V. (2005). Application of value stream mapping for lean operations
and cycle time reduction: an Indian case study. Production Planning & Control,
16(1), 44-59.
Timoshenko, O. A. (2015). Product switching in a model of learning. Journal of
International Economics, 95(2), 233-249.
Umoh, G. I., Awa, H. O., & Ebitu, P. T. (2013). Markovian Application to Brand
Switching Behaviour: A Survey of Toothpaste. European Journal of Business and
Management, 5(22), 110-124.
Uslu, A. Y. P. A. R., & Cam, T. U. N. C. A. Y. (2014). Analysis of Brand Loyalty with
Markov Chains. website: http://www. opf. slu. cz/vvr/akce/turecko/pdf/Uslu. pdf.
UNEP. (2003). United Nations Environmental Programme. Retrieved from unep.org:
http://www.unep.org/annualreport/2003/
Venkatesan, M. (1973). Cognitive consistency and novelty seeking. Consumer behavior.
Theoretical sources, 355-384.
Vlachos, I., & Bogdanovic, A. (2013). Lean thinking in the European hotel industry.
Tourism Management, 36, 354-363.
Willard, R. (2009). The Sustainability Champion’s Guidebook: How to Transform Your
Company. Gabriola Island: New Society Publishers.
46
APPENDICES
Appendix 1: Questionnaire
PART A: Background of Respondent
1. Hotel name:......................................
2. Hotel Star Rating.......................................
3. Nationality
Kenyan Others…………………………..
4. Gender
Male Female
5. Age
20-24 years 25-29 years
30-34 years 35-39 years
40-44 years Over 45 years
6. Highest level of education
Primary School Secondary school
Diploma/ Certificate University degree
Masters/ PhD
PART B: Personal Preferences
7. In the last one year, have you spent in any hotel?
Yes No
47
8. If Yes what type of showering agent did you use during your stay in this hotel?
Guests Soap only Shower Gel only
Both Soap and Shower Gel
48
If Guest Soap, why do you prefer it over shower gel?
I am more familiar with it.
I have had skin reactions with it in my previous use with shower gel.
Only Guest soap was provided in the rooms.
Use of Guest soap offers a more enjoyable experience.
I don't trust Shower gels.
i. How do you feel about paying for a soap that is only used once and
then the rest is discarded?)
The cost is negligible
I have environmental Concerns about its disposal
I feel concerned about the wastage.
I don‟t feel anything
ii. If you have wastage or environmental concerns , what would
suggest to be done in order to reduce it?
I don‟t have such concerns
Use non-soap fillers
Use Shower gels that can be reused or carried home.
Others (Specify)
iii. Are there any challenges you experience with using the guest
soap?
Yes No
If yes state them…………………………………………………..
iv. Have you ever used a shower gel?
49
Yes No
v. If No, would you like to try it out?
Yes No
vi. If No, why-------------------------------------------------------------------
vii. If you have ever used shower gel how can you describe the
experience?
Very enjoyable
Enjoyable
Just normal
Not enjoyable
viii. Given a chance would you discontinue the use of Guest soap in
favor of Shower gel?
Yes No I‟d rather use both
ix. If no explain your reasons------------------------------------------------
---------
9. If you used shower Gel only why did you prefer it over guest soap?
Only shower gel was offered
It offers more luxurious and enjoyable experience
It is easier to use
It is less wasteful
It is more hygienic
It is easier to carry home the left over.
It lathers well in water and has more foams.
50
i. Are there any challenges you experience with using the Shower
Gel?
Yes No
ii. If Yes state the challenges……………………………….
iii. Do you use shower gel back at your home?
Yes Occasionally Yes: Always
Yes but alongside toilet soap Not at all
iv. If no or occasionally why?
It is expensive.
It is not as long lasting as toilet soap.
My family does not like it.
It is not multipurpose as in it can only be used for showering.
I once experienced skin reactions with it.
v. Given a chance would you discontinue the use shower gel of in
favor of guest soap?
Yes No I'd rather use both
10. If you used both shower gel and guest soap what are your reasons?
To test and experience the shower gel.
I‟m used to it that way.
Because both were provided.
I need soap to wash my face and others while I use gel to clean my body.
Others specify……………………………
51
i. How do you feel about paying for a soap that is only used once and
then the rest is discarded?
The cost is negligible
I have environmental Concerns about its disposal
I feel concerned about the wastage.
I feel nothing about it
ii. If you have environmental or wastage concerns, what would
suggest to be done in order to reduce it?
I don‟t have such concerns
Use non-soap fillers
Use Shower gels that can be reused or carried home.
Others (Specify)
iii. Do you use both shower gel and toilet soap back at your home?
Yes Occasionally Yes: Always
I use Toilet soap only I use shower gel only
iv. If you use toilet soap only or both occasionally why?
Gel is expensive.
It is not as long lasting as toilet soap.
My family does not like the gel.
It is not multipurpose as in it can only be used for showering.
I once experienced skin reactions with it.
52
v. In the future do you intend to continue using both or you may
change to either soap only or gel only?
I intend to continue I may change Not sure
11. If you were change which showering agent would you opt for?
Shower Gel Guest soap
******************Thank you for your Time and support********************