Embed Size (px)
Citation preview
Corporate Presentation April 2008
CHENIERE ENERGY
2
This presentation contains certain statements that are, or may be deemed to be, “forward-looking statements” within the meaning of Section 27A of the Securities Act of 1933, as amended, and Section 21E of the Securities Exchange Act of 1934 as amended. All statements, other than statements of historical fact, included herein are “forward-looking statements.” Included among “forward-looking statements” are, among other things:
statements that we expect to commence or complete construction of each or any of our proposed liquefied natural gas, or LNG, receiving terminals and pipelines by certain dates, or at all;statements that we expect to receive authorization from the Federal Energy Regulatory Commission, or FERC, to construct and operate proposed LNG receiving terminals and pipelines by a certain date, or at all;statements regarding future levels of domestic natural gas production and consumption, or the future level of LNG imports into North America, or regarding projected future capacity of liquefaction or regasification, liquefaction utilization or total monthly LNG trade facilities worldwide, regardless of the source of such information;statements regarding any financing transactions or arrangements, whether on the part of Cheniere or at the project level;statements relating to the construction of our proposed LNG receiving terminals and pipelines, including statements concerning estimated costs, and the engagement of any contractor; statements regarding any Terminal Use Agreement, or TUA, or other commercial arrangements presently contracted, optioned, marketed or potential arrangements to be performed substantially in the future, including any cash distributions and revenues anticipated to be received; statements regarding the commercial terms and potential revenues from activities described in this presentation;statements regarding the commercial terms or potential revenue from any arrangements which may arise from the marketing of uncommitted capacity from any of the terminals, including the Creole Trail and Corpus Christi terminals which do not currently have contractual commitments;statements that our proposed LNG receiving terminals, when completed, will have certain characteristics, including amounts of regasification and storage capacities, a number of storage tanks and docks and pipeline interconnections;statements regarding forecasts, including any potential revenue and capital expenditures and cash flows; statements regarding our proposed pipelines and the capital expenditures and potential revenues related to them; statements regarding our proposed LNG receiving terminals’ access to existing pipelines, and their ability to obtain transportation capacity on existing pipelines; statements regarding the Cheniere Southern Trail Pipeline, and its potential business opportunities;statements regarding possible expansions of the currently projected size of, or any enhancements at, any of our proposed LNG receiving terminals, and statements regarding potential acquisitions; statements regarding the payment by Cheniere Energy Partners, L.P. of cash distributions;statements regarding our business strategy, our business plan or any other plans, forecasts, examples, models, or objectives, any or all of which are subject to change; statements regarding estimated corporate overhead expenses; andany other statements that relate to non-historical information.
These forward-looking statements are often identified by the use of terms and phrases such as “achieve,” “anticipate,” “believe,” “estimate,” “example,” “expect,” “forecast,”“opportunities,” “plan,” “potential,” “project,” “propose,” “subject to,” and similar terms and phrases. Although we believe that the expectations reflected in these forward-looking statements are reasonable, they do involve assumptions, risks and uncertainties, and these expectations may prove to be incorrect. You should not place undue reliance on these forward-looking statements, which speak only as of the date of this presentation. Our actual results could differ materially from those anticipated in these forward-looking statements as a result of a variety of factors, including those discussed in “Risk Factors” in the Cheniere Energy, Inc. and Cheniere Energy Partners, L.P.Annual Reports on Form 10-K for the year ended December 31, 2007. All forward-looking statements attributable to us or persons acting on our behalf are expressly qualified in their entirety by these ”Risk Factors”. These forward-looking statements are made as of the date of this presentation, and we undertake no obligation to publicly update or revise any forward-looking statements.
Safe Harbor Statement

3
Summary Components of Value
90.6% Interest in Cheniere Energy Partners (CQP)– GP Interest, ~3.3 mm shares ($5.6MM), $18MM annual management fees– Common Interest, ~10.9MM shares ($18.7MM annual distribution)– Subordinated Interest, ~135.4MM shares
Creole Trail Pipeline– Estimated construction cost of $550MM: Interruptible cash flow based on
utilization
30% Interest in Freeport LNG facility– Estimated cash distributions of $15MM annually
Creating option value by developing marketing franchise for 2 Bcf/d of regas capacity reserved at Sabine Pass LNG terminal
Focusing on future development at both LNG and CQP– Fully permitted LNG development sites: Corpus Christi and Creole Trail– Recently announced development of Cheniere Southern Trail pipeline
4
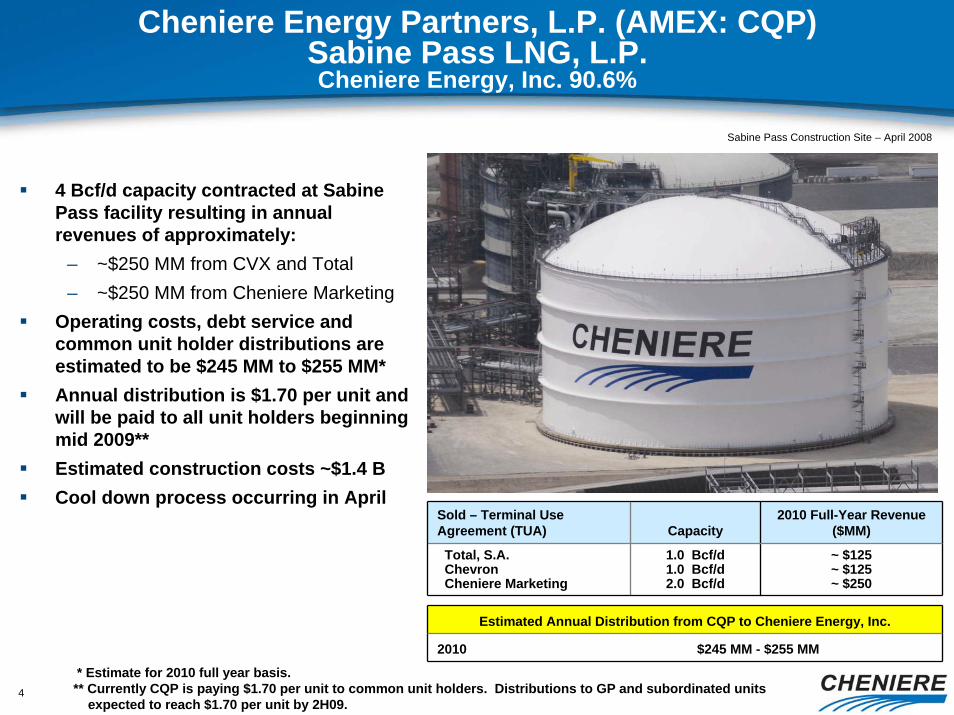
Cheniere Energy Partners, L.P. (AMEX: CQP)Sabine Pass LNG, L.P. Cheniere Energy, Inc. 90.6%
Sold – Terminal Use Agreement (TUA) Capacity
2010 Full-Year Revenue ($MM)
Total, S.A.Chevron Cheniere Marketing
1.0 Bcf/d1.0 Bcf/d2.0 Bcf/d
~ $125~ $125~ $250
Estimated Annual Distribution from CQP to Cheniere Energy, Inc.
2010 $245 MM - $255 MM
Sabine Pass Construction Site – April 2008
4 Bcf/d capacity contracted at Sabine Pass facility resulting in annual revenues of approximately:
– ~$250 MM from CVX and Total– ~$250 MM from Cheniere Marketing
Operating costs, debt service and common unit holder distributions are estimated to be $245 MM to $255 MM*Annual distribution is $1.70 per unit and will be paid to all unit holders beginning mid 2009**Estimated construction costs ~$1.4 BCool down process occurring in April
* Estimate for 2010 full year basis. ** Currently CQP is paying $1.70 per unit to common unit holders. Distributions to GP and subordinated units
expected to reach $1.70 per unit by 2H09.
5
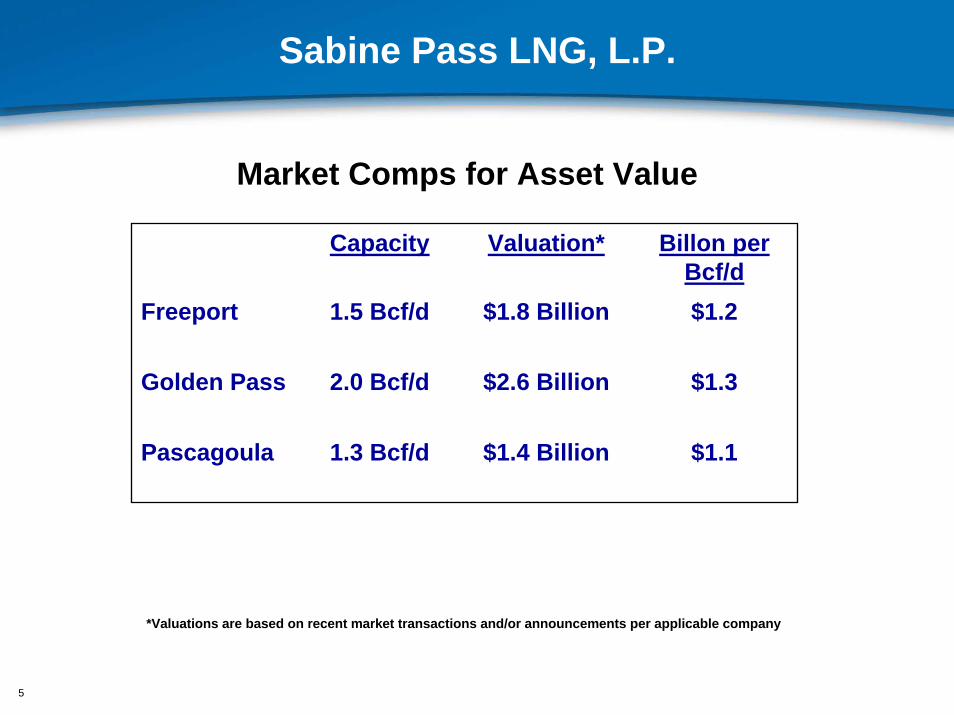
Sabine Pass LNG, L.P.
Capacity Valuation* Billon per Bcf/d
Freeport 1.5 Bcf/d $1.8 Billion
$2.6 Billion
$1.4 Billion
Golden Pass 2.0 Bcf/d
$1.2
$1.3
Pascagoula 1.3 Bcf/d $1.1
Market Comps for Asset Value
*Valuations are based on recent market transactions and/or announcements per applicable company
6
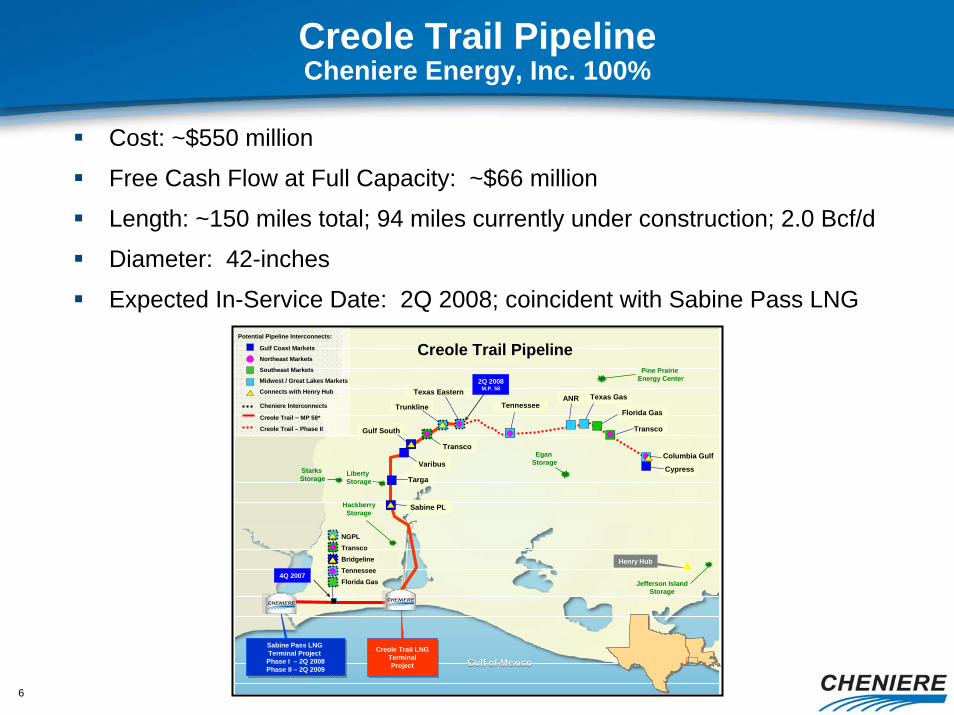
Creole Trail PipelineCheniere Energy, Inc. 100%
Cost: ~$550 million
Free Cash Flow at Full Capacity: ~$66 million
Length: ~150 miles total; 94 miles currently under construction; 2.0 Bcf/d
Diameter: 42-inches
Expected In-Service Date: 2Q 2008; coincident with Sabine Pass LNG
Sabine PL
Targa
Transco
Gulf South
Trunkline
Jefferson IslandStorage
Sabine Pass LNG Terminal Project
Phase I – 2Q 2008Phase II – 2Q 2009
Sabine Pass LNG Terminal Project
Phase I – 2Q 2008Phase II – 2Q 2009
Creole Trail LNGTerminalProject
Creole Trail LNGTerminalProject
Henry Hub
Varibus
NGPLTranscoBridgelineTennesseeFlorida Gas
Creole Trail Pipeline
Liberty Storage
Starks Storage
Hackberry Storage
Texas Eastern
Gulf Coast Markets
Northeast Markets
Southeast Markets
Midwest / Great Lakes Markets
Connects with Henry Hub
Gulf of MexicoGulf of Mexico
4Q 2007
ANR Texas Gas
Transco
Florida Gas
Columbia Gulf
Cypress
Egan Storage
Pine Prairie Energy Center
Tennessee
2Q 2008M.P. 58
Cheniere Interconnects
Creole Trail – MP 58*
Creole Trail – Phase II
Potential Pipeline Interconnects:
7
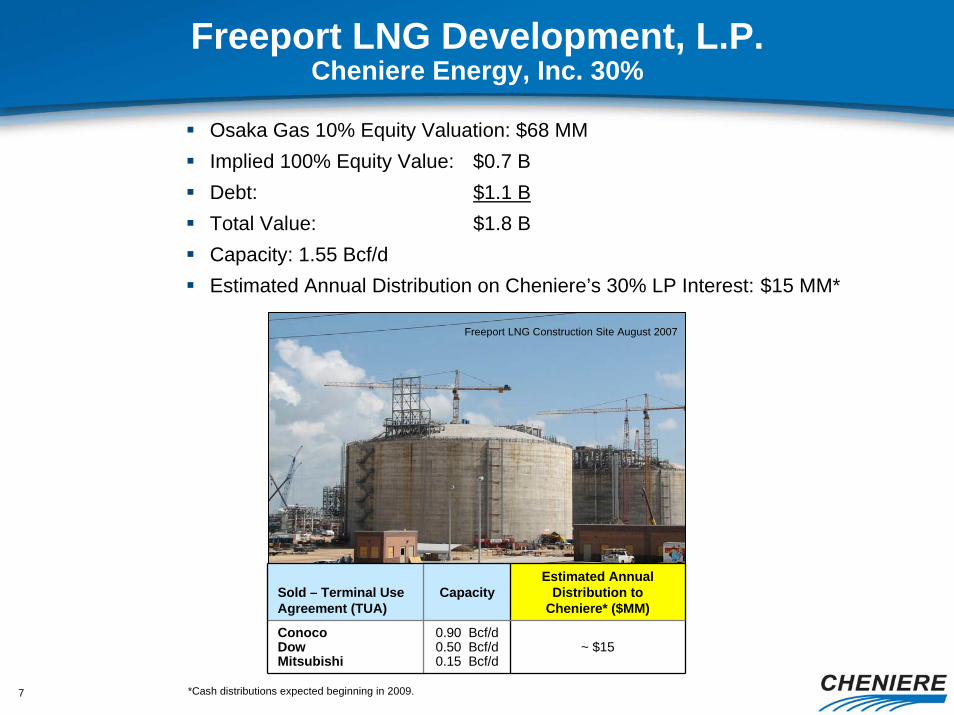
Freeport LNG Development, L.P.Cheniere Energy, Inc. 30%
Osaka Gas 10% Equity Valuation: $68 MMImplied 100% Equity Value: $0.7 BDebt: $1.1 BTotal Value: $1.8 BCapacity: 1.55 Bcf/dEstimated Annual Distribution on Cheniere’s 30% LP Interest: $15 MM*
Freeport LNG Construction Site August 2007
Sold – Terminal Use Agreement (TUA)
CapacityEstimated Annual
Distribution to Cheniere* ($MM)
ConocoDowMitsubishi
0.90 Bcf/d0.50 Bcf/d0.15 Bcf/d
~ $15
*Cash distributions expected beginning in 2009.
8
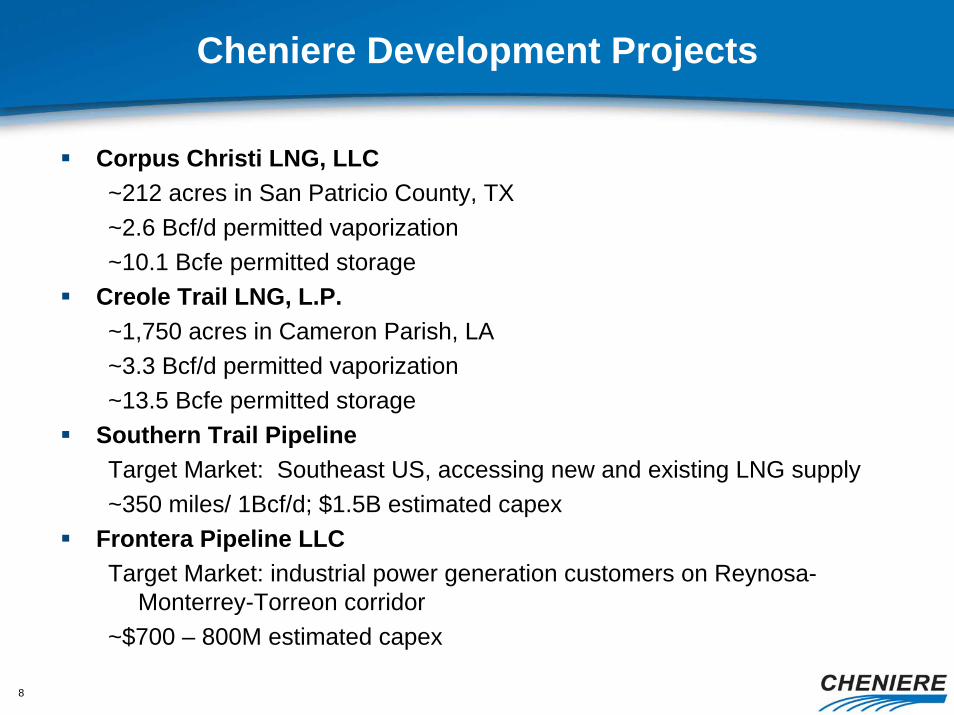
Cheniere Development Projects
Corpus Christi LNG, LLC~212 acres in San Patricio County, TX~2.6 Bcf/d permitted vaporization~10.1 Bcfe permitted storage
Creole Trail LNG, L.P.~1,750 acres in Cameron Parish, LA~3.3 Bcf/d permitted vaporization~13.5 Bcfe permitted storage
Southern Trail PipelineTarget Market: Southeast US, accessing new and existing LNG supply~350 miles/ 1Bcf/d; $1.5B estimated capex
Frontera Pipeline LLCTarget Market: industrial power generation customers on Reynosa-
Monterrey-Torreon corridor~$700 – 800M estimated capex
9
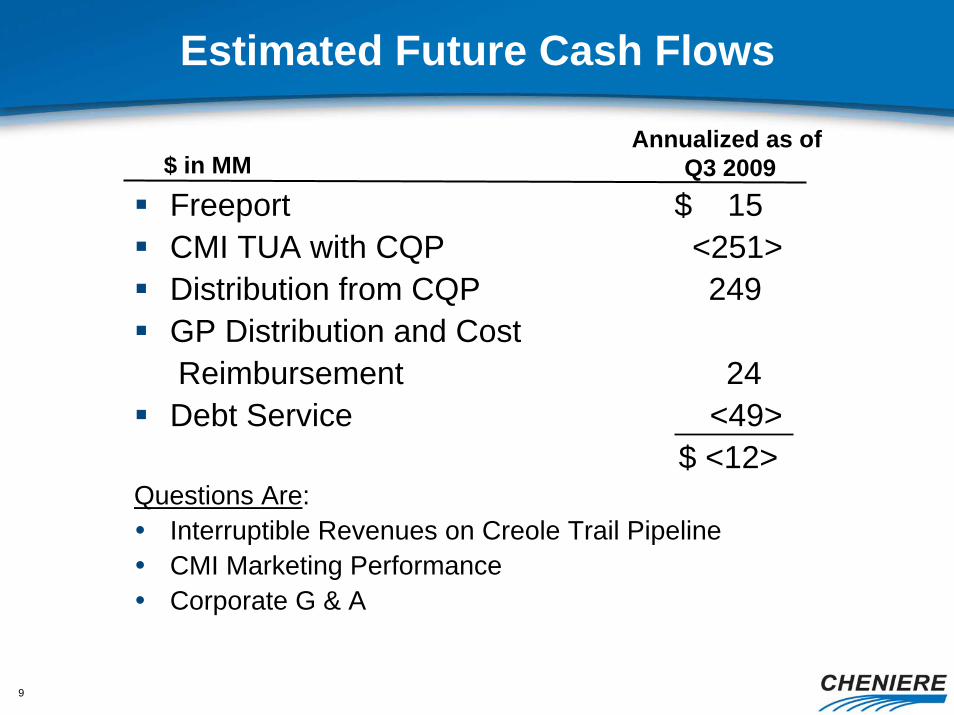
Estimated Future Cash Flows
Freeport $ 15CMI TUA with CQP <251>Distribution from CQP 249GP Distribution and CostReimbursement 24Debt Service <49>
$ <12>Questions Are:
Interruptible Revenues on Creole Trail PipelineCMI Marketing PerformanceCorporate G & A
Annualized as of Q3 2009$ in MM
10
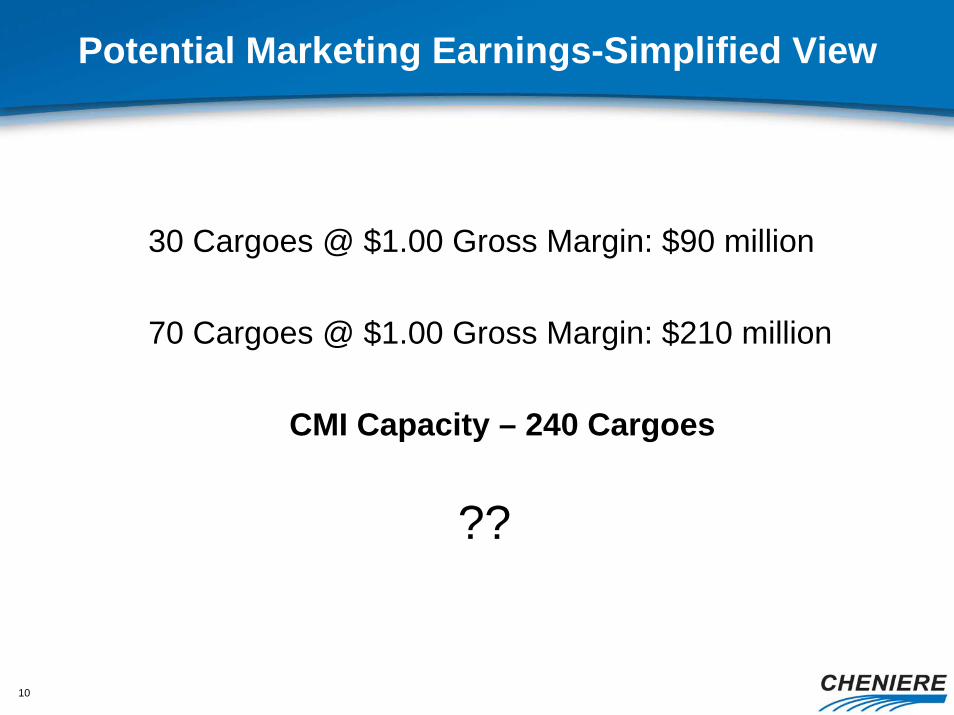
Potential Marketing Earnings-Simplified View
30 Cargoes @ $1.00 Gross Margin: $90 million
70 Cargoes @ $1.00 Gross Margin: $210 million
CMI Capacity – 240 Cargoes
??
11
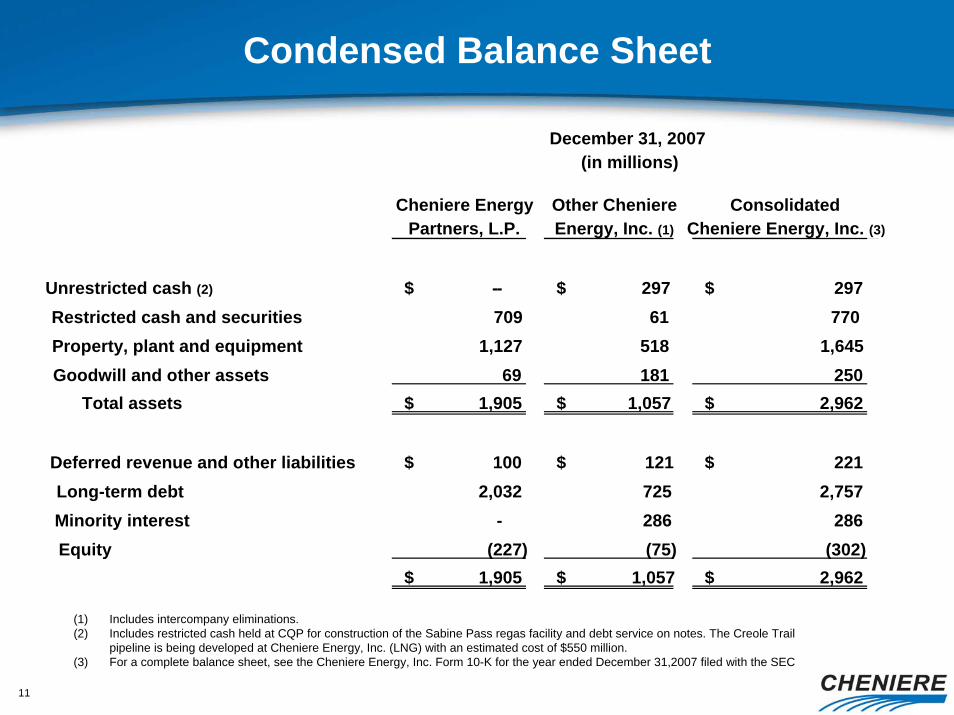
Condensed Balance Sheet
Cheniere EnergyPartners, L.P.
Other CheniereEnergy, Inc. (1)
ConsolidatedCheniere Energy, Inc. (3)
Unrestricted cash (2) --$ 297$ 297$ Restricted cash and securities 709 61 770Property, plant and equipment 1,127 518 1,645Goodwill and other assets
Total assets69
1,905$ 181
1,057$ 250
2,962$
Deferred revenue and other liabilities 100$ 121$ 221$ Long-term debt 2,032 725 2,757Minority interest - 286 286Equity (227)
1,905$ (75)
1,057$ (302)
2,962$
(1) Includes intercompany eliminations.(2) Includes restricted cash held at CQP for construction of the Sabine Pass regas facility and debt service on notes. The Creole Trail
pipeline is being developed at Cheniere Energy, Inc. (LNG) with an estimated cost of $550 million.(3) For a complete balance sheet, see the Cheniere Energy, Inc. Form 10-K for the year ended December 31,2007 filed with the SEC
December 31, 2007(in millions)
12
0
5
10
15
20
25
30
35
40
45
08Q1 08Q2 08Q3 08Q4 09Q1 09Q2 09Q3 09Q4 10Q1 10Q2 10Q3 10Q4 11Q1 11Q2 11Q3 11Q4 12Q1 12Q2 12Q3 12Q4
2008 2009 2010 2011 2012
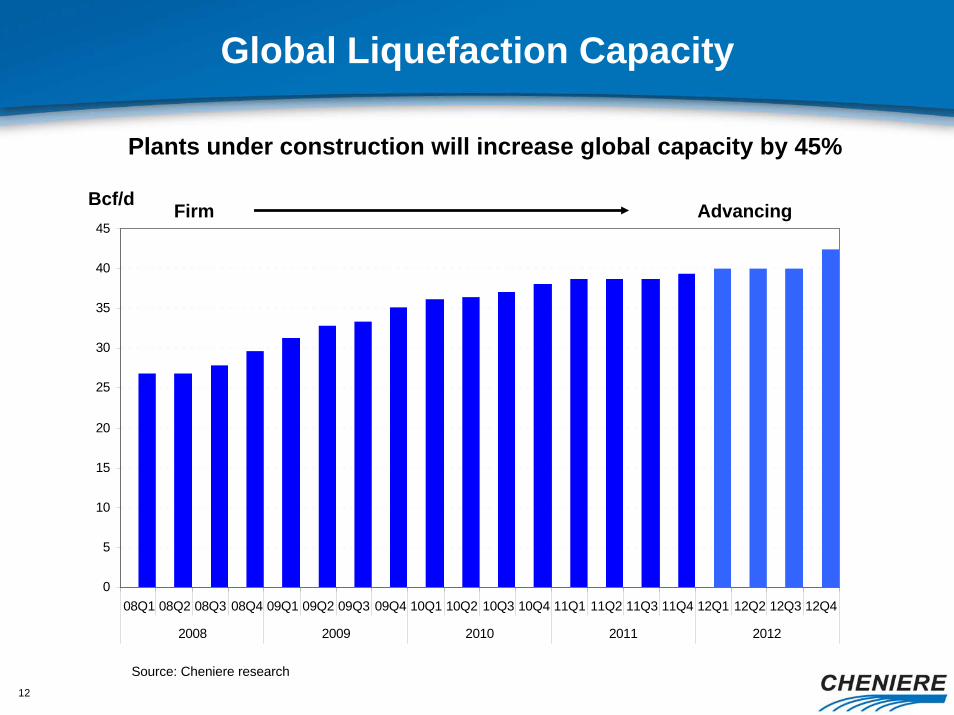
Global Liquefaction Capacity
Bcf/d AdvancingFirm
Source: Cheniere research
Plants under construction will increase global capacity by 45%
13
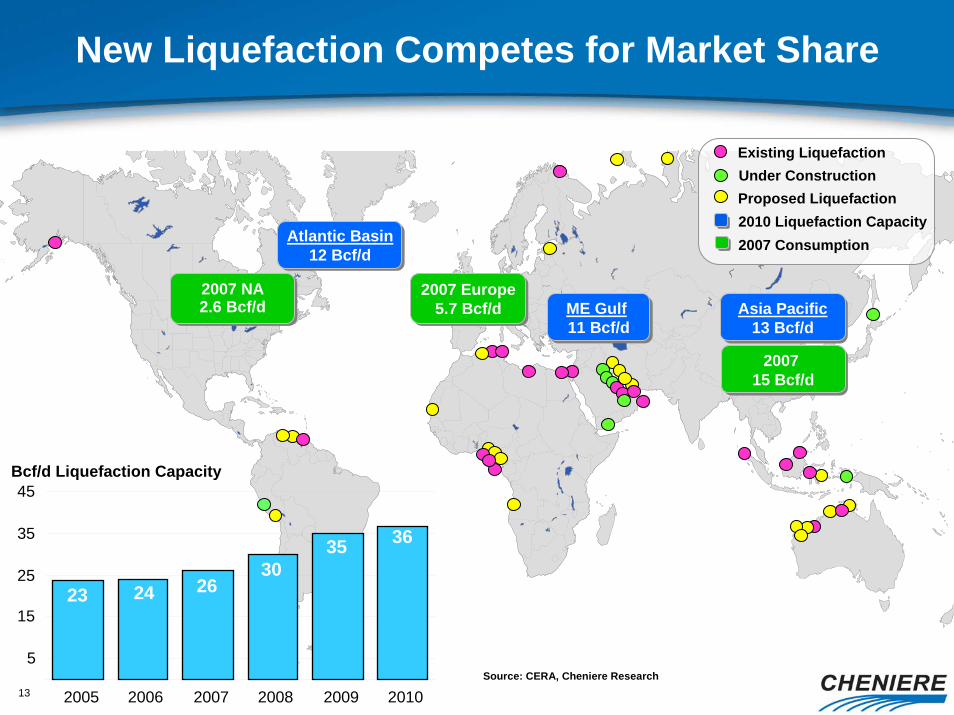
New Liquefaction Competes for Market Share
Atlantic Basin12 Bcf/d
Atlantic Basin12 Bcf/d
ME Gulf11 Bcf/dME Gulf11 Bcf/d
Asia Pacific13 Bcf/d
Asia Pacific13 Bcf/d
2007 Europe5.7 Bcf/d
2007 Europe5.7 Bcf/d
2007 15 Bcf/d2007
15 Bcf/d
2007 NA2.6 Bcf/d2007 NA2.6 Bcf/d
2010 Liquefaction Capacity2007 Consumption
5
15
25
35
45
2005 2006 2007 2008 2009 2010
36
23 24 2630
35
Bcf/d Liquefaction Capacity
Existing LiquefactionUnder ConstructionProposed Liquefaction
Source: CERA, Cheniere Research
14
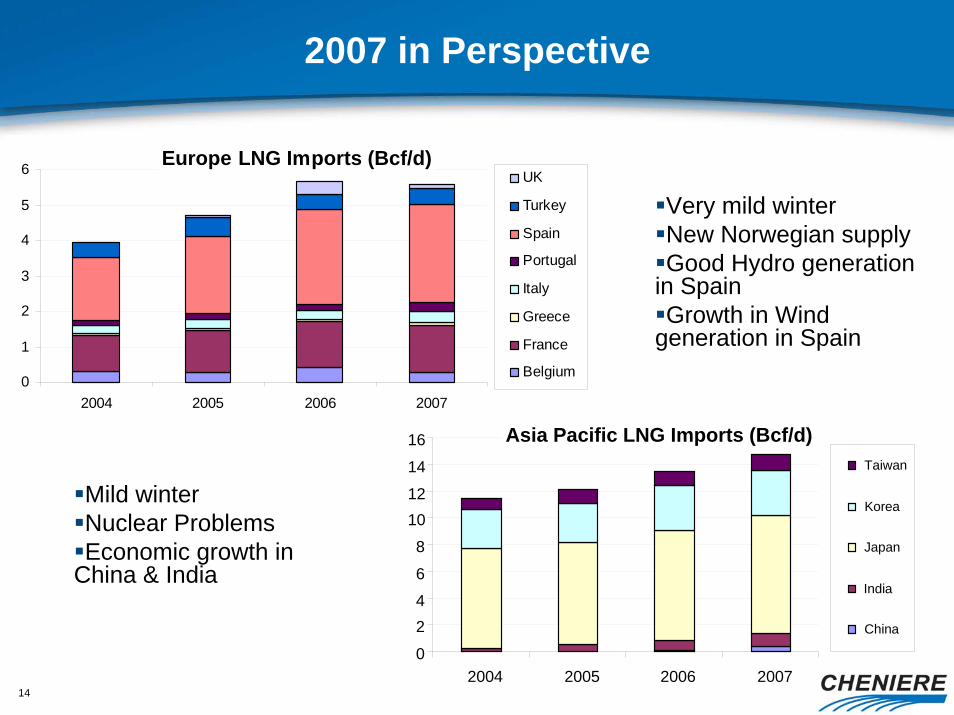
2007 in Perspective
Europe LNG Imports (Bcf/d)
0
1
2
3
4
5
6
2004 2005 2006 2007
UK
Turkey
Spain
Portugal
Italy
Greece
France
Belgium
Very mild winterNew Norwegian supply Good Hydro generation
in SpainGrowth in Wind
generation in Spain
Mild winterNuclear Problems Economic growth in
China & India
Asia Pacific LNG Imports (Bcf/d)
0
24
6
8
1012
14
16
2004 2005 2006 2007
Taiwan
Korea
Japan
India
China
15
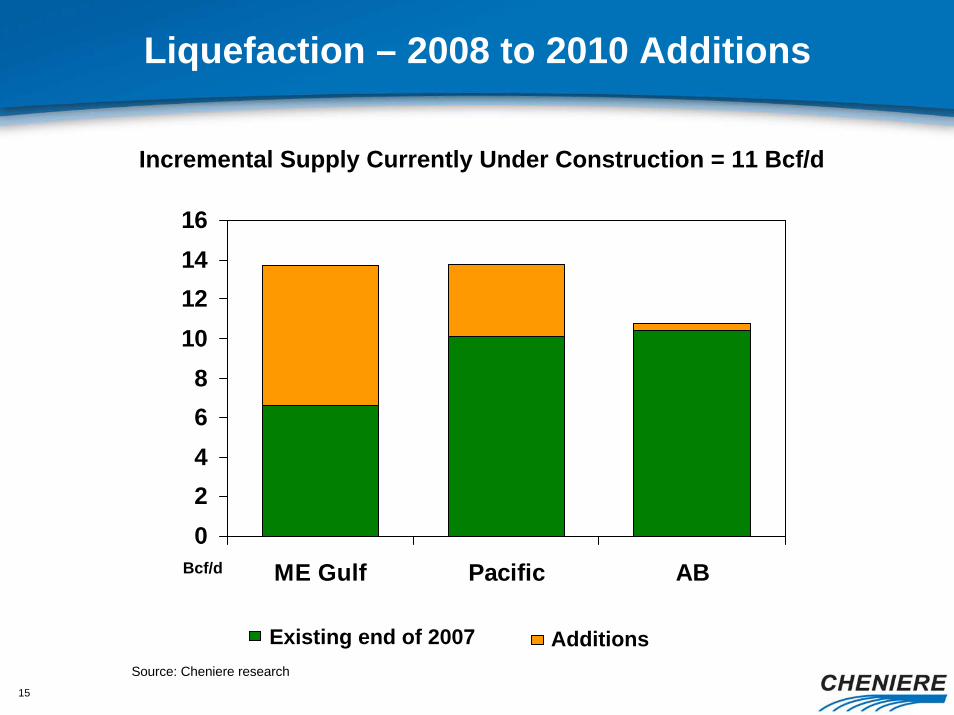
Liquefaction – 2008 to 2010 Additions
5.1
3.9
Incremental Supply Currently Under Construction = 11 Bcf/d
02468
10121416
ME Gulf Pacific AB
Existing end of 2007 Additions
Bcf/d
Source: Cheniere research
16
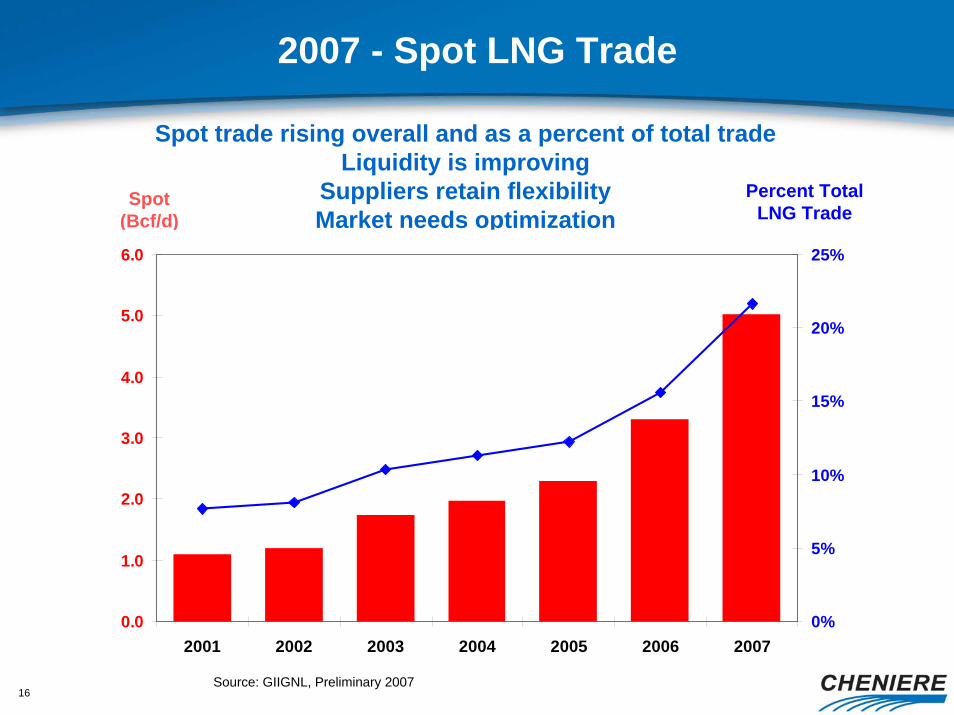
2007 - Spot LNG Trade
Percent Total LNG Trade
Spot(Bcf/d)
Spot trade rising overall and as a percent of total tradeLiquidity is improving
Suppliers retain flexibilityMarket needs optimization
0.0
1.0
2.0
3.0
4.0
5.0
6.0
2001 2002 2003 2004 2005 2006 20070%
5%
10%
15%
20%
25%
Source: GIIGNL, Preliminary 2007
17
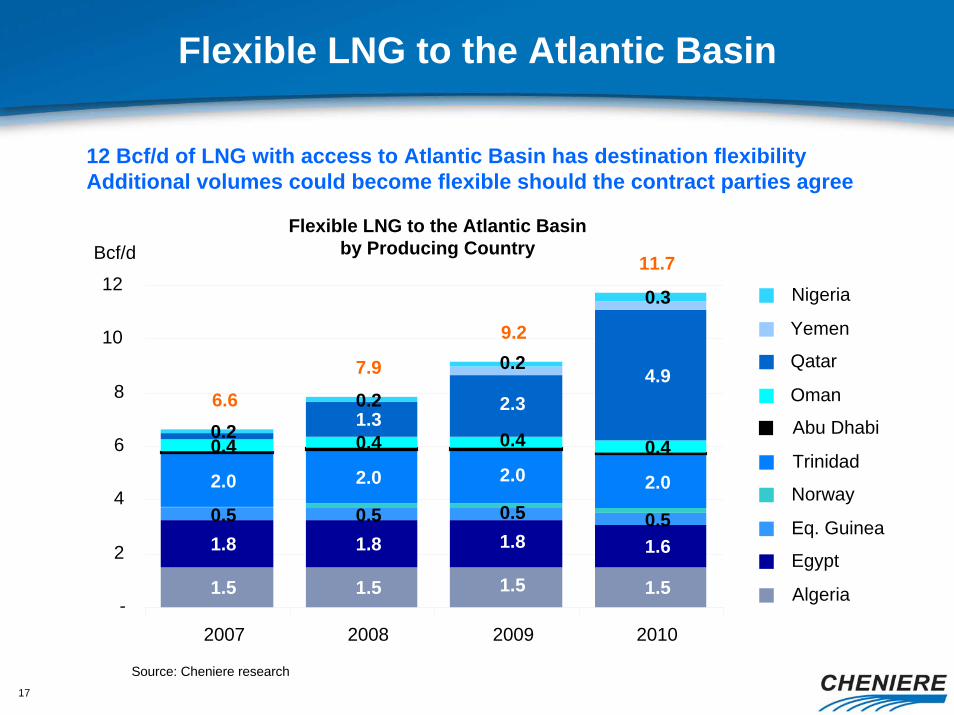
1.5 1.5 1.5 1.5
1.8 1.8 1.8 1.60.5 0.5 0.5 0.5
2.0 2.0 2.0 2.0
0.4 0.4 0.4 0.41.3
2.34.9
0.20.2
0.2
0.3
9.2
7.9
6.6
11.7
-
2
4
6
8
10
12
2007 2008 2009 2010
Bcf/d
Nigeria
Yemen
Qatar
Oman
Abu Dhabi
Trinidad
Norway
Eq. Guinea
Egypt
Algeria
Flexible LNG to the Atlantic Basin
Flexible LNG to the Atlantic Basin by Producing Country
12 Bcf/d of LNG with access to Atlantic Basin has destination flexibilityAdditional volumes could become flexible should the contract parties agree
Source: Cheniere research
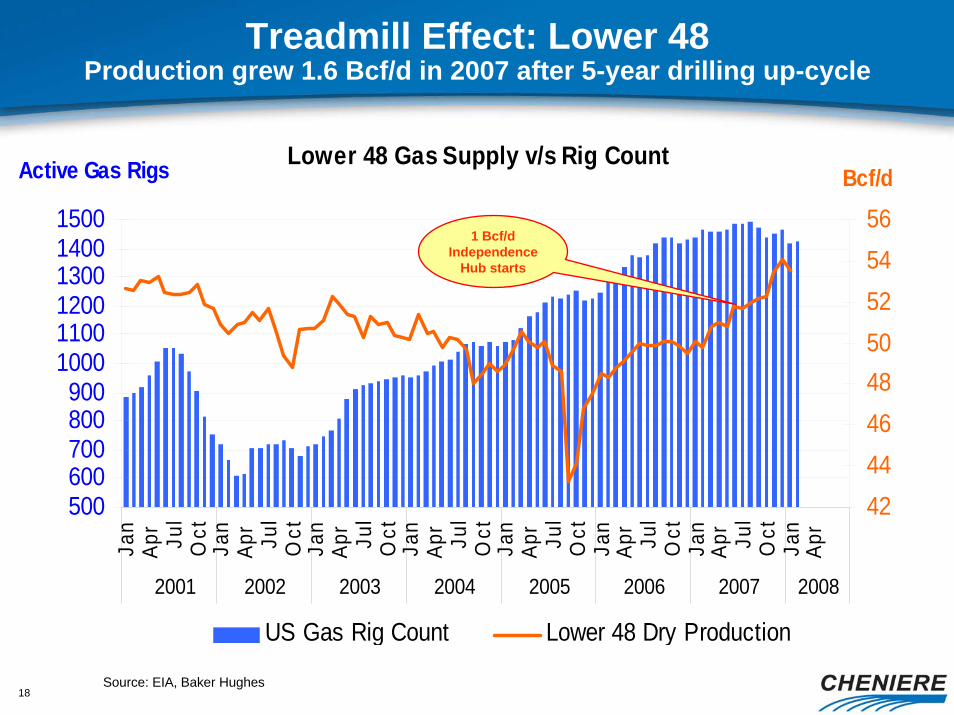
18Source: EIA, Baker Hughes
Treadmill Effect: Lower 48 Production grew 1.6 Bcf/d in 2007 after 5-year drilling up-cycle
Lower 48 Gas Supply v/s Rig Count
500600700800900
100011001200130014001500
Jan
Apr
Jul
Oct
Jan
Apr
Jul
Oct
Jan
Apr
Jul
Oct
Jan
Apr
Jul
Oct
Jan
Apr
Jul
Oct
Jan
Apr
Jul
Oct
Jan
Apr
Jul
Oct
Jan
Apr
2001 2002 2003 2004 2005 2006 2007 2008
Active Gas Rigs
4244464850525456
Bcf/d
US Gas Rig Count Lower 48 Dry Production
1 Bcf/d Independence
Hub starts
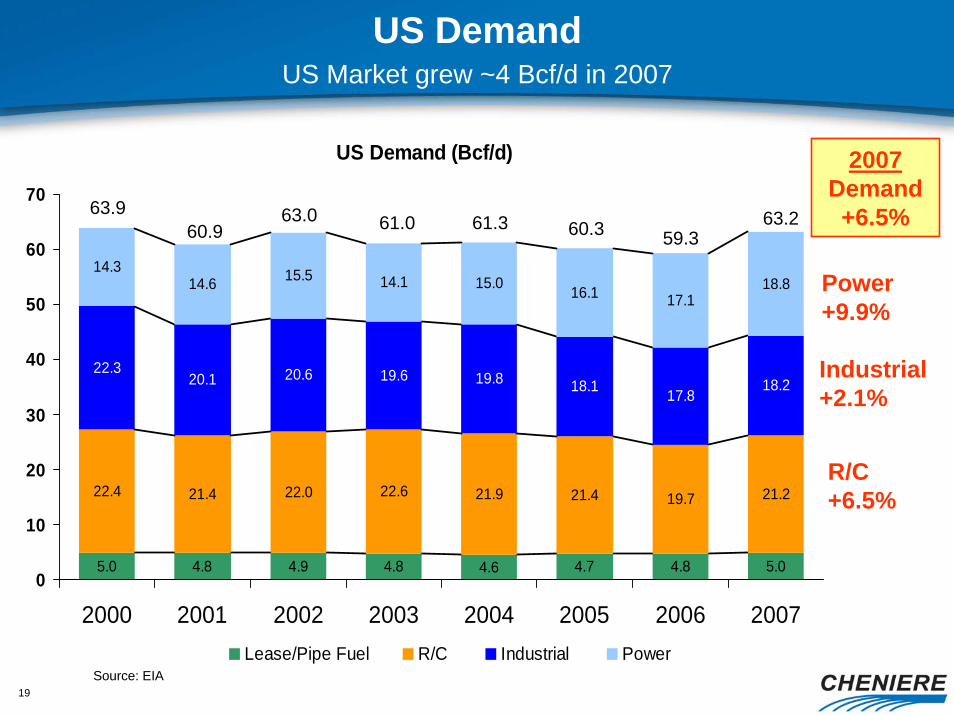
19
US DemandUS Market grew ~4 Bcf/d in 2007
US Demand (Bcf/d)
5.0 4.8 4.9 4.8 4.6 4.7 4.8 5.0
22.4 21.4 22.0 22.6 21.9 21.4 19.7 21.2
22.320.1 20.6 19.6 19.8 18.1 17.8
18.2
14.314.6 15.5 14.1 15.0 16.1 17.1
18.8
0
10
20
30
40
50
60
70
2000 2001 2002 2003 2004 2005 2006 2007Lease/Pipe Fuel R/C Industrial Power
63.259.3
61.3 60.361.060.963.063.9
R/C +6.5%
Industrial +2.1%
Power+9.9%
2007 Demand +6.5%
Source: EIA
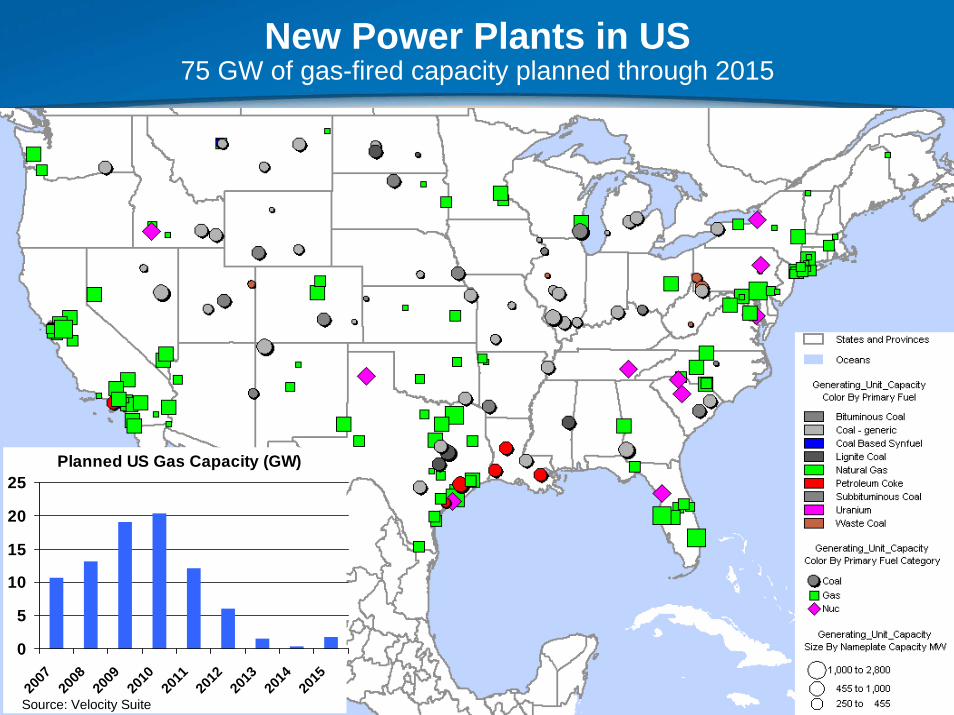
20
New Power Plants in US 75 GW of gas-fired capacity planned through 2015
Planned US Gas Capacity (GW)
0
5
10
15
20
25
2007
2008
2009
2010
2011
2012
2013
2014
2015
Source: Velocity Suite
21
Conclusion
Limitation on world-wide markets ability to absorb additional volumes, especially on a seasonal basis will validate value of spare capacity.
Supply/Demand picture in the U.S. will exacerbate the issue and will lead U.S. to respond with price signals to meet power generation demand.